Article

Genome-Wide Association Analysis-Based Mining of Quality Genes Related to Linoleic and Linolenic Acids in Soybean

1
The Center of Plant Biotechnology, Jilin Agricultural University, Changchun 130118, China
2
College of Life Sciences, Jilin Agricultural University, Changchun 130118, China
*
Author to whom correspondence should be addressed.
These authors contributed equally to this work.
Agriculture 2023, 13(12), 2250; https://doi.org/10.3390/agriculture13122250
Submission received: 26 October 2023 / Revised: 1 December 2023 / Accepted: 2 December 2023 / Published: 7 December 2023
(This article belongs to the Special Issue Advances in Soybean Genetics and Breeding)

Abstract

:
Soybean fat contains five principal fatty acids, and its fatty acid composition and nutritional value depend on the type of soybean oil, storage duration, and conditions. Among the fat contents, polyunsaturated fatty acids, such as linoleic acid and linolenic acid, play an essential role in maintaining human life activities; thus, increasing the proportions of the linoleic acid and linolenic acid contents can help improve the nutritional value of soybean oil. Our laboratory completed SLAF-seq whole genome sequencing of the natural population (292 soybean varieties) in the previous growth period. In this study, genome-wide association analysis (GWAS) was performed based on the natural population genotypic data and three-year phenotypic data of soybean linoleic acid and linolenic acid contents, and a significant single nucleotide polymorphisms (SNPs) locus (Gm13_10009679) associated with soybean oleic acid content was repeatedly detected over a span of 3 years using the GLM model and MLM model. Additionally, another significant SNP locus (Gm19_41366844) correlated with soybean linolenic acid was identified through the same models. Genes within the 100 Kb interval upstream and downstream of the SNP loci were scanned and analyzed for their functional annotation and enrichment, and one gene related to soybean linoleic acid synthesis (Glyma.13G035600) and one gene related to linolenic acid synthesis (Glyma.19G147400) were screened. The expressions of the candidate genes were verified using qRT-PCR, and based on the verification results, it was hypothesized that Glyma.13G035600 and Glyma.19G147400 positively regulate linoleic acid and linolenic acid synthesis and accumulation, respectively. The above study lays the foundation for further validating gene functions, and analyzing the regulatory mechanisms of linoleic acid and linolenic acid synthesis and accumulation in soybean.

1. Introduction

Soybean, a key oil crop globally, contributes its oil to approximately a third of the total volume of edible oils consumed worldwide. [1]. Soybean is rich in various nutrients such as fat, protein, isoflavones, etc. The composition and ratio of fatty acids, vital elements of fats, are key factors that define the quality and uses of soybean oil [2].
The fatty acid profile of soybean oil primarily consists of five key components: palmitic acid (C16:0), stearic acid (C18:0), oleic acid (C18:1), linoleic acid (C18:2), and linolenic acid (C18:3) [3]. Among them, palmitic acid and stearic acid are saturated fatty acids that do not contain unsaturated double bonds; their overconsumption is likely to lead to high cholesterol, inducing atherosclerosis and other diseases, which are not conducive to human health [4,5,6]. Oleic acid, linoleic acid, and linolenic acid, categorized as unsaturated fatty acids, include linoleic and linolenic acids as polyunsaturated types. These contain 2 to 3 unsaturated double bonds, are readily absorbed, and are essential fatty acids [7]. Linoleic acid and linolenic acid can promote human growth and development, reduce the incidence of cardiovascular and cerebrovascular diseases, improve the human body’s anti-aging ability, prevent atherosclerosis, inhibit cancer, etc.; they have an irreplaceable role [8,9,10,11]. With the improvement in living standards, people are increasingly pursuing health, and attaching importance to the intake of essential fatty acids [12]. In the past, most people obtained a substantial amount of essential fatty acids from animal oils [13]. However, animal oils are high in saturated fatty acids, and excessive consumption of them is detrimental to human health [14]. In comparison, soybean oil, as a primary plant-based cooking oil, has lower levels of saturated fatty acids [15]. Therefore, it is beneficial to increase the amount of essential fatty acids, such as linoleic acid and alpha-linolenic acid, in soybeans to produce soybean oil with a high nutritional value, ultimately leading to a positive impact on human health.
The contents of linoleic acid and linolenic acid in soybean as quantitative traits are mainly regulated by primary effect genes and micro-effect polygenes, and are also affected by the environment [16]; thus, it is essential to explore the genes that regulate soybean linoleic acid and linolenic acid [17]. At present, GWAS is considered a valuable approach for examining quantitative traits and exploring genes that are associated with them [18]. GWAS is based on intergene or interlocking linkage imbalances within chromosomes, using the polymorphism of millions of SNP genetic markers in the genome and the diversity of target traits. GWAS is used to identify marker sites that are closely related to target traits, or genes with specific functions within a population [19]. Compared to alternative localization methods, GWAS offers several advantages: it utilizes a diverse array of genetic markers, simplifies the construction of populations, reduces time and costs, yields abundant and precise detection outcomes, and accurately identifies loci related to target traits, thereby facilitating its extensive application in various research contexts [20]. In recent years, many studies have been conducted on the association analysis of quantitative traits in soybeans using GWAS. Ajmal et al. [21] measured the root-related traits of 260 spring soybeans, using five GWAS models (GLM, MLM, CMLM, FaST-LMM, and EMMAX) to conduct genome-wide association analysis, and identified 27 phenotypes with a contribution rate of 20–72% of the essential SNPs that are distributed on chromosomes 2, 6, 8, 9, 13, 16, and 18, 2 of which are associated with multiple root traits. In order to study the genetic structure of the soybean growth period, in their research, Liu et al. [22] performed sequencing on 278 soybean varieties and discovered 34,710 SNPs, along with key characteristics related to the growth period, using GWAS. Their findings revealed 37 traits significantly linked with SNP loci, which are influential in soybean development under various environmental conditions. Additionally, the study highlighted five notable genes: Glyma.05G101800, Glyma.11G140100, Glyma.11G142900, Glyma.19G099700, and Glyma.19G100900. These genes are linked to the synthesis of proteins like FRI (FRIGIDA), PUB13 (Plant U-box 13), MYB59, CONSTANS, and FUS3. These proteins are thought to be vital in controlling the growth phase of soybeans. Wu et al. [23] analyzed genotypic data from 200 soybean varieties and 150 recombinant inbred lines (RILs) to identify genetic loci linked to isoflavone levels in soybean seeds. Eighty-seven SNPs significantly associated with isoflavones were identified by GWAS. Thirty-seven quantitative trait loci (QTL) associated with isoflavone content were identified in the RIL population through genetic linkage mapping. The GmMPK1 gene encoding mitogen-activated protein kinase was co-localized and significantly associated with isoflavone content via GWAS and genetic linkage mapping. Additional experiments demonstrated that when GmMPK1 was overexpressed in soybeans, there was a noticeable rise in the concentration of isoflavones and a boost in the plant’s ability to withstand root rot. These findings indicate that GmMPK1 may play a role in enhancing soybean resistance to biological stresses by influencing the levels of isoflavones present in the plant. GWAS has been widely utilized in gene localization of quality traits such as soybean protein, fat, fatty acid, etc. To study the genetic mechanism of oleic acid in soybean seeds, Liu et al. [24] collected 260 soybean germplasms as a natural population from northeastern China, and the GWAS analysis revealed that a gene on chromosome 4 detected in 2018 and 2019 (Glyma.04G102900) and a gene on chromosome 11 (Glyma.11G229600) were involved in oleic acid synthesis. Zhao et al. [25] developed a natural population study involving 185 distinct soybean germplasms to characterize quantitative trait nucleotides (QTNs). They utilized GWAS to scan for candidate genes, leading to the identification of 49 genes potentially involved in lipid biosynthesis pathways or hormone metabolism. These genes are considered potential candidates for research on genes related to saturated fatty acids. The above research progress indicates that the combination of SLAF-seq [26] technology and genome-wide association analysis can not only overcome the limitations of traditional GWAS in gene localization accuracy, but also reduce the generation of false-positive results; this approach can lead to the rapid discovery of reliable, functional genes [27].
In this study, based on GWAS, we mined candidate genes closely related to linoleic acid and linolenic acid synthesis and metabolism, and carried out preliminary validation of the key candidate genes obtained from the mining. Our research offers dependable genetic resources for investigating the genetic mechanisms behind soybean linoleic and linolenic acid, and for regulating the levels of these acids in soybeans.

2. Materials and Methods

2.1. Experimental Materials and Cultivation Management

This study’s natural population was derived from 292 soybean germplasm resources, supplied by the Biotechnology Center of Jilin Agricultural University (Table S1). The specimens were cultivated at the experimental facility of Jilin Agricultural University (located at 43°88′ N, 125°35′ E), with plantings occurring in May for the years 2019, 2020, and 2021. The experimental site has a temperate semi-humid continental monsoon climate with an annual average precipitation of 500–600 mm, an annual average temperature of 5.8 °C, and a frost–free period of 130–140 days. The soil type is classified as a meadow soil with a parent material of loess. Four protective rows were established around the experimental site. The experiment was conducted using a completely randomized block design with three replications, and the fertility gradient was vertical within the experimental site. Within each replication, the 292 materials were randomly arranged. Within each replicate, we planted two rows (0.65 m wide by 2.0 m long) of each material, with a plant spacing of 0.08 m. Ten plants were randomly selected and the seeds were used for determining of their linoleic acid and linolenic acid contents. The soybeans were harvested once a year at maturity, excluding the ends to completely eliminate edge effects.

2.2. Trait Identification and Statistical Analysis

The content of linoleic acid and linolenic acid in soybean seeds was determined using an NIRS DS2500 near-infrared analysis instrument (Denmark Founded FOSS LTD, Hillerød, Denmark). All soybean linoleic acid and linolenic acid content measurements were conducted in triplicate within each replication, and the average value was calculated as the phenotype data for this trait. Using the psych package in R 3.1.4 software (available at https://www.r-project.org/, accessed on 12 November 2021), descriptive statistical analyses were performed on the concentrations of linoleic acid and linolenic acid in soybean seeds across the years 2019, 2020, and 2021. The statistics included the mean and standard deviation. Subsequently, the ggstatsplot [28] package and the nortest (https://cran.r-project.org/web/packages/nortest/index.html, accessed on 12 August 2023) package were employed to conduct correlation analysis and normality tests for linoleic acid and linolenic acid. Furthermore, variance analysis, significance tests, and the calculation of generalized heritability [29] were performed using the lme4 [30] package.
h 2 = σ G 2 / ( σ G 2 + σ GE 2 / n + σ e 2 / nr )
The generalized heritability (h2) was estimated as follows:
h 2 = σ G 2 / ( σ G 2 + σ e 2 )

2.3. SNP Genotyping

V2 stage (first compound leaf above simple leaf fully grown; two trifolioles expanded) leaves of the soybean natural population were collected and sent to Beijing Baimaike Company for SLAF-seq to obtain SNP genotypic data of the natural population. PLINK V3.0 [31] software was used to conduct SNP genotype quality control in 292 natural populations. The criteria for selecting the SNP markers were the secondary allele frequency (MAF > 0.05) and site integrity (INT > 0.5).

2.4. Genome-Wide Association Analysis

The generalized linear model (GLM_Q) model and mixed linear model (MLM_Q+K) model in GEMMA-0.98.1 [32] software were used for the genome-wide association analysis. The Q matrix was the population structure matrix, and the K matrix was the kinship coefficient matrix. The threshold p < 1.0 × 10⁻³ (−log10p < 3.0) was used to count significant SNPs associated with the linoleic acid and linolenic acid content. After obtaining the association analysis results, the qqman [33] software package in R language software was used to draw a Manhattan map and a quantile–quantile scatter plot to represent the association analysis results. The Manhattan plot depicts the outcomes of the association analysis, illustrating the statistically analyzed distribution of genomic loci significantly linked to the content of linoleic acid and linolenic acid. The quantile–quantile scatter plots represent the effect of association analysis based on the GLM_Q and MLM_Q+K models. In the early stage, if the difference between the p-value and the expected value is smaller, it indicates that the selected correlation analysis model is reasonable, and can effectively reduce the false positive results of the correlation analysis. In the later stage, if the difference between the p-value and the expected value is larger, it indicates that the effect value of the associated sites exceeds the random effect value, indicating that these sites are significantly associated with the studied traits.

2.5. Screening and Annotation of Candidate Genes

The candidate genes were scanned within the 100 Kb [34,35,36] region, upstream and downstream of the significant SNP sites obtained by repeated mapping detection for three consecutive years, and the COGs (http://clovr.org/docs/clusters-of-orthologous-groups-cogs/, accessed on 25 August 2023) were compared; GO (http://geneontology.org/, accessed on 25 August 2023); KEGG (https://www.genome.jp/kegg/, accessed on 25 August 2023); Swissprot (http://www.uniprot.org/, accessed on 25 August 2023); Pfam (https://www.ebi.ac.uk/interpro/, accessed on 25 August 2023); eggNOG (http://eggnog5.embl.de/#/app/home, accessed on 25 August 2023) with six databases to functionally annotate the obtained candidate genes, and g:Profiler (https://biit.cs.ut.ee/gprofiler/gost, accessed on 27 August 2023) was used for enrichment analysis, with the g:SCS threshold statistical test; the significance threshold was set to 0.05; screening and prediction may be related to soybean linoleic acid and linolenic acid content candidate genes.

2.6. Preliminary Identification of Candidate Genes

In this study, we employed qRT-PCR technology to measure the expression levels of genes related to linoleic acid and linolenic acid in soybean pods and seeds. The sampling was carried out at two distinct growth stages: R6 (soybean drum stage) and R7 (soybean mature stage). In our study, we chose five distinct samples, each representing different levels of linoleic and linolenic acid concentrations, as outlined in Table S2. These samples comprised both high and low linoleic and linolenic acid content variants. RNA was extracted from samples at the R6 (soybean drum stage) and R7 (soybean maturation stage) using RNAiso Plus (Takara Bio, Kyoto, Japan), and subsequently, this RNA was transformed into cDNA with the All-in-One™ First Strand cDNA synthesis kit (GeneCopoeia Inc., Rockville, MD, USA). The qRT-PCR involved primers from qRT-PCR IDT-DNA (https://sg.idtdna.com/pages, accessed on 29 August 2023), as detailed in Table S3, and was performed on an Agilent Stratagene Mx3000P (Palo Alto, CA, USA). Expression levels were quantified using the 2−ΔΔCt method [37] and visualized through histograms in Graphpad Prism 9.5.0 (https://www.graphpad-prism.cn/, accessed on 13 December 2022). Data on candidate gene expression were obtained from the PPRD (Plant Public RNA-seq Database; http://ipf.sustech.edu.cn/pub/plantrna/, accessed on 29 August 2023) [38]. Analysis of cis-acting elements in the promoter regions of key candidate genes was conducted following Karikari et al.’s [39] method. The CDD (Conserved Domains Database) [40] aided in analyzing the genes’ conserved domains, and TBtools [41] was employed for visualization of these elements and domains.

3. Results

3.1. Analysis of Phenotypic Data of Soybean Linoleic Acid and Linolenic Acid Content

Excel 2016 was used to organize the data on linoleic and linolenic acid content (Table S4). The results of 3 years of phenotypic data analysis showed that the linoleic acid and linolenic acid contents in the population were normally distributed, with the horizontal axis representing the relevant content and the vertical axis representing the frequency. The overall trend shows a typical bell-shaped trend, with the content of most varieties concentrated around the mean, while the number of varieties with higher or lower content gradually decreases, indicating that the phenotypic data can be used for subsequent correlation analysis and that there is a strong association between the two traits. Displayed in Figure 1, there is a notable positive correlation observed (p < 0.01). The ANOVA results revealed considerable variation in the two traits across the three-year cultivation period, demonstrating significant population diversity and notable differences (p < 0.001). The generalized heritability (H2) values, which were notably high as indicated in Table 1, imply a significant genetic influence on the levels of both linoleic acid and linolenic acid.

3.2. Genotyping

In this research, we sequenced the entire genome of 292 soybean genotypes utilizing the SLAF-seq method. The Glycine_max: Wm82.a4.v1 [42] genome served as the reference for predicting electronic digestion. The enzymes RsaI and HaeIII were selected for the digestion process. Analysis of the results revealed that a total of 1485.09 Mb of reads were generated, exhibiting an average Q30 score of 93.88% and an average GC content of 39.96%. Through the bioinformatics analysis, a total of 473,597 SLAF tags were obtained, of which 164,737 were polymorphic SLAF tags and 641,542 were population SNPs loci.

3.3. Genome-Wide Association Study of Linoleic Acid and Linolenic Acid Contents in Soybean Seeds

Utilizing 641,542 high-quality SNPs, the phenotypic data of soybean linoleic and linolenic acids over a span of three years were analyzed through genome-wide association using the GLM and MLM model methods in GEMMA-0.98.1 software. When the significance level was set to −log10p ≥ 3, 504 SNPs were significantly associated with soy linoleic acid and linolenic acid, including 476 SNPs on chromosomes and 28 SNPs on scaffolds. Among the loci located on chromosomes, the number of loci on chromosome 19 is the largest (55), and the number of loci on chromosome 5 is the smallest (5), basically covering 20 chromosomes (Figure S1).
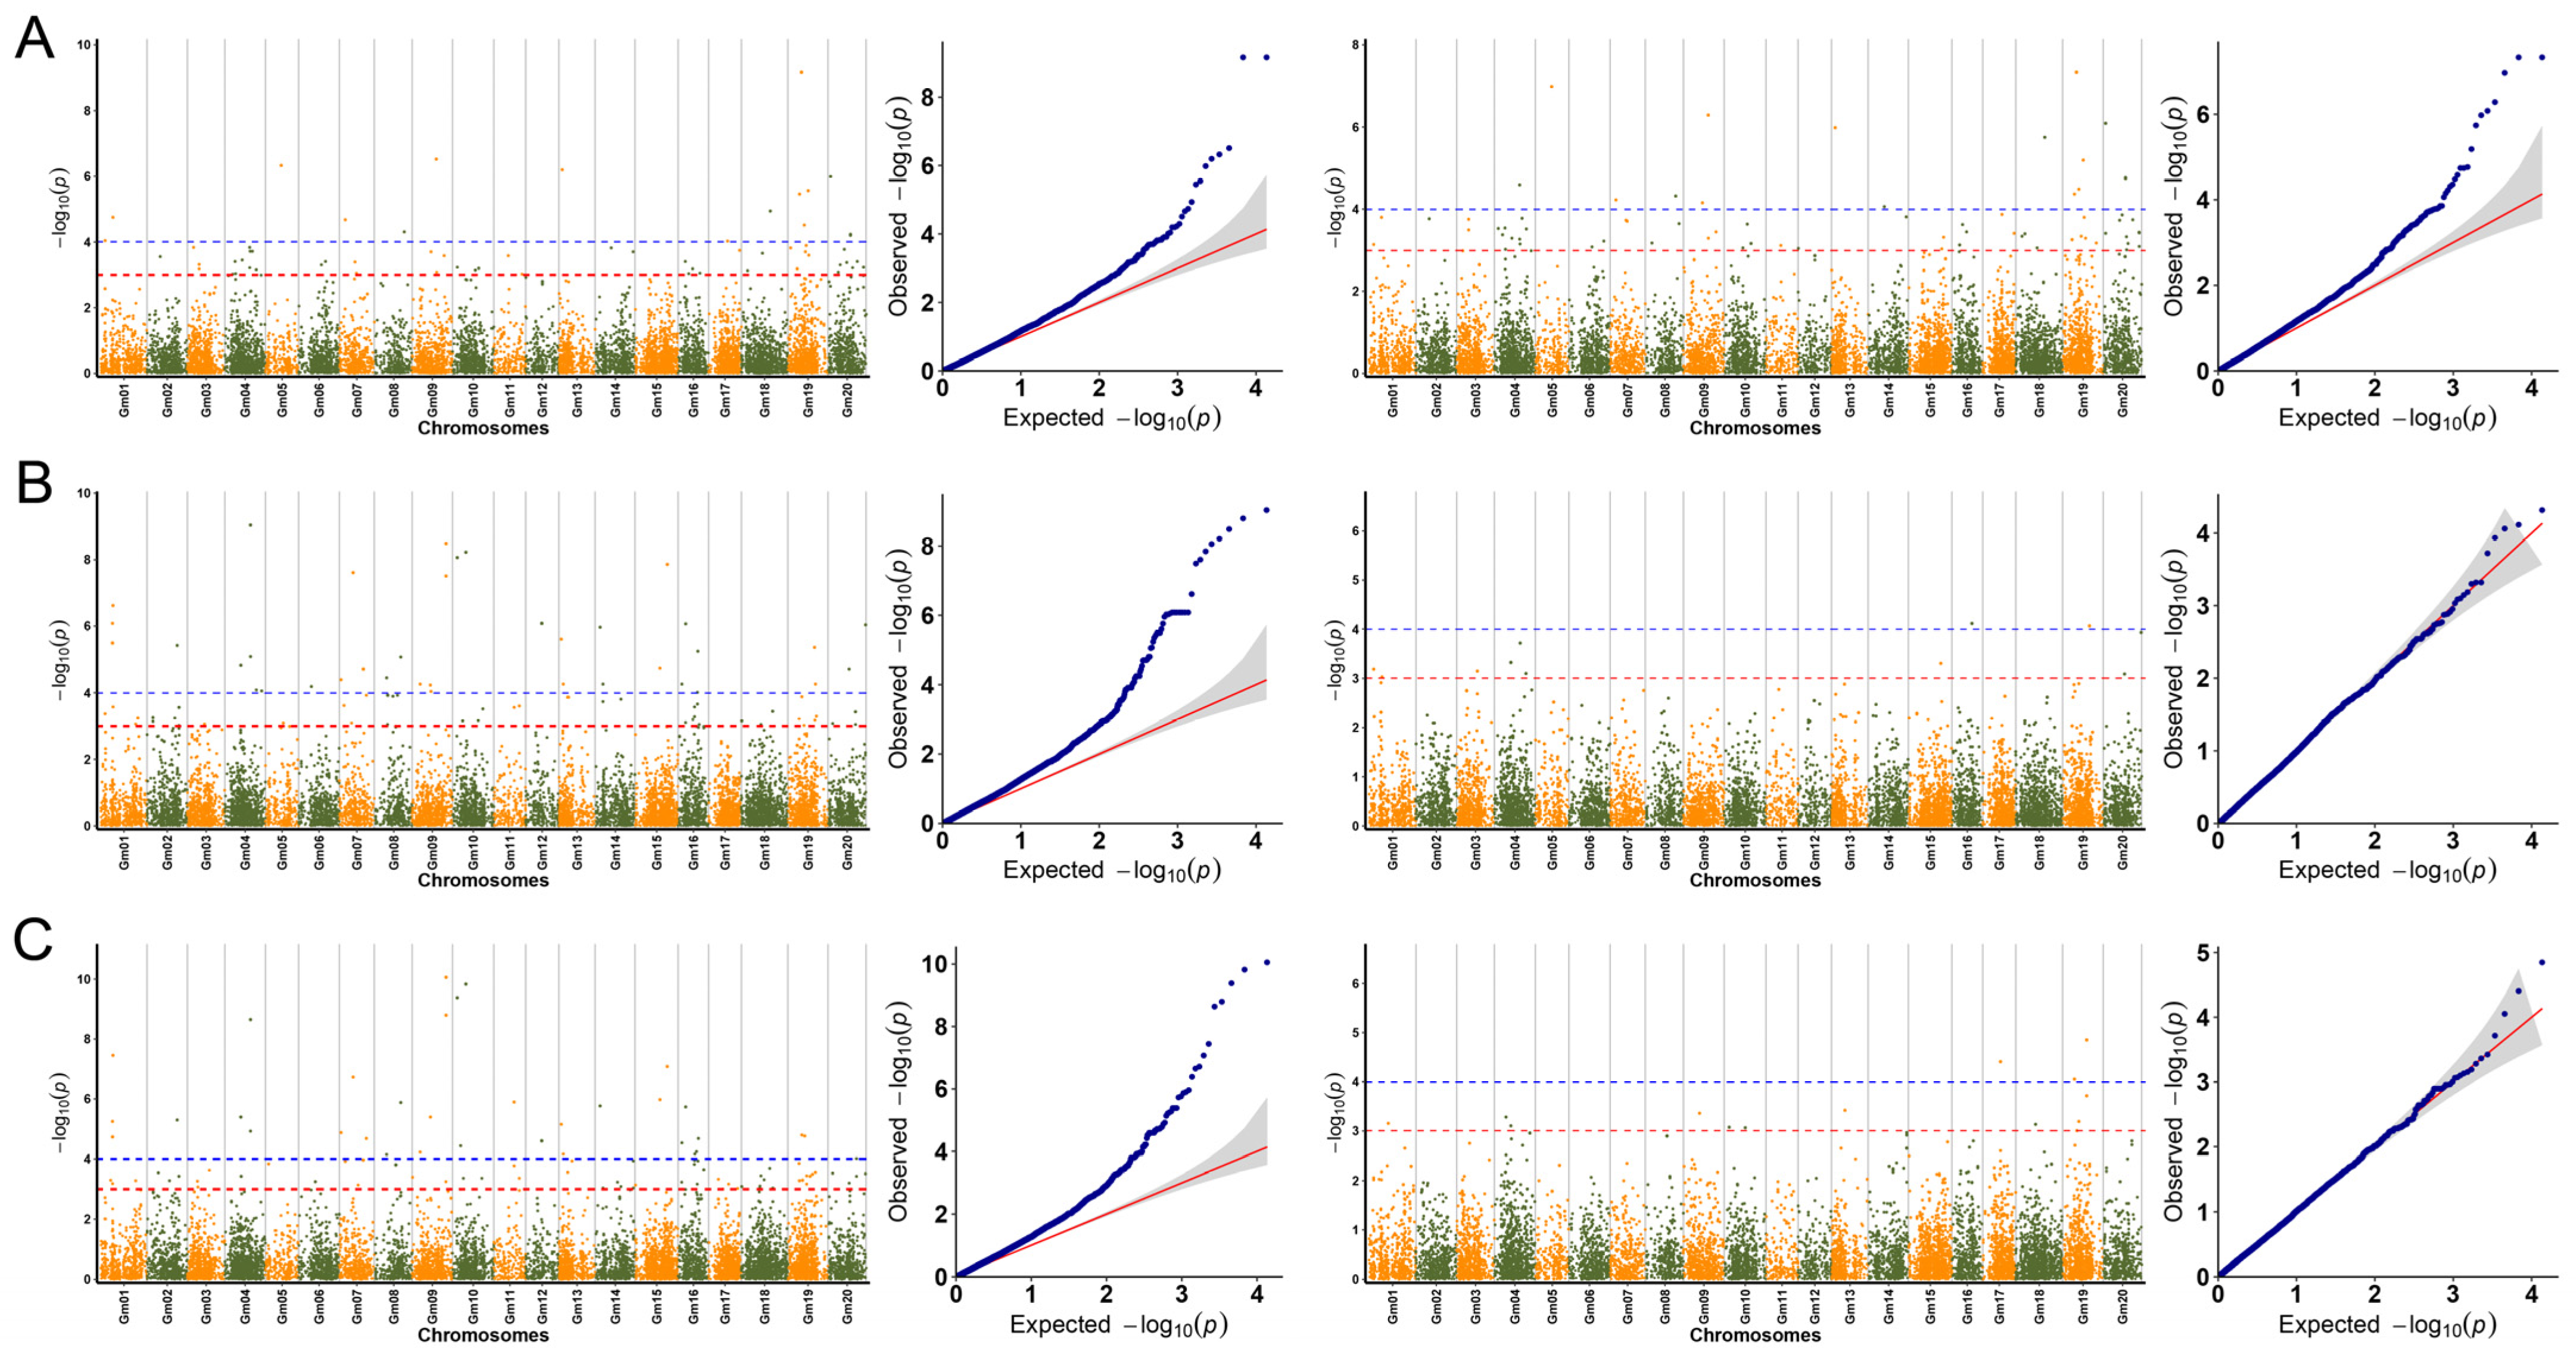
In 2019, the two models identified 26 loci significantly associated with linoleic acid content, among which the largest number (5) was located on chromosome 18 (Figure 2A). The site Gm04_23285129 on chromosome 4 was most significantly associated with linoleic acid, with a −log10p of 4.59. In 2020, the two models identified a total of 20 loci significantly associated with linoleic acid content, among which the largest number (4) were located on chromosome 18 (Figure 2B). Among them, the site Gm11_11745948 on chromosome 11 was most significantly associated with linoleic acid, with a −log10p of 4.43. In 2021, a total of 16 significantly associated loci were located by the two models, among which the largest number (6) was located on chromosome 14 (Figure 2C). Among them, Gm17_31555021 on chromosome 17 is the most significantly associated with linoleic acid, with a −log10p of 4.33. In order to reduce the influence of environmental factors, the SNP site Gm13_10009679 was obtained after three years of screening and repeated localization (Figure 4A).
In 2019, the two models identified 86 loci significantly associated with linolenic acid content, among which the largest number (5) were located on chromosome 18 (Figure 3A). The loci Gm19_17062231 and Gm19_17062278 on chromosome 19 were most significantly associated with linoleic acid, with a −log10p of 9.16. In 2020, a total of 124 loci significantly associated with linoleic acid content were located by the two models, among which 19 loci were the most distributed on chromosome 19 (Figure 3B). Among them, the site Gm10_6061218 on chromosome 10 was most significantly associated with linoleic acid, with a −log10p of 9.39. In 2021, the two models identified a total of 104 significantly associated loci, among which the largest number (12) was located on chromosome 1 (Figure 3C). Among them, the site Gm04_31854380 on chromosome 4 is most significantly associated with linolenic acid, with a −log10p of 4.33. In order to reduce the influence of environmental factors, the SNP site Gm19_41366844 was obtained after three years of screening and repeated localization (Figure 4B).

3.4. Screening and Annotation of Candidate Genes

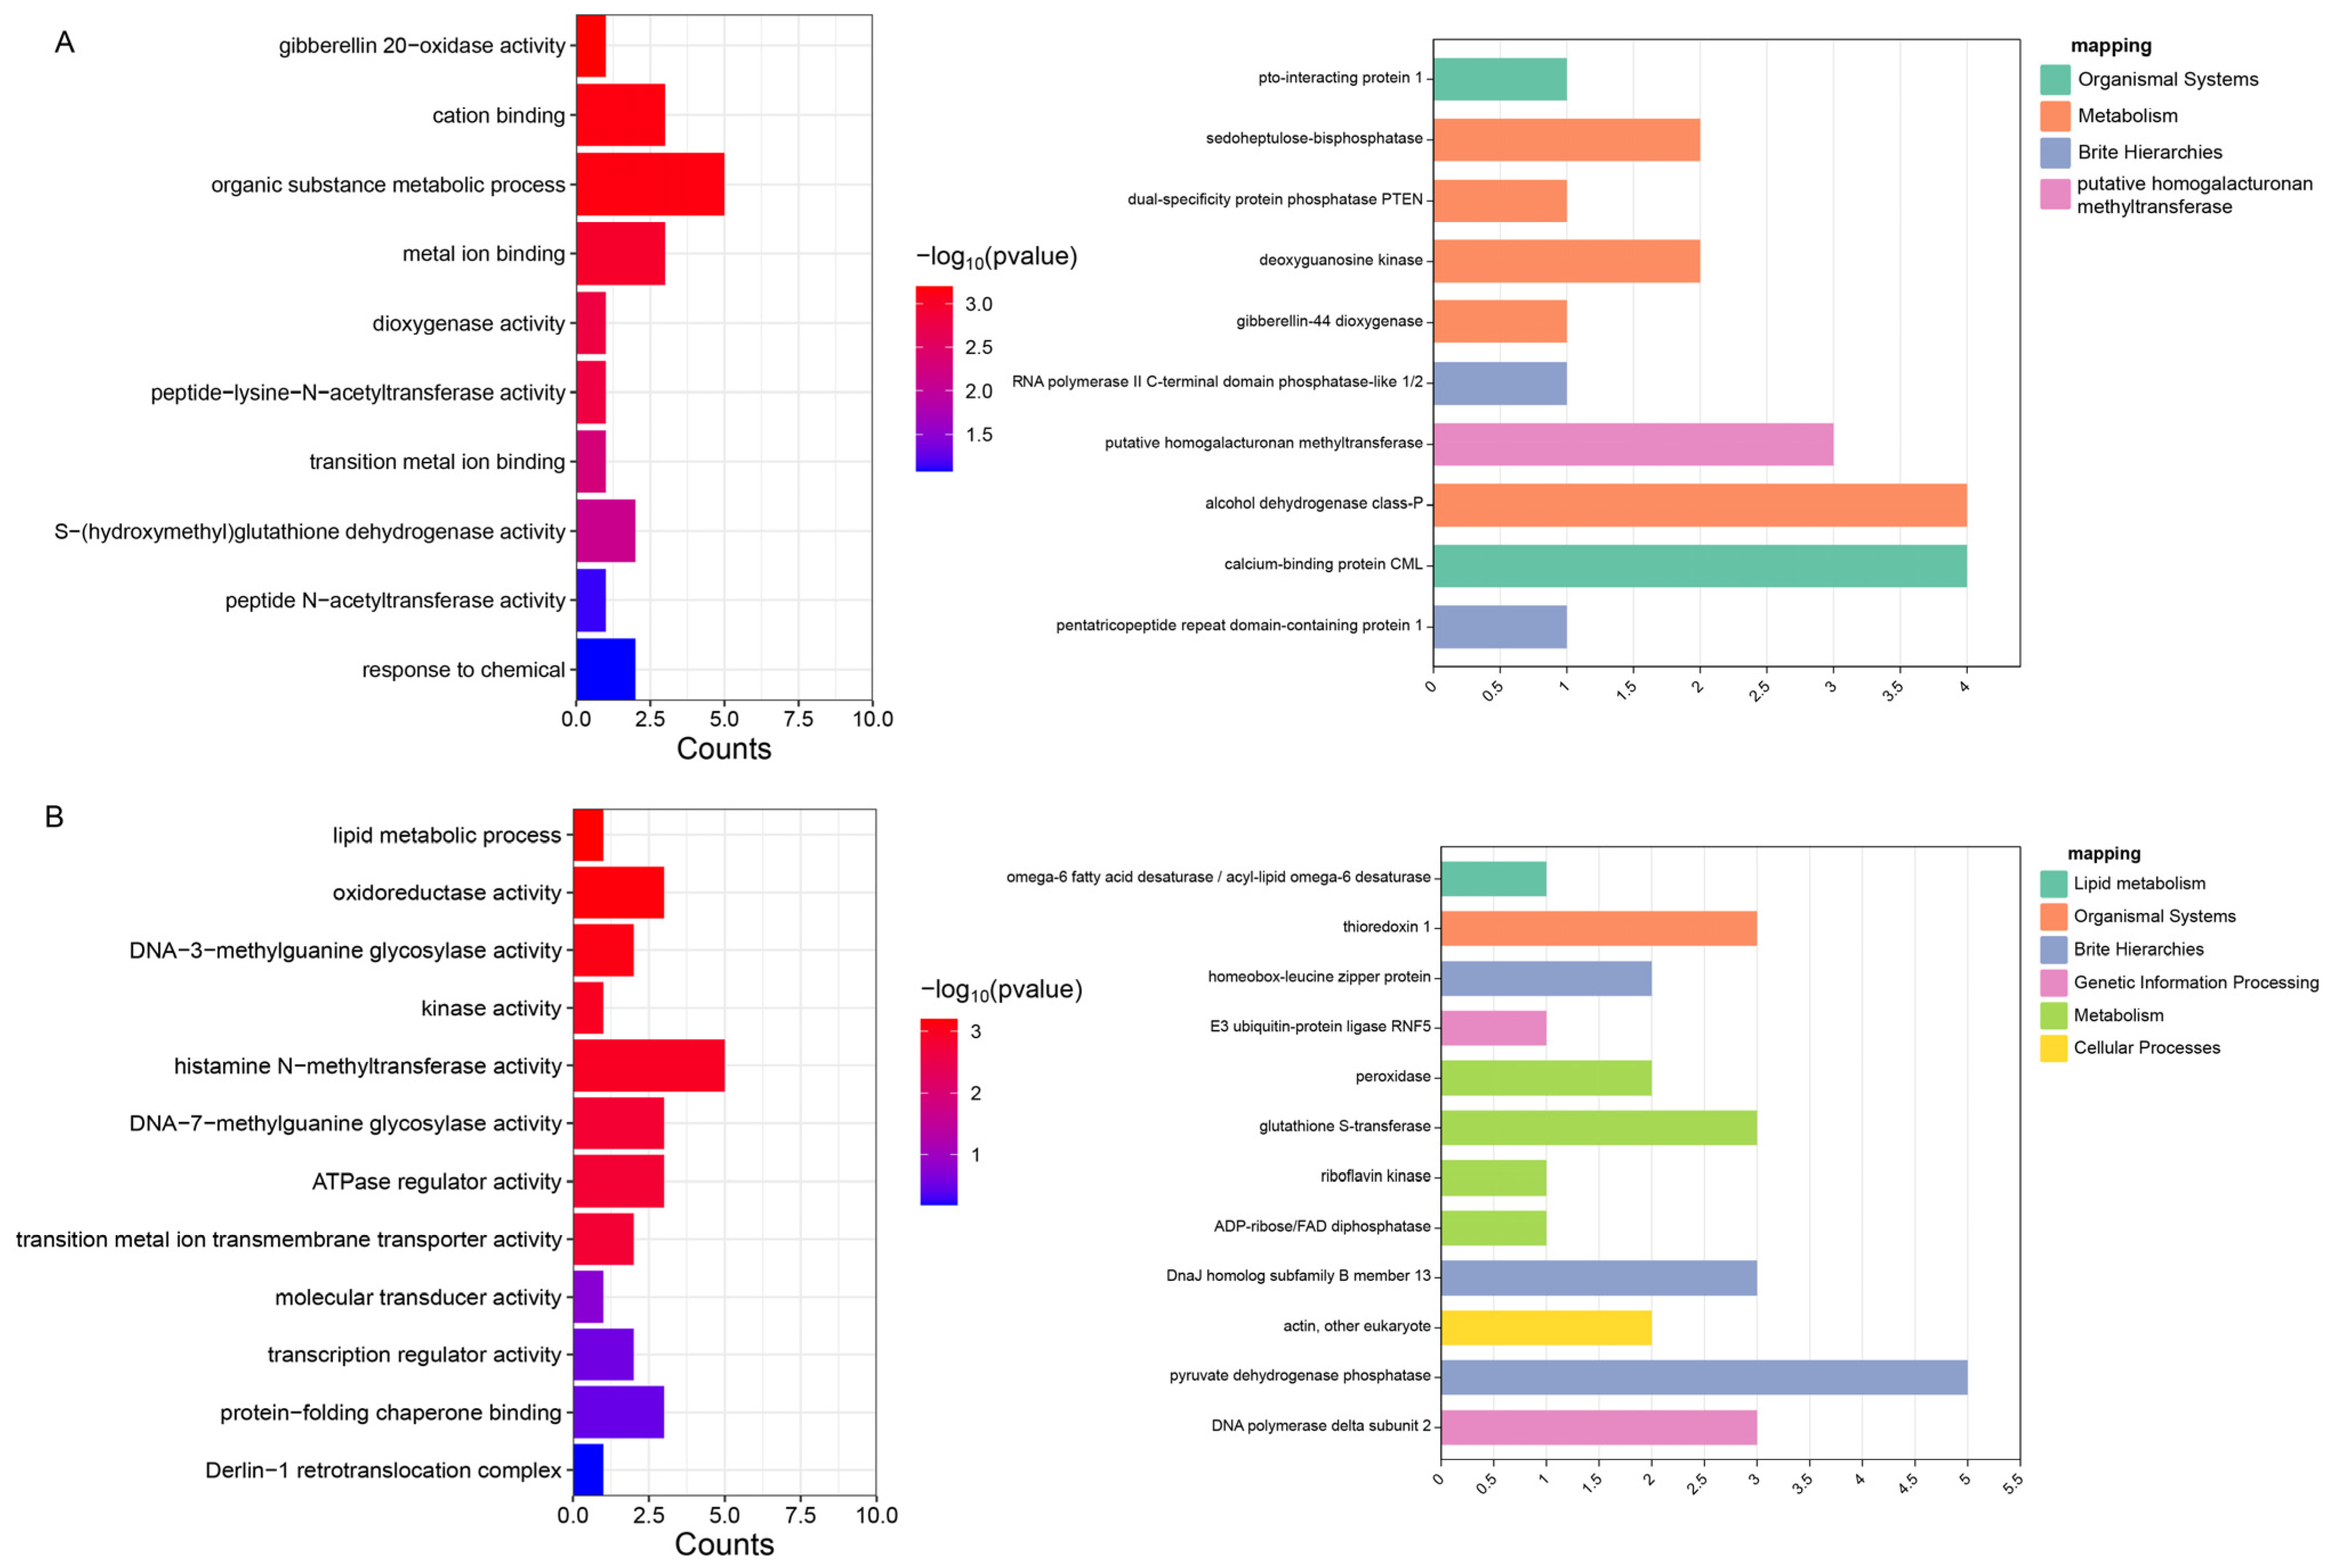
A gene search was performed on the 100 Kb upstream and downstream intervals of the significant SNP locus Gm13_10009679, which is related to the linoleic acid content, and the candidate genes obtained from the gene search were enriched and functionally annotated. The results of the analysis showed that gene functions were enriched in a wide range of pathways such as S-(hydroxymethyl) glutathione dehydrogenase activity (GO:0051903), the process of organic metabolism (GO:0071704), and the activity of gibberellin oxidase (GO:0045544), and it was found that GmGA20ox (Glyma.13G035600) affected gene functional KEGG annotation on the gibberellin biosynthesis pathway (K05282) (Figure 5A), which may be related to flower development, cell growth, and fatty acid synthesis and metabolism.
Enrichment analysis and functional annotation of genes within the 100 Kb upstream and downstream intervals of the SNP locus (Gm19_41366844) associated with linolenic acid content showed that gene functions were enriched in a variety of pathways such as transcriptional regulatory activity (GO:0140110), oxidoreductase activity (GO:0016491), and lipid metabolic processes (GO:0006629), and found that the GmFAD3 (Glyma.19G147400) gene functional KEGG annotated on the ω-6 fatty acid desaturase pathway (K10256) (Figure 5B) (Table S5), which may be involved in lipid metabolic processes as a membrane component. Therefore, we considered GmGA20ox and GmFAD3 (Table S6) as the main candidate genes.

3.5. Preliminary Identification of Candidate Genes

In order to verify the association of candidate genes with the linoleic acid and linolenic acid contents, qRT-PCR was used to measure their relative expression levels in different stages (R6 and R7) and different tissues (pods and seeds). The results showed that the expression level of GmGA20ox in various parts of high linoleic acid soybean materials was significantly up-regulated. The expression level in the R6 period was significantly higher than in the R7 period, which may be because the R6 period is a period of efficient accumulation of linoleic acid. The expression level of GmGA20ox was enhanced. However, it was just the opposite in low linoleic acid soybean materials, and its expression level was significantly down-regulated. This result indicated that the candidate gene GmGA20ox played an active role in regulating the linoleic acid content in seeds (Figure 6A,B).
Simultaneously, we analyzed the relative expression of GmFAD3 in soybean pods. The expression patterns of GmFAD3 and GmGA20ox exhibited similarities. The expression levels of various parts were significantly up-regulated in high-linolenic acid soybean materials. The expression level in the R6 period was significantly higher than in the R7 period, while the expression level was significantly down-regulated in low-linolenic acid soybean materials. Based on the results, it was found that GmFAD3 had a strong correlation with the amount of linolenic acid. Moreover, it was observed that GmFAD3 had a beneficial impact on increasing the linolenic acid content in seeds (Figure 6C,D).
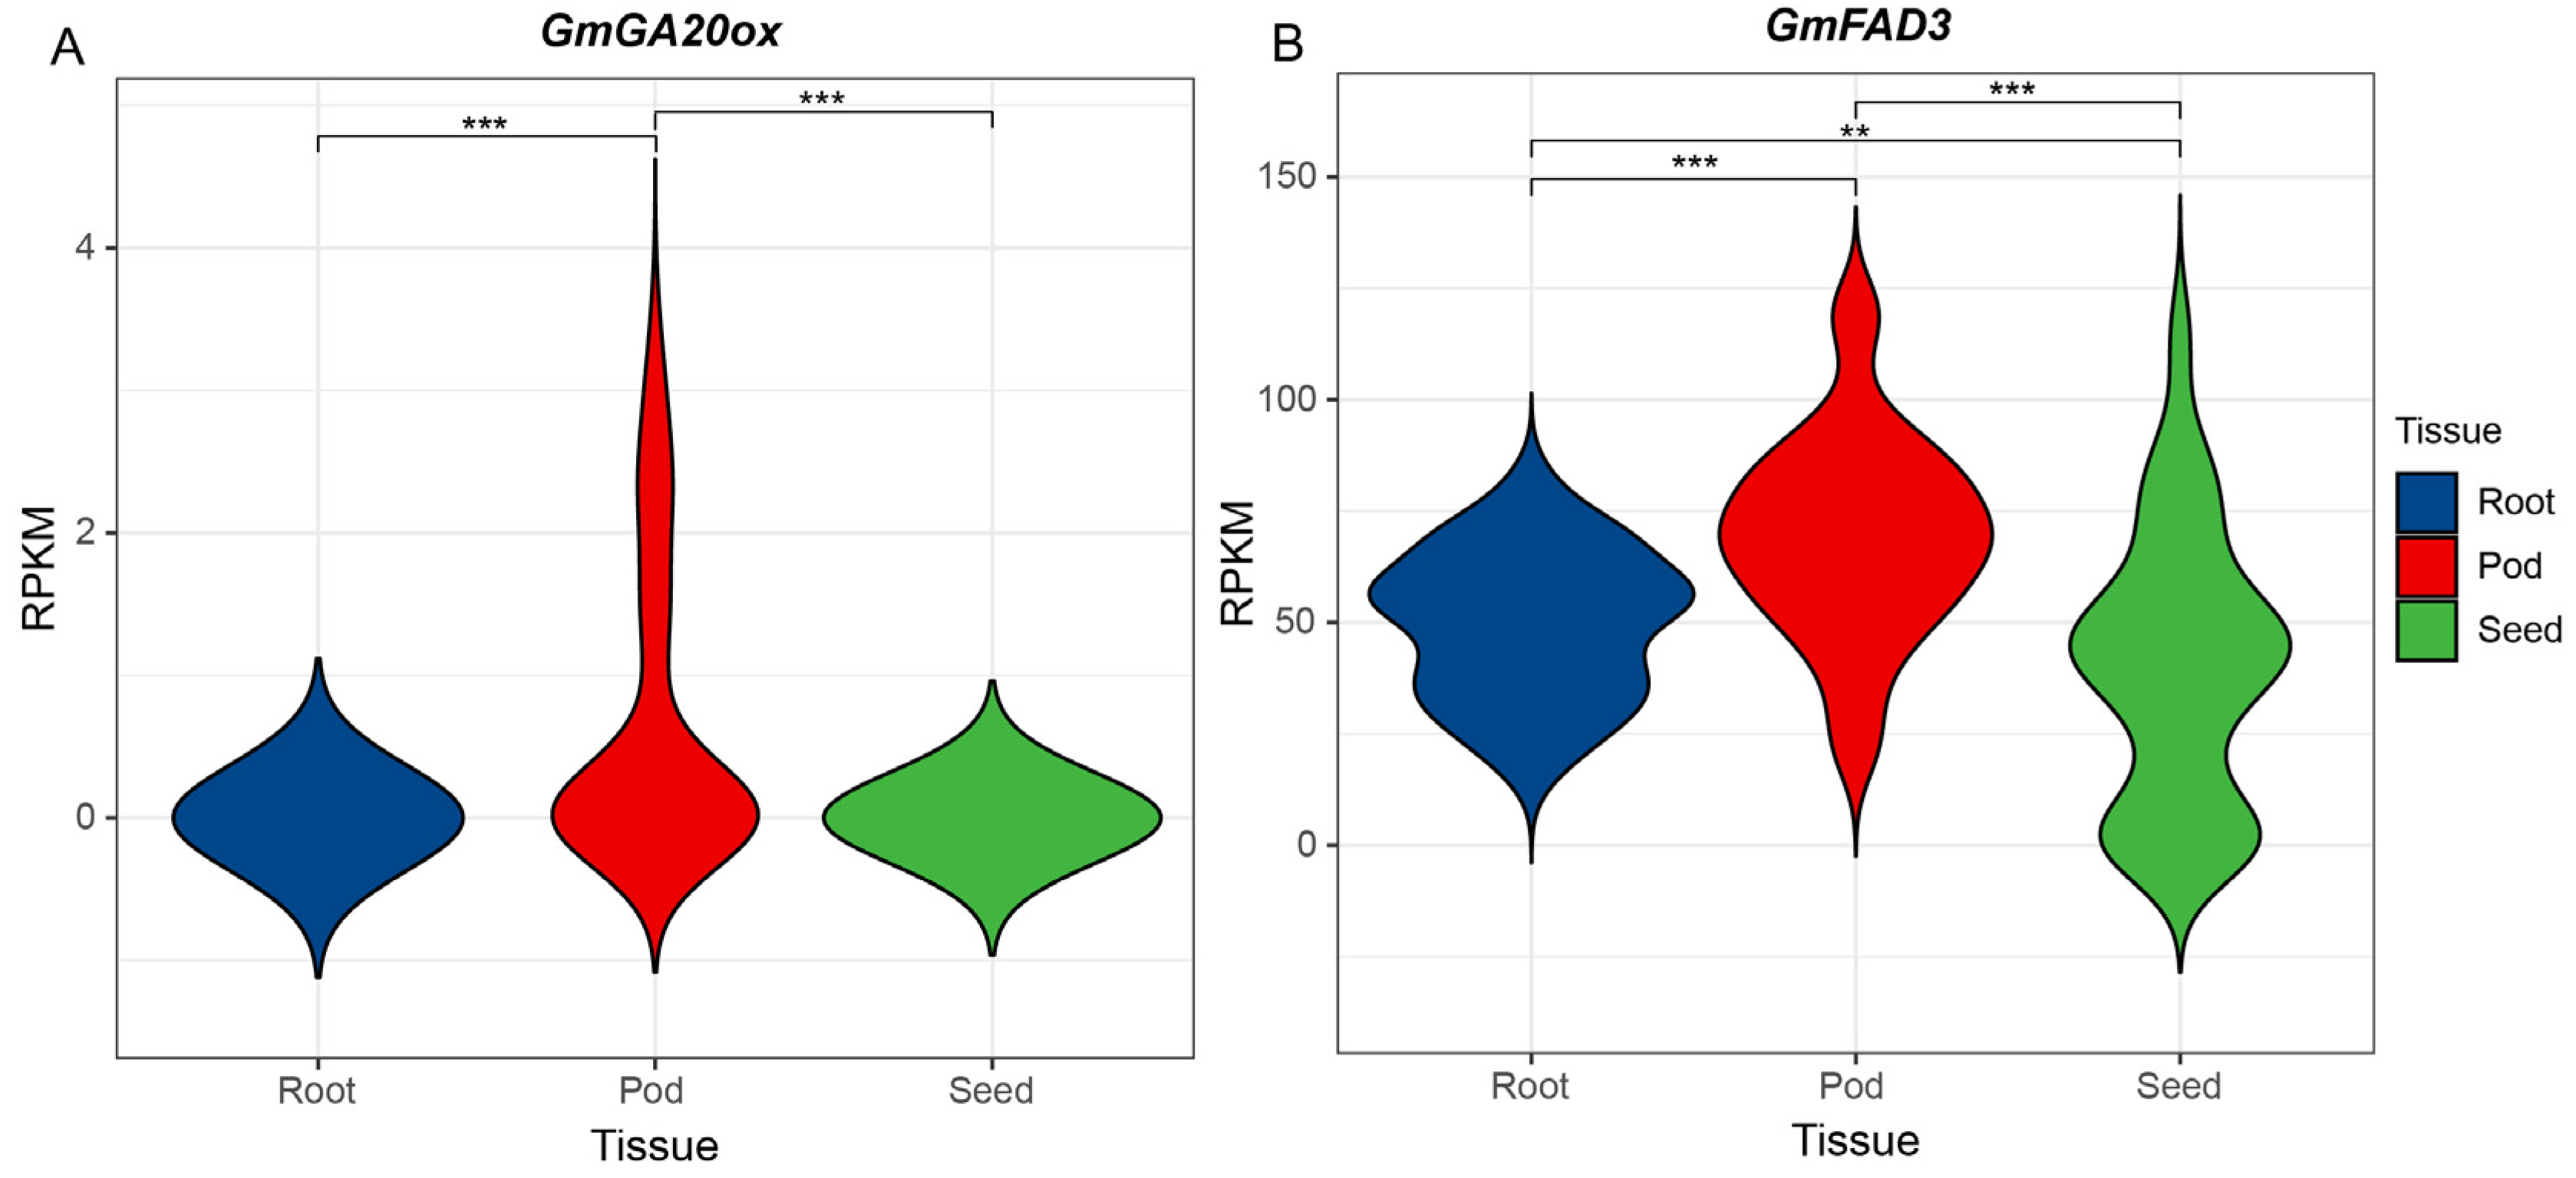
From PPRD, we obtained the RNA-seq data for these two potential genes. In the case of GmGA20ox, gene expression was markedly higher in the pod (Figure 7A). On the other hand, GmFAD3 exhibited significantly greater gene expression during stages of root, pod, and seed development (Figure 7B). The RNA-seq data were consistent with the expression trend of qRT-PCR.
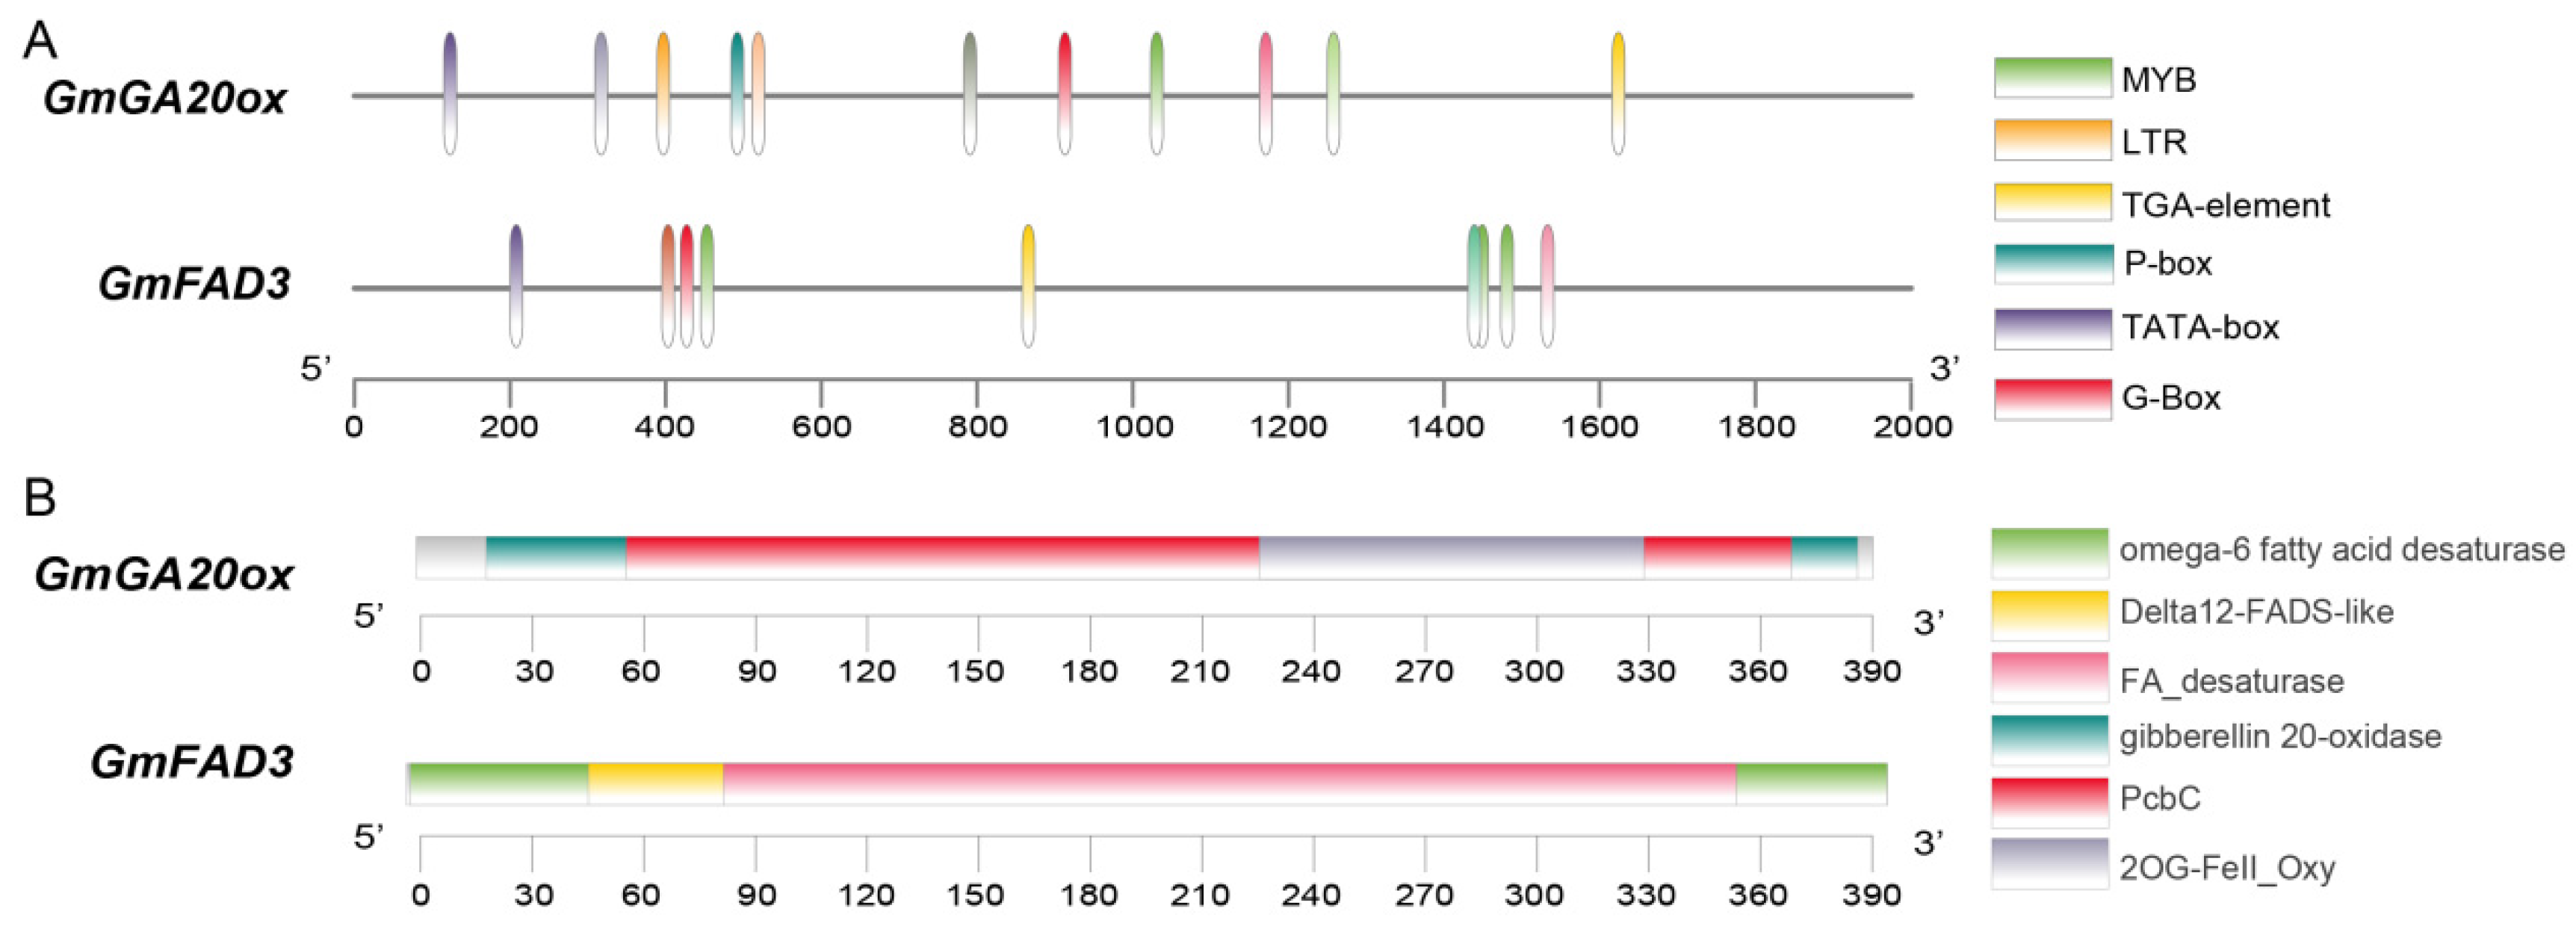
Moreover, the identified genes of interest appear to possess crucial cis-regulatory elements, pivotal in modulating the levels of linoleic and linolenic acids, such as the gibberellin response element (P-box element: CCTTTTG motif), G-Box elements (TCCACATGGCA, CACGTT motifs), MYB response elements (TAACCA motifs), and others (Figure 8A). The predicted candidate genes were also found to have conserved domains related to the linoleic acid and linolenic acid contents (Figure 8B). Hence, the presence of these response elements and conserved domains implies a potential association between these candidate genes and the levels of linoleic acid and linolenic acid in soybean seeds. Nevertheless, additional functional validation is needed to confirm their actual involvement in regulating the content of linoleic acid and linolenic acid in seeds.

4. Discussion

Soybean fatty acid components exhibit specific correlations in their relative content [43,44]. However, the generated correlations vary depending on the ecological environment, quantity, and sources of the studied varieties [45]. In this study, there is a highly significant positive correlation observed between the relative content of linoleic acid and linolenic acid, consistent with previous research findings. At the same time, our study results indicate that gene-environment interaction effects are not significant. This may be attributed to our experimental design, which employed a multi-year single-point approach with relatively stable environmental conditions. Due to the relative consistency of the environment, variations in gene-environment interactions were minimal, making it challenging to produce significant interaction effects. In the research of unsaturated fatty acid component correlations, Eleni et al. [46] investigated correlations between oleic acid and other fatty acids as well as agronomic traits in three soybean populations grown in multiple environments, finding a positive correlation between linoleic acid and linolenic acid. Additionally, Song et al. [47] analyzed the fatty acid content of 621 soybean varieties grown in five different environments using gas chromatography. They conducted correlation analysis on the five fatty acids and found a strong positive correlation between linoleic acid and linolenic acid. Therefore, in studies involving genetic improvement of soybean fatty acid composition through breeding, attention should be paid to the correlations among different fatty acid components. The clear correlations between these components make it easier to successfully breed high-quality soybean varieties that meet breeding requirements [48,49].
Due to influences of the genetic background or environmental factors, the localization results of the same trait may be distinct in different populations or environments [50]. Therefore, when carrying out molecular marker breeding selection for quantity traits, the loci that can be repeatedly detected in different genetic backgrounds and different environments may have higher application value [51]. Compared to traditional techniques, SLAF-seq is not constrained by a reference genome and features a flexible enzymatic scheme, avoidance of repetitive sequences, and simplification of complex genomes. Additionally, the SNP molecular markers developed through this method are cost-effective and stable, with a uniform distribution across the genome, meeting the needs of large-scale sample analysis. In this study, a natural population composed of 292 soybean varieties was selected, and the contents of linoleic acid and linolenic acid in soybean grains were taken as phenotypic data. Based on SLAF-seq technology, 641,542 SNP loci were obtained and genome-wide association analysis was conducted using GLM_Q and MLM_Q+K. At the significance level of −log10p ≥ 3, there was one SNP site that was significantly associated with soybean linoleic acid (Gm13_10009679) and one SNP site significantly associated with soybean linoleic acid (Gm19_41366844), which were all SNP sites that were repeatedly detected in three years. By comparing the significant SNP sites located in this study with the results of domestic and foreign studies, it was found that one SNP site related to linolenic acid that was repeatedly detected in this study was similar or overlapped with the previous QTL results. Hyten et al. [52] used a cross between the soybean varieties Essex and Williams to generate a recombinant inbred line (RIL) with 131 F6 that mapped to a QTL (43,329,322–46,110,862) in close physical proximity to Gm19_41366844, which was significantly correlated with the linolenic acid content of soybean seeds. Kim et al. [53] utilized 115 F2:10 recombinant inbred lines (RILs) derived from a ‘Keunolkong’ and ‘Iksan10′ cross. They successfully identified five quantitative trait loci (QTLs) impacting the linoleic acid content, located on chromosomes 2, 11, 14, 16, and 19. Additionally, they pinpointed three QTLs influencing linolenic acid content on chromosomes 8, 10, and 19. These QTLs notably coincided with the physical position of Gm19_41366844 (40,637,071–41,616,190). Their research further established the significant association of a specific SNP locus at this site with the linolenic acid content in soybean seeds. In addition, a new SNP site, Gm13_10009679, was found that may be related to linoleic acid content. The appearance of this site may be related to the environment and genetic background, or to population-specific regulatory sites of linoleic acid content. After visualizing the association results, this study found that in 2019, the MLM model was used for association analysis of linoleic acid traits, and part of the markers in the QQ scatter plot was below the diagonal line, indicating that the p-value of most sites was lower than the expected value, which may be due to the unreasonable MLM model, resulting in over-correction of the p-value. It may also be that there is a linkage imbalance between a large number of sites in the population, resulting in a lower effective site number than the actual site number.
In this study, gene retrieval was performed at 100 Kb, upstream and downstream of significantly associated SNP loci. GmGA20ox was screened near Gm13_10009679 on chromosome 13, which was associated with soybean linoleic acid anabolic metabolism, and was predicted with functional annotation information and cis-acting elements. This gene is related to gibberellin biosynthesis, and the prediction of cis-acting elements found that there is an MYB transcription factor binding site. Peng et al. [54] speculated that fatty acid biosynthesis is related to the regulation of MYB transcription factors; Agarwal et al. [55] concluded that transcription factor MYB is related to seed development and maturation.
Many studies have shown a correlation between lipids and various growth and developmental processes, including flower development and photosynthesis [56,57,58]. Through microarray analysis, Cao et al. [59] demonstrated that the DELLA protein decreased the expression of various GDSL genes in seeds and young Arabidopsis buds, suggesting that GA signaling may regulate fatty acid metabolism in seeds. In their study, Chen et al. [60] enhanced gibberellic acid (GA) signaling by introducing DELLA mutations or adding exogenous gibberellin (GA3). This resulted in an upregulation of transcription factors associated with embryogenesis and seed development, genes involved in fatty acid biosynthesis pathways, and five GDSL-type seed fatty acid-reducing agent (SFAR) genes. When SFAR was overexpressed, the overall fatty acid content in seeds decreased, whereas the loss of SFAR function significantly increased the fatty acid (FA) content in seeds. In conclusion, the overexpression of SFAR can reduce the accumulation of fatty acids in seeds and can be utilized downstream of the GA signaling pathway.
The gene GmFAD3 was screened near the Gm19_41366844 site on chromosome 19, which is related to the synthesis of soybean linolenic acid. Through functional annotation information, it was found that this gene is related to ω-6 fatty acid desaturase. Enzymes known as fatty acid desaturases play a role in introducing double bonds into fatty acid chains at specific locations, resulting in the production of unsaturated fatty acids. Plants can be divided into two categories: those that catalyze the conversion of saturated fatty acids to oleic acid when the first double bond is introduced before the formation of glycerol from fatty acids, with only stearoyl-ACP desaturase (SAD) being one of these fatty acid desaturases; those that further desaturate fatty acid groups after the initial formation of triglycerides, which mainly includes ω-3 desaturase and ω-6 desaturase. In soybeans, the FAD2 gene of ω-3 desaturase and the FAD3 gene of ω-6 desaturase control the conversion of oleic acid to linoleic acid and linoleic acid to linolenic acid, respectively. Overexpression or knockout of the FAD3 gene in soybean can greatly affect the content of linolenic acid [61,62,63,64,65,66].
The research above demonstrates that the two genes uncovered in this experiment (GmGA20ox; GmFAD3) are likely associated with the regulation of synthesis and accumulation of soybean linoleic and linolenic acid, respectively.

5. Conclusions

This study successfully identified SNP loci associated with linoleic and linolenic acid contents in soybeans through GWAS analysis. The genomic regions surrounding these SNP loci were annotated for gene function, leading to the identification of genes GmGA20ox and GmFAD3, which may regulate linoleic and linolenic acid accumulation. These findings hold significant theoretical importance in understanding the mechanisms of fatty acid formation in soybeans and provide valuable resources for developing high-quality soybean varieties.

Supplementary Materials

The following supporting information can be downloaded at: https://www.mdpi.com/article/10.3390/agriculture13122250/s1, Figure S1: Distribution of SNP markers in chromosomes and SCAFFOLD fragments.; Table S1: Geographical distribution of 292 soybean germplasm resources. Table S2: This study selected five varieties with high-phenotypic values and five varieties with low-phenotypic values for the two traits as experimental materials. Table S3: List of primers used for the qRT-PCR assay of the key structural genes involved in Linoleic and Linolenic Acid traits. Table S4: Three-year phenotypic data on linoleic and linolenic acids from 292 soybean germplasm resources. Table S5: Enrichment analysis and functional annotation of linoleic and linolenic acid related candidate genes. Table S6: Information on candidate genes related to linoleic and linolenic acid content in soybean.

Author Contributions

P.W. initiated the experimental concepts and provided guidance for the experiments. The manuscript was authored by J.W. and L.L., who also interpreted the data. Contributions to data analysis and interpretation were made by Q.Z. and T.S. The article’s revision involved collaborative efforts from P.W., J.W., L.L., Q.Z. and T.S. All authors have read and agreed to the published version of the manuscript.

Funding

Funding for this study was provided by the Jilin Province Major Science and Technology Innovation Project. This project, dedicated to the improvement of main grain crop seeds, focused on the resource identification, functional gene discovery, and material development for special soybean varieties with high yield and quality. The project is registered under the grant number 20210302002NC.

Institutional Review Board Statement

Not applicable.

Data Availability Statement

The genomic sequencing data derived from our research are now accessible on the NCBI database under the accession number PRJNA940512. Additionally, all other data produced or examined during our study can be found within the supplementary information file and the main body of the published article.

Acknowledgments

We thank the Jilin Province Major Science and Technology Innovation Initiative for their support in enhancing grain crops and the Biotechnology Center at Jilin Agricultural University for providing vital soybean germplasm resources for our research.

Conflicts of Interest

The authors declare that they have no competing interest.

References

  1. Ayilara, M.S.; Adeleke, B.S.; Babalola, O.O. Bioprospecting and Challenges of Plant Microbiome Research for Sustainable Agriculture, a Review on Soybean Endophytic Bacteria. Microb. Ecol. 2023, 85, 1113–1135. [Google Scholar] [CrossRef] [PubMed]
  2. Kanai, M.; Yamada, T.; Hayashi, M.; Mano, S.; Nishimura, M. Soybean (Glycine Max L.) Triacylglycerol Lipase GmSDP1 Regulates the Quality and Quantity of Seed Oil. Sci. Rep. 2019, 9, 8924. [Google Scholar] [CrossRef] [PubMed]
  3. Paul, A.K.; Achar, S.K.; Dasari, S.R.; Borugadda, V.B.; Goud, V.V. Analysis of Thermal, Oxidative and Cold Flow Properties of Methyl and Ethyl Esters Prepared from Soybean and Mustard Oils. J. Therm. Anal. Calorim. 2017, 130, 1501–1511. [Google Scholar] [CrossRef]
  4. Xu, K.; Saaoud, F.; Shao, Y.; Lu, Y.; Wu, S.; Zhao, H.; Chen, K.; Vazquez-Padron, R.; Jiang, X.; Wang, H.; et al. Early Hyperlipidemia Triggers Metabolomic Reprogramming with Increased SAH, Increased Acetyl-CoA-Cholesterol Synthesis, and Decreased Glycolysis. Redox Biol. 2023, 64, 102771. [Google Scholar] [CrossRef] [PubMed]
  5. Flock, M.R.; Green, M.H.; Kris-Etherton, P.M. Effects of Adiposity on Plasma Lipid Response to Reductions in Dietary Saturated Fatty Acids and Cholesterol. Adv. Nutr. 2011, 2, 261–274. [Google Scholar] [CrossRef] [PubMed]
  6. Zhang, W.-Y.; Franco, D.A.; Schwartz, E.; D’Souza, K.; Karnick, S.; Reaven, P.D. HDL Inhibits Saturated Fatty Acid Mediated Augmentation of Innate Immune Responses in Endothelial Cells by a Novel Pathway. Atherosclerosis 2017, 259, 83–96. [Google Scholar] [CrossRef]
  7. He, M.; Qin, C.-X.; Wang, X.; Ding, N.-Z. Plant Unsaturated Fatty Acids: Biosynthesis and Regulation. Front. Plant Sci. 2020, 11, 390. [Google Scholar] [CrossRef]
  8. Zhang, W.; Zhou, F.; Huang, H.; Mao, Y.; Ye, D. Biomarker of Dietary Linoleic Acid and Risk for Stroke: A Systematic Review and Meta-Analysis. Nutrition 2020, 79–80, 110953. [Google Scholar] [CrossRef]
  9. Badawy, S.; Liu, Y.; Guo, M.; Liu, Z.; Xie, C.; Marawan, M.A.; Ares, I.; Lopez-Torres, B.; Martínez, M.; Maximiliano, J.-E.; et al. Conjugated Linoleic Acid (CLA) as a Functional Food: Is It Beneficial or Not? Food Res. Int. 2023, 172, 113158. [Google Scholar] [CrossRef]
  10. Ghanem, A.K.; Ahmad, K.; Javier, D.A.; Rezvanizadeh, V.; Kinninger, A.; Hamal, S.A.; Flores, F.; Dailing, C.; Roy, S.K.; Budoff, M.J. Effects of Supplements Containing Curcumin, Omega Fatty Acids, Gamma Linolenic Acid, Vitamin E, Vitamin D, Hydroxytyrosol, And Astaxanthin On Cardiovascular Health: A Randomized, Double-Blind, Placebo-Controlled Clinical Trial. Am. J. Prev. Cardiol. 2023, 13, 100401. [Google Scholar] [CrossRef]
  11. Kim, Y.; Ilich, J.Z. Implications of Dietary α-Linolenic Acid in Bone Health. Nutrition 2011, 27, 1101–1107. [Google Scholar] [CrossRef] [PubMed]
  12. Monnard, C.R.; Dulloo, A.G. Polyunsaturated Fatty Acids as Modulators of Fat Mass and Lean Mass in Human Body Composition Regulation and Cardiometabolic Health. Obes. Rev. 2021, 22, e13197. [Google Scholar] [CrossRef] [PubMed]
  13. Uprety, B.K.; Rakshit, S.K. Use of Essential Oils From Various Plants to Change the Fatty Acids Profiles of Lipids Obtained From Oleaginous Yeasts. J. Am. Oil Chem. Soc. 2018, 95, 135–148. [Google Scholar] [CrossRef]
  14. Shokryazdan, P.; Rajion, M.A.; Meng, G.Y.; Boo, L.J.; Ebrahimi, M.; Royan, M.; Sahebi, M.; Azizi, P.; Abiri, R.; Jahromi, M.F. Conjugated Linoleic Acid: A Potent Fatty Acid Linked to Animal and Human Health. Crit. Rev. Food Sci. Nutr. 2017, 57, 2737–2748. [Google Scholar] [CrossRef] [PubMed]
  15. Priolli, R.H.G.; Carvalho, C.R.L.; Bajay, M.M.; Pinheiro, J.B.; Vello, N.A. Genome Analysis to Identify SNPs Associated with Oil Content and Fatty Acid Components in Soybean. Euphytica 2019, 215, 54. [Google Scholar] [CrossRef]
  16. Silva, L.C.C.; Bueno, R.D.; da Matta, L.B.; Pereira, P.H.S.; Mayrink, D.B.; Piovesan, N.D.; Sediyama, C.S.; Fontes, E.P.B.; Cardinal, A.J.; Dal-Bianco, M. Characterization of a New GmFAD3A Allele in Brazilian CS303TNKCA Soybean Cultivar. Theor. Appl. Genet. 2018, 131, 1099–1110. [Google Scholar] [CrossRef] [PubMed]
  17. Byfield, G.E.; Upchurch, R.G. Effect of Temperature on Microsomal Omega-3 Linoleate Desaturase Gene Expression and Linolenic Acid Content in Developing Soybean Seeds. Crop Sci. 2007, 47, 2445–2452. [Google Scholar] [CrossRef]
  18. Panahabadi, R.; Ahmadikhah, A.; Farrokhi, N.; Bagheri, N. Genome-Wide Association Study (GWAS) of Germination and Post-Germination Related Seedling Traits in Rice. Euphytica 2022, 218, 112. [Google Scholar] [CrossRef]
  19. Gajardo Balboa, H.; Wittkop, B.; Soto-Cerda, B.; Higgins, E.; Parkin, I.; Snowdon, R.; Federico, M.; Iniguez-Luy, F. Association Mapping of Seed Quality Traits in Brassica Napus L. Using GWAS and Candidate QTL Approaches. Mol. Breed. 2015, 35, 143. [Google Scholar] [CrossRef]
  20. Cho, S.; Kim, D.; Lee, S. A Comparative Evaluation of a Single and Stereo Lighthouse Systems for 3-D Estimation. IEEE Sens. J. 2021, 21, 24791–24800. [Google Scholar] [CrossRef]
  21. Mandozai, A.; Moussa, A.A.; Zhang, Q.; Qu, J.; Du, Y.; Anwari, G.; Al Amin, N.; Wang, P. Genome-Wide Association Study of Root and Shoot Related Traits in Spring Soybean (Glycine max L.) at Seedling Stages Using SLAF-Seq. Front. Plant Sci. 2021, 12, 568995. [Google Scholar] [CrossRef] [PubMed]
  22. Li, M.; Liu, Y.; Tao, Y.; Xu, C.; Li, X.; Zhang, X.; Han, Y.; Yang, X.; Sun, J.; Li, W.; et al. Identification of Genetic Loci and Candidate Genes Related to Soybean Flowering through Genome Wide Association Study. BMC Genom. 2019, 20, 987. [Google Scholar] [CrossRef] [PubMed]
  23. Wu, D.; Li, D.; Zhao, X.; Zhan, Y.; Teng, W.; Qiu, L.; Zheng, H.; Li, W.; Han, Y. Identification of a Candidate Gene Associated with Isoflavone Content in Soybean Seeds Using Genome-Wide Association and Linkage Mapping. Plant J. 2020, 104, 950–963. [Google Scholar] [CrossRef] [PubMed]
  24. Liu, X.; Qin, D.; Piersanti, A.; Zhang, Q.; Miceli, C.; Wang, P. Genome-Wide Association Study Identifies Candidate Genes Related to Oleic Acid Content in Soybean Seeds. BMC Plant Biol. 2020, 20, 399. [Google Scholar] [CrossRef] [PubMed]
  25. Zhao, X.; Chang, H.; Feng, L.; Jing, Y.; Teng, W.; Qiu, L.; Zheng, H.; Han, Y.; Li, W. Genome-wide Association Mapping and Candidate Gene Analysis for Saturated Fatty Acid Content in Soybean Seed. Plant Breed. 2019, 138, 588–598. [Google Scholar] [CrossRef]
  26. Sun, X.; Liu, D.; Zhang, X.; Li, W.; Liu, H.; Hong, W.; Jiang, C.; Guan, N.; Ma, C.; Zeng, H.; et al. SLAF-Seq: An Efficient Method of Large-Scale De Novo SNP Discovery and Genotyping Using High-Throughput Sequencing. PLoS ONE 2013, 8, e58700. [Google Scholar] [CrossRef]
  27. Wu, S.; Alseekh, S.; Cuadros-Inostroza, Á.; Fusari, C.M.; Mutwil, M.; Kooke, R.; Keurentjes, J.B.; Fernie, A.R.; Willmitzer, L.; Brotman, Y. Combined Use of Genome-Wide Association Data and Correlation Networks Unravels Key Regulators of Primary Metabolism in Arabidopsis Thaliana. PLOS Genet. 2016, 12, e1006363. [Google Scholar] [CrossRef]
  28. Patil, I. Visualizations with Statistical Details: The “ggstatsplot” Approach. J. Open Source Softw. 2021, 6, 3167. [Google Scholar] [CrossRef]
  29. Zhang, K.; Liu, S.; Li, W.; Liu, S.; Li, X.; Fang, Y.; Zhang, J.; Wang, Y.; Xu, S.; Zhang, J.; et al. Identification of QTNs Controlling Seed Protein Content in Soybean Using Multi-Locus Genome-Wide Association Studies. Front. Plant Sci. 2018, 9, 1690. [Google Scholar] [CrossRef]
  30. Bates, D.; Mächler, M.; Bolker, B.; Walker, S. Fitting Linear Mixed-Effects Models Using Lme4. J. Stat. Softw. 2015, 67, 1–48. [Google Scholar] [CrossRef]
  31. Purcell, S.; Neale, B.; Todd-Brown, K.; Thomas, L.; Ferreira, M.A.R.; Bender, D.; Maller, J.; Sklar, P.; de Bakker, P.I.W.; Daly, M.J.; et al. PLINK: A Tool Set for Whole-Genome Association and Population-Based Linkage Analyses. Am. J. Hum. Genet. 2007, 81, 559–575. [Google Scholar] [CrossRef]
  32. Zhou, X.; Stephens, M. Genome-Wide Efficient Mixed-Model Analysis for Association Studies. Nat. Genet. 2012, 44, 821–824. [Google Scholar] [CrossRef] [PubMed]
  33. Turner, S.D. Qqman: An R Package for Visualizing GWAS Results Using Q-Q and Manhattan Plots. J. Open Source Softw. 2018, 3, 731. [Google Scholar] [CrossRef]
  34. Zhang, Q.; Sun, T.; Wang, J.; Fei, J.; Liu, Y.; Liu, L.; Wang, P. Genome-Wide Association Study and High-Quality Gene Mining Related to Soybean Protein and Fat. BMC Genom. 2023, 24, 596. [Google Scholar] [CrossRef] [PubMed]
  35. Zhang, H.; Zhang, G.; Zhang, W.; Wang, Q.; Xu, W.; Liu, X.; Cui, X.; Chen, X.; Chen, H. Identification of Loci Governing Soybean Seed Protein Content via Genome-Wide Association Study and Selective Signature Analyses. Front. Plant Sci. 2022, 13, 1045953. [Google Scholar] [CrossRef] [PubMed]
  36. Shook, J.M.; Zhang, J.; Jones, S.E.; Singh, A.; Diers, B.W.; Singh, A.K. Meta-GWAS for Quantitative Trait Loci Identification in Soybean. G3 GenesGenomesGenetics 2021, 11, jkab117. [Google Scholar] [CrossRef]
  37. Livak, K.J.; Schmittgen, T.D. Analysis of Relative Gene Expression Data Using Real-Time Quantitative PCR and the 2−ΔΔCT Method. Methods 2001, 25, 402–408. [Google Scholar] [CrossRef]
  38. Zhang, H.; Zhang, F.; Yu, Y.; Feng, L.; Jia, J.; Liu, B.; Li, B.; Guo, H.; Zhai, J. A Comprehensive Online Database for Exploring ∼20,000 Public Arabidopsis RNA-Seq Libraries. Mol. Plant 2020, 13, 1231–1233. [Google Scholar] [CrossRef]
  39. Karikari, B.; Wang, Z.; Zhou, Y.; Yan, W.; Feng, J.; Zhao, T. Identification of Quantitative Trait Nucleotides and Candidate Genes for Soybean Seed Weight by Multiple Models of Genome-Wide Association Study. BMC Plant Biol. 2020, 20, 404. [Google Scholar] [CrossRef]
  40. Lu, S.; Wang, J.; Chitsaz, F.; Derbyshire, M.K.; Geer, R.C.; Gonzales, N.R.; Gwadz, M.; Hurwitz, D.I.; Marchler, G.H.; Song, J.S.; et al. CDD/SPARCLE: The Conserved Domain Database in 2020. Nucleic Acids Res. 2020, 48, D265–D268. [Google Scholar] [CrossRef]
  41. Chen, C.; Chen, H.; Zhang, Y.; Thomas, H.R.; Frank, M.H.; He, Y.; Xia, R. TBtools: An Integrative Toolkit Developed for Interactive Analyses of Big Biological Data. Mol. Plant 2020, 13, 1194–1202. [Google Scholar] [CrossRef] [PubMed]
  42. Valliyodan, B.; Cannon, S.B.; Bayer, P.E.; Shu, S.; Brown, A.V.; Ren, L.; Jenkins, J.; Chung, C.Y.-L.; Chan, T.-F.; Daum, C.G.; et al. Construction and Comparison of Three Reference-Quality Genome Assemblies for Soybean. Plant J. 2019, 100, 1066–1082. [Google Scholar] [CrossRef] [PubMed]
  43. Carrera, C.; Martínez, M.J.; Dardanelli, J.; Balzarini, M. Environmental Variation and Correlation of Seed Components in Nontransgenic Soybeans: Protein, Oil, Unsaturated Fatty Acids, Tocopherols, and Isoflavones. Crop Sci. 2011, 51, 800–809. [Google Scholar] [CrossRef]
  44. Li, X.; Tian, R.; Shao, Z.; Zhang, H.; Chu, J.; Li, W.; Kong, Y.; Du, H.; Zhang, C. Genetic Loci and Causal Genes for Seed Fatty Acids Accumulation across Multiple Environments and Genetic Backgrounds in Soybean. Mol. Breed. 2021, 41, 31. [Google Scholar] [CrossRef] [PubMed]
  45. Sritongtae, C.; Monkham, T.; Sanitchon, J.; Lodthong, S.; Srisawangwong, S.; Chankaew, S. Identification of Superior Soybean Cultivars through the Indication of Specific Adaptabilities within Duo-Environments for Year-Round Soybean Production in Northeast Thailand. Agronomy 2021, 11, 585. [Google Scholar] [CrossRef]
  46. Bachlava, E.; Burton, J.W.; Brownie, C.; Wang, S.; Auclair, J.; Cardinal, A.J. Heritability of Oleic Acid Content in Soybean Seed Oil and Its Genetic Correlation with Fatty Acid and Agronomic Traits. Crop Sci. 2008, 48, 1764–1772. [Google Scholar] [CrossRef]
  47. Sung, M.; Van, K.; Lee, S.; Nelson, R.; LaMantia, J.; Taliercio, E.; McHale, L.K.; Mian, M.A.R. Identification of SNP Markers Associated with Soybean Fatty Acids Contents by Genome-Wide Association Analyses. Mol. Breed. 2021, 41, 27. [Google Scholar] [CrossRef]
  48. Gupta, S.K.; Manjaya, J.G. Advances in Improvement of Soybean Seed Composition Traits Using Genetic, Genomic and Biotechnological Approaches. Euphytica 2022, 218, 99. [Google Scholar] [CrossRef]
  49. Talukdar, A.; Shivakumar, M.; Chandra, S. Recent Advances in Breeding for Modified Fatty Acid Profile in Soybean Oil. In Quality Breeding in Field Crops; Qureshi, A.M.I., Dar, Z.A., Wani, S.H., Eds.; Springer International Publishing: Cham, Switzerland, 2019; pp. 159–172. ISBN 978-3-030-04609-5. [Google Scholar]
  50. Ning, L.; Kan, G.; Du, W.; Guo, S.; Wang, Q.; Zhang, G.; Cheng, H.; Yu, D. Association Analysis for Detecting Significant Single Nucleotide Polymorphisms for Phosphorus-Deficiency Tolerance at the Seedling Stage in Soybean [Glycine Max (L) Merr.]. Breed. Sci. 2016, 66, 191–203. [Google Scholar] [CrossRef]
  51. Fulton, T.M.; Beck-Bunn, T.; Emmatty, D.; Eshed, Y.; Lopez, J.; Petiard, V.; Uhlig, J.; Zamir, D.; Tanksley, S.D. QTL Analysis of an Advanced Backcross of Lycopersicon Peruvianum to the Cultivated Tomato and Comparisons with QTLs Found in Other Wild Species. Theor. Appl. Genet. 1997, 95, 881–894. [Google Scholar] [CrossRef]
  52. Hyten, D.L.; Pantalone, V.R.; Saxton, A.M.; Schmidt, M.E.; Sams, C.E. Molecular Mapping and Identification of Soybean Fatty Acid Modifier Quantitative Trait Loci. J. Am. Oil Chem. Soc. 2004, 81, 1115–1118. [Google Scholar] [CrossRef]
  53. Kim, H.-K.; Kim, Y.; Kim, S.T.; Son, B.G.; Choi, Y.W.; Kang, J.S.; Lee, Y.J.; Cho, Y.-S.; Choi, I.S. Analysis of Quantitative Trait Loci (QTLs) for Seed Size and Fatty Acid Composition Using Recombinant Inbred Lines in Soybean. J. Life Sci. 2010, 20, 1186–1192. [Google Scholar] [CrossRef]
  54. Peng, F.Y.; Weselake, R.J. Gene Coexpression Clusters and Putative Regulatory Elements Underlying Seed Storage Reserve Accumulation in Arabidopsis. BMC Genom. 2011, 12, 286. [Google Scholar] [CrossRef] [PubMed]
  55. Agarwal, P.; Kapoor, S.; Tyagi, A.K. Transcription Factors Regulating the Progression of Monocot and Dicot Seed Development. BioEssays News Rev. Mol. Cell. Dev. Biol. 2011, 33, 189–202. [Google Scholar] [CrossRef]
  56. Lu, L.; Wei, W.; Li, Q.-T.; Bian, X.-H.; Lu, X.; Hu, Y.; Cheng, T.; Wang, Z.-Y.; Jin, M.; Tao, J.-J.; et al. A Transcriptional Regulatory Module Controls Lipid Accumulation in Soybean. New Phytol. 2021, 231, 661–678. [Google Scholar] [CrossRef] [PubMed]
  57. Reszczyńska, E.; Hanaka, A. Lipids Composition in Plant Membranes. Cell Biochem. Biophys. 2020, 78, 401–414. [Google Scholar] [CrossRef] [PubMed]
  58. Pollard, M.; Shachar-Hill, Y. Kinetic Complexities of Triacylglycerol Accumulation in Developing Embryos from Camelina Sativa Provide Evidence for Multiple Biosynthetic Systems. J. Biol. Chem. 2022, 298, 101396. [Google Scholar] [CrossRef]
  59. Cao, D.; Cheng, H.; Wu, W.; Soo, H.M.; Peng, J. Gibberellin Mobilizes Distinct DELLA-Dependent Transcriptomes to Regulate Seed Germination and Floral Development in Arabidopsis. Plant Physiol. 2006, 142, 509–525. [Google Scholar] [CrossRef]
  60. Chen, M.; Du, X.; Zhu, Y.; Wang, Z.; Hua, S.; Li, Z.; Guo, W.; Zhang, G.; Peng, J.; Jiang, L. Seed Fatty Acid Reducer Acts Downstream of Gibberellin Signalling Pathway to Lower Seed Fatty Acid Storage in Arabidopsis. Plant Cell Environ. 2012, 35, 2155–2169. [Google Scholar] [CrossRef]
  61. Do, P.T.; Nguyen, C.X.; Bui, H.T.; Tran, L.T.N.; Stacey, G.; Gillman, J.D.; Zhang, Z.J.; Stacey, M.G. Demonstration of Highly Efficient Dual gRNA CRISPR/Cas9 Editing of the Homeologous GmFAD2–1A and GmFAD2–1B Genes to Yield a High Oleic, Low Linoleic and α-Linolenic Acid Phenotype in Soybean. BMC Plant Biol. 2019, 19, 311. [Google Scholar] [CrossRef]
  62. Kumar, V.; Vats, S.; Kumawat, S.; Bisht, A.; Bhatt, V.; Shivaraj, S.M.; Padalkar, G.; Goyal, V.; Zargar, S.; Gupta, S.; et al. Omics Advances and Integrative Approaches for the Simultaneous Improvement of Seed Oil and Protein Content in Soybean (Glycine max L.). Crit. Rev. Plant Sci. 2021, 40, 398–421. [Google Scholar] [CrossRef]
  63. Wu, N.; Lu, Q.; Wang, P.; Zhang, Q.; Zhang, J.; Qu, J.; Wang, N. Construction and Analysis of GmFAD2-1A and GmFAD2-2A Soybean Fatty Acid Desaturase Mutants Based on CRISPR/Cas9 Technology. Int. J. Mol. Sci. 2020, 21, 1104. [Google Scholar] [CrossRef]
  64. Wang, J.; Liu, Z.; Liu, H.; Peng, D.; Zhang, J.; Chen, M. Linum Usitatissimum FAD2A and FAD3A Enhance Seed Polyunsaturated Fatty Acid Accumulation and Seedling Cold Tolerance in Arabidopsis Thaliana. Plant Sci. 2021, 311, 111014. [Google Scholar] [CrossRef] [PubMed]
  65. Islam, N.; Bates, P.D.; Maria John, K.M.; Krishnan, H.B.; Zhang, Z.J.; Luthria, D.L.; Natarajan, S.S. Quantitative Proteomic Analysis of Low Linolenic Acid Transgenic Soybean Reveals Perturbations of Fatty Acid Metabolic Pathways. Proteomics 2019, 19, 1800379. [Google Scholar] [CrossRef] [PubMed]
  66. Abdelghany, A.M.; Zhang, S.; Azam, M.; Shaibu, A.S.; Feng, Y.; Qi, J.; Li, Y.; Tian, Y.; Hong, H.; Li, B.; et al. Natural Variation in Fatty Acid Composition of Diverse World Soybean Germplasms Grown in China. Agronomy 2020, 10, 24. [Google Scholar] [CrossRef]
Figure 1. The linoleic acid content and linolenic acid content of soybean in different years were analyzed for distribution and correlation. These analyses were conducted for three specific years: (A) 2019, (B) 2020, and (C) 2021. Symbols ** represent levels of statistical significance at p < 0.01.
Agriculture 13 02250 g001
Figure 2. Genome-wide association analysis was conducted on linoleic acid content in three years based on GLM and MLM models, and the results of correlation analysis using the two models were visualized using Manhattan plot and QQ plot. (A) 2019, (B) 2020, and (C) 2021.
Agriculture 13 02250 g002
Figure 3. Genome-wide association analysis was performed on linolenic acid content in three years based on GLM and MLM models, and the results of the correlation analysis using the two models were visualized using Manhattan plots and QQ plots. (A) 2019, (B) 2020, and (C) 2021.
Agriculture 13 02250 g003
Figure 4. Data on the count of noteworthy SNP locations linked to linoleic acid and linolenic acid between 2019 and 2021 were collected. (A) The total number of significant SNP loci for linoleic acid in 2019, 2020, and 2021 using GLM model, MLM model; (B) the number of significant SNP sites obtained in linolenic acid in 2019, 2020, and 2021 using GLM model, and MLM model in total.
Agriculture 13 02250 g004
Figure 5. Conducting enrichment analysis and functional annotation of genes located within the vicinity of a significant SNP linked to the levels of linoleic acid and linolenic acid. (A) Genes correlated with the levels of linoleic acid in soybeans. (B) Genes associated with the levels of linolenic acid in soybeans.
Agriculture 13 02250 g005
Figure 6. Validation of relative expressions of candidate genes in some materials of the population. (A) Relative expression of GmGA20ox in pods; (B) relative expression of GmGA20ox in seeds; (C) relative expression of GmFAD3 in pods; and (D) relative expression of GmFAD3 in seeds. Symbols ***, **, and * represent levels of statistical significance at p < 0.001, p < 0.01, and p < 0.05, respectively.
Agriculture 13 02250 g006
Figure 7. Candidate gene expression profile data in RNA-seq. (A) GmGA20ox expression in roots, pods, and seeds; (B) GmFAD3 expression in roots, pods, and seeds. Symbols *** and **, represent levels of statistical significance at p < 0.001 and p < 0.01, respectively.
Agriculture 13 02250 g007
Figure 8. Cis-acting element predictions, conserved structural domain prediction of candidate gene promoter region. (A) Visualization of candidate gene promoter region cis-acting element prediction; (B) visualization of predicted conserved structural domains of candidate genes.
Agriculture 13 02250 g008
Table 1. Descriptive statistics for traits of linoleic and linolenic acid content in soybeans in a three-year environment. Symbols *** represent levels of statistical significance at p < 0.001.
TraitYearsMeanRangeSDCV(%)H2 (%)F Values from ANOVA
LineEnv.Line × Env.
Linoleic Acid201958.42 ± 0.2846.07–70.734.930.08467.00 2.00 ***0.151
202058.40 ± 0.2945.07–70.524.880.083
202156.62 ± 0.2347.02–67.983.880.068
Linolenic Acid20198.01 ± 0.161.39–15.772.660.33273.20 2.00 ***2.00 ***0.41
20207.91 ± 0.152.39–15.462.590.327
20216.72 ± 0.112.16–12.271.910.285
Disclaimer/Publisher’s Note: The statements, opinions and data contained in all publications are solely those of the individual author(s) and contributor(s) and not of MDPI and/or the editor(s). MDPI and/or the editor(s) disclaim responsibility for any injury to people or property resulting from any ideas, methods, instructions or products referred to in the content.