Article

Impact of Allelic Variation in Maturity Genes E1E4 on Soybean Adaptation to Central and West Siberian Regions of Russia

1
Institute of Cytology and Genetics SB RAS, Lavrentiev Av. 10, 630090 Novosibirsk, Russia
2
Kurchatov Genomics Center, Institute of Cytology and Genetics SB RAS, Lavrentiev Av. 10, 630090 Novosibirsk, Russia
3
Siberian Federal Scientific Centre of Agro-BioTechnologies RAS, Tsentral’naya 2b, Krasnoobsk, 630501 Novosibirsk, Russia
4
FSBSI Federal Scientific Center of Legumes and Groat Crops, Molodozhnaya St. 10, 302502 Orel, Russia
*
Author to whom correspondence should be addressed.
Agriculture 2023, 13(6), 1251; https://doi.org/10.3390/agriculture13061251
Submission received: 16 May 2023 / Revised: 11 June 2023 / Accepted: 13 June 2023 / Published: 15 June 2023
(This article belongs to the Special Issue Advances in Soybean Genetics and Breeding)

Abstract

:
Four maturity genes, namely, E1, E2, E3 and E4, have been found to play major roles in controlling the flowering and maturity time of soybean. Which genotypes of E1E4 genes provide effective adaptation to the varied conditions of Russia are unknown. To clarify this issue, we have studied the allele variation in soybean E1E4 genes in terms of both flowering and maturity time under the natural day-length conditions of Central Russia and Western Siberia in a collection of 176 soybean accessions, including 142 Russian and 34 foreign accessions. As a result, a high frequency of previously determined E1E4 alleles has been identified. The field experiment showed that genotypes with all recessive alleles from e1-nl/e2/e3/e4 and e1-as/e2/e3/e4 provide the effective adaptation of soybean to the mentioned conditions. Cultivars with these genotypes are considered to be most suitable for cultivation in Central Russia and Western Siberia.

1. Introduction

Cultivated soybean, Glycine max L. is a short-day plant with very high sensitivity to the photoperiod. Under long-day conditions in the northern latitudes, photoperiod-sensitive cultivars delay flowering and the subsequent phases of development and usually are not capable to reach maturity before the first frost. Among the loci that affect the duration of phases from germination to flowering/maturity, the E1E4 loci have the strongest effect, providing adaptation to different latitudes [1,2,3]. The corresponding genes and alleles, which determine the variation in sensitivity to photoperiod, have been identified in various soybean cultivars. It is known that low sensitivity to photoperiod, leading to early flowering and maturity, is associated with recessive, usually non-functional alleles of the E1E4 genes that arise due to mutations [4,5,6,7,8,9].
E1 is a legume-specific transcription factor containing a B3 domain [7]. There are two non-functional alleles, e1-nl and e1-fs, the first of which results from a 130 kb deletion encompassing the whole gene and the second from a single-nucleotide deletion leading to a frameshift. There is also a semi-functional e1-as allele containing a missense mutation within the nuclear localization signal [7]. Gene E2 is an ortholog of GIGANTEA from Arabidopsis. The recessive allele e2-ns encodes a truncated protein due to a nonsense mutation in exon 10 [6]. E3 and E4 genes encode proteins of photoreceptors GmPhyA3 and GmPhyA2, respectively, in relaxation to phytochrome A [4,5]. The dominant allele E3-Mi represents the normal phytochrome A gene, whereas E3-Ha contains a 2.6 kb insertion downstream exon 3 [5]. Recessive alleles e3-tr, e3-fs, and e3-ns arise due to a 13.3 kb deletion downstream exon 3, a single-nucleotide deletion in exon 1, and a nonsense mutation in exon 3, respectively [5,8]. Recessive allele e4-SORE-1 displays the insertion of the Ty1/copia-like retrotransposon in exon 1 [4]. The e4-kes, e4-tsu, e4-kam and e4-oto alleles have single-nucleotide deletions in different positions of exon 1 and exon 2 [9].
The association of natural variation in E1E4 genes with the duration of the main developmental stages after adaptation to different latitudes has been studied in various germplasm collections in China [2,3], America [10] and Europe [1]. Soybean was domesticated in China about 5000 years ago and is now cultivated worldwide [11]. In Russia, soybean has been cultivated since 1927 in the Far East of the former USSR, where until 2010 almost all cultivated areas of this crop were concentrated. At present, there is growing interest in the cultivation of soybean in other Russian regions, including the European part and even Western Siberia [12]. However, further intensification of the soybean breeding in these areas is limited by the almost complete lack of data about the natural variation in the E1E4 genes of Russian cultivars and impact of this variation on the flowering and maturity time under the field conditions of Russia.
Here, we examined the allele variation in E1E4 genes in 176 soybean accessions of predominantly domestic breeding and analyzed the association between established E1E4 genotypes and the duration of flowering and maturity in the regions of Central Russia and Western Siberia. This allowed us to identify the genotypes which could provide the most effective plant adaptation to different conditions of both regions.

2. Materials and Methods

2.1. Plant Material

The collection of 165 soybean accessions, including 105 breeding lines and 59 cultivars, were obtained from the Siberian Federal Scientific Center of Agro-BioTechnologies of the Russian Academy of Sciences (SFSC RAS, Novosibirsk, Russia). Eleven soybean cultivars were kindly provided by the Federal Scientific Center of Legumes and Groat Crops (FSC LGC, Orel, Russia). From 176 accessions, 97 accessions originated from the Novosibirsk region, whereas 45 and 34 accessions had another Russian and foreign origin, respectively. The characteristics of all studied accessions are presented in Table S1.

2.2. Field Experiments

The field experiment was carried out in 2021–2022 in Novosibirsk (Western Siberia) and Orel (Central Russia) regions. The coordinates of the locations were 54°55′ N 82°59′ E and 53°03′ N 36°03′ E, respectively.
The field experiment was conducted in accordance with the local for each region technique. In Orel, the accessions were planted with three replicates on plots consisting of four two-meter rows. The distance between plants in a row was 5 cm, the row spacing was 45 cm. The NPK fertilizer (N: 15%; P: 26%; K: 26%) was contributed in doses of 15 kg ha−1 prior to autumn plowing. The NPK fertilizer (N: 15%; P: 15%; K: 15%) was contributed in doses of 20 kg ha−1 prior to planting. The sowing dates were 22 May and 26 May in 2021 and 2022, respectively. In the Novosibirsk region, the accessions were planted with three replicates on plots consisting of single two-meter rows. The distance between plants in a row was 5 cm and the row spacing was 70 cm. Fertilizers were not applied. The sowing dates were 26 May and 24 May in 2021 and 2022, respectively. The location of replicates in both regions was the systematic method.
The emergence growth stage was noted when 75% of plants in the plot had a hypocotyl with cotyledons above the soil surface. The flowering time (DTF, days from emergence to flowering) were recorded when 10% of the plants in the plot produced first flower. The maturity time (DTM, days from emergence to maturity) were recorded when 75% of the pods in the plot have attained their final color.

2.3. Genomic DNA Extraction PCR Amplification and Restriction

Genomic DNA was extracted using a CTAB method from 3–4-day-old seedlings grown in Petri dishes [13]. The previously developed molecular markers used for genotyping are presented in Table S2 [4,5,6,7,8,9,14].
The PCR mixture with a total volume of 25 µL contained 10 mM Tris-HCl, pH 8.5, 50 mM KCl, 0.1% Tween 20, 2 mM MgCl2, 0.25 mM of each primer, 50–100 ng of DNA, and 1 U Taq DNA polymerase (BiolabMix, Novosibirsk, Russia). PCR protocol: 5 min at 95 °C; 35 cycles (95 °C 10 s; 50–60 °C, 15 s; 72 °C, 15–40 s); 1 min. at 72 °C.
For CAPS markers, DNA restriction digestion was carried out in a reaction mixture of 20 µL, which included 8 µL of PCR products, 2 µL of 10× restriction buffer and 1 U restriction enzyme (SibEnzyme, Novosibirsk, Russia). The mixture was incubated overnight at the optimum temperature for each enzyme.
The PCR and restriction products were separated in a 1–2% agarose gel with ethidium bromide. The results of electrophoresis were visualized and photographed in UV using Gel Doc™ XR+ (Bio-Rad Laboratories, Inc., Hercules, CA, USA).

2.4. Statistical Analyses

Analysis of variance (ANOVA) was performed in the statistical software R (Version 4.1.2) based on four factors including E1, E4 loci, year and location (https://www.r-project.org/; accessed on 17 November 2021). The ANOVA was conducted by using the R basic function «aov». The multiple Games–Howell test with Holm–Bonferroni correction was conducted using the function «pairwise_comparisons» from the «ggstatsplot» package [15]. The average between three replicates of DTF and DTM was used for statistical analysis.

3. Results

3.1. Genotyping of E1–E4

3.1.1. Distribution of E1E4 Alleles in Different Origin Groups

Previously, different alleles were identified in foreign soybean material using allele-specific DNA markers (Table S2) [4,5,6,7,8,9,14]. Here, we studied the distribution of different alleles of E1E4 genes among 176 soybean accessions, including cultivars and breeding lines of predominantly Russian origin. The results of the analysis are presented in Table S1. We studied the allele frequency in three groups of soybean accessions depending on the region of origin: A—from the West Siberia (Novosibirsk and Omsk regions); B—from other Russian regions; C—from other countries (Figure 1).
Each of the mentioned groups, namely, A, B and C, have a high representation of the two recessive E1 alleles: e1-as and e1-nl (Figure 1). In group A, 20.8 and 78.2% of accessions, respectively, carry these alleles and 1 cultivar (SibNIISKhoz-6) has the recessive allele e1-fs. Accessions from group C only carry the recessive alleles e1-as and e1-nl (32.4 and 67.6%, respectively). The dominant allele E1 is revealed in 2 cultivars (Zakat and Persona) of the B group, whereas the rest of the cultivars contains e1-as and e1-nl (56.1 and 39%, respectively).
For the E2 gene, all accessions of the A group carry the recessive allele e2-ns. The dominant allele E2 occurs in group B and C in 12.2 and 17.6% of accessions, respectively (Figure 1).
For the E3 gene, among the A and B groups, the recessive allele e3-fs prevails (87.1% and 56.1%, respectively); the e3-tr allele is represented to a lesser extent (6.9% and 31.7%). Single accessions from these groups carry the recessive alleles e3-ns and e3-mix (mix of alleles e3-tr and e3-fs) and the dominant allele E3-Ha. Unlike Russian accessions, those of group C mainly carry the recessive allele e3-tr (52.9%) and 6 cultivars have the dominant allele E3-Ha (Figure 1).
The dominant allele E4 has been identified in all groups, with the highest frequency expressed in groups B and C (48.8 and 44.1%, respectively). The recessive alleles e4-kes and e4-SORE-1 are represented in all groups, but the recessive allele e4-SORE-1 prevails among A group of accessions (66.3%) (Figure 1).
Thus, the studied Russian accessions of soybean are characterized by an almost complete predominance of the recessive alleles of the E1E4 genes.

3.1.2. Established E Genotypes and Their Distribution in Russian Accessions

In all collections, 25 genotypes of E1E4 genes have been identified. Since some of the recessive alleles of gene E1 (e1-fs; e1-nl), E3 (e3-tr; e3-fs; e3-ns) and E4 (e4-SORE-1, e4-kes) have a similar effect on the phenotype, only 11 genotypes could be distinguished based on their response to photoperiod. Most common genotypes are represented by fully recessive e1/e2/e3/e4 and monodominant e1/e2/e3/E4 found in 123 (69.9%) and 32 (18.2%) of accessions, respectively. These genotypes, depending on the type of recessive allele e1 (e1-nl or e1-as), can be divided into two subtypes. Among the completely recessive genotype, these subtypes were found in 49.4% and 20.5% of accessions, respectively. To a lesser extent, these subtypes were presented in the group of the E4 monodominant genotype (10.8% and 7.4%) (Table 1).
In this study, E1E4 genotypes were determined in four European varieties that were previously studied: Lissabon, Malaga, Sultana, Fiskeby V [1,16]. Data comparison showed the correspondence between the genotypes identified earlier and in the present study, with the exception of one allele. It has already been established that Malaga from the collection of the FSC LGC (Orel) carries the e1-as allele instead of e1-nl [1]. Additionally, genotypes were confirmed for the E3 gene in three Canadian cultivars, namely, Maple Amber, Gentelmen and Morsoy, which were previously studied for this gene [17]. However, the cv. Maple Presto maintained at the SFSC (Novosibirsk) carries the e3-fs allele instead of the e3-tr allele ound in previous studies. With the exception of the above varieties, all the remaining 171 soybean varieties and lines were identified for the first time during this study.
We compared the E1E4 genotypes of studied Russian cultivars with their origin region. Cultivars from regions located between 58–52° N mainly carry the e1-as/e2/e3/e4 and e1-nl/e2/e3/e4 genotypes, but there are also varieties with e1-nl/e2/e3/E4. Cultivars from regions below 51° N carry genotypes with the dominant allele E4, on the background of e1-as. Only two cultivars from the Amur region (50°16′ N), namely, Zakat and Persona, carry the dominant allele E1. Belgorodskaya 48, which is a standard cultivar in the Belgorod region (50°36′ N), has the dominant allele E3-Ha (Table S1).
In accessions from group A, originating from Western Siberia, we found only three genotypes: e1-nl/e2/e3/e4, e1-as/e2/e3/e4 and e1-nl/e2/e3/E4. The first two were found in 72.1% and 20.4% of accessions, respectively, while E4 monodominant genotype was found in 7.5%.

3.2. Field Experiments

The duration of flowering and maturity time was studied for 176 accessions cultivated in the field in the years 2021 and 2022 under the natural daylight conditions of the Orel (53°03′ N 36°03′ E) and Novosibirsk regions (54°55′ N 82°59′ E). Due to the drought in early June 2022, the emergence stage in Novosibirsk was a week later than in 2021. In general, soybean accessions flowered in Orel earlier than in Novosibirsk in 2021–2022 (Figure 2). However, accessions in Orel only matured earlier in 2021, but in 2022 they matured later than in Novosibirsk (Figure 3). This can be explained by the unfavorable conditions for soybean maturity in 2022 in Orel, namely: low temperature in the first decade of September, as well as extremely rainy weather in October (the sum of rainfall was ~250% of the average value for many years of observations). Nevertheless, we consider the data from this year further, since the relative difference between genotypes in the duration of developmental stages should be preserved. Additionally, in Novosibirsk, during the two years of the field experiments, some accessions with genotypes e1-as/e2/e3/e4 and e1-nl/e2/e3/e4 did not reach full maturity by the end of the growing season (Table S1).

3.2.1. Association of E Genotypes with the Flowering Time

In both Orel and Novosibirsk, later DTF (days from emergence to flowering) was characteristic of cultivars carrying the partially functional e1-as allele in comparison with cultivars containing e1-nl. Of the four most common genotypes, in both regions e1-nl/e2/e3/e4 and e1-nl/e2/e3/E4 flowered earlier than corresponding genotypes with e1-as instead of e1-nl. In 2022, in Orel and Novosibirsk the E4 monodominant genotypes flowered later than the fully recessive genotypes. However, in 2021, in Orel, unlike Novosibirsk, genotypes with dominant E4 alleles flowered earlier, especially on the background of e1-as. Several accessions carrying the dominant allele E2 on a background of e1-as/e3/e4, e1-nl/e3/e4 and e1-nl/e3/E4 flowered 1–2 days later than genotypes with recessive allele e2 (Figure 2).

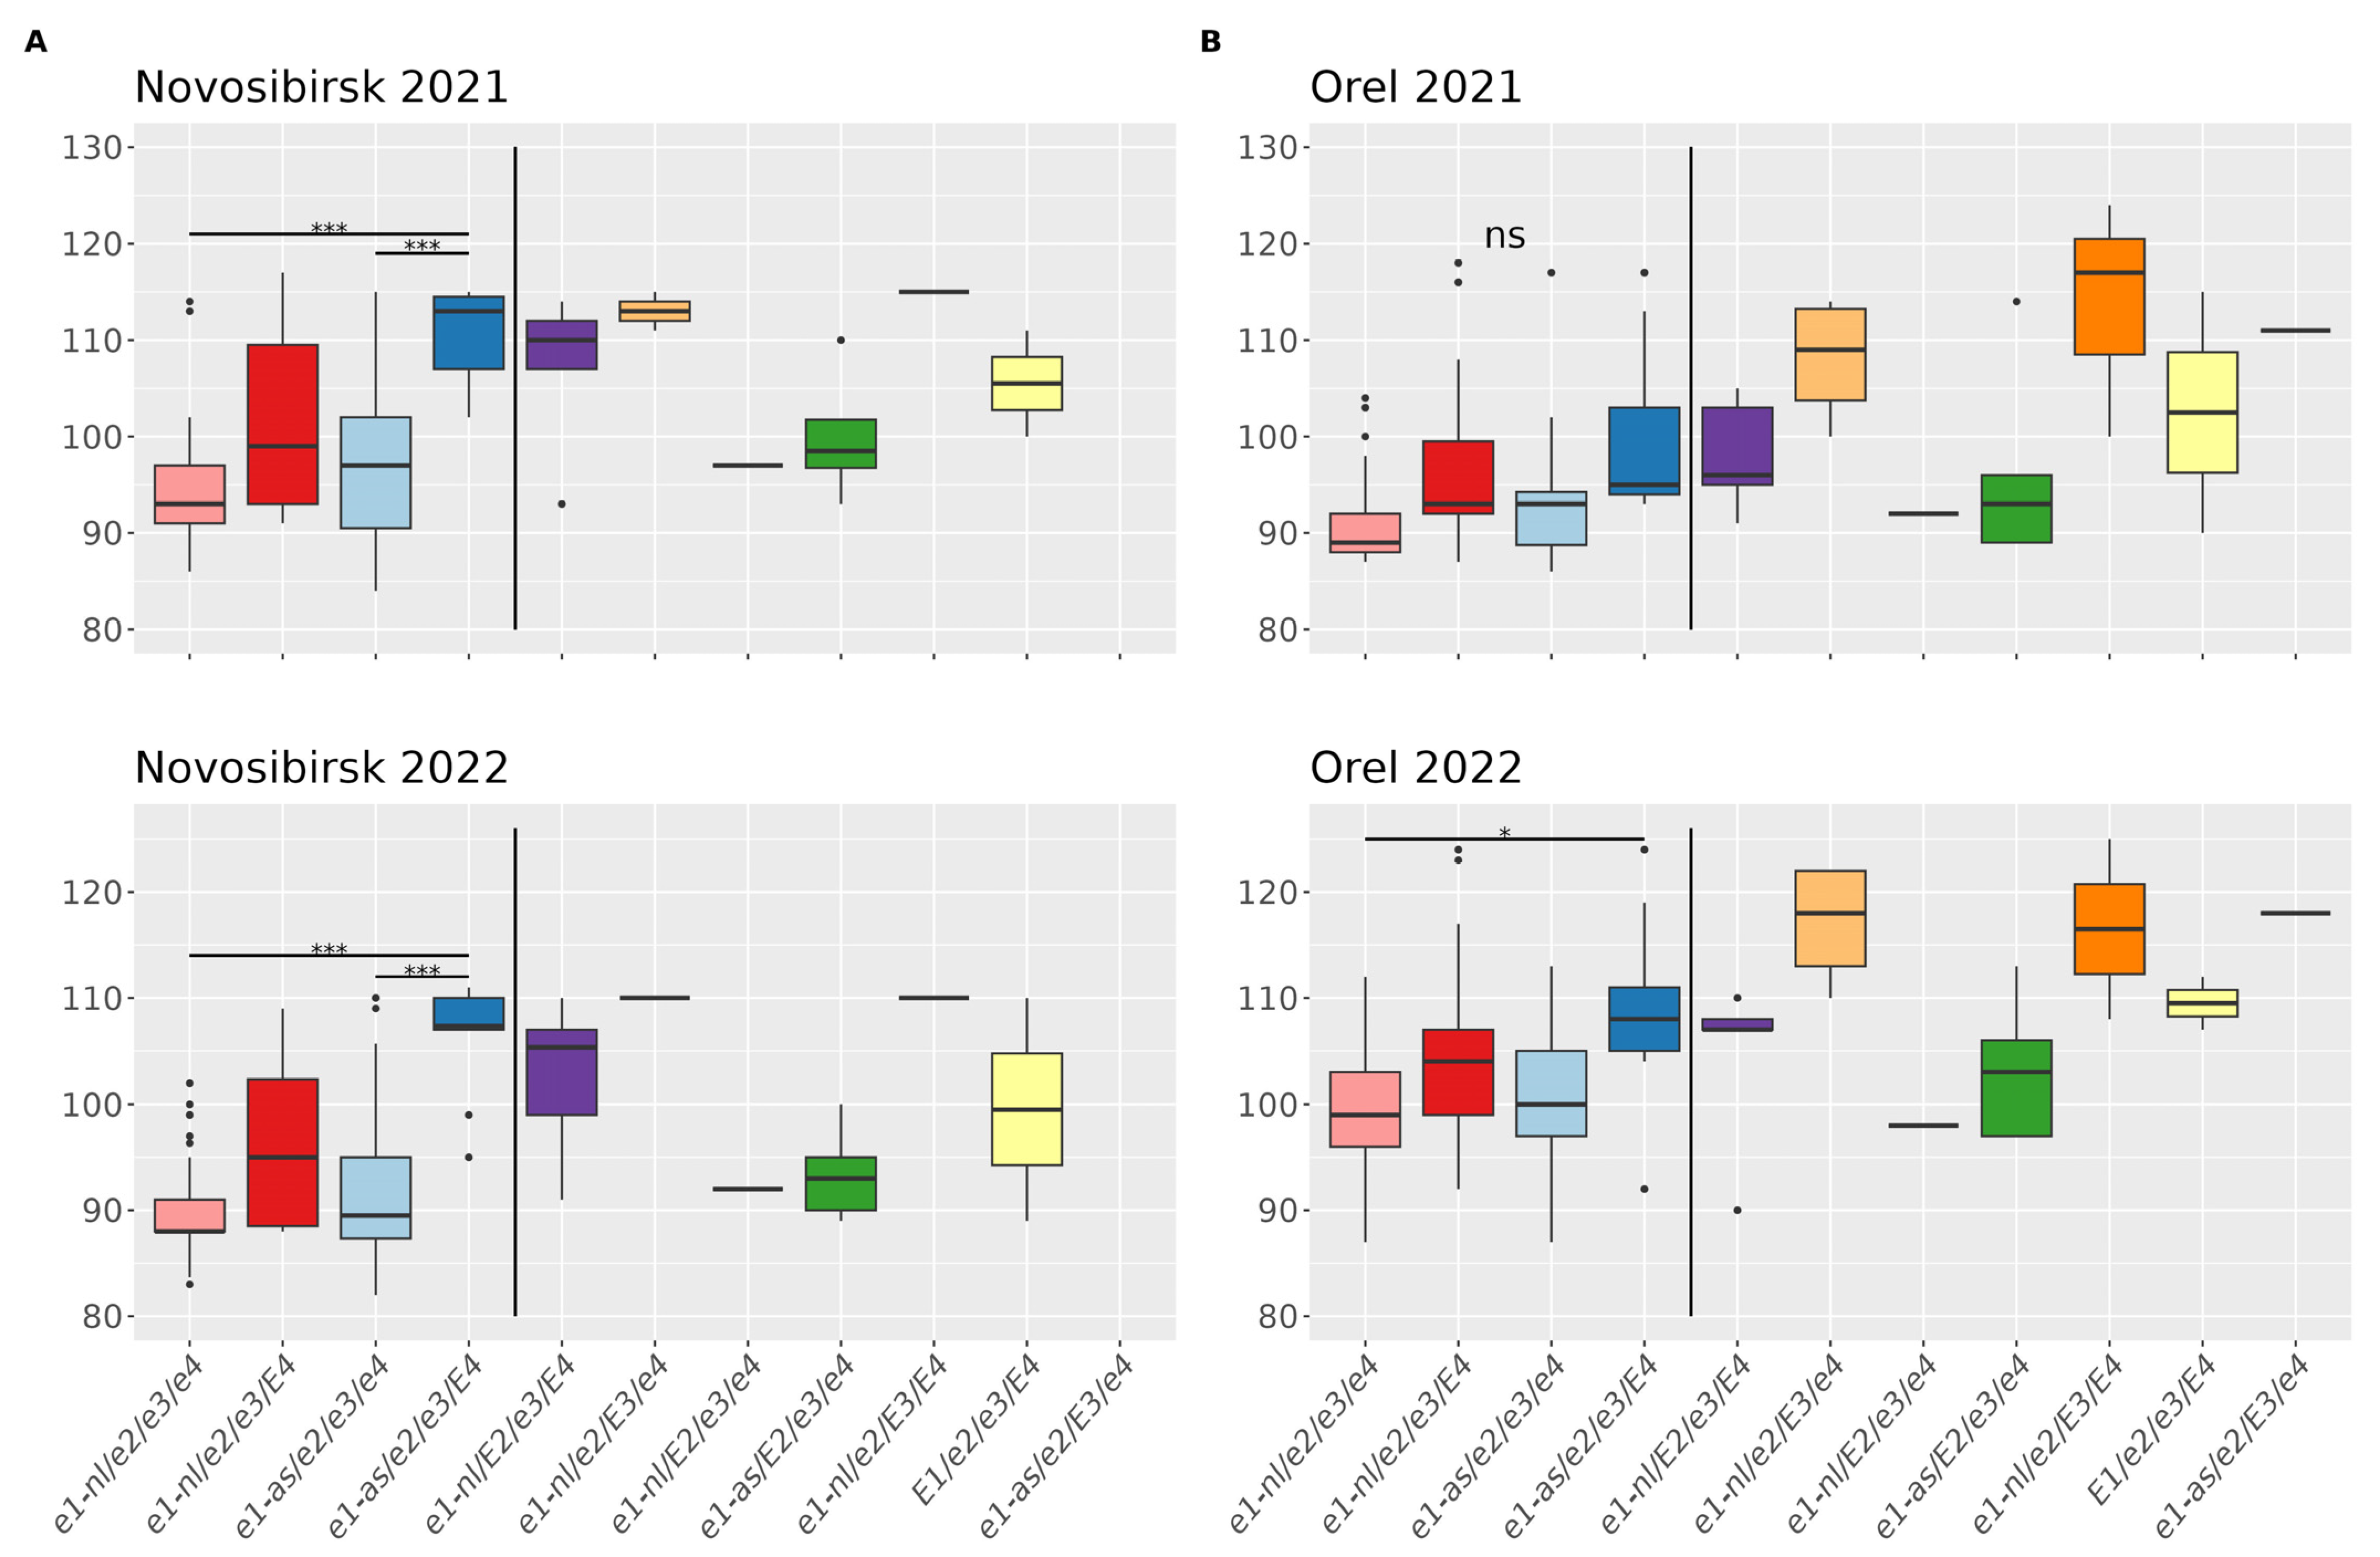
3.2.2. Association of E Genotypes with the Maturity Time

Accessions with genotype e1-nl/e2/e3/e4 had the shortest DTM (days from emergence to maturity) in the two years examined in both Novosibirsk and Orel. In both regions, the DTM increased in the following sequence of genotypes: e1-nl/e2/e3/e4 < e1-as/e2/e3/e4 < e1-nl/e2/e3/E4 < e1-as/e2/e3/E4. The presence of the dominant E3 allele has the strongest effect on maturity. In Orel, the several accessions with genotypes e1-as/e2/E3/e4, e1-nl/e2/E3/e4 and e1-nl/e2/E3/E4 had the longest DTM for two years. Most accessions with these genotypes in the Novosibirsk did not reach full maturity by the end of the growing season (Figure 3).

3.3. Statistical Analysis

Accessions carrying the dominant allele E1, E2 and E3 were excluded from the statistical analysis due to their small number. For analysis, factors E1 and E4 had two independent variables (E1: e1-as/e1 (e1-nl, e1-fs); E4: E4/e4 (e4-kes, e4-SORE-1)) since some recessive alleles have the same effect on the phenotype. We analyzed the effect of four factors (E1, E4, year and location) on DTF and DTM using ANOVA for each region separately and combined. As a result, we found that all these factors were significantly associated (p value < 0.01) with the DTF and DTM (Table 2). We used Games–Howell post hoc test due to the unequal sample size. The results are shown in Figure 2 and Figure 3.

4. Discussion

4.1. Distribution of E1–E4 Alleles among Russian Accessions

Soybean is a thermophilic and moisture-loving culture. The average temperature of its growth conditions should be 20–30 °C, especially at the flowering and pod maturation stages, which require a temperature no less than 18–22 °C. In addition, this species is very sensitive to photoperiod and starts flowering under short-day conditions, a period that falls on an unfavorable autumn in the conditions of Russia. Nevertheless, the breeders’ efforts have made it possible to significantly expand the cultivation area of this crop. Currently, 15 centers are engaged in soybean breeding in Russia, in which unique domestic varieties have been obtained, approved for cultivation in 51 regions of the country, including the Far East, Southern and Central (Chernozem) regions, the Volga region and even Ural and Western Siberia. A number of modern cultivars ripen in 90–120 days in Ryazan (54°37′ N), Belgorod (50°36′ N), Orel (52°57′ N) and other regions of Central Russia. Climatic conditions in the Novosibirsk region, in contrast to the European part of Russia, are characterized by significant fluctuations in average monthly and absolute temperatures, long, cold winters and relatively short, warm summers. The average temperature in July is 18–20 °C. Frosts usually begin in the second half of September and run out at the end of May. The duration of the frost-free period is 120 days. These conditions are not optimal for such a crop as soybean. Therefore, the main requirement for cultivars suitable for this region is the shortest maturity time. Cultivars and breeding lines that meet this requirement were obtained first of all and maintained in the SFSC RAS. The accessions created in this center comprise about ~50% of the collection studied in this study.
In general, our results show a high frequency of distribution of the recessive alleles E1E4 in Russian cultivars, especially, in West Siberian accessions. Consistent with previous studies [1,2,9], this confirms the key role of these genes in soybean adaptation to northern latitudes (Table S1; Figure 1).
E1 is one of the main regulators of soybean flowering, which, through phytochrome A genes, perceives the signal of the photoperiod and circadian rhythms and indirectly or directly transmits it to the main soybean florigens GmFT2a and GmFT5a [7,18,19,20]. Xia et al. [7] showed that, under artificial daylight (16 h light/8 h dark) conditions, the difference between genotypes carrying E1 and e1-nl allele by flowering time was up to ~40 days, and the genotypes with e1-as had an intermediate phenotype. In natural light conditions, E1 also affects the length of soybean flowering time [2,3]. The recessive alleles e1-nl and e1-as predominate in the studied Russian accessions (Figure 1). A high frequency of the e1-nl allele has also been established for European varieties [1], which distinguishes them from Chinese [2,3] and American [10] accessions, in which non-functional allele e1-nl is not common.
E2 delays soybean flowering under long-day conditions through the repression of GmFT2a [6]. The recessive allele e2-ns is predominant in all studied groups, especially in accessions from Western Siberia, all of which carry this allele (Figure 1). Five Russian cv. Statnaya, Okskaya, Rosinka, Severnaya-5 and Soer-5 carry the dominant allele E2. The high frequency of the e2-ns allele is also characteristic of cultivars from Europe [1] and China [2,3], while in America the dominant allele E2 is common [10].
Phytochromes PHYA3 and PHYA2 (E3 and E4, respectively) positively control the E1 gene at the transcriptional and post-transcriptional levels under long-day conditions [18]. Under natural light conditions, especially in northern latitudes, the E3 and E4 genes have a strong effect on the flowering and maturity time [3,8]. Almost all studied Russian varieties and breeding lines have one of the three E3 recessive alleles: e3-fs, e3-tr or e3-ns and only cv. Belgorodskaya 48 has the dominant allele E3-Ha.
Two recessive alleles e4-kes and e4-SORE-1 were found in the Russian accessions. In foreign collections, these alleles are rare and characteristic of cultivars from the northern latitudes, for example, in the Swedish cv. Fiskeby [2,9]. Seven breeding lines from SFSC (Novosibirsk) have the dominant allele E4 at the e1-nl background (Figure 1).

4.2. The Effect of Established E Genotypes on Flowering and Maturity

According to the ANOVA results, all the studied factors exert influence on DTF and DTM. For each region separately, the “year” factor affects DTF and DTM more strongly than the E1 and E4 genes, which was apparently due to the atypical weather conditions in Orel in 2022 and the drought in early June in Novosibirsk in 2022. The result of the “two years × two location” model shows that the E1 and E4 genes are the main factors influencing DTM. DTF is most dependent on the “location” factor (Table 2).
The studied collection contains a sufficient number of accessions carrying one of the four genotypes: e1-nl/e2/e3/e4, e1-as/e2/e3/e4, e1-nl/e2/e3/E4 and e1-as/e2/e3/E4. The first genotype with all four completely non-functional mutant alleles has the shortest DTF and DTM in both regions for two years. The second most common genotype e1-as/e2/e3/e4 blooms and matures later than e1-nl/e2/e3/e4 (Figure 2 and Figure 3). This is likely due to the residual effect of the e1-as allele, although its expression should be strongly suppressed in the e3e4 genetic background [7]. The influence of the E1 gene on DTF and DTM is also confirmed by ANOVA (Table 2).
The genotypes with dominant E2 (e1-as/E2/e3/e4, e1-nl/E2/e3/e4, e1-nl/E2/e3/E4) have only a bit longer DTF than the corresponding genotypes with recessive e2 in both Novosibirsk and Orel (Figure 2). This fact is not consistent with the data of Watanabe et al. [6] who established a stable additive effect of E2 on the flowering date up to ~5 days in Japan at latitudes of 43° N and 36° N. First, this can be explained by an influence of other loci that control the flowering time (Tof5 [21], Tof8 [22] Tof18 [23], E1lb [24]) or suppress the phenotypic effect of E2. Recently, Su et al. found qR1-2 QTL that reduces E2 gene expression and its effect on flowering time [25]. The second possible reason is the presence of an unidentified recessive e2 allele. Thus, in Korean cultivars, three new SNPs were found in the E2 gene, one of which led to the formation of a non-functional allele [26]. Thirdly, environment can influence the phenotypic effect of E2. For example, Liu et al. found a weaker effect of the E2 gene in northern China compared to the southern region [3].
Although E3 gene is not common in our collection, nevertheless, the genotypes e1-as/e2/E3/e4, e1-nl/e2/E3/e4 and e1-nl/e2/E3/E4 flowered later than e1-as/e2/e3/e4, e1-nl/e2/e3/e4 and e1-nl/e2/e3/E4 in both Novosibirsk and Orel (Figure 2). Additionally, E3 genotypes have, on average, the longest DTM in the studied regions over two years (Figure 3). Five of the eight genotypes with dominant E3 in the Novosibirsk region in 2021–2022 did not reach full maturity by the end of the growing season (Table S1). However, three accessions with the dominant E3 allele fully matured in this region, possibly due to the presence of other genetic factors affecting the E3 gene.
Under the conditions of 2021 in the Orel region, completely recessive and E4 monodominant genotypes flowered at about the same time, in contrast to the Novosibirsk region, where genotypes with the dominant E4 bloomed later, especially on the e1-as background. However, in 2022, a different effect of these genotypes on DTF was also observed in Orel (Figure 2) Statistically, E4 is significantly associated with DTF and DTM in the studied regions, but its effect on DTF in Orel is lower than in Novosibirsk (Table 2). The different effect of the E4 gene on the flowering time in both regions may be due to different factors having impact on this gene such as day length, temperature [1,27,28,29], and the red-to-far-red ratio (R:FR) of light [18,30,31]. The established positive effect of the E4 gene on DTF and DTM is also consistent with previous results [8].

4.3. Optimal Genotypes for the Studied Regions

In the group of West Siberian accessions, three genotypes e1-nl/e2/e3/e4, e1-as/e2/e3/e4 and e1-nl/e2/e3/E4 were established. Created for the conditions of Western Siberia, 8 cultivars from the Novosibirsk and Omsk regions have the first two genotypes (Table S1). The first one is preferable for Western Siberia, since the accessions with this genotype almost always fully mature, regardless of the year and region, and have the shortest DTM (Figure 3). Interestingly, Western Siberia is similar to Sweden in terms of environment and day length, and six studied accessions originating from this country also have the e1-nl/e2/e3/e4 and e1-as/e2/e3/e4 genotypes (Table S1). In general, the first and second genotypes will be the optimal in the northern latitude regions of Russia (54° and above), while cultivars with the dominant E4 cannot be excluded, but only in combination with e1-nl.
Although in Orel all genotypes have reached full maturity, soybean DTM should nevertheless not exceed 110 days for this region. Accessions carrying the dominant allele E3 or E1 with E4 do not correspond to this requirement (Figure 3). Cultivars originating from the Ulyanovsk, Briansk and Saratov regions have the same genotypes as the accessions from West Siberia. Only two studied cultivars from Central Russia have the genotypes e1-as/e2/e3/E4 and e1-nl/E2/e3/E4 (Table S2). We believe that for this region located between 54–50° N, suitable genotypes may include those preferable for Western Siberia and sometimes those having one dominant gene (E2 or E4).
Cultivars from the Far Eastern Amur Region carry all the above designated genotypes characteristic of northern latitudes, and only one breeding line from this region has the bi-dominant genotype e1-nl/e2/E3/E4 (Table S1). The same genotypes are found in cultivars of the northern ecotype of China bordering Far East of Russia [3]. Foreign cv. Sirelia, Sultana and Kassidy are recommended for cultivation in the North Caucasus region (~41°) of Russia (https://gossortrf.ru/; accessed on 9 February 2023). Here, we identified their genotypes e1-nl/e2/E3/E4, e1-nl/e2/E3/e4 and e1-nl/e2/E3/E4, respectively. Based on all the data, we believe that varieties carrying the dominant allele E3 (on the genetic background e1-as/e4, or e1-nl/E4) are suited for Russian regions at the level of 50° N latitude or below.

Supplementary Materials

The following supporting information can be downloaded at: https://www.mdpi.com/article/10.3390/agriculture13061251/s1, Table S1: Soybean cultivars analyzed in the current study and their name, E1E4 allele, origin country, origin region, accession type (breeding line or cultivars), DTF and DTM in Novosibirsk and Orel in 2021–2022; Table S2: Molecular markers for E1E4 genotyping with sequences, T° annealing, restriction enzymes, source of marker.

Author Contributions

Conceptualization, R.P. (Roman Perfil’ev), A.S. and E.S.; methodology, V.P., D.P., R.P. (Revmira Polyudina) and E.S.; software, R.P. (Roman Perfil’ev); validation, R.P. (Roman Perfil’ev); formal analysis, R.P. (Roman Perfil’ev); investigation, R.P. (Roman Perfil’ev), A.S., D.P., K.M., S.K., S.G. and V.P.; resources, R.P. (Revmira Polyudina) and V.P.; data curation, R.P. (Revmira Polyudina), D.P. and S.K.; writing—original draft preparation, R.P. (Roman Perfil’ev) and A.S.; writing—review and editing, E.S.; visualization, R.P. (Roman Perfil’ev); supervision, V.P., R.P. (Revmira Polyudina) and E.S.; project administration, E.S.; funding acquisition, E.S. All authors have read and agreed to the published version of the manuscript.

Funding

This research was funded the Russian Science Foundation (RSF project No. 21-76-30003).

Institutional Review Board Statement

Not applicable.

Data Availability Statement

All the data supporting the findings of this study are included in this article.

Acknowledgments

Multiplication of the plant material was conducted in the Laboratory of Artificial Plant Growth of IC&G SB RAS within the budgetary project FWNR-2022-0017.

Conflicts of Interest

The authors declare no conflict of interest.

References

  1. Kurasch, A.K.; Hahn, V.; Leiser, W.L.; Vollmann, J.; Schori, A.; Bétrix, C.; Mayr, B.; Winkler, J.; Mechtler, K.; Aper, J.; et al. Identification of Mega-environments in Europe and Effect of Allelic Variation at Maturity E Loci on Adaptation of European Soybean. Plant Cell Environ. 2017, 40, 765–778. [Google Scholar] [CrossRef] [PubMed]
  2. Liu, L.; Song, W.; Wang, L.; Sun, X.; Qi, Y.; Wu, T.; Sun, S.; Jiang, B.; Wu, C.; Hou, W.; et al. Allele Combinations of Maturity Genes E1E4 Affect Adaptation of Soybean to Diverse Geographic Regions and Farming Systems in China. PLoS ONE 2020, 15, e0235397. [Google Scholar] [CrossRef] [PubMed]
  3. Zhang, X.; Wu, T.; Wen, H.; Song, W.; Xu, C.; Han, T.; Sun, S.; Wu, C. Allelic Variation of Soybean Maturity Genes E1–E4 in the Huang-Huai-Hai River Valley and the Northwest China. Agriculture 2021, 11, 478. [Google Scholar] [CrossRef]
  4. Liu, B.; Kanazawa, A.; Matsumura, H.; Takahashi, R.; Harada, K.; Abe, J. Genetic Redundancy in Soybean Photoresponses Associated With Duplication of the Phytochrome A Gene. Genetics 2008, 180, 995–1007. [Google Scholar] [CrossRef] [PubMed] [Green Version]
  5. Watanabe, S.; Hideshima, R.; Xia, Z.; Tsubokura, Y.; Sato, S.; Nakamoto, Y.; Yamanaka, N.; Takahashi, R.; Ishimoto, M.; Anai, T.; et al. Map-Based Cloning of the Gene Associated with the Soybean Maturity Locus E3. Genetics 2009, 182, 1251–1262. [Google Scholar] [CrossRef] [Green Version]
  6. Watanabe, S.; Xia, Z.; Hideshima, R.; Tsubokura, Y.; Sato, S.; Yamanaka, N.; Takahashi, R.; Anai, T.; Tabata, S.; Kitamura, K.; et al. A Map-Based Cloning Strategy Employing a Residual Heterozygous Line Reveals That the GIGANTEA Gene Is Involved in Soybean Maturity and Flowering. Genetics 2011, 188, 395–407. [Google Scholar] [CrossRef] [Green Version]
  7. Xia, Z.; Watanabe, S.; Yamada, T.; Tsubokura, Y.; Nakashima, H.; Zhai, H.; Anai, T.; Sato, S.; Yamazaki, T.; Lü, S.; et al. Positional Cloning and Characterization Reveal the Molecular Basis for Soybean Maturity Locus E1 That Regulates Photoperiodic Flowering. Proc. Natl. Acad. Sci. USA 2012, 109, E2155–E2164. [Google Scholar] [CrossRef] [Green Version]
  8. Xu, M.; Xu, Z.; Liu, B.; Kong, F.; Tsubokura, Y.; Watanabe, S.; Xia, Z.; Harada, K.; Kanazawa, A.; Yamada, T.; et al. Genetic Variation in Four Maturity Genes Affects Photoperiod Insensitivity and PHYA-Regulated Post-Flowering Responses of Soybean. BMC Plant Biol. 2013, 13, 91. [Google Scholar] [CrossRef] [Green Version]
  9. Tsubokura, Y.; Matsumura, H.; Xu, M.; Liu, B.; Nakashima, H.; Anai, T.; Kong, F.; Yuan, X.; Kanamori, H.; Katayose, Y.; et al. Genetic Variation in Soybean at the Maturity Locus E4 Is Involved in Adaptation to Long Days at High Latitudes. Agronomy 2013, 3, 117–134. [Google Scholar] [CrossRef] [Green Version]
  10. Langewisch, T.; Lenis, J.; Jiang, G.-L.; Wang, D.; Pantalone, V.; Bilyeu, K. The Development and Use of a Molecular Model for Soybean Maturity Groups. BMC Plant Biol. 2017, 17, 91. [Google Scholar] [CrossRef] [Green Version]
  11. Soybeans: Improvement, Production, and Uses; Shibles, R.M.; Harper, J.E.; Wilson, R.F.; Shoemaker, R.C. (Eds.) Agronomy Monographs; American Society of Agronomy, Crop Science Society of America, and Soil Science Society of America: Madison, WI, USA, 2004; ISBN 978-0-89118-266-5. [Google Scholar]
  12. Deriglazova, G. Current Trends in Soybean Cultivation in Russia. Agric. Lifestock Technol. Aгpoзoomexнuкa 2022, 5, 1–10. [Google Scholar] [CrossRef]
  13. Rogers, S.O.; Bendich, A.J. Extraction of DNA from Milligram Amounts of Fresh, Herbarium and Mummified Plant Tissues. Plant Mol. Biol. 1985, 5, 69–76. [Google Scholar] [CrossRef]
  14. Perfil’ev, R.N.; Shcherban, A.B.; Salina, E.A. Development of a Marker Panel for Genotyping of Domestic Soybean Cultivars for Genes Controlling the Duration of Vegetation and Response to Photoperiod. Vavilov J. Genet. Breed. 2021, 25, 761–769. [Google Scholar] [CrossRef] [PubMed]
  15. Patil, I. Visualizations with Statistical Details: The “ggstatsplot” Approach. J. Open Source Softw. 2021, 6, 3167. [Google Scholar] [CrossRef]
  16. Tsubokura, Y.; Watanabe, S.; Xia, Z.; Kanamori, H.; Yamagata, H.; Kaga, A.; Katayose, Y.; Abe, J.; Ishimoto, M.; Harada, K. Natural Variation in the Genes Responsible for Maturity Loci E1, E2, E3 and E4 in Soybean. Ann. Bot. 2014, 113, 429–441. [Google Scholar] [CrossRef] [PubMed] [Green Version]
  17. Tardivel, A.; Sonah, H.; Belzile, F.; O’Donoughue, L.S. Rapid Identification of Alleles at the Soybean Maturity Gene E3 Using Genotyping by Sequencing and a Haplotype-Based Approach. Plant Genome 2014, 7, 1–9. [Google Scholar] [CrossRef]
  18. Lin, X.; Dong, L.; Tang, Y.; Li, H.; Cheng, Q.; Li, H.; Zhang, T.; Ma, L.; Xiang, H.; Chen, L.; et al. Novel and Multifaceted Regulations of Photoperiodic Flowering by Phytochrome A in Soybean. Proc. Natl. Acad. Sci. USA 2022, 119, e2208708119. [Google Scholar] [CrossRef]
  19. Zhai, H.; Wan, Z.; Jiao, S.; Zhou, J.; Xu, K.; Nan, H.; Liu, Y.; Xiong, S.; Fan, R.; Zhu, J.; et al. GmMDE Genes Bridge the Maturity Gene E1 and Florigens in Photoperiodic Regulation of Flowering in Soybean. Plant Physiol. 2022, 189, 1021–1036. [Google Scholar] [CrossRef]
  20. Qin, C.; Li, H.; Zhang, S.; Lin, X.; Jia, Z.; Zhao, F.; Wei, X.; Jiao, Y.; Li, Z.; Niu, Z.; et al. GmEID1 Modulates Light Signaling through the Evening Complex to Control Flowering Time and Yield in Soybean. Proc. Natl. Acad. Sci. USA 2023, 120, e2212468120. [Google Scholar] [CrossRef]
  21. Dong, L.; Cheng, Q.; Fang, C.; Kong, L.; Yang, H.; Hou, Z.; Li, Y.; Nan, H.; Zhang, Y.; Chen, Q.; et al. Parallel Selection of Distinct Tof5 Alleles Drove the Adaptation of Cultivated and Wild Soybean to High Latitudes. Mol. Plant 2022, 15, 308–321. [Google Scholar] [CrossRef]
  22. Li, H.; Du, H.; He, M.; Wang, J.; Wang, F.; Yuan, W.; Huang, Z.; Cheng, Q.; Gou, C.; Chen, Z.; et al. Natural Variation of FKF1 Controls Flowering and Adaptation during Soybean Domestication and Improvement. New Phytol. 2023, 238, 1671–1684. [Google Scholar] [CrossRef] [PubMed]
  23. Kou, K.; Yang, H.; Li, H.; Fang, C.; Chen, L.; Yue, L.; Nan, H.; Kong, L.; Li, X.; Wang, F.; et al. A Functionally Divergent SOC1 Homolog Improves Soybean Yield and Latitudinal Adaptation. Curr. Biol. 2022, 32, 1728–1742.e6. [Google Scholar] [CrossRef] [PubMed]
  24. Zhu, J.; Takeshima, R.; Harigai, K.; Xu, M.; Kong, F.; Liu, B.; Kanazawa, A.; Yamada, T.; Abe, J. Loss of Function of the E1-Like-b Gene Associates With Early Flowering Under Long-Day Conditions in Soybean. Front. Plant Sci. 2019, 9, 1867. [Google Scholar] [CrossRef] [PubMed]
  25. Su, T.; Wang, Y.; Li, S.; Wang, L.; Kou, K.; Kong, L.; Cheng, Q.; Dong, L.; Liu, B.; Kong, F.; et al. A Flowering Time Locus Dependent on E2 in Soybean. Mol. Breed. 2021, 41, 35. [Google Scholar] [CrossRef] [PubMed]
  26. Kim, S.-K.; Kim, E.-S.; Kim, K.H.; Jeong, N.; Lee, J.S.; Kang, S. Genetic Variance for Flowering Time Conferring E2 Gene in Photoperiod-Insensitive Early-Maturing Soybean Accessions and Topological Distribution in Korea Peninsula. Mol. Breed. 2018, 38, 148. [Google Scholar] [CrossRef]
  27. Funatsuki, H.; Kawaguchi, K.; Matsuba, S.; Sato, Y.; Ishimoto, M. Mapping of QTL Associated with Chilling Tolerance during Reproductive Growth in Soybean. Theor. Appl. Genet. 2005, 111, 851–861. [Google Scholar] [CrossRef]
  28. Tsegaw, M.; Zegeye, W.A.; Jiang, B.; Sun, S.; Yuan, S.; Han, T.; Wu, T. Progress and Prospects of the Molecular Basis of Soybean Cold Tolerance. Plants 2023, 12, 459. [Google Scholar] [CrossRef]
  29. Takahashi, R.; Abe, J. Soybean Maturity Genes Associated with Seed Coat Pigmentation and Cracking in Response to Low Temperatures. Crop Sci. 1999, 39, 1657–1662. [Google Scholar] [CrossRef]
  30. Cober, E.R.; Tanner, J.W.; Voldeng, H.D. Genetic Control of Photoperiod Response in Early-Maturing, Near-Isogenic Soybean Lines. Crop Sci. 1996, 36, 601–605. [Google Scholar] [CrossRef]
  31. Cober, E.R.; Tanner, J.W.; Voldeng, H.D. Soybean Photoperiod-Sensitivity Loci Respond Differentially to Light Quality. Crop Sci. 1996, 36, 606–610. [Google Scholar] [CrossRef]
Figure 1. The allele frequency of the E1E4 genes in soybean accessions of different origin: (A)—101 accessions from West Siberia (Novosibirsk and Omsk region); (B)—41 from other Russian regions; (C)—34 foreign accessions. Alleles are presented by different colors. The numbers on the plots indicate the percentages.
Agriculture 13 01251 g001
Figure 2. DTF (days from emergence to flowering) of established E genotypes in (A) Novosibirsk and (B) Orel in 2021 and 2022. Genotypes to the right of the vertical line were not included in the multiple comparison due to their small number. Asterisks indicate statistically significant differences between the compared genotypes: ***, p < 0.001; **, p < 0.01; *, p < 0.05; ns, no significant differences.
Agriculture 13 01251 g002
Figure 3. DTM (days from emergence to maturity) of established E genotypes in (A) Novosibirsk and (B) Orel in 2021 and 2022. Genotypes to the right of the vertical line were not included in the multiple comparison due to their small number. Asterisks indicate statistically significant differences between the compared genotypes: ***, p < 0.001; *, p < 0.05; ns, no significant differences.
Agriculture 13 01251 g003
Table 1. Established E1E4 genotypes of all studied accessions. “N” denotes the number of samples in each genotype. “%” denotes the percentage of genotypes from the total number of accessions.
GenotypeE1E2E3E4N%
e1/e2/e3/e4e1-nle2-nse3-fse4-SORE-15430.7
e1-ase2-nse3-fse4-kes169.1
e1-nle2-nse3-fse4-kes158.5
e1-nle2-nse3-tre4-SORE-1105.7
e1-ase2-nse3-fse4-SORE-195.1
e1-ase2-nse3-tre4-SORE-163.4
e1-nle2-nse3-nse4-SORE-163.4
e1-ase2-nse3-nse4-kes21.1
e1-ase2-nse3-tre4-kes21.1
e1-ase2-nse3-nse4-SORE-110.6
e1-fse2-nse3-fse4-kes10.6
e1-nle2-nse3-nse4-kes10.6
e1/e2/e3/E4e1-nle2-nse3-fsE495.1
e1-nle2-nse3-trE495.1
e1-ase2-nse3-fsE484.5
e1-ase2-nse3-trE442.3
e1-ase2-nse3-mix *E410.6
e1-nle2-nse3-mix *E410.6
e1/e2/E3/e4e1-nle2-nsE3-Hae4-SORE-142.3
e1-ase2-nsE3-Hae4-SORE-110.6
e1/e2/E3/E4e1-nle2-nsE3-HaE431.7
e1/E2/e3/e4e1-asE2e3-fse4-kes52.8
e1-nlE2e3-fse4-kes10.6
e1/E2/e3/E4e1-nlE2e3-trE452.8
E1/e2/e3/E4E1e2-nse3-trE421.1
*—e3-mix (mix of alleles e3-tr and e3-fs).
Table 2. Result of ANOVA for DTF (days from emergence to flowering) and DTM (days from emergence to maturity).
TraitLocationFactordfSum SqF Value
DTFNovosibirskE11411.959.6 ***
E41527.676.4 ***
year1235.934.1 ***
residuals3122155.5
OrelE11252.550.3 ***
E4182.416.4 ***
year1126.625.2 ***
residuals3121567.4
DTMNovosibirskE111215.834.6 ***
E412995.285.3 ***
year11557.144.3 ***
residuals2849975.4
OrelE11454.512.4 **
E412588.870.4 ***
year15258143 ***
residuals31211469.2
DTFNovosibirsk and OrelE11606.699.3 ***
E41533.987.4 ***
year1336.955.1 ***
location12308.4377.7 ***
residuals6153758.8
DTME111355.728 ***
E416137126.7 ***
year1506.510.5 **
location1541.811.2 ***
residuals59728918.2
** significant at p < 0.01. *** significant at p < 0.001.
Disclaimer/Publisher’s Note: The statements, opinions and data contained in all publications are solely those of the individual author(s) and contributor(s) and not of MDPI and/or the editor(s). MDPI and/or the editor(s) disclaim responsibility for any injury to people or property resulting from any ideas, methods, instructions or products referred to in the content.

