Forecasting of Hypoallergenic Wheat Productivity Based on Unmanned Aerial Vehicles Remote Sensing Approach—Case Study
Abstract
:1. Introduction
2. Materials and Methods
2.1. Experimental Conditions and Treatments
2.2. Meteorological Conditions
2.3. UAV Remote Sensing
2.4. Agrotechnical Details
2.5. Vegetation Indices
2.6. Calculations and Statistical Analysis
3. Results
3.1. Grain Yield and Agronomic Efficiency
3.2. Vegetative Indices
4. Discussion
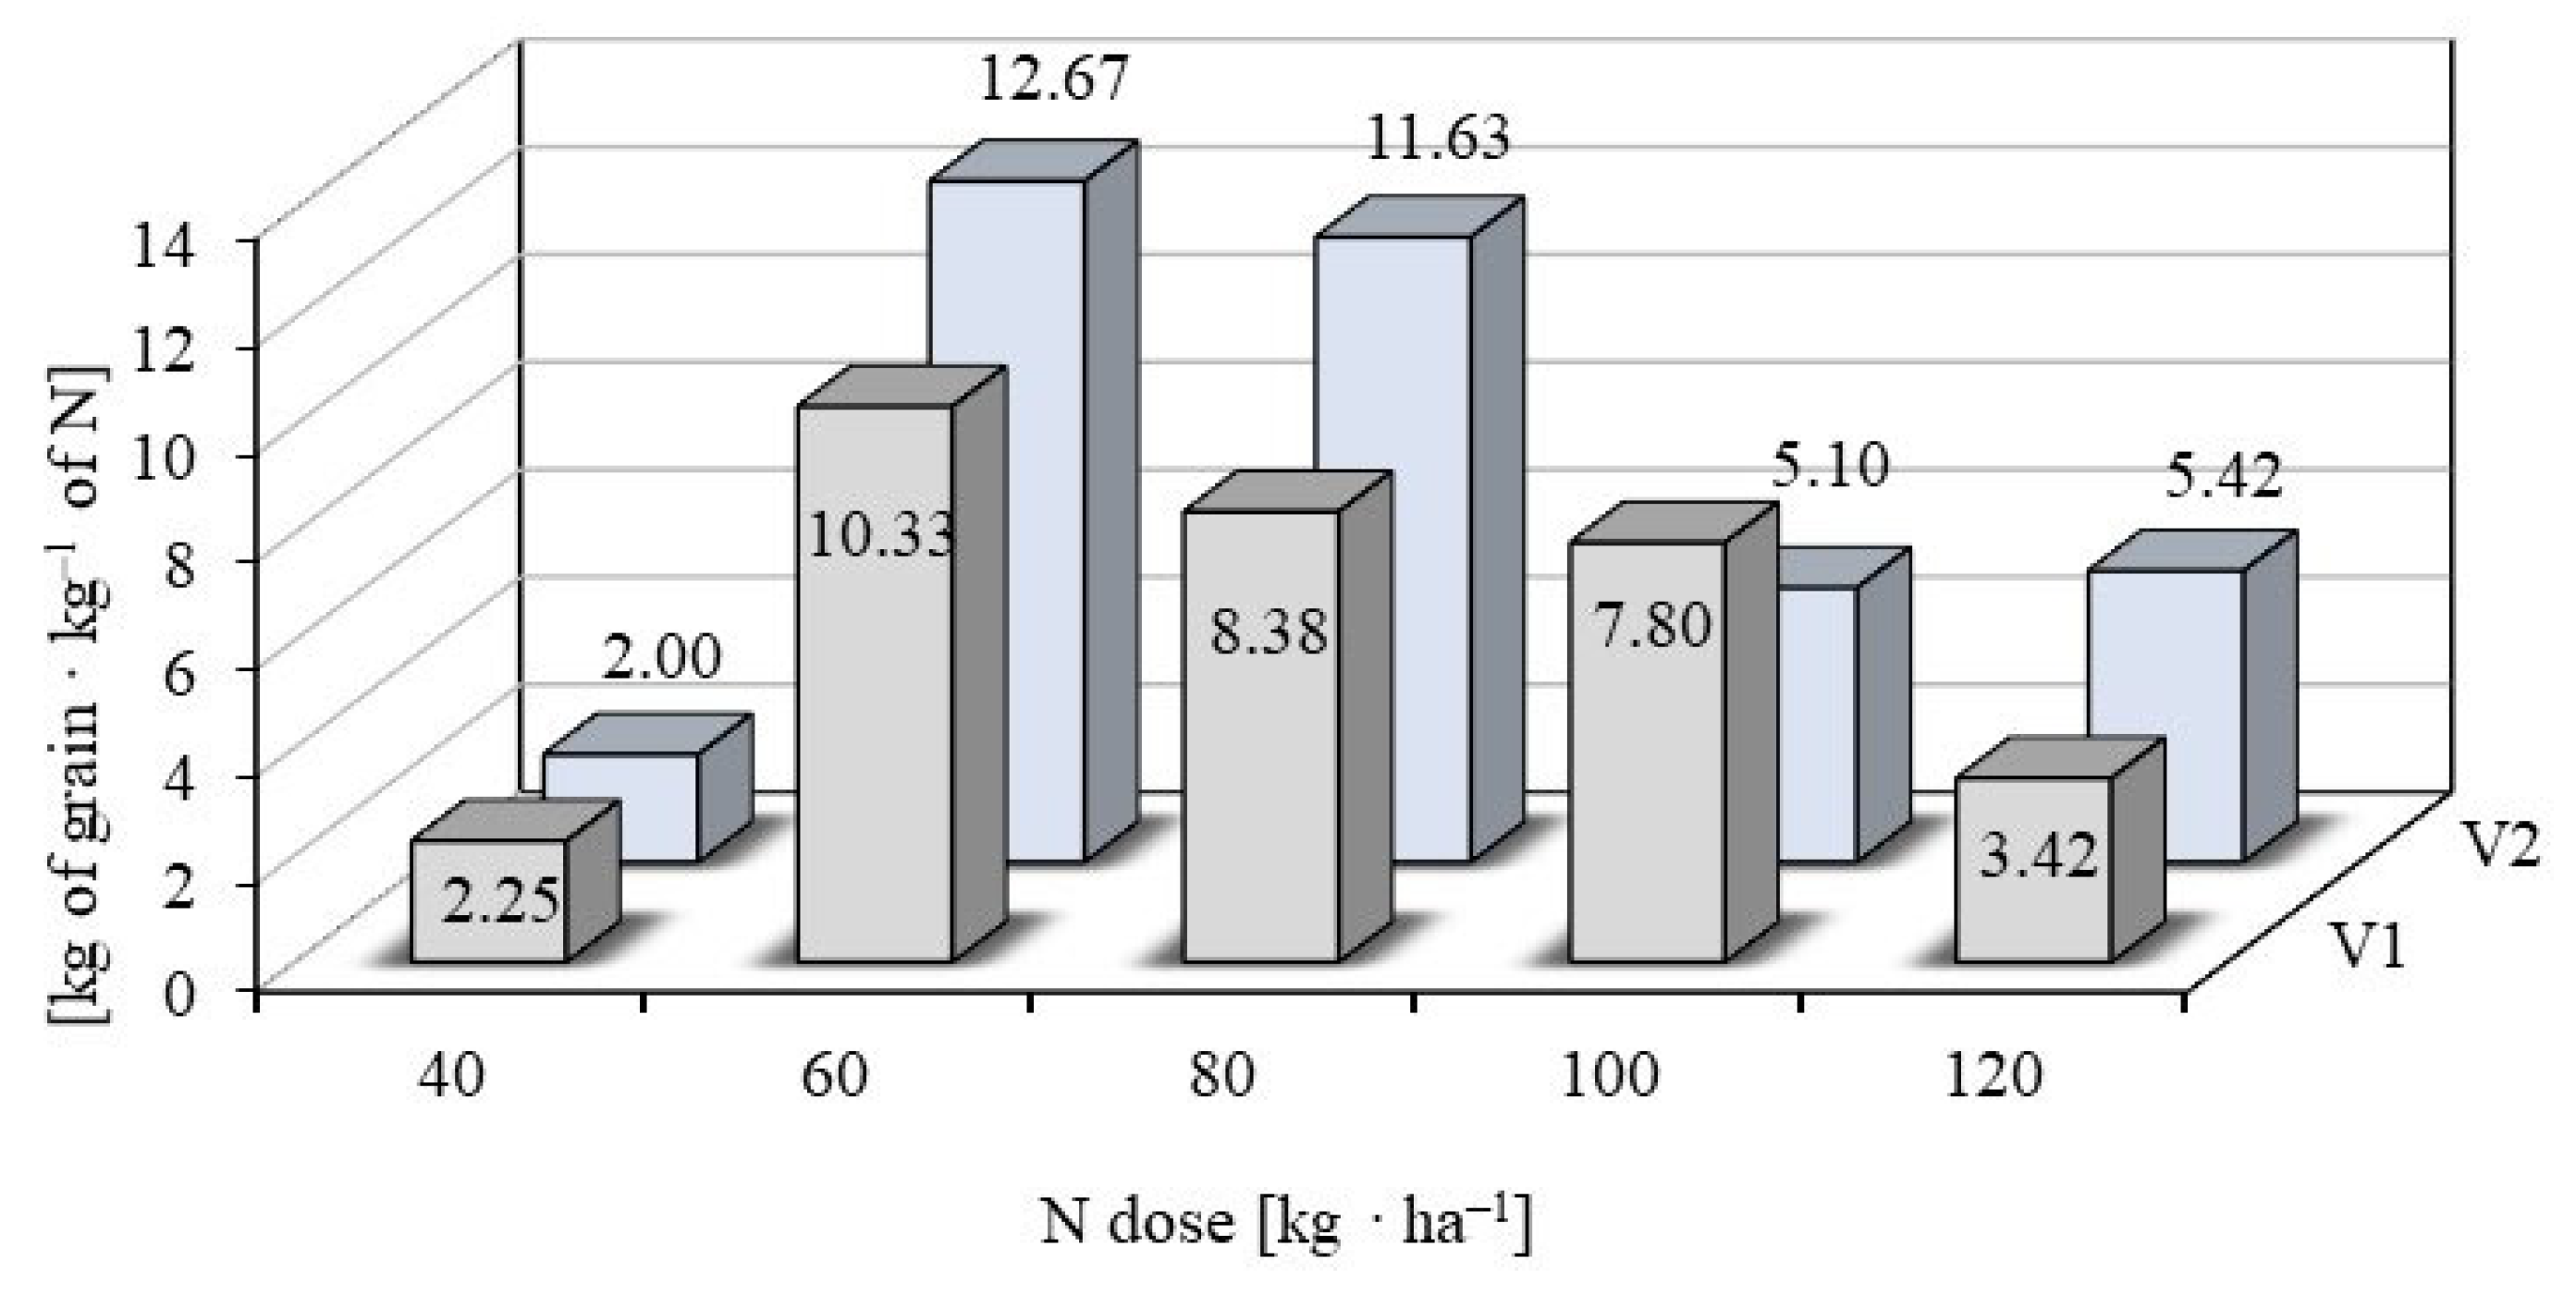
4.1. Grain Yield and Fertilization Efficiency
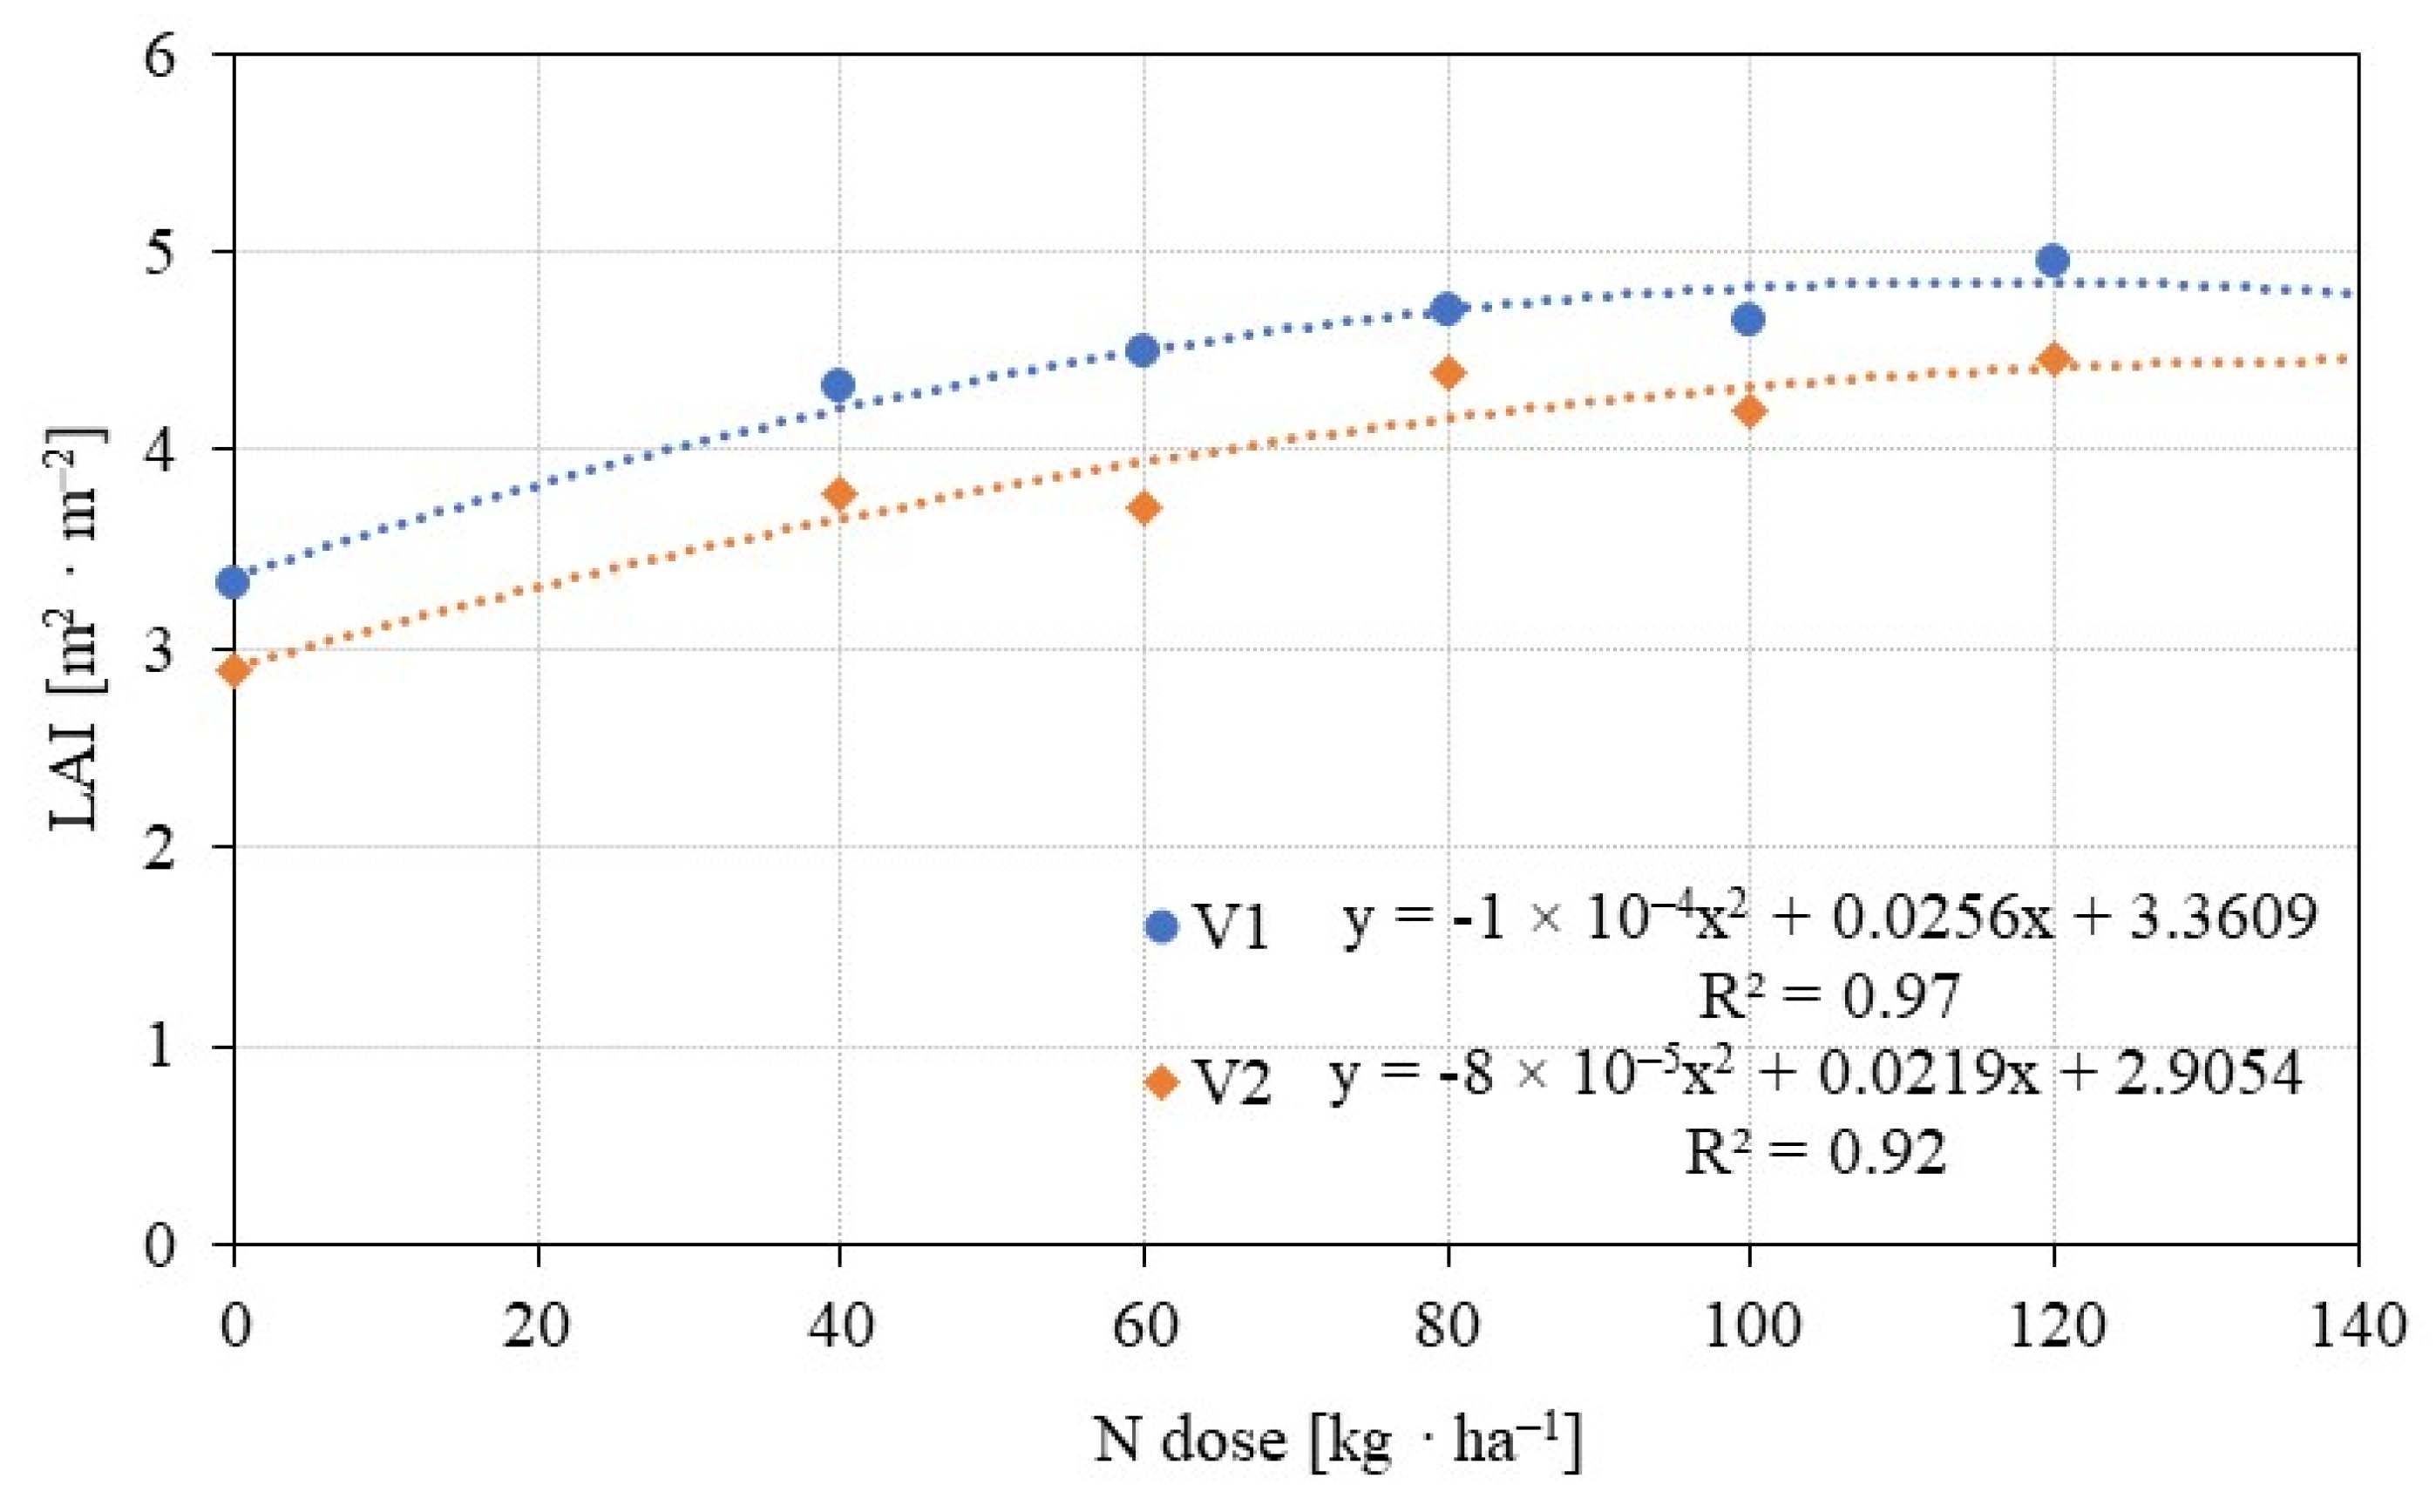
4.2. Physiological and Vegetative Indices
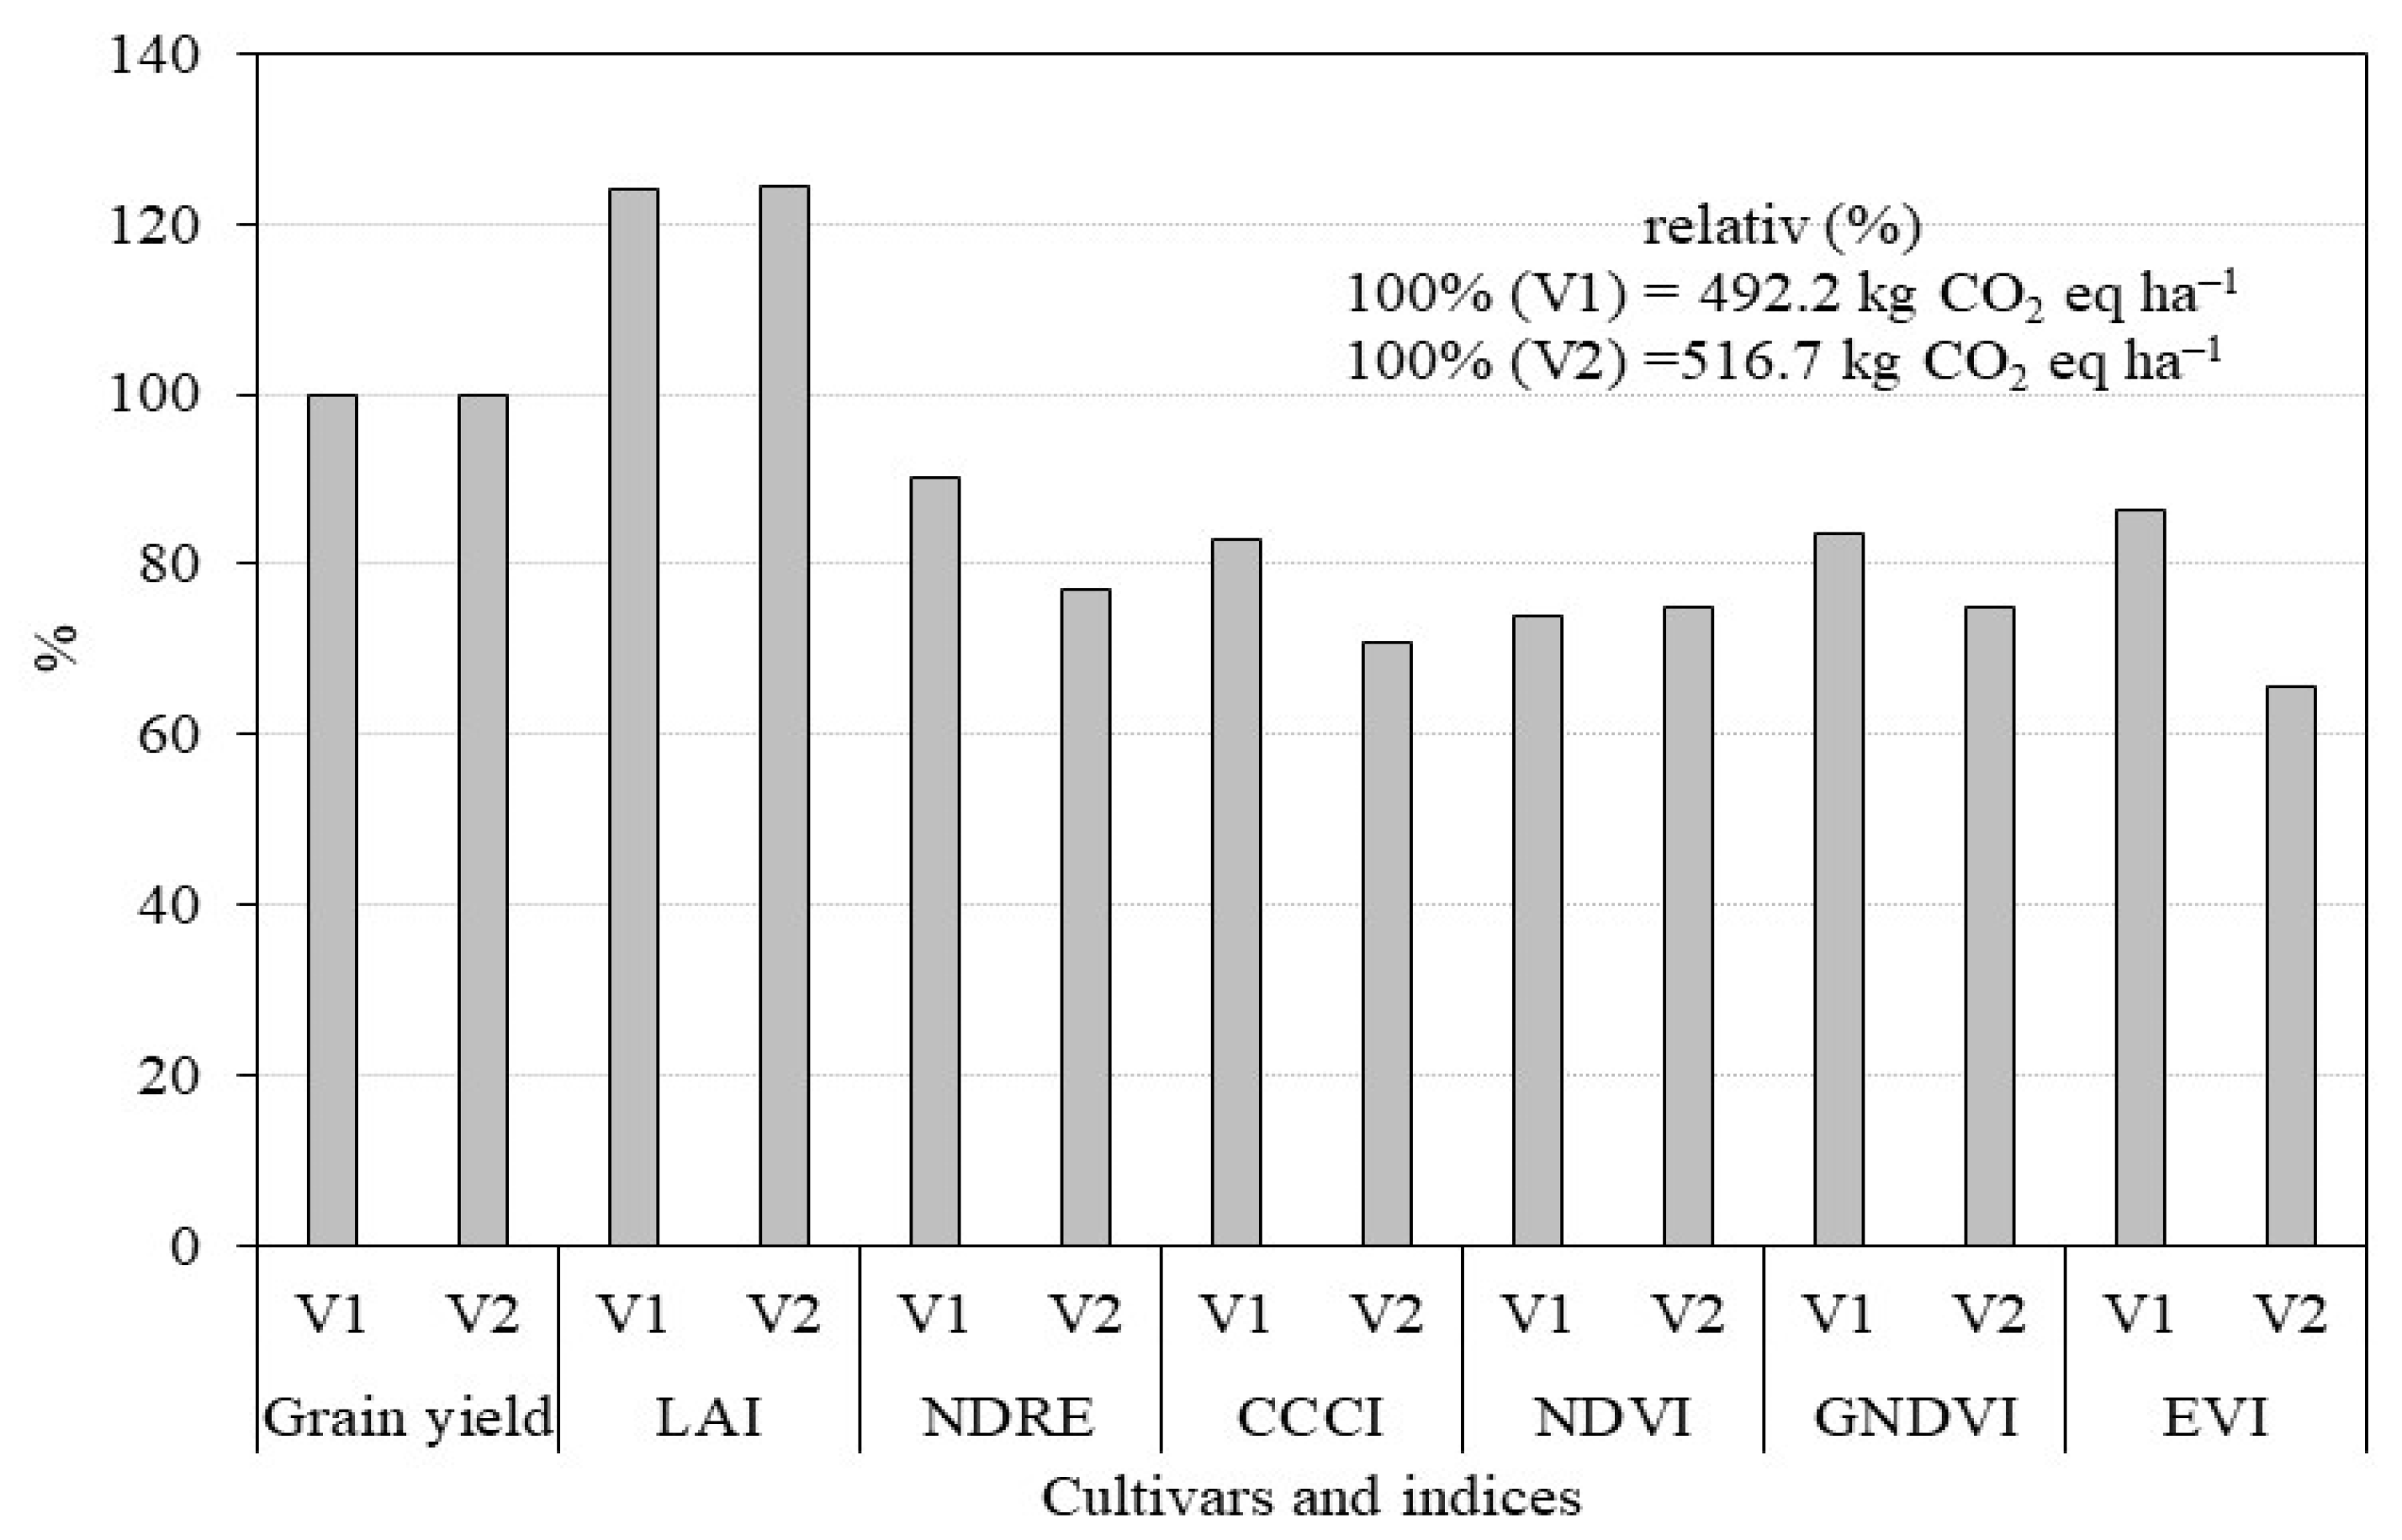
4.3. Simulated Reduction in GHG Emissions
5. Conclusions
Author Contributions
Funding
Institutional Review Board Statement
Data Availability Statement
Conflicts of Interest
References
- Wrigley, C.W.; Bekes, F.; Bushuk, W. Gluten: A Balance of Gliadin and Glutenin. In Gliadin and Glutenin—The Unique Balance of Wheat Quality; Wrigley, C., Bekes, F., Bushuk, W., Eds.; AACC International: St. Paul, MN, USA, 2006; pp. 3–32. [Google Scholar]
- Wrigley, C.W.; Bietz, J.A. Proteins and Amino Acids. In Wheat: Chemistry and Technology; Pomeranz, Y., Ed.; AACC: St. Paul, MN, USA, 1988; pp. 159–275. [Google Scholar]
- Seilmeier, W.; Belitz, H.D.; Wieser, H. Separation and quantitative determination of high-molecular-weight subunits of glutenin from different wheat varieties and genetic variants of the variety Sicco. Z. Lebensm. Unters. Forsch. 1991, 192, 124–129. [Google Scholar] [CrossRef]
- Baldacci, S.; Maio, S.; Cerrai, S.; Sarno, G.; Baiz, N.; Simoni, M.; Annesi-Maesano, I.; Viegi, G. Allergy and asthma: Effects of the exposure to particulate matter and biological allergens. Respir. Med. 2015, 109, 1089–1104. [Google Scholar] [CrossRef] [PubMed] [Green Version]
- Sapone, A.; Bai, J.C.; Ciacci, C.; Dolinsek, J.; Green, P.H.; Hadjivassiliou, M.; Kaukinen, K.; Rostami, K.; Sanders, D.S.; Schumann, M.; et al. Spectrum of gluten-related disorders: Consensus on new nomenclature and classification. BMC Med. 2012, 10, 13. Available online: https://www.biomedcentral.com/1741-7015/10/13/-ins6PHR (accessed on 1 January 2020). [CrossRef] [PubMed] [Green Version]
- Palosuo, K.; Varionen, E.; Kekki, O.M. Wheat ω-5 gliadin is a major allergen in children with immediate allergy to ingested wheat. J. Allergy Clin. Immunol. 2001, 108, 634–638. [Google Scholar] [CrossRef] [PubMed]
- Morita, E.; Matsuo, H.; Mihara, S. Fast ω-gliadin is a major allergen in wheat-dependent exercise-induced anaphylaxis. J. Dermatol. Sci. 2003, 33, 99–104. [Google Scholar] [CrossRef]
- Waga, J.; Skoczowski, A. Development and characteristics of ω-gliadin-free wheat genotypes. Euphytica 2014, 195, 105–116. [Google Scholar] [CrossRef] [Green Version]
- Stawoska, I.; Waga, J.; Wesełucha-Birczynska, A.; Dziurka, M.; Podolska, G.; Aleksandrowicz, E.; Skoczowski, A. Does Nitrogen Fertilization Affect the Secondary Structures of Gliadin Proteins in Hypoallergenic Wheat? Molecules 2022, 27, 5684. [Google Scholar] [CrossRef]
- Geipel, J.; Link, J.; Wirwahn, J.A.; Claupein, W. A Programmable Aerial Multispectral Camera System for In-Season Crop Biomass and Nitrogen Content Estimation. Agriculture 2016, 6, 4. [Google Scholar] [CrossRef] [Green Version]
- Li, M.; Shamshiri, R.R.; Weltzien, C.; Schirrmann, M. Crop Monitoring Using Sentinel-2 and UAV Multispectral Imagery: A Comparison Case Study in Northeastern Germany. Remote Sens. 2022, 14, 4426. [Google Scholar] [CrossRef]
- Walsh, O.S.; Shafian, S.; Marshall, J.M.; Jackson, C.; McClintick-Chess, J.R.; Blanscet, S.M.; Swoboda, K.; Thompson, C.; Belmont, K.M.; Walsh, W.L. Assessment of UAV Based Vegetation Indices for Nitrogen Concentration Estimation in Spring Wheat. Adv. Remote Sens. 2018, 7, 71–90. [Google Scholar] [CrossRef] [Green Version]
- Huete, A.; Justice, C. MODIS Vegetation Index (MOD 13) Algorithm Theoretical Basis Document, 1999. Available online: https://modis.gsfc.nasa.gov/data/atbd/atbd_mod13.pdf (accessed on 1 January 2020).
- Boiarskii, B.; Hasegawa, H. Comparison of NDVI and NDRE Indices to Detect Differences in Vegetation and Chlorophyll Content International Conference on Applied Science, Technology and Engineering. J. Mech. Cont. Math. Sci. 2019, 4, 20–29. [Google Scholar]
- Huang, S.; Tang, L.; Hupy, J.P.; Wang, Y.; Shao, G. Commentary review on the use of normalized diference vegetation index (NDVI) in the era of popular remote sensing. J. For. Res. 2021, 32, 1–6. [Google Scholar] [CrossRef]
- Bausch, W.C.; Duke, H.R. Remote sensing of plant nitrogen status in corn. Trans. Am. Soc. Agric. Eng. 1996, 39, 1869–1875. [Google Scholar] [CrossRef]
- Carlson, T.N.; Ripley, D.A. On the relation between NDVI, fractional vegetation cover, and leaf area index. Remote Sens. Environ. 1997, 62, 241–252. [Google Scholar] [CrossRef]
- Fang, H.; Baret, F.; Plummer, S.; Schaepman-Strub, G. An overview of global leaf area index (LAI): Methods, products, validation, and applications. Rev. Geophys. 2019, 57, 739–799. [Google Scholar] [CrossRef]
- Węgrzyn, A.; Klimek-Kopyra, A.; Dacewicz, E.; Skowera, B.; Grygierzec, W.; Kulig, B.; Flis-Olszewska, E. Effect of Selected Meteorological Factors on the Growth Rate and Seed Yield of Winter Wheat—A Case Study. Agronomy 2022, 12, 2924. [Google Scholar] [CrossRef]
- Adhikari, C.; Bronson, K.F.; Panuallah, G.M.; Regmi, A.P.; Saha, P.K.; Dobermann, A.; Olk, D.C.; Hobbs, P.R.; Pasuquin, E. On-farm soil N supply and N nutrition in the rice-wheat system of Nepal and Bangladesh. Field Crop. Res. 1999, 64, 273–286. [Google Scholar] [CrossRef]
- Diacono, M.; Rubino, P.; Montemurro, F. Precision nitrogen management of wheat. A review. Agron. Sustain. Develop. 2013, 33, 219–241. [Google Scholar] [CrossRef]
- Delogu, G.; Cattivelli, L.; Pecchioni, N.; De Falcis, D.; Maggiore, T.; Stanca, A.M. Uptake and agronomic efficiency of nitrogen in winter barley and winter wheat. Eur. J. Agron. 1998, 9, 11–20. [Google Scholar] [CrossRef]
- Kołodziejczyk, M.; Kulig, B.; Oleksy, A.; Szmigiel, A. The effectiveness of N-fertilization and microbial preparation on spring wheat. Plant Soil. Environ. 2013, 59, 335–341. [Google Scholar] [CrossRef] [Green Version]
- Grohs, D.S.; Bredemeier, C.; Mundstock, C.M.; Poletto, N. Model for yield potential estimation in wheat and barley using the Greenseeker sensor. Engenharia Agrícola. 2009, 29, 101–112. [Google Scholar] [CrossRef] [Green Version]
- Cammarano, D.; Fitzgerald, G.; Basso, B.; O’Leary, G.; Chen, D.; Grace, P.; Fiorentino, C. Use of the Canopy Chlorophyl Content Index (CCCI) for Remote Estimation of Wheat Nitrogen Content in Rainfed. Environ. Agron. J. 2011, 103, 1597–1603. [Google Scholar] [CrossRef]
- Matsushita, B.; Yang, W.; Chen, J.; Onda, Y.; Qiu, G. Sensitivity of the vegetation index (EVI) and normalized difference vegetation index (NDVI) to Topographic effects: A case study in high-density cypress forest. Sensors 2007, 7, 2636–2651. [Google Scholar] [CrossRef] [PubMed] [Green Version]
- Chen, A.; Orlov-Levin, V.; Meron, M. Applying high-resolution visible-channel aerial imaging of crop canopy to precision irrigation management. Agric. Water Manag. 2019, 216, 196–205. [Google Scholar] [CrossRef]
- Thompson, C.; Guo, W.; Sharma, B.; Ritchie, G.L. Using normalized difference red edge index to assess maturity in cotton. Crop. Sci. 2019, 59, 2167–2177. [Google Scholar] [CrossRef]
- Tabak, M.; Lepiarczyk, A.; Filipek-Mazur, B.; Lisowska, A. Efficiency of Nitrogen Fertilization of Winter Wheat Depending on Sulfur Fertilization. Agronomy 2020, 10, 1304. [Google Scholar] [CrossRef]
- Zhang, S.; Gao, P.; Tong, Y.; Norse, D.; Lu, Y.; Powlson, D. Overcoming nitrogen fertilizer over-use through technical and advisory approaches: A case study from Shaanxi Province, northwest China. Agric. Ecosyst. Environ. 2015, 209, 89–99. [Google Scholar] [CrossRef]
- Dobermann, A. Nutrient Use Efficiency: Measurement and Management; IFA International Workshop on Fertilizer Best Management Practices: Brussels, Belgium, 2007; pp. 1–28. [Google Scholar]
- Lόpez-Bellido, R.J.; Lόpez-Bellido, L. Efficiency of nitrogen in wheat under Mediterranean condition: Effect of tillage, crop rotation and N fertilization. Field Crop. Res. 2001, 71, 31–46. [Google Scholar] [CrossRef]
- Lopez-Bellido, L.; Lopez-Bellido, R.J.; Redondo, R. Nitrogen efficiency in wheat under rainfed Mediterranean conditions as affected by split nitrogen application. Field Crop. Res. 2005, 94, 86–97. [Google Scholar] [CrossRef]
- Prabhakara, K.; Hively, W.D.; McCartych, G.W. Evaluating the relationship between biomass, percent groundcover and remote sensing indices across six winter cover crop. Int. J. Appl. Earth Observ. Geoinformat. 2015, 39, 88–102, Fu, Z.; Jiang, J.; Gao, Y.; Krienke, B.; Wang, M.; Zhong, K.; Cao, Q.; Tian, Y.; Zhu, Y.; Cao, W.; Liu, X. Wheat Growth Monitoring and Yield Estimation based on Multi-Rotor Unmanned Aerial Vehicle. Remote Sens. 2020, 12, 508. [Google Scholar] [CrossRef] [Green Version]
- Zhao, Y.; Potgieter, A.B.; Zhang, M.; Wu, B.; Hammer, G.L. Predicting Wheat Yield at the Field Scale by Combining High-Resolution Sentinel-2 Satellite Imagery and Crop Modelling. Remote Sens. 2020, 12, 1024. [Google Scholar] [CrossRef] [Green Version]
- Jelínková, Z.; Moudrý, J.; Bernas, J.; Kopecký, M.; Moundry, J.; Konvalina, P. Environmental and economic aspects of Triticum aestivum L. and Avena sativa growing. Open Life Sci. 2016, 11, 533–541. [Google Scholar] [CrossRef] [Green Version]
- Kumar, R.; Karmakar, S.; Minz, A.; Singh, J.; Kumar, A.; Kumar, A. Assessment of Greenhouse Gases Emission in Maize-Wheat Cropping System Under Varied N Fertilizer Application Using Cool Farm Tool. Front. Environ. Sci. 2021, 9, 355. [Google Scholar] [CrossRef]
- Dijkman, T.J.; Basset-Mens, C.; Antón, A.; Núñez, M. LCA of Food and Agriculture. In Life Cycle Assessment; Hauschild, M.Z., Rosenbaum, R.K., Olsen, S.I., Eds.; Springer: Cham, Switzerland, 2018; pp. 723–754. ISBN 978-3-319-56474-6. [Google Scholar]
- Bernas, J.; Bernasová, T.; Kaul, H.P.; Wagentristl, H.; Moitzi, G.; Neugschwandtner, R.W. Sustainability Estimation of Oat: Pea Intercrops from the Agricultural Life Cycle Assessment Perspective. Agronomy 2021, 11, 2433. [Google Scholar] [CrossRef]




| Band Name | Center Wavelength (nm) | Bandwidth FWHM (nm) |
|---|---|---|
| Blue | 475 | 20 |
| Green | 560 | 20 |
| Red | 668 | 10 |
| Red Edge | 717 | 10 |
| NIR | 840 | 40 |
| Canopy Index | Equation | Reference |
|---|---|---|
| Canopy Chlorophyll Content Index (CCCI) | CCCI = ((NIR − REDEDGE)/(NIR + REDEDGE))/((NIR − RED)/(NIR + RED) | Cammarano et al. [25] |
| Enhanced Vegetation Index (EVI) | EVI = 2.5 * ((NIR – RED)/(NIR + 6 × RED − 7.5 × BLUE + 1)) | Matsushita et al. [26] |
| Green Normalized Difference Vegetation Index (GNDVI) | GNDVI = (NIR − GREEN)/(NIR + GREEN) | Chen et al. [27] |
| Normalized Difference Red Edge (NDRE) | NDRE = (NIR − REDEDGE)/(NIR + REDEDGE) | Thompson et al. [28] |
| Normalized Difference Vegetation Index (NDVI) | NDVI = (NIR − RED)/(NIR + RED) | Chen et al. [27] |
| Fertilization (kg ha−1) | Genotype | Mean | ||
|---|---|---|---|---|
| N Dose | S Dose | V1 | V2 | |
| 0 | 0 | 4.62 | 3.88 | 4.25 |
| 20 | 5.02 | 4.25 | 4.64 | |
| 40 | 4.69 | 3.82 | 4.26 | |
| Mean | 4.78 | 3.98 | 4.38 | |
| 40 | 0 | 4.84 | 4.15 | 4.50 |
| 20 | 4.73 | 4.18 | 4.46 | |
| 40 | 5.04 | 3.85 | 4.45 | |
| Mean | 4.87 | 4.06 | 4.47 | |
| 60 | 0 | 5.30 | 4.76 | 5.03 |
| 20 | 5.66 | 4.72 | 5.19 | |
| 40 | 5.24 | 4.74 | 4.99 | |
| Mean | 5.40 | 4.74 | 5.07 | |
| 80 | 0 | 5.26 | 5.43 | 5.35 |
| 20 | 5.30 | 4.65 | 4.98 | |
| 40 | 5.77 | 4.67 | 5.22 | |
| Mean | 5.45 | 4.91 | 5.18 | |
| 100 | 0 | 5.67 | 3.99 | 4.83 |
| 20 | 6.01 | 4.86 | 5.44 | |
| 40 | 5.01 | 4.61 | 4.81 | |
| Mean | 5.56 | 4.49 | 5.03 | |
| 120 | 0 | 4.72 | 4.84 | 4.78 |
| 20 | 5.33 | 4.68 | 5.01 | |
| 40 | 5.52 | 4.38 | 4.95 | |
| Mean | 5.19 | 4.47 | 4.83 | |
| Mean for genotype | 5.21 | 4.47 | 4.84 | |
| Mean for S dose | 0 | 5.07 | 4.51 | 4.79 |
| 20 | 5.34 | 4.56 | 4.95 | |
| 40 | 5.21 | 4.34 | 4,78 | |
| LSDp=0.05 for genotype | 0.04 | |||
| LSDp=0.05 for N dose | - | n.s. * | ||
| LSDp=0.05 for S dose | - | n.s. | ||
| Fertilization (kg ha−1) | Genotype | Mean | ||
|---|---|---|---|---|
| N Dose | S Dose | V1 | V2 | |
| 0 | 0 | 0.584 | 0.792 | 0.688 |
| 20 | 0.877 | 0.823 | 0.850 | |
| 40 | 0.876 | 0.810 | 0.843 | |
| Mean | 0.869 | 0.808 | 0.839 | |
| 40 | 0 | 0.892 | 0.840 | 0.866 |
| 20 | 0.893 | 0.800 | 0.847 | |
| 40 | 0.868 | 0.836 | 0.852 | |
| Mean | 0.884 | 0.825 | 0.855 | |
| 60 | 0 | 0.864 | 0.870 | 0.867 |
| 20 | 0.897 | 0.847 | 0.872 | |
| 40 | 0.866 | 0.824 | 0.845 | |
| Mean | 0.876 | 0.847 | 0.862 | |
| 80 | 0 | 0.902 | 0.832 | 0.867 |
| 20 | 0.900 | 0.800 | 0.850 | |
| 40 | 0.901 | 0.851 | 0.876 | |
| Mean | 0.901 | 0.828 | 0.865 | |
| 100 | 0 | 0.886 | 0.815 | 0.851 |
| 20 | 0.894 | 0.806 | 0.850 | |
| 40 | 0.869 | 0.854 | 0.862 | |
| Mean | 0.883 | 0.825 | 0.854 | |
| 120 | 0 | 0.861 | 0.821 | 0.841 |
| 20 | 0.825 | 0.814 | 0.820 | |
| 40 | 0.871 | 0.800 | 0.836 | |
| Mean | 0.853 | 0.812 | 0.833 | |
| Mean for genotype | 0.878 | 0.824 | 0.851 | |
| Mean for S dose | 0 | 0.876 | 0.828 | 0.852 |
| 20 | 0.881 | 0.815 | 0.848 | |
| 40 | 0.875 | 0.829 | 0.852 | |
| LSDp=0.05 for genotype | 0.043 | |||
| LSDp=0.05 for N dose | - | n.s.* | ||
| LSDp=0.05 for S dose | - | n.s. | ||
| Fertilization (kg ha−1) | Genotype | Mean | ||
|---|---|---|---|---|
| N Dose | S Dose | V1 | V2 | |
| 0 | 0 | 0.572 | 0.554 | 0.563 |
| 20 | 0.596 | 0.551 | 0.574 | |
| 40 | 0.581 | 0.554 | 0.568 | |
| Mean | 0.583 | 0.553 | 0.568 | |
| 40 | 0 | 0.632 | 0.588 | 0.610 |
| 20 | 0.626 | 0.546 | 0.586 | |
| 40 | 0.606 | 0.580 | 0.593 | |
| Mean | 0.621 | 0.571 | 0.596 | |
| 60 | 0 | 0.597 | 0.608 | 0.603 |
| 20 | 0.635 | 0.576 | 0.606 | |
| 40 | 0.616 | 0.557 | 0.587 | |
| Mean | 0.616 | 0.580 | 0.598 | |
| 80 | 0 | 0.645 | 0.590 | 0.618 |
| 20 | 0.646 | 0.551 | 0.599 | |
| 40 | 0.632 | 0.582 | 0.607 | |
| Mean | 0.641 | 0.574 | 0.608 | |
| 100 | 0 | 0.614 | 0.568 | 0.591 |
| 20 | 0.629 | 0.546 | 0.588 | |
| 40 | 0.617 | 0.587 | 0.602 | |
| Mean | 0.620 | 0.567 | 0.594 | |
| 120 | 0 | 0.614 | 0.596 | 0.605 |
| 20 | 0.586 | 0.556 | 0.571 | |
| 40 | 0.585 | 0.547 | 0.566 | |
| Mean | 0.595 | 0.566 | 0.581 | |
| Mean for genotype | 0.613 | 0.569 | 0.591 | |
| Mean for S dose | 0 | 0.612 | 0.584 | 0.598 |
| 20 | 0.620 | 0.554 | 0.587 | |
| 40 | 0.606 | 0.568 | 0.587 | |
| LSDp=0.05 for genotype | n.s.* | |||
| LSDp=0.05 for N dose | - | 0.032 | ||
| LSDp=0.05 for S dose | - | n.s. | ||
| Fertilization (kg ha−1) | Genotype | Mean | ||
|---|---|---|---|---|
| N Dose | S Dose | V1 | V2 | |
| 0 | 0 | 0.489 | 0.439 | 0.464 |
| 20 | 0.523 | 0.454 | 0.489 | |
| 40 | 0.509 | 0.449 | 0.479 | |
| Mean | 0.507 | 0.447 | 0.477 | |
| 40 | 0 | 0.564 | 0.496 | 0.530 |
| 20 | 0.559 | 0.438 | 0.499 | |
| 40 | 0.527 | 0.487 | 0.507 | |
| Mean | 0.550 | 0.474 | 0.512 | |
| 60 | 0 | 0.518 | 0.531 | 0.525 |
| 20 | 0.570 | 0.490 | 0.530 | |
| 40 | 0.536 | 0.459 | 0.498 | |
| Mean | 0.541 | 0.493 | 0.517 | |
| 80 | 0 | 0.582 | 0.493 | 0.538 |
| 20 | 0.582 | 0.441 | 0.512 | |
| 40 | 0.570 | 0.496 | 0.533 | |
| Mean | 0.578 | 0.477 | 0.528 | |
| 100 | 0 | 0.545 | 0.463 | 0.504 |
| 20 | 0.563 | 0.441 | 0.502 | |
| 40 | 0.539 | 0.503 | 0.521 | |
| Mean | 0.549 | 0.469 | 0.509 | |
| 120 | 0 | 0.534 | 0.473 | 0.504 |
| 20 | 0.487 | 0.453 | 0.470 | |
| 40 | 0.540 | 0.438 | 0.489 | |
| Mean | 0.520 | 0.445 | 0.483 | |
| Mean for cv. | 0.541 | 0.469 | 0.505 | |
| Mean for S dose | 0 | 0.539 | 0.483 | 0.511 |
| 20 | 0.547 | 0.453 | 0.500 | |
| 40 | 0.537 | 0.472 | 0.505 | |
| LSDp=0.05 for genotype | n.s. | |||
| LSDp=0.05 for N dose | - | 0.047 | ||
| LSDp=0.05 for S dose | - | n.s.* | ||
| Fertilization (kg ha−1) | Genotype | Mean | ||
|---|---|---|---|---|
| N Dose | S Dose | V1 | V2 | |
| 0 | 0 | 0.753 | 0.714 | 0.734 |
| 20 | 0.778 | 0.726 | 0.752 | |
| 40 | 0.769 | 0.722 | 0.746 | |
| Mean | 0.766 | 0.721 | 0.744 | |
| 40 | 0 | 0.800 | 0.754 | 0.777 |
| 20 | 0.799 | 0.714 | 0.757 | |
| 40 | 0.776 | 0.748 | 0.762 | |
| Mean | 0.792 | 0.739 | 0.766 | |
| 60 | 0 | 0.771 | 0.780 | 0.776 |
| 20 | 0.807 | 0.751 | 0.779 | |
| 40 | 0.779 | 0.730 | 0.755 | |
| Mean | 0.786 | 0.754 | 0.770 | |
| 80 | 0 | 0.812 | 0.753 | 0.783 |
| 20 | 0.814 | 0.717 | 0.766 | |
| 40 | 0.806 | 0.756 | 0.781 | |
| Mean | 0.811 | 0.742 | 0.777 | |
| 100 | 0 | 0.790 | 0.731 | 0.761 |
| 20 | 0.801 | 0.717 | 0.759 | |
| 40 | 0.782 | 0.759 | 0.771 | |
| Mean | 0.791 | 0.736 | 0.764 | |
| 120 | 0 | 0.796 | 0.728 | 0.762 |
| 20 | 0.747 | 0.725 | 0.736 | |
| 40 | 0.784 | 0.716 | 0.750 | |
| Mean | 0.776 | 0.723 | 0.750 | |
| Mean for genotype | 0.787 | 0.736 | 0.762 | |
| Mean for S dose | 0 | 0.787 | 0.743 | 0.765 |
| 20 | 0.791 | 0.725 | 0.758 | |
| 40 | 0.783 | 0.738 | 0.761 | |
| LSDp=0.05 for genotype | 0.043 | |||
| LSDp=0.05 for N dose | - | n.s.* | ||
| LSDp=0.05 for S dose | - | n.s. | ||
| Fertilization (kg ha−1) | Genotype | Mean | ||
|---|---|---|---|---|
| N Dose | S Dose | V1 | V2 | |
| 0 | 0 | 0.454 | 0.436 | 0.445 |
| 20 | 0.462 | 0.446 | 0.454 | |
| 40 | 0.460 | 0.441 | 0.451 | |
| Mean | 0.458 | 0.441 | 0.450 | |
| 40 | 0 | 0.468 | 0.451 | 0.460 |
| 20 | 0.468 | 0.438 | 0.453 | |
| 40 | 0.460 | 0.449 | 0.455 | |
| Mean | 0.465 | 0.446 | 0.456 | |
| 60 | 0 | 0.457 | 0.459 | 0.458 |
| 20 | 0.469 | 0.452 | 0.461 | |
| 40 | 0.460 | 0.445 | 0.453 | |
| Mean | 0.462 | 0.452 | 0.457 | |
| 80 | 0 | 0.470 | 0.448 | 0.459 |
| 20 | 0.470 | 0.437 | 0.454 | |
| 40 | 0.470 | 0.452 | 0.461 | |
| Mean | 0.470 | 0.446 | 0.458 | |
| 100 | 0 | 0.465 | 0.443 | 0.454 |
| 20 | 0.468 | 0.440 | 0.454 | |
| 40 | 0.461 | 0.455 | 0.458 | |
| Mean | 0.465 | 0.446 | 0.456 | |
| 120 | 0 | 0.471 | 0.453 | 0.462 |
| 20 | 0.447 | 0.442 | 0.445 | |
| 40 | 0.461 | 0.438 | 0.450 | |
| Mean | 0.460 | 0.444 | 0.452 | |
| Mean for genotype | 0.463 | 0.446 | 0.455 | |
| Mean for S dose | 0 | 0.464 | 0.448 | 0.456 |
| 20 | 0.464 | 0.442 | 0.453 | |
| 40 | 0.462 | 0.447 | 0.455 | |
| LSDp=0.05 for genotype | 0.043 | |||
| LSDp=0.05 for N dose | - | n.s.* | ||
| LSDp=0.05 for S dose | - | n.s. | ||
| CCCI | EVI | GNDVI | NDRE | NDVI | Yield | |
|---|---|---|---|---|---|---|
| EVI | 0.93 | - | ||||
| GNDVI | 0.93 | 0.84 | - | |||
| NDRE | 0.98 | 0.96 | 0.94 | - | ||
| NDVI−1 | 0.93 | 1.00 | 0.84 | 0.96 | - | |
| Yield | 0.68 | 0.66 | 0.61 | 0.66 | 0.66 | - |
| LAI | 0.48 | 0.42 | 0.49 | 0.46 | 0.41 | 0.59 |
| Traits | Genotype | Equations | N kg per ha * (1) | Estimated Grain Yield (Mg ha−1) (2) | Maximum Value of Indices Estimated From (3) | Decrease N Dose (kg ha−1) (4) | In euro (5) (5) = 0.638 * (4) | Simulated Reduction in Grain Yield in kg (6) | Financial Loss after Yield Reduction (7) (7) = 0.21 * (6) | Result (8) (8) = (5) + (7) | |
|---|---|---|---|---|---|---|---|---|---|---|---|
| Coefficients of Equations Y = Ax2 + Bx + C Where x = Dose of N in kg | R2 | ||||||||||
| Grain yield | v1 | Y = −0.00008x2 + 0.015x + 4.69 | 0.69 | 94 | 5.39 | - | - | - | - | - | - |
| v2 | Y = −0.00008x2 + 0.0162x + 3.89 | 0.63 | 101 | 4.71 | - | - | - | - | - | - | |
| LAI | v1 | Y = −0.0001x2 + 0.0256x + 3.36 | 0.97 | 128 | 5.30 | 5.56 | −31.00 | −19.65 | −90 | −18.90 | −38.55 |
| v2 | Y = −0.00008x2 + 0.0219x + 2.91 | 0.92 | 137 | 4.60 | 4.91 | −36.00 | −22.92 | −110 | −23.10 | −46.02 | |
| NDRE | v1 | Y = −0.00001x2 + 0.0016x + 0.5046 | 0.75 | 80 | 5.38 | 0.57 | 14.00 | 8.88 | −10 | −2.10 | 6.78 |
| v2 | Y = −0.000009x2 + 0.0012x + 0.4466 | 0.89 | 67 | 4.62 | 0.49 | 34.00 | 21.56 | −90 | −18.90 | 2.66 | |
| CCCI | v1 | Y = −0.00001 x2 + 0.0014 x + 0.5814 | 0.83 | 70 | 5.35 | 0.63 | 24.00 | 15.22 | −40 | −8.40 | 6.82 |
| v2 | Y = −0.000006x2 + 0.0007x + 0.5535 | 0.89 | 58 | 4.56 | 0.57 | 43.00 | 27.26 | −150 | −31.50 | −4.24 | |
| NDVI | v1 | Y = −0.000007x2 + 0.0008x + 0.8655 | 0.58 | 64 | 5.32 | 0.89 | 30.00 | 19.02 | −70 | −14.70 | 4.32 |
| v2 | Y = −0.000007x2 + 0.0009x + 0.8075 | 0.78 | 57 | 4.60 | 0.84 | 37.00 | 23.46 | −110 | −23.10 | 0.36 | |
| GNDVI | v1 | Y = −0.000007x2 + 0.001x + 0.7647 | 0.71 | 71 | 5.35 | 0.80 | 23.00 | 14.58 | −40 | −8.40 | 6.18 |
| v2 | Y = −0.000007x2 + 0.0009x + 0.7208 | 0.89 | 64 | 4.60 | 0.75 | 37.00 | 23.46 | −110 | −23.10 | 0.36 | |
| EVI | v1 | Y = −0.000002x2 + 0.0003x + 0.4578 | 0.60 | 75 | 5.37 | 0.469 | 19.00 | 12.1 | −20 | −4.20 | 7.9 |
| v2 | Y = −0.000002x2 + 0.0002x + 0.4411 | 0.67 | 50 | 4.50 | 0.446 | 51.00 | 32.4 | −210 | −44.10 | −11.7 | |
Disclaimer/Publisher’s Note: The statements, opinions and data contained in all publications are solely those of the individual author(s) and contributor(s) and not of MDPI and/or the editor(s). MDPI and/or the editor(s) disclaim responsibility for any injury to people or property resulting from any ideas, methods, instructions or products referred to in the content. |
© 2023 by the authors. Licensee MDPI, Basel, Switzerland. This article is an open access article distributed under the terms and conditions of the Creative Commons Attribution (CC BY) license (https://creativecommons.org/licenses/by/4.0/).
Share and Cite
Kulig, B.; Waga, J.; Oleksy, A.; Rapacz, M.; Kołodziejczyk, M.; Wężyk, P.; Klimek-Kopyra, A.; Witkowicz, R.; Skoczowski, A.; Podolska, G.; et al. Forecasting of Hypoallergenic Wheat Productivity Based on Unmanned Aerial Vehicles Remote Sensing Approach—Case Study. Agriculture 2023, 13, 282. https://doi.org/10.3390/agriculture13020282
Kulig B, Waga J, Oleksy A, Rapacz M, Kołodziejczyk M, Wężyk P, Klimek-Kopyra A, Witkowicz R, Skoczowski A, Podolska G, et al. Forecasting of Hypoallergenic Wheat Productivity Based on Unmanned Aerial Vehicles Remote Sensing Approach—Case Study. Agriculture. 2023; 13(2):282. https://doi.org/10.3390/agriculture13020282
Chicago/Turabian StyleKulig, Bogdan, Jacek Waga, Andrzej Oleksy, Marcin Rapacz, Marek Kołodziejczyk, Piotr Wężyk, Agnieszka Klimek-Kopyra, Robert Witkowicz, Andrzej Skoczowski, Grażyna Podolska, and et al. 2023. "Forecasting of Hypoallergenic Wheat Productivity Based on Unmanned Aerial Vehicles Remote Sensing Approach—Case Study" Agriculture 13, no. 2: 282. https://doi.org/10.3390/agriculture13020282
APA StyleKulig, B., Waga, J., Oleksy, A., Rapacz, M., Kołodziejczyk, M., Wężyk, P., Klimek-Kopyra, A., Witkowicz, R., Skoczowski, A., Podolska, G., & Grygierzec, W. (2023). Forecasting of Hypoallergenic Wheat Productivity Based on Unmanned Aerial Vehicles Remote Sensing Approach—Case Study. Agriculture, 13(2), 282. https://doi.org/10.3390/agriculture13020282


