1. Introduction
Seed quality is impacted by postharvest practices and seed management. In order to produce high-quality seeds, it is important to regulate the various postharvest processes, such as drying and storage, where environmental factors, including moisture, temperature, and relative humidity, are vital [
1,
2]. Agricultural plant seeds that undergo technological drying have diverse behaviors based on their physicochemical characteristics. Some of them cannot withstand the harsh drying conditions caused by the air moving quickly through the product layer at high temperatures. One of the most energy-intensive postharvest procedures is grain drying [
3].
Heat transmission is a phenomenon that underlies a variety of specialized processes used in the food industry, including heating, cooling, evaporation, condensation, drying, distillation, etc. [
4,
5,
6]. For this purpose, Bizmark et al. [
7] developed a sequential method to model a continuous plug-flow fluidized bed dryer. The method is based on dividing the dryer into sections in a series with ideal mixing for both the solid and gas phases in each section.
Additionally, Naghavia et al. developed a nonequilibrium model of the grain-fixed deep-bed drying for rough rice, and Janasa et al. described the evolutions of maize moisture and salt-soluble protein content during fluidized-bed drying with a constant drying air temperature between 50 °C and 100 °C [
8,
9].
Both steady-state and dynamic simulations of a plug-flow fluidized bed dryer were conducted numerically [
10,
11].
In order to test the drying performance for a batch-type fluidized bed drying process for maize and unshelled pistachio nuts, referring to energy and energy efficiency, Ozahi and Demir [
12] developed and built a drier. For this, a number of experiments were conducted in the specified range of 50 to 75 °C and 6.87 to 10.86 m/s.
In order to investigate the temperature change within a small grain steel silo in a quasisteady state, a 3D numerical model was developed [
13]. As a result of axial dispersion, Khanali et al. [
14] model for shelled maize drying in a plug-flow fluidized bed dryer revealed a discontinuity at the solid inlet boundary of the bed, and subsequently dropped constantly over the dryer length.
A complex phenomenon known as heat transfer occurs when thermal energy is transferred between two separate locations or between two fluids as a result of a temperature difference (thermal potential) between them. The energy is transferred spontaneously from the area or fluid with a higher temperature to the one with a lower temperature because there is a thermal potential. The study of heat transfer focuses on dynamic processes in which thermal energy (for some parameters) is transformed into thermal energy in other parameters. A significant number of unit operations, work processes, equipment, and installations that are typical in the process industries are designed and used in accordance with thermal transfer laws.
Heat transmission is a phenomenon that underlies a variety of particular processes in the food industry, including heating, cooling, evaporation, condensation, drying, distillation, etc.
When drying cereal grains that are meant for human consumption, care is taken to guarantee their proper storage and preservation without lowering the nutritional value of the food.
At the same time, it is intended that the artificial drying process does not compromise the quality characteristics of cereal seeds and other plants.
Because of this, the process of artificially drying seeds is intricate and requires careful consideration when deciding the heat regime of the drying agent, depending on the initial moisture of the seeds and their physical state.
In general, the drying process is influenced by a few fundamental variables, including the material’s heating temperature, moisture content, and drying agent speed.
Studies and research are required to effectively employ the drying process for agricultural products, to appropriately guide it, and to calculate the drying facilities.
Currently, vertical and horizontal dryers with continuous and discontinuous functions are used throughout the world to dry the seeds of agricultural plants. The principle behind these dryers is dehydration by convection, where heat is transferred from the drying agent to the product through convection.
It is feasible to graphically depict the evolution of temperature and humidity fields at any point in the product layer by simulating the drying of grain seeds using CFD. The simulation is calibrated by comparing the results to data that were gathered experimentally and that were measured in the median area of each product layer.
The variations in temperature and humidity of grain seeds, as assessed under laboratory settings, provide information on the level of precision of the mathematical model derived by the CFD simulation. Additionally, a significant factor in these discrepancies is the mathematical model of the simplifying assumptions of convective drying, which was developed in light of the fact that this process is complicated by the abundance of the physical parameters that act as dependent variables and change simultaneously over brief periods of time.
The term “model” can be used to refer to a variety of things, including a machine, a notion, an equation, a person, etc. In its broadest meaning, a model is a physical or spiritual creation that, depending on the desired goal, resembles or behaves in a manner similar to the patterned item. The model is a simulation of reality that is used to study how the original would behave in various scenarios. Most of the time, the model is a condensed version of the original, retaining only the most important details.
The original or model object and the model must be analogous. This comparison could be structural or practical.
The characteristics of structural or isomorphic analogy include the presence of the original’s constituent parts in the model. The prototype and model share the same design and functionality. The pattern and the prototype are mathematically comparable if the geometry is respected.
Functional analogy relates to simplified models that just replicate the prototype’s input-output functions. Two types of models are crucial for engineering and machine design in the agrofood sector: mathematical and physical scale.
According to a study that analyzed data from 29 European countries from 1995 to 2016, there is a long-term relationship between energy efficiency and greenhouse gas emissions, and the volume of emissions declines as energy efficiency rises [
15].
The European Union (EU) member countries are working hard to meet the emission objectives as mitigating climate change has emerged as a key policy initiative. A study has looked into the factors necessary to reaching the sustainable development goals in terms of lowering environmental pollution in the EU member countries in order to provide policy guidance in achieving the emission objectives. The panel pool mean group autoregressive distributive lag (PMG-ARDL) model was used to estimate a balanced panel of 16 EU countries from 1997 to 2014. The analysis followed the equilibrium link between the ecological footprint, real gross domestic product, trade openness, fertility rate, and consumption of renewable and nonrenewable energy, as proposed by the Kao and Pedroni cointegration tests. The PMG-ARDL analysis supported the idea that using nonrenewable energy contributes to environmental degradation [
16].
In order to meet the EU’s energy and climate goals, renewable energy will be essential. It is not just widely available in the EU but also competitively priced with fossil fuels. As a result, it can assist in lowering the cost of our energy systems and decreasing the reliance of the EU on imported fossil fuels. Additionally, it could lead to the creation of a variety of new jobs, new business ventures, and economic expansion [
17].
In one work, horizontal pneumatic conveying was studied numerically using the discrete element method (DEM) and computational fluid dynamics (CFD), with particular emphasis on the use of periodic boundary conditions (PBC) for computational effectiveness. In order to generally manage the solid flow rate simulated in a CFD-DEM model with PBC, a new iterative approach was given. For various flow regimes, the characteristics of the flows in the start-up phase are thoroughly examined and contrasted with those in the well-developed flow section. Two semitheoretical correlations were developed on the basis of this information to forecast the length of the start-up section and the relationship between particle number and solid flow rate, respectively [
18].
Because of its unique capacity for volumetric heating, the ability to drastically cut drying time, and the capacity to enhance food quality, microwave convective drying (MCD) is garnering more and more attention. One paper’s major goal was to examine, evaluate, and critically analyze the recent developments in MCD and offer suggestions for the field’s future paths. The mathematical modeling and experimental studies in microwave convective drying of food items are the primary topics of the paper. The most recent advances in the mathematical modeling of MCD are described, along with the current experimental setup, its benefits, and drawbacks. The food industry is concerned about prolonged drying times. Calculations and discussions are carried out to determine how much faster MCD is at drying things than convection drying. It was clear that full integration had taken place [
19].
The drawbacks of earlier designs have been addressed by the development of a new spray-drying technique. The method’s systematic application of computational fluid dynamics (CFD) to direct innovation in the design process has been a major component. The creation of a box-shaped transitional feature between the bottom of the primary drying chamber and the entrance to the secondary chamber is an example of an invention. Physical tests showed that the box design was more effective in the three representative operating parameters, namely the current operating conditions, higher feed solids concentrations (30% solids rather than 8.8%), and a higher inlet drying temperature (230 °C rather than 170 °C). The yield (solids recovery) rose by 3% under the current settings, by 7.5% under the 30% feed condition, and by 13.5% at the higher temperature setting. According to statistical research, the wall flux significantly decreased at a high solids input concentration. The majority of the observed deposition in the box resulted from projected particle hits by an inertial deposition process on the box’s base, which underwent less deterioration because of lower temperatures. There is proof that, in comparison to other conventional designs, the box design is a better design option under all operating situations [
20].
In terms of supplying electricity for internal energy plant demands, as well as those of the national electric grid, cogeneration techniques have benefited the industry. Therefore, it is necessary to achieve the goal of diversifying the energy matrix. Utilizing new renewable energy sources and maintaining hydropower investments are the two components of a plan to make the electric grid less susceptible to the effects of climate change [
21].
In order to verify the accuracy of the CFD-DEM model, experiments of the fluidization of three different types of polyhedral particles were conducted under identical conditions with the corresponding simulations. The findings show that the CFD-DEM model with the polyhedron technique can reasonably predict polyhedral particle behavior. In this study, the fluidization behaviors of several polyhedral particles are also examined. Under the same fluidization gas velocity, the polyhedral particles move more forcefully and mix more thoroughly than spherical particles do [
22].
One paper’s objective was to demonstrate how recent numerical innovations have made it possible to simulate dense two-phase flows. For the simulation of 3D fluidized beds, a combined computational fluid dynamic and discrete element method (CFD-DEM) method was developed. While traditional CFD is used to simulate the fluid flow by solving the volume-averaged Navier-Stokes (VANS) equations, DEM is used to model the granular particle phase. The application of the velocity-pressure algorithm in the setting of the two-phase flows is highlighted in particular [
23].
According to a study, single-component homogeneity (OH), multicomponent heterogeneity of the moisture diffusion coefficient (MD), and multicomponent heterogeneity of the initial moisture content and moisture diffusion coefficient (MMD) were used to develop three-dimensional drying models of corn kernels. The experiments of nuclear magnetic resonance imaging (MRI) and infrared thermal imaging allowed for a thorough evaluation of the simulation results. The results showed that the temperature and moisture distribution in the various components during drying could be accurately described by the MMD model. Compared to the endosperm, the germs had a higher moisture content and lower temperature. Greater heat and moisture exchange caused the germ to dry out more quickly than the endosperm [
24].
The air-assisted centralized metering system’s seed feeding device’s gas-solid flow was studied numerically using a coupling of the discrete element method (DEM) and computational fluid dynamics (CFD). Software from EDEM and ANSYS Fluent were used to apply the discrete particle phase and define the continuum gas phase, respectively, in this model. The effects of the throat’s area, length, airflow inlet velocity, and seed feed rate on gas field and seed movement were investigated and assessed. According to the simulation results, throat length and seed feed rate had a minor impact on seed movement, but throat area and airflow inlet velocity had a significant impact on airflow outlet velocity and the seed velocity of the airflow direction, which was caused by drag force. In a specific range, the increase in throat area led to a drop in seed velocity and pressure loss. Low airflow entrance velocities caused the bounce and concentration effect when seeds traveled slowly. The resultant force and seed velocity developed as the airflow inlet velocity increased. For rapeseed and wheat, the appropriate airflow inlet velocities were 16–24 m/s and 20–24 m/s, respectively [
25].
In order to achieve uniform seed temperature distribution and lower the energy requirement, a drying baffled unit for agricultural seed was designed and simulated using computational fluid dynamics technology.
According to one theory, mathematical models are built upon three principles: for physical processes, there must be an equal number of independent equations as there are unknown sizes; any equation’s solution always yields the value of an unknown, and equations are organized so that each one yields one of the most significant quantities.
In order to represent the heat and moisture transmission in the aerated bulk storage grains, numerous mathematical models have been created. Many of them were harvested at low seed humidity levels and low temperatures.
Until this moment, there are a number of dryer variations have been created, including closed-circuit dryers, dryers with combined technical solutions, dryers with partial recirculation of the drying agent, and dryers with intermediate heating of the drying agent. However, none of these dryers are able to fix the issue of the drying agent flow homogeneity. For instance, the process is more active near the end of the drying agent’s mixing chamber in vertical dryers, such as with perforated concentric cylinders (dried seeds flow across the space created by the two concentric bodies).
A cylindrical drying unit with internal deflectors was constructed to balance the drying agent parameters throughout the surface of the product layer in order to address this issue and lessen its detrimental environmental impact. The Coandă effect serves as the foundation for the tronconic plates positioned inside the drying chamber. The main objective of the research was to determine how much the novel contour drying unit affects energy use, the amount of heat discharged into the atmosphere, and the quality of the dried maize seeds because there are currently only a few publications that discuss ways to reduce the heat produced into the atmosphere and the energy required for the seed drying process.
2. Materials and Methods
2.1. Drying Unit
The Agricultural Mechanization Laboratory of the Faculty of Agriculture, “Ion Ionescu de la Brad” University of Life Sciences, was the site of the experimental studies. The raw materials, including the hybrid DKC 4717 maize seed, hybrid P64LE20 sunflower seed, hybrid Mădălin barley, and hybrid Glossa wheat, were all harvested at four different stages of maturity.
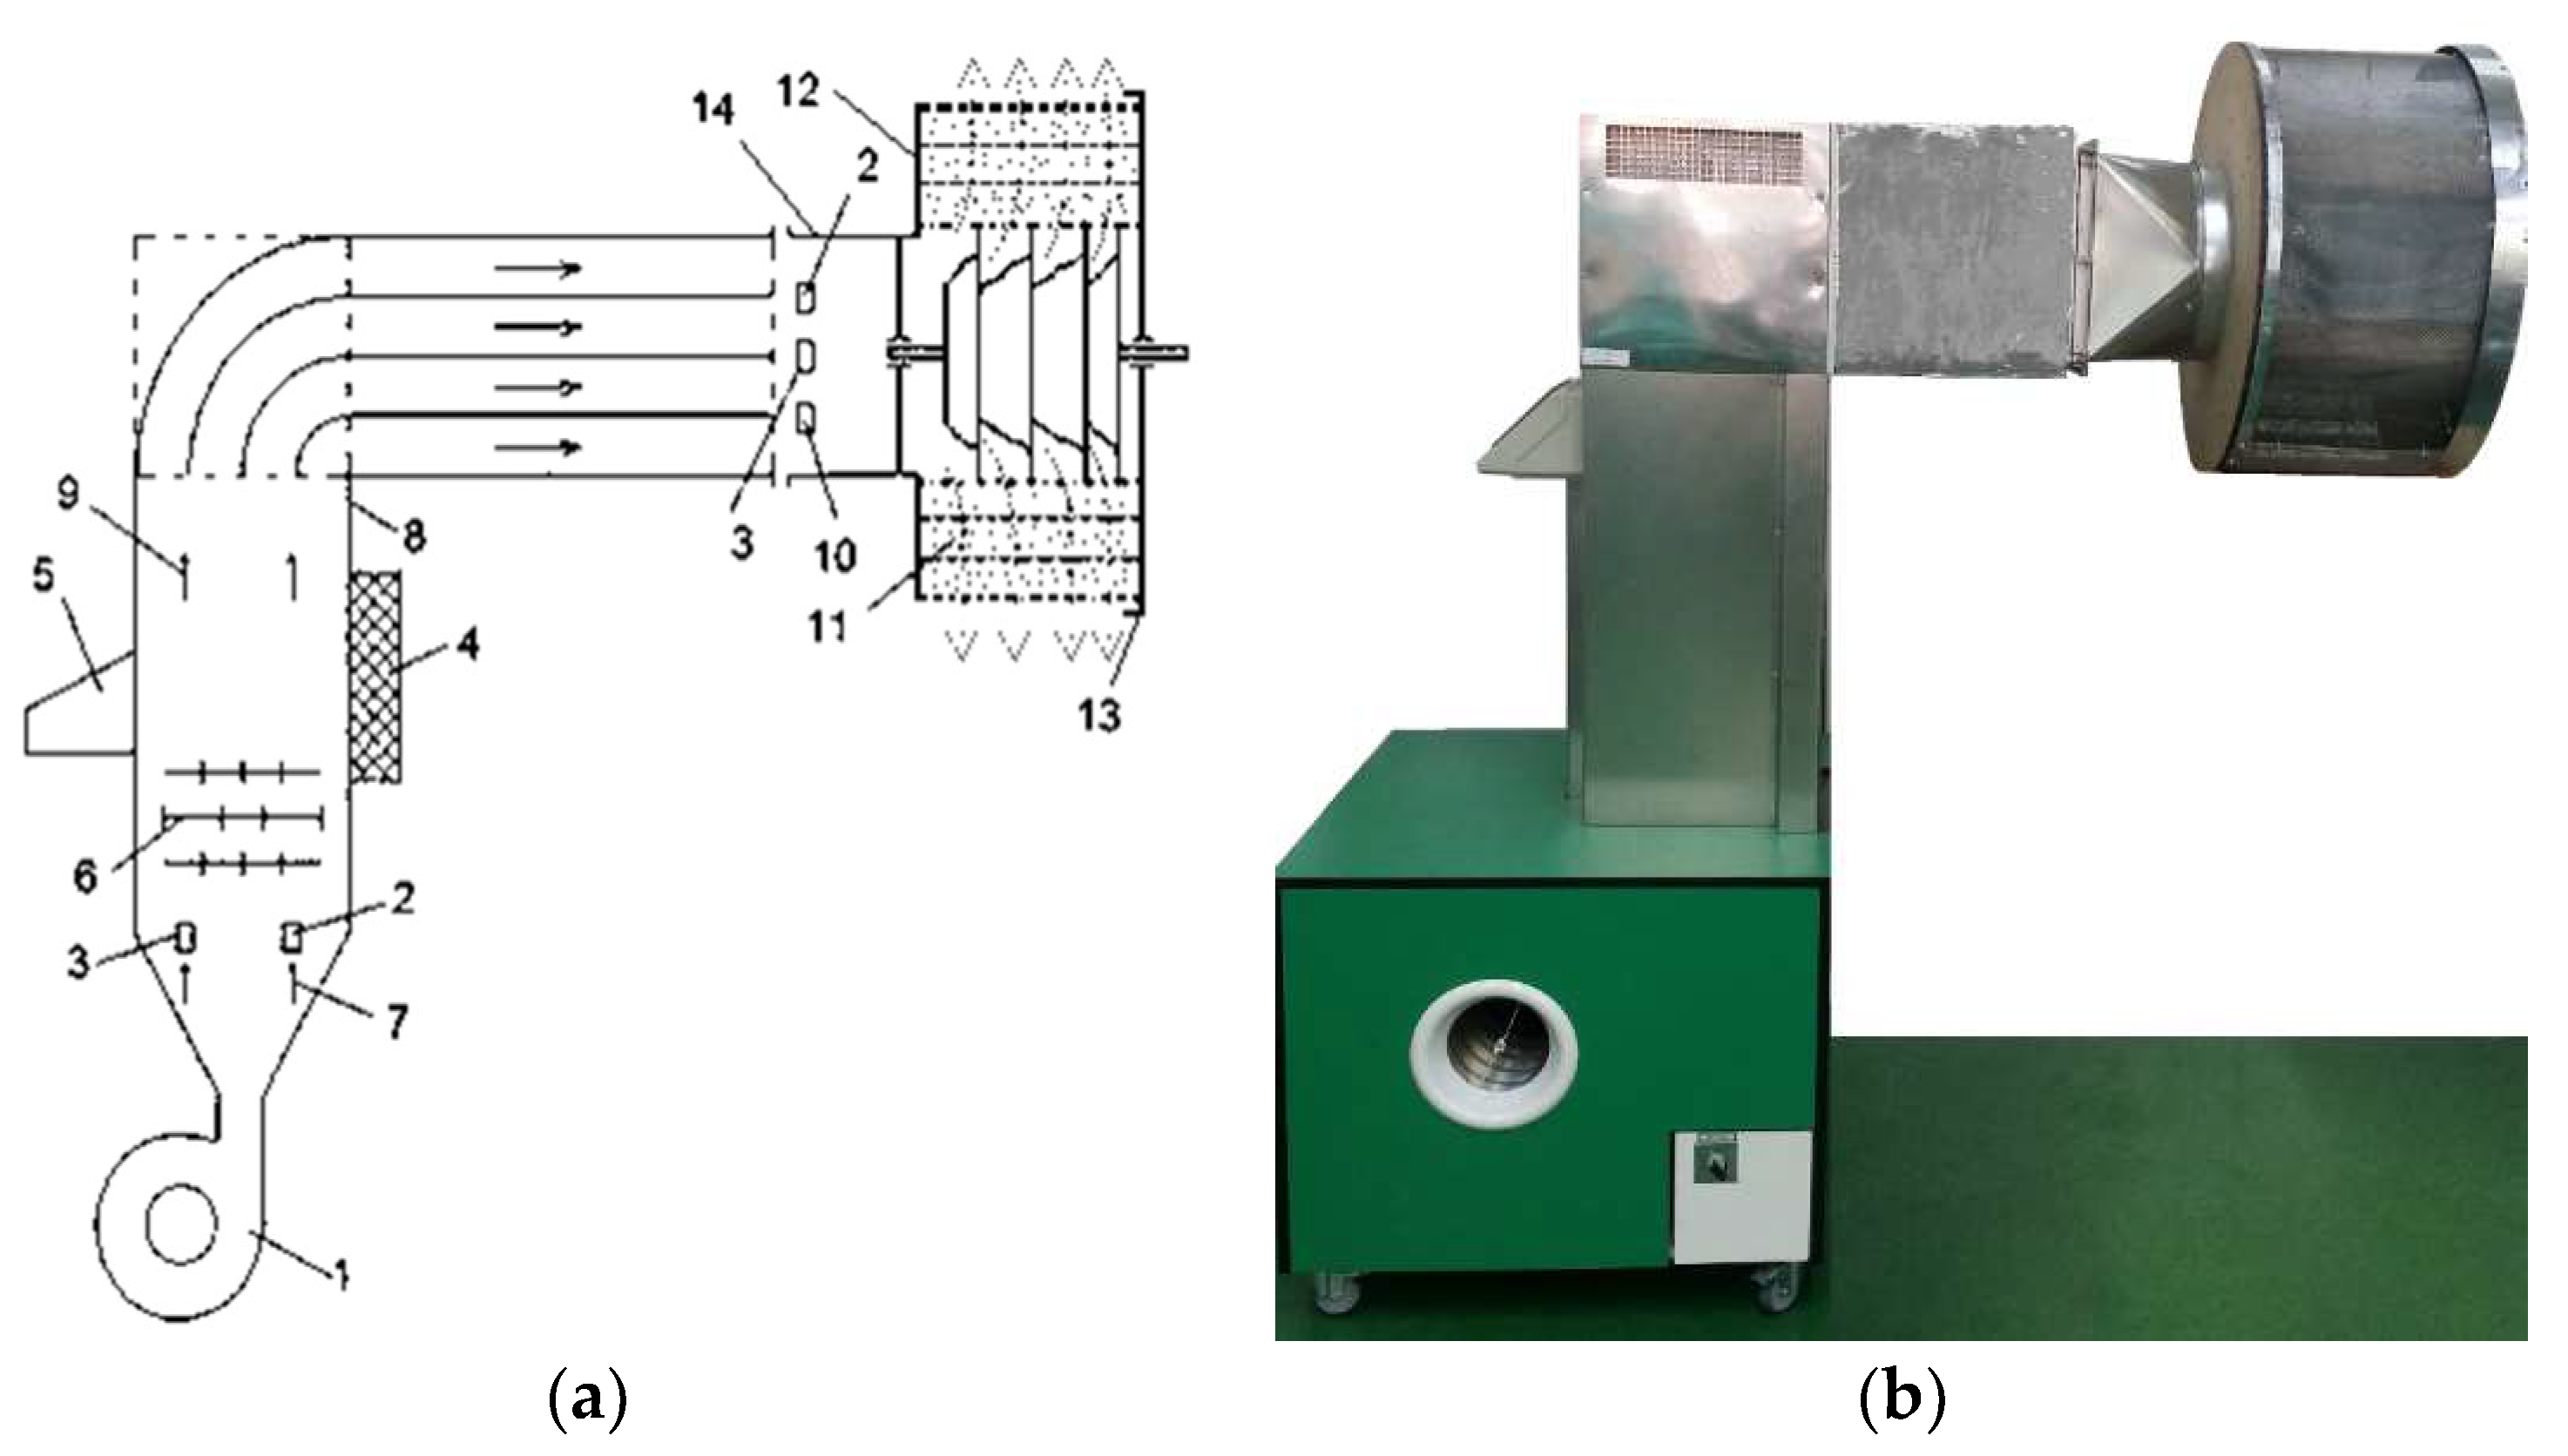
The motivation comes from a simulation of a laboratory drier (
Figure 1), where it was discovered that there was internal turbulence, and the seeds were dried at the unit’s end.
The dryer body was wrapped in glass wool to reduce thermal loss and experimental uncertainty. Inside the air duct, there were three 1500 W electrical elements that made up the heating system. An anemometer (with a measurement range of 0.4–20 m/s and an accuracy of 0.2 m/s) was used to measure the airflow, and an inverter was used to modify it. Three PT-100 temperature sensors, a programmable logic controller, and a power controller were used to manage the drying air temperature with an accuracy of 0.3 °C. Three Sensirion SHT 25 sensors were used to measure the ambient humidity, with an accuracy of 1.8% [
26].
A PID (proportional integral derivative) controller automation system, which regulates the temperature of the heating air, was installed in the system. The automation system’s LCD screen was used to configure, record, and display the drying agent’s temperature, humidity, and velocity. This enabled the recording of the temperature-time diagram as well as the date and time that the drying cycle started and concluded [
27]. The drying plant electrical scheme is presented in
Figure 2.
In order to improve the quality indices of the maize seeds susceptible to preservation, an experimental three-layer concentric seed dryer was created and developed to analyze the temperature and moisture content distribution. Additionally, it had interior conical baffles for both the cooling and drying areas.
In the design, operating, and optimization processes, mathematical modeling was employed. The mass balance, energy, and fluid dynamics theories served as the foundation for the mathematical model of the convective drying process.
The warm air’s operational parameters of velocity and temperature were varied while the experiments were being run. Sensors placed in each of the three layers were used to measure the product’s temperature and humidity. Additionally, several moisture and temperature sensors were used to track the hot air’s moisture and temperature both before and after it penetrated the corn seed layer.
The dryer measures 3 m in height, 1 m in diameter, 0.1 m in grain layer thickness, 0.4 m in drying/cooling section height, and 0.2 m in warm air intake diameter.
2.2. Drying Simulation
Using settings for corn seed, the simulation was run in two drying versions at 313 K (40 °C) and 343 K (70 °C) using a drying agent speed of 2 m/s. The conical baffles were used to provide a consistent flow.
With three distinct mesh densities and mesh sizes ranging from 1,500,000 to 5,670,000 to 8,358,000, grid independence research was conducted. The best mesh density for ac-curate simulation and reasonable computational time was 5,670,000 cells (volumes). The meshing is optimized to prevent errors from occurring during the calculation stage. Using the software Gambit v. 2.2.30, the unstructured type of tetrahedral elements at a quality 0.8 was used for the vertical dryer model with heat recovery.
The turbulent k-model, a typical model in CFD simulation for modeling hot airflow within a vertical dryer, was utilized in the processing stage. The simplest model that captures “complete” turbulence is the k-standard model. It is a turbulence form with two transport equations, allowing for an independent evaluation of the turbulent velocity and length scale.
One or more terms may be ignored, depending on the physics underlying the air movement. In the stage of processing, mathematical models are utilized to specify the goal of deriving the vertical dryer’s flow field and hot air’s route from a set of equations and equations defining materials’ physical properties.
The hot air inlet section’s air velocity, which ranges from 0.1 to 6.9 m/s is thought to be constant. The boundary condition for the hot air in use was atmospheric pressure (101,325 Pa = 1 atm), which was imposed as a free discharge into the environment (out-flow type).
Overpressure was considered 0. The airflow through the deflector walls and air duct was also considered 0.
The primary method of approximation by meshing continuous environments uses numerical meshing techniques. The process of discretization entails breaking down a continuous analytic domain (such as 2D or 3D geometry) into a finite number of discrete elements and then approximating the entire system by assembling the discrete pieces.
By integrating the partial derivative equations on the finite control volume V (), the first- and second-order integrals appear, which will take a discretized form respecting the values of the function in the neighboring volumes. The areas of separation between the adjacent control volumes are, in this case, discontinuous surfaces. The values of the function u on these surfaces are considered equal to the arithmetic mean of the values corresponding to the volumes placed on one side of each other.
Integrating first-order derivatives has a discreet overall form:
where i, j, and k, as the index, represent the natural number
Second-order integration by a direction will be
Derivatives at the edge of the control volume can be expressed as a ratio between the difference in values of the corresponding function of two neighboring nodes and the distance between them:
Entering the Equation (3) into (2) results in
Similar for the other two directions:
The expressions of the integrals of the mixed derivatives can be obtained using the integration of second-order mixed derivatives:
An analysis of the working range, which is volumetrically represented by the cylindrical unit, is required for finite-volume discretization. Three slots in the shape of a cylinder allow for the introduction of the grain seeds for drying. A cylindrical tube that connects to the dryer directs the hot air into this cylindrical box from the center.
Figure 3 depicts the mesh geometry of the three-layer cylindrical unit.
The boundary conditions necessary to determine the system of equations are imposed during the CFD simulation process, and the equation system is calculated using the Gauss–Seidel iterative method at each node in the analysis domain. Numerous solutions can be obtained using the suggested method and the limit conditions stipulated, which are shown in
Table 1 and
Table 2. The choice of mathematical model, the contour conditions, and the mesh quality all affect how quickly solutions come to a consensus.
2.3. Experimental Tests
The porosity index was determined experimentally by scanning a determined volume (68.7 cm3) of a seed with a 3D SKYSCAN 1172 micro CT scanner at a resolution of 27.224 μm.
In an experiment, layer I had a moisture content of 11.5%, layer II had a moisture content of 11.7%, and layer III had a moisture content of 14% at the end of the drying process. Layer I also had a porosity index of 38.5%, layer II had a porosity index of 38.0%, and layer III had a porosity index of 37%. Both at the start of drying (when corn seed humidity was 25%) and the end of drying (when maize seed humidity was 11.5%), the porosity index was measured (
Figure 4).
The mathematical model includes the porosity index, with subunit values ranging from 0.345 to 0.385. The porosity index of a layer of material in a CFD simulation using the FLUENT program ranges from 0 to 1, with 0 representing a totally closed layer and 1 representing a completely open layer (Ansys Fluent, 2012).
Corn seed humidity varies depending on the relative humidity of the air (
Table 3).
The corn seed moisture balance taken into account was 11.5%, and the initial humidity was 25%. In this humidity range, the absolute humidity is calculated according to
Table 4.
Using corn seeds with three initial moisture contents (25, 22, and 19%), the drying experiments were carried out under the same conditions for both the conventional variant and the proposed cylinder unit. The operating parameters of the warm air’s velocity and temperature (between 1–2.5 m/s, respectively, at 40–80 °C) were varied and monitored. Each seed sample weighed 10 kg and was dried until it reached 14% moisture content. The drying time and energy consumption were recorded during this process.
A Voltcraft Energy Logger 4000 was used to measure the power consumption and store it in the internal memory in order to determine the amount of energy consumed. The SDHC memory card was used to send the recorded data to the computer for thorough analysis.
According to Equation (8), the heat (
Q) provided to the seed layer was calculated. The heat for the dry substance, the heat produced in the atmosphere as a result of the evaporation of water from the seeds, and the specific latent heat of water evaporation make up the overall amount of heat.
where
mds is the dry substance mass (kg);
cds—dry corn seed specific heat (J/kg × K);
mew—evaporated water mass (kg);
cew—water specific heat (4182 J/kg × K at 293.15 K); Δ
T—the difference between the seed temperature at the end of the drying process and the initial temperature (K), and
L—specific latent heat of evaporation of water (2264 J/kg).
Regarding the specific heat of corn seeds, it was also taken into account that this varies according to temperature and humidity [
28]; the values are presented in
Table 5. The amount of heat released into the atmosphere or that used the values of the specific heat of water vapor according to [
29] are indicated in
Table 6. Finally, the mass of evaporated water was calculated as the difference between the mass of the seeds before and after the drying process.

 ,
, 


