Abstract
The international plant trade is considered to be the main pathway causing the spread of oomycetes internationally, especially when live plants are accompanied by soil or potting substrates. Modern, rapid shipping technologies, together with inadequate management practices in nurseries, increase the probability of survival of plant pathogens and the subsequent chances of disease outbreaks in new locations. The survival of two oomycete soil-borne pathogens, Phytophthora cryptogea and Phytophthora cactorum, was studied in two different commercial potting substrates (peat-based and peat-free) in the absence of a plant host under simulated nursery conditions in a glasshouse for 21 months. Colony forming units (CFUs) of both pathogens were recovered 21 months after substrate inoculation, with a decrease in CFUs of between 92 and 99%, depending on the pathogen and substrate. Eucalyptus globulus plants were then planted into these inoculated pots. After 21 months, P. cryptogea and P. cactorum remained capable of producing diseases in E. globulus plants, resulting in up to 30% mortality and an up to 5-fold greater disease severity. These results highlight the ability of these pathogens to survive in the absence of a suitable host plant in potting substrates over time and to then have the capacity to infect a plant. This research adds to the body of essential evidence that is required to develop meaningful management practices and potting substrates at the nursery level to minimize the risk of the spread of oomycetes through the international plant trade.
1. Introduction
Oomycete pathogens are a global threat to forestry and agriculture causing serious disease outbreaks in nurseries and the wider environment, including parks, gardens, and forest ecosystems [1,2,3,4]. Oomycetes produce long-lived dormant propagules such as oospores and chlamydospores capable of persisting for long periods of time in plant substrates in the absence of a host and these can then infect plants when favorable conditions occur [5,6,7,8] Based on work in Illinois, USA, Badadoost et al. [9] assessed the survival of Phytophthora capsici oospores in a variety of soils differing in texture and other characteristic. Their work showed that oospores of P. capsici could survive and remain virulent in soil for up to two years. Phytophthora ramorum has been reported to be able to survive for eight months in root balls and potting substrates of Rhododendron plants in the absence of aerial or root symptoms [10]. North American P. ramorum isolates (A-2 mating type) and European P. ramorum isolates (A-1 mating type) were shown by Linderman et al. [11] to survive for up to six months when introduced as sporangia or for up to 12 months as chlamydospores in several potting media components or soil. Vannini et al. [12] studied the survival and pathogenicity of Phytophthora × cambivora in a peat-based substrate in the absence of a host and showed an unexpectedly prolonged survival rate over time; propagules maintained an ability to infect chestnut root baits for up to 45 days. The survival of Phytophthora cinnamomi has been investigated in several studies which showed different survival rates, depending on the experimental conditions, of up to 6 years [5,8,13,14]. The potential problems associated with this clear ability of plant pathogens to survive in the absence of a host and retain the ability to reinfect is exacerbated by the extensive movement of soil and substrates associated with trading plants worldwide. This pathway has been identified as the most common risk pathway for the movement and introduction of plant pests and pathogens globally [15,16].
In recent years, studies such as [17] have increasingly recognized the urban environment as a niche allowing newly introduced species to adapt to the novel environment prior to their dispersal to more natural ecosystems. Thus, urban forests and botanical gardens can be reservoirs of a diverse range of invasive pathogens due to their introduction through the nursery trade; this problem also, however, creates a substantial monitoring opportunity [18,19]. Such an opportunity was embraced by the innovative Phyto-threats project, a collaborative project that examined the risk of Phytophthora spread through nursery and trade practices across the UK over a 3-year period beginning in 2016 [15]. A number of model outputs from the global Phytophthora databases were integrated into prototype tools to help influence policy and practice [15]. Furthermore, in 2020, a two-year EUPHRESCO project (“Early detection of Phytophthora in nurseries and traded plants of EU and third countries”) commenced, involving the rolling out of the nursery sampling and metabarcoding methodology developed as part of the Phyto-threats project across twelve partner countries [15]. These recent advances bode well for the future development of a coordinated strategy for the early detection of Phytophthora pathogens in plant nurseries globally. There are many aspects to consider, not least the geographic variations in the thermal preferences of pathogens [20] and the effect of drought [21]. In the study by Wu et al., it was concluded that greater attention should be paid to preventing the movement of pathogens from warmer to cooler places [20].
In recent years, potting substrates and growth media formulations have been examined from perspectives of global warming, environmental impact and contamination, costs of production and biocontrol, and culture methods for soil-borne plant disease suppression [22,23]. Regarding the latter, organic substrates have been linked to plant disease suppression due both to the presence of microorganisms such as Trichoderma species [24,25,26] and to the effect of the decomposition of organic matter on disease suppression [27]. However, a better understanding of how soil-borne pathogens interact with the diverse physico-chemical substrate properties is needed to generate new commercial potting substrates that provide the capacity to inhibit soil-borne plant pathogens in the nursery, e.g., the decreased use of substrates that may enhance vectors of diseases, and the exploration of potting mix substrates that may improve disease suppression.
This work investigated for the first time the biology, survival, and infection abilities of the pathogens Phytophthora cryptogea and Phytophthora cactorum in two different substrates, peat-based and peat-free, in the absence and presence of a model host plant, Eucalyptus globulus. The results add to the body of essential evidence that is required to develop meaningful management practices to minimize invasive Phytophthora diseases in natural ecosystems.
2. Materials and Methods
2.1. Media
This study used potato dextrose agar (PDA, 39 g/1L dH2O, Oxoid, England); nutrient broth (NB, 13 g/1L dH2O; Oxoid, UK); tryptone soya broth (TSB, 30 g/1L dH2O; Oxoid, UK); unclarified V8 broth 20% (20% UV8, 200 mL V8 juice, 3 g CaCO3, 800 mL dH2O); selective medium, CMA-PARBP(H) (17 g L−1 corn-meal agar—CMA, Oxoid, England; amended with 10 mg L−1 pimaricin, 250 mg L−1 ampicillin, 10 mg L−1 rifampicin, 10 mg L−1 benomyl, 100 mg L−1 PCNB, and 10 mg L−1 hymexazol [28]).
2.2. Phytophthora Isolate Collection and Preparation
The isolates used in this work were originally obtained and identified in previous works [29]. Phytophthora cactorum P-138 (GenBank Accession MF115318) was isolated from the soil of a Viburnum × burkwoodii ‘Park Farm hybrid’ plant in 2014 at the University of Aberdeen. Phytophthora cryptogea E2 (accession number in progress, temporary: OQ430842) was isolated from the soil under a beech (Fagus sylvatica) hedge in north-east Scotland in 2013. The cultures were maintained on PDA at 25 °C. To check for bacterial contamination, the sub-cultures were periodically transferred to nutrient broth (NB) and tryptone soya broth (TSB).
2.3. Preparation of Phytophthora Inoculum
The inoculum of Phytophthora spp. was prepared by growing the isolate for 3–6 weeks at 25 °C on sterilized millet seeds (autoclaved twice with 24 h between runs) thoroughly moistened with sterile 20% UV8. Millet grain (50 g) was mixed with 35 mL V8 broth in 175 mL autoclaved glass vessels. Each vessel was inoculated with 5 1.5 cm2 plugs of 4–7 d-old Phytophthora spp. from cultures growing on PDA and incubated at 25 °C in the dark until mycelium had colonized the entire substrate (4–6 weeks) [30]. The inoculated millet mix was shaken every two days to ensure homogeneous colonization. After 4–6 weeks, the prepared inoculum was rinsed 3 times with sterile distilled water to remove unassimilated nutrients prior to inoculation of the plant substrates. Controls were prepared as described above but inoculated with sterile agar plugs.
2.4. Inoculation of PB and PF Substrates
Two commercial nursery substrates, one peat-based (PB: All-purpose growing media, Sinclair) and the other a peat-free substrate (PF: Sylvamix peat-free growing media, Melcourt) were placed in 1.5 L black plant pots (13 × 13 × 13 cm) with water drainage holes at the bottom. In total, 10 pots and 10 controls were prepared for each type of substrate and each pathogen. For each pot, one liter of substrate was mixed with 20 g of inoculum and the pots maintained under greenhouse conditions with watering at weekly intervals. The controls and inoculated pots containing different substrates were kept on separate benches in the same greenhouse and the pots were covered with a white nylon mesh to minimize potential cross-contamination. The substrates were inoculated in February 2019 and left in the greenhouse for five months before sampling for the first time. Five subsequent samplings were carried out at increasing intervals; the last sampling was carried out 21 months after inoculation.
2.5. Survival of P. cryptogea and P. cactorum
A selective medium, CMA-PARBP(H), was used to enumerate P. cryptogea and P. cactorum [28]. To confirm the identities of both P. cryptogea and P. cactorum colonies growing on the selective medium, hyphal tips were transferred to PDA and the morphological features observed under a light microscope (Olympus BX61, Olympus, UK).
The pathogen survival was quantified using the soil dilution plate technique [31]. Sampling was carried out in months 5, 8, 12, 15, 17, and 21 after inoculation. Substrate samples were processed according to the ‘coning and quartering’ technique [32]. Each 10 g sample was suspended in 100 mL sterile distilled water and the mixture was stirred for 1 h. Dilution series were prepared from 10−1 to 10−4 using sterile distilled water. Aliquots (100 μL) of the dilutions were spread uniformly in triplicate onto selective media in Petri dishes. The cultures were incubated at 25 °C in the dark and checked and marked every 24 h until no further new colonies appeared. On each sampling date a sample was taken to determine the water content of each potting mixture by comparing the wet weight and the dry weight of the substrates after drying at 105 °C for 24 h or until the soil dry weight was constant. The average colony forming units (CFUs) on the three replicate Petri dishes was determined and expressed as CFUs/g dry substrate.
2.6. pH Measurement of Substrate
An adapted protocol based on [33] was used to measure the pH of the substrate. On each sampling day, 10 g of fresh substrate was added to 250 mL 10 mM calcium chloride (CaCl2) in a 50 mL centrifuge tube which was shaken on an end-over-end shaker for 1 h; the sample was left to settle for 1 h and the pH of the supernatant was measured using a pH electrode at room temperature using a Hanna pH20 m (Hanna, IL, USA).
2.7. Mineral Nitrogen Content of Substrate
Nitrogen (NO-x) and ammonia (NH4) concentrations were analyzed following the protocol described in [33]: 10 g substrate was mixed with 100 mL 1 M potassium chloride (KCl) in a conical flask and shaken for 1 h on a rotatory shaker at room temperature; 2 control flasks (with KCl only, no sample) were included. After settling for 1 h, the clear supernatant was filtered using 2 layers of Whatman No.1 filter paper (Whatman, GE Healthcare Life Sciences, UK) and the filtrate was stored at 4 °C until analysis. The ammonia and nitrogen concentrations were determined with the cadmium reduction method on a continuous flow spectrophotometer using FIAstar 5000 Analyzer unit (FIAstar 5000, Foss Tecator, Denmark).
2.8. Pathogenicity Assay
Pathogenicity tests using Eucalyptus globulus as a model plant were performed on (i) the inoculated pots (after 21 months, designated P. cryptogea 21 and P. cactorum 21), (ii) the control pots (no pathogen), and (iii) the pots newly inoculated with each pathogen (designated P. cryptogea 0 and P. cactorum 0).
Eucalyptus globulus seeds were sown in a potting mix substrate in 54 cell plug trays (L35 mm × W36 mm × H47 mm) and kept in a growth chamber at 20 °C with 12 h photoperiod (80.72 µmol m−2 s−1; 60% humidity) and misted with tap water 2–3 times per week. After 6 weeks, the seedlings/trays were transferred to the greenhouse (20–25 °C daytime temperature, 15–20 °C nighttime temperatures; 12 h photoperiod light/dark; 185 µmol m−2 s−1) and kept moist until they developed a strong root system and were ready to transplant to the experimental pots. Similarly sized healthy young seedlings were transferred to inoculated or control pots (one seedling per pot) and watered three times per week. After 15 days, the following parameters were assessed prior to harvesting:
1. Mortality—by recording living/dead plants.
2. Disease severity—by visually rating foliar symptoms and root rot using a modified 0–4 disease severity scale [34]:
Foliar symptoms disease severity: 0 = foliage without visible infection symptoms; 1 = foliage yellowing; 2 = foliage yellowing and tip wilting; 3 = yellowing, tip and total foliage wilting; 4 = plant dead.
Root rot disease severity: 0 = roots without visible infection or discoloration; 1 = roots with light discoloration and light root and stem rot; 2 = short roots with discoloration; 3 = short roots with severe discoloration and root rot; 4 = plant dead.
To harvest, the roots were washed in tap water and the plants were transferred to the analytical laboratory to proceed with the measurements of plant height and fresh and dried plant weight. The plant height measurements were carried out with electronic digital calipers. The plants were weighed on an analytical balance before and after drying. The plants were dried until reaching a constant weight in a Gallenkamp drying oven at 60 °C, generally for 24–48 h.
Re-isolations of P. cryptogea and P. cactorum were performed for each inoculated pot after plant harvesting. The original isolate cultures used for inoculation and the re-isolated cultures from roots and soil were transferred to CMA-PARBP (H) [28], incubated at 22 °C for 4–5 days, and the colonies derived from the emerging hyphae were identified by morphological comparison [14].
2.9. Statistical Analyses
Both the survival assay (absence of plants) and the pathogenicity assay were analyzed for differences among the response variables examined, and a model selection for pathogen survival-evolution and pathogenicity was developed. Data were analyzed using R (v 3.3.1; R Foundation for Statistical Computing, Vienna, Austria) with an Open-Source License.
2.9.1. Survival Statistical Analysis: Colony Forming Units, Soil Properties, and Model Development and Validation for Each Pathogen
CFU values obtained for each pathogen (response variable) were log transformed; logCFUs, pH values and ammonia (NH4) and nitrogen (NO-x) measures were compared for each pathogen, type of substrate, and sampling date. First, normality and the homogeneity of variances were tested. When those hypotheses could not be assumed, the Kruskal–Wallis comparison test and Dunn’s test for multiple comparisons were used. When normality and homogeneity of variances were present, an ANOVA test was used, and, if significant differences were observed, a multiple comparison of means by Tukey contrasts was applied. If the data have a normal distribution but the variances were not homogeneous, the Welch test one-way analysis of means, not assuming variances, and pairwise comparisons using t-tests with non-pooled SDs were used. In all cases, a significance level of p < 0.05 was applied.
The logCFU values (response variable) obtained from each pathogen, substrate, and sampling date were used to develop a linear model (for each pathogen). The model included the explanatory variables: sampling date, substrate, pH, NH4, NO-x, and the interactions of time with substrate, pH, NH4, and NO-x. Model selection was made using hypothesis testing for each explanatory variable, where the effect on the CFUs (response variable to assess pathogen survival) was assessed using the ‘drop1’ function and single variable term deletions.
To validate the model, a graphical validation model approach was applied in which the residual values (the differences between the predicted values and the observed values) and the standardized residuals (residuals divided by their standard deviations were used to quantify how large the residuals were in standard deviation units and were therefore useful to identify outliers) were calculated and plotted.
2.9.2. Pathogenicity Statistical Analysis: Model Development and Validation for Each Pathogen
The pathogenicity response variables of P. cryptogea and P. cactorum on E. globulus in PF and PB substrates recently inoculated (P. cryptogea 0 and P. cactorum 0) or 21 months after inoculation (P. cryptogea 21 and P. cactorum 21) were evaluated using different tests, depending on the nature of both the variable and the data.
In the pathogenicity experiments, the variable ‘Mortality’ (dead-alive) was binary and Fisher’s test was used; multiple comparisons were carried out using Fisher’s pairwise comparisons test. Root disease severity and foliar symptoms were considered as qualitative ordinal variables that could not be properly analyzed as continuous variables; thus, data were analyzed using the Wilcoxon test to illustrate differences between control and inoculated plants and multiple comparisons analyzed using Dunn’s test. The variables plant height, fresh weight, and dry weight were considered as continuous variables and analyzed as previously described for the CFU variables’ survival assay.
The model selection for pathogen effects on E. globulus was developed for each continuous response variable (height, wet weight, dry weight), including the multiple explanatory variables time, pathogen, substrate, and their interactions. Model selection and development for each pathogen were carried out as described for the pathogen survival assay in the absence of plants.
In all statistical analyses, a significance level of p < 0.05 was applied.
3. Results
3.1. Survival of P. cryptogea and P. cactorum in PB and PF Substrates
The plating on a selective medium effectively inhibited the development of bacteria and other undesired microorganisms and contributed to the efficient recovery and enumeration of both P. cryptogea and P. cactorum over 21 months. Phytophthora cryptogea and P. cactorum CFUs (Figure 1) were recovered from both the PB and PF substrates after 21 months, although the recovery of CFUs decreased over time. CFUs of P. cryptogea in both PB and PF showed a continuous significant decrease from 5 to 12 months, levelling off at 15 and 17 months, and thereafter showing a considerable decrease at 21 months, particularly in the PF substrate. For P. cactorum, the results were similar but a comparable decrease at 21 months for PF was not observed.
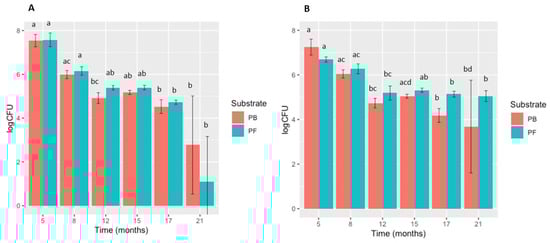
Figure 1.
Survival of Phytophthora cryptogea and P. cactorum in peat-based (PB) and peat-free (PF) substrates: (A) P. cryptogea CFUs/g dry substrate; (B) P. cactorum CFUs/g dry substrate). Vertical bars indicate standard deviation (SD); n = 5 for each sampling date. Different letters above bars indicate significant differences between sampling dates after inoculation (p < 0.05).
CFUs of P. cryptogea decreased significantly between 5 and 8 months, then continued to decrease gradually (Figure 1). For PF, the final sample at 21 months showed a drastic and significant decrease in CFUs. In contrast, P. cactorum CFU recovery decreased significantly at each time point up to 12 months with a more gradual decrease from 12 to 21 months in the PF substrate, whereas in the PB substrate a significant decrease was observed at 21 months.
Thus, P. cactorum behaved in a similar way to P. cryptogea in terms of survival in both substrates but was recovered in higher quantities throughout the time course of the work and especially at 21 months, the final sampling date.
Regarding the potential effect of the different substrates on pathogen survival, the model developed with the results of this assay (Table 1) showed that the differences produced by the effect of the growing media substrate were significant.

Table 1.
Data collected during soil samplings of Phytophthora cryptogea (A) and P. cactorum (B), respectively, in peat-based (PB) and peat-free (PF) substrates over 21 months; statistical tests used for the analysis of significant multiple comparisons differences among sampling dates. Different letters indicate significant differences between sampling dates after inoculation (p < 0.05).
In summary, after inoculation into PB or PF substrates, both P. cryptogea and P. cactorum were isolated over a period of 21 months. Significant differences in survival, based on CFU recoveries, were found between the sampling dates (PB: P. cryptogea p = 8.613 × 10⁻⁶; P. cactorum p = 7.73 × 10⁻⁵; PF: P. cryptogea p = 5.419 × 10⁻⁵; P. cactorum p = 3.577 × 10⁻⁴). From 5 months (first sampling) to 21 months after inoculation, the recovered CFUs decreased by 99% for PB (both species); recovery also decreased by 99% in PF for P. cryptogea and by 92% in PF for P. cactorum.
The pathogens exhibited different survival abilities depending on the substrate used. Initially, a similar decrease pattern of CFUs was observed for the two pathogens in both PB and PF but differences between the pathogens began to emerge with time. A slightly lower recovery of P. cryptogea CFUs in PB compared to the PF substrate were observed during the first 17 months of incubation until the sampling at 21 months, in which the recovery of CFUs was higher from PB than PF. In contrast, CFUs of P. cactorum were recovered in lower quantities in PF compared to PB at 5 months, but the pathogen survival was higher in PF compared to PB until the final sample at 21 months after inoculation. The model developed with the results of this assay (Table 1) showed that the differences produced by the effects of the growing media substrate were significant. The summarized results of the statistical analyses over 21 months for each pathogen and substrate, as well as the tests applied for multiple comparisons, are shown in Table 1.
3.2. Substrate pH Values, Ammonia (NH4) and Nitrogen (NO-x) Concentrations
The pH was measured for each substrate and inoculated species at each sampling date. Throughout the 5 to 21 month time period, for P. cryptogea, the pH ranged from 4.65 ± 0.33 to 5.07 ± 0.16 in PB and from 5.66 ± 0.31 to 6.18 ± 0.11 in PF. For P. cactorum, the pH ranged from 4.46 ± 0.15 to 5.13 ± 1.02 in PB and from 5.82 ± 0.26 to 6.28 ± 0.12 in PF (Table 1).
The changes in substrate pH followed similar patterns with time, type of substrate, and pathogen species. The PF substrate had a higher pH value throughout the assay than the PB substrate, however, no significant differences were found between the sampling dates, substrate types, or pathogen species inoculated (Table 1).
The substrate levels of NH4 showed a progressive increase over time (Figure 2). For P. cryptogea, the NH4 concentrations ranged from 0.29 ± 0.07 to 0.76 ± 0.29 in PB and from 0.27 ± 0.07 to 0.79 ± 0.04 (mg/L) in PF over 5 to 21 months. For P. cactorum, the NH4 concentrations ranged from 0.37 ± 0.10 to 0.71 ± 0.15 in PB and from 0.27 ± 0.05 to 0.77 ± 0.15 (mg/L) in PF. Thus, the NH4 concentrations in both substrates for P. cryptogea and P. cactorum tended to increase over time. The differences in the NH4 concentrations for both pathogens and substrates were pathogen species-specific with time in the different substrate types (PB: P. cryptogea p = 8.613 × 10⁻⁵; P. cactorum p = 0.0147; PF: P. cryptogea p = 5.419 × 10⁻⁵; P. cactorum p = 4.67 × 10⁻⁵).
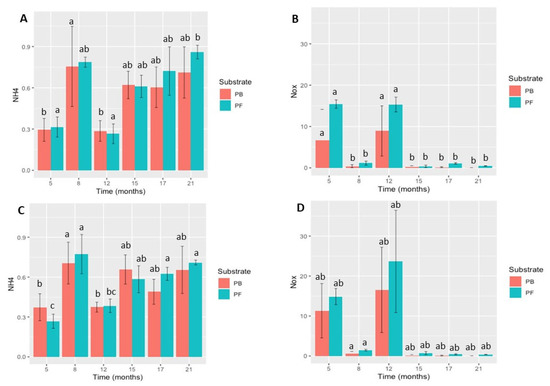
Figure 2.
Survival of Phytophthora cryptogea and P. cactorum in peat-based (PB) and peat-free (PF) substrates: (A) ammonia (NH4) concentration (mg/L) of peat-based and peat-free substrates inoculated with P. cryptogea; (B) nitrogen (NO-x) concentration (mg/L) of peat-based and peat-free substrates inoculated with P. cryptogea; (C) ammonia (NH4) concentration (mg/L) of peat-based and peat-free substrates inoculated with P. cactorum; (D) nitrogen (NO-x) concentration (mg/L) of peat-based and peat-free substrates inoculated with P. cactorum. Vertical bars indicate standard deviation (SD); n = 5 for each sampling date. Different letters above bars indicate significant differences between sampling dates after inoculation (p < 0.05).
The NO-x concentrations were near zero for most of the sampling dates.
However, the higher values obtained at 5 and 12 months for both P. cryptogea and P. cactorum inoculated PB and PF substrates were significantly different compared to the remaining sampling times (P. cryptogea, p = 3.736 × 10⁻⁵; P. cactorum, p = 8.452 × 10⁻⁴).
3.3. Statistical Model Development for Pathogen Survival Assay
The initial statistical analyses (Table 1) indicated a significant importance for the explanatory variables ‘time’ and ‘substrate’ on the survival of the soil-borne pathogens and the species specificity of these variables. These preliminary results were used to develop statistical models for each pathogen.
To examine the survival of the soil-borne pathogens in the absence of plants, a linear model was developed and validated for each pathogen. These models determined the effects of time and the properties of the different substrate types on pathogen survival (quantified by CFUs). Model validation for both P. cryptogea and P. cactorum is illustrated in Figure 3 and Figure 4.
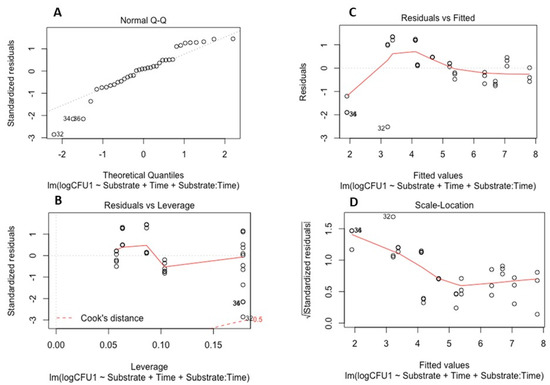
Figure 3.
Model validation for survival of Phytophthora cryptogea: (A) Q-Q plot of standardized residuals against fitted values of the model; (B) residuals versus leverage values; (C) residuals versus fitted values plot; (D) scale location of residual values plot.
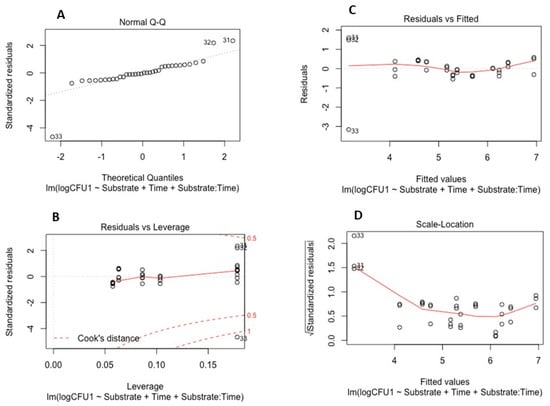
Figure 4.
Model validation for survival of Phytophthora cactorum: (A) Q-Q plot of standardized residuals against fitted values of the model; (B) residuals versus leverage values; (C) residuals versus fitted values plot; (D) scale location of residual values plot.
The linear models for P. cryptogea (Figure 3) and P. cactorum (Figure 4) included the explanatory variables of sampling date (factor time), substrate type (PB and PF), pH, NH4 concentrations, NO-x concentrations, and the relationship between time and soil properties. For each pathogen, 5 linear models were developed using the drop 1 function followed by single term deletions of the explanatory variables with weaker or non-significant effects on the CFUs (response variable); the final model elucidated which factors strongly affected the survival of the pathogens in the absence of a host. For P. cryptogea, the explanatory variables from weakest to strongest that were deleted during model development were: NO-x, NH4, their interactions with the substrate type, pH, and the pH interaction with the substrate type. The strongest effect on the survival of P. cryptogea (CFU counts) was time after inoculation, thus, the sampling date (p = 1.69 × 10⁻¹¹ ***) followed by the substrate type and its interaction with the factor time (p = 0.0417 *); the R-squared of the model indicated that 77% of the CFU variability was explained by the explanatory variables of time, substrate, and their interaction. For P. cactorum, the explanatory variables, from weakest to strongest, deleted during the model development were: the interaction of pH and the substrate type, pH values, and the NO-x and NH4 concentrations. The strongest effect on the survival of P. cactorum (CFUs counts) was also associated with the time after inoculation, thus, the sampling date (p = 2.39 × 10⁻⁸ ***) followed by substrate type (p = 0.04140 *) and its interaction with the factor time (p = 0.00761 **); the R-squared of the model indicated that 67% of CFU variability was explained by the explanatory variables of time, substrate, and their interaction. NS means p > 0.05, * means p < 0.05, ** means p < 0.01, *** means p < 0.001, **** means p < 0.0001.
3.4. Pathogenicity Assay
After completion of the survival assay, a pathogenicity test was carried out to compare the abilities of both resting and fresh inoculum to infect plants and produce disease. Eucalyptus globulus young seedlings were planted in pots 21 months after inoculation (P. cryptogea 21 and P. cactorum 21) in freshly inoculated pots (P. cryptogea 0 and P. cactorum 0) and in control pots with no inoculation (Figure 5 and Figure 6).
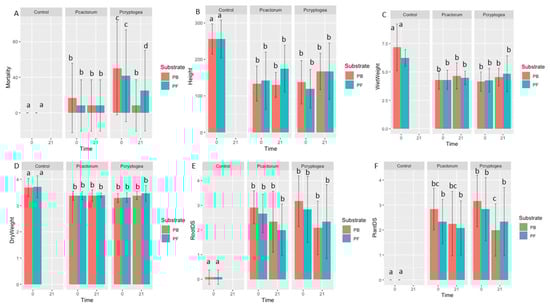
Figure 5.
Pathogenicity indices of inoculated Eucalyptus globulus in Phytophthora cryptogea 21, P. cryptogea 0, P. cactorum 21, and P. cactorum 0 treatments. (A) Mortality (% of dead plants); (B) plant height (mm); (C) plant wet weight (g); (D) plant dry weight (g); (E) root disease severity index (RDS); (F) plant disease severity. Different letters above the bars indicate significant differences (p < 0.05).
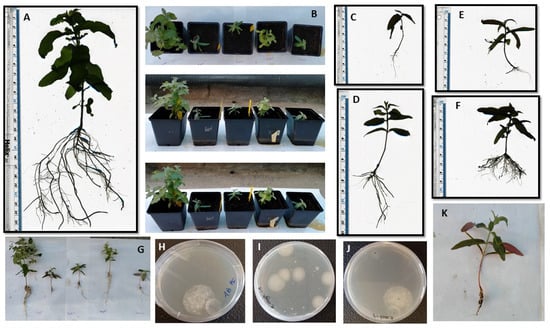
Figure 6.
Pathogenicity assay with Eucalyptus globulus and colony forming unit counts: (A) root scanner image of an Eucalyptus globulus control plant; (B) in planta inoculated E. globulus plants shown at different angles with, from left to right: control; Phytophthora cryptogea 0; P. cactorum 0; P. cryptogea 21; and P. cactorum 21; (C–F) root scanner images of E. globulus inoculated with P. cryptogea 0 (C); P. cryptogea 21 (D); P. cactorum 0 (E); and P. cactorum 21 (F). (G) Plant and root system of inoculated E. globulus plants, from left to right: control, P. cryptogea 0, P. cactorum 0, P. cryptogea 21, and P. cactorum 21. (H) CFU (dilution 10−4) peat-free substrate inoculated with P. cactorum; (I) CFU peat-based substrate inoculated with P. cryptogea (total in sample × CFU/g dry wt); (J) CFU (peat-based substrate inoculated with P. cactorum (total in sample × CFU/g dry wt; (K). E. globulus plant inoculated with P. cryptogea 0.
When planted into control pots with no inoculation, there was a 0% mortality rates in both PB and PF substrates. When planted into pots freshly inoculated with P. cryptogea (P. cryptogea 0), E. globulus had 60% and 50% mortality rates in PB and PF substrates, respectively (Table 2, Figure 5). These differences compared to the controls were significant in the PB substrate but not significant in the PF substrate (p = 8.254 × 10⁻³; p = 0.06176, respectively). For E. globulus planted into 21-month-old P. cryptogea pots (P. cryptogea 21), 10% and 30% mortality occurred in PB and PF substrates, respectively; the differences in mortality compared to the control were significant in PB but not significant in PF (p = 8.254 × 10⁻³; p = 0.06176, respectively).
Table 2.
Soil inoculation tests comparing plant mortality, foliar symptoms, root disease severity, plant height, and fresh and dry weights for Eucalyptus globulus in substrates Phytophthora cryptogea 21 (21 months after inoculation), P. cryptogea 0 (freshly inoculated), P. cactorum 21 (21 months after inoculation), and P. cactorum0 (freshly inoculated) (rows in bold) compared with controls. Data are means ± SD for each factor and the p-value (for mortality, sample proportions are shown instead of the mean and SD). NS means p > 0.05, * means p ≤ 0.05, ** means p ≤ 0.01, *** means p ≤ 0.001, **** means p ≤ 0.0001.
In addition to mortality rates, the root disease severity and plant-foliar symptom severity were assessed (Figure 5E,F). There were significant differences between the control and inoculated plants for root disease severity (PB: p = 2.45 × 10⁻⁶; PF: 2.142 × 10⁻⁵) and for plant-foliar symptom severity (PB: p = 1.605 × 10⁻⁶; PF: p = 7.905 × 10⁻⁶) (Table 2). Differences up to 6-fold were observed in plants grown in freshly inoculated P. cryptogea pots compared to the control pots and differences up to 4-fold were observed in plants grown in 21-month-old P. cryptogea, compared to plants in control pots. Significant differences were found when assessing plant disease severity in PB substrates between plants inoculated with P. cryptogea 0 compared to those inoculated with P. cryptogea 21 (p = 0.0490).
The plant height, fresh weight, and dry weight were also determined in inoculated plants in comparison to controls (Figure 5B,D). These parameters were significantly lower in inoculated plants compared to controls for both P. cryptogea 0 and P. cryptogea 21 (PB: p = 2.65 × 10⁻⁵, p = 2.455 10 −5, p = 2.662 × 10 −3; PF: p = 7.242 × 10⁻⁵, p = 1.276 × 10⁻⁴, p = 1.953 × 10⁻³; plant height, fresh weight, and dry weight, respectively) (Table 2).
When Eucalyptus globulus was planted into freshly inoculated pots with P. cactorum (P. cactorum 0), 20% of the plants in the PB substrates and 10% of the plants in the PF substrates died (Table 2). When sown into the 21-month-old P. cactorum pots (P. cactorum 21), a 10% mortality of E. globulus occurred in both PB and PF substrates. The root disease and foliar symptom severities were significantly different for all inoculated plants compared to the controls (PB: p = 2.45 × 10⁻⁶; PF: 2.142 × 10⁻⁵; PB: p = 1.605 × 10⁻⁶; PF: p = 7.905 × 10⁻⁶), with up to a 5-fold greater disease severity in plants grown in inoculated substrates (both P. cactorum 0 and P. cactorum 21, respectively). The root length, fresh weight, and dry weight were significantly lower in all P. cactorum (both P. cactorum 0 and P. cactorum 21) inoculated plants for both PB and PF substrates, with up to 4-fold differences in the inoculated plants compared to the controls (PB: p = 2.65 × 10⁻⁵, p = 2.455 10−5, p = 2.662 × 10⁻³; PF: p = 7.242 × 10⁻⁵, p = 1.276 × 10⁻⁴, p = 1.953 × 10⁻³; plant height, fresh weight, and dry weight, respectively).
3.5. Statistical Model Development for Plant Pathogenicity Test
A linear model was developed for each continuous response variable (plant height, fresh plant weight, and dry plant weight) to estimate the pathogenicity of P. cryptogea and P. cactorum in inoculated pots compared to the controls. The model included the explanatory variables: treatment, pathogen or control; substrate type, PB or PF; and the interaction among treatments and substrate type. The models were developed separately for each pathogen and response variable.
The linear model for both pathogens showed that the explanatory variables (absence or presence of pathogen, and substrate type) affected the plant quality response variables measured (plant height, plant fresh weight, plant dry weight) with different levels of significance. The strongest to weakest effect on the plant quality was the presence or absence of the pathogen; substrate type; and the interaction between the substrate type and treatment (presence or absence of pathogen) applied, with the latter having the weakest effect on the resulting plant quality variables. In the linear models developed for P. cactorum, the effect of the treatment on plant height was p = 2.27 × 10⁻⁹, fresh weight was p = 2.98 × 10⁻⁸, and dry weight was p = 2.5 × 10⁻⁵; in contrast, in the linear models developed for P. cryptogea, the significance level that the treatment had on plant heights was p = 3.12 × 10⁻¹¹, fresh weight was p = 2.9 × 10⁻⁸, and dry weight was p = 1.663 × 10⁻⁵. Thus, the significance level of the treatment depended on the pathogen and the response variable.
Linear models were validated by plotting the residuals using the difference between the predicted and the observed values (Figure 7).
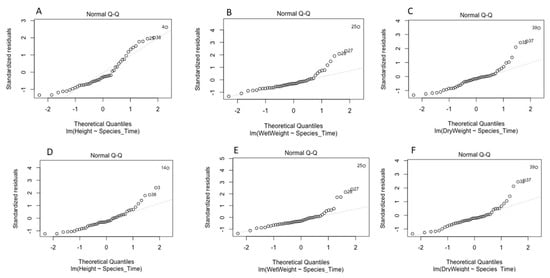
Figure 7.
Model validation for Phytophthora cryptogea and P. cactorum plant inoculation: (A–C) Q-Q plot of standardized residuals against fitted values of the model of P. cryptogea plants inoculation of the response variables plant height, fresh weight and dry weight; (D–F) Q-Q plot of standardized residuals against fitted values of the model of P. cactorum plants inoculation of the response variables plant height, fresh weight and dry weight.
4. Discussion
The survival of two Phytophthora species, P. cryptogea E2 and P. cactorum P-138, in potting mixes was examined over 21 months. Both species survived over the duration of the assay in both PB and PF potting mixes in the absence of plants. Colony numbers decreased over time and, although recovery rates for both pathogens were very similar in PB and PF substrates, the overall recovery rates were higher in the PF substrate, which may indicate the presence of peat, or other PB substrate properties may have a specific effect on the pathogens. A particular difference between the PF and PB substrates is porosity, with PF having a higher porosity and PB characterized by good water retention. The pots were watered weekly and it is possible that the differences in the retention of pathogen mycelia could occur due to the different porosity of the substrate types [35]. Both substrates used in this work were high in organic matter. Peat-based substrates have been very commonly used in the cultivation of ornamental plants, but with the pressure to mitigate climate change there is a trend towards replacement with peat-free substrates in order to protect peatland ecosystems that are considered important carbon sinks [35]. Peat-free substrates contain large quantities of organic matter, composed of different organic resources such as composted bark, wood chips, sawdust, and coconut fiber (coir). Unlike inert potting materials, these organic-based materials are considered high risk in terms of pest survival [23]. Although there seems to be a link between the decomposition of organic matter and pathogen suppression, the relationship is not straight forward, with decomposition sometimes having little effect on the disease, and it is suggested that the suppressiveness of organic matter can be pathogen-specific, with the response of pathogen populations to amendments being predictable only for some organic matter types, such as crop residues and organic wastes [24,36,37,38]. Thus, soil amendment with organic matter can improve the soil fertility and plant health [24], but not necessarily improve pathogen suppression. Pathogen suppression may well be affected by other substrate factors and/or physico-chemical parameters and these additional soil and potting mix properties should be characterized, as they may be involved in pathogen retention. An investigation of these effects over time would contribute to a greater understanding of the factors that have a strong impact on soil-borne pathogen survival.
In this study, the nitrate and ammonium content of inoculated peat-free and peat-based substrates was determined over time. Nitrogen is absorbed by roots via these available forms and the exchange of N-molecules between soil-plant-pathogens plays a crucial role in the interactions between soil microorganisms and plants [39,40]. Ammonium ions are produced in soil through a breakdown of organic matter including manures. Nitrate ions are the final form of N breakdown/reactions but can also be supplied to the soil by fertilizers [41]. Although variations were observed, overall, the ammonium concentrations in both substrates for P. cryptogea and P. cactorum tended to increase over time, whereas the nitrate concentration decreased. A caveat, however, in carrying out these measurements is that substrate fertilizer amendments (nitrogen-phosphate-potassium [N-P-K] combination mixes) are added as slow release beads by commercial producers of plant growth substrates [42,43] and it is possible that the accidental inclusion of beads in sampling could cause variability in the nitrogen and ammonia detected in the analyses [14].
A first batch of linear models was developed to analyze the factors that may affect the survival of pathogen inoculum in the absence of a host over time. The model suggested the explanatory variables of time, substrate types, and their interaction as significant factors that strongly affected the survival of the pathogen. The models showed similar patterns of survival after inoculation for both pathogens over time. These models demonstrated the survival ability of oomycetes in soil, regardless of the absence of a host, and also showed the importance of soil health status and soil properties for pathogen survival.
A second batch of linear models examined different pathogenicity response variables following E. globulus inoculation. In this case, the strongest effect on plant health and quality was the treatment applied; thus, the presence or absence of a pathogen had the greatest effect, followed by the substrate type and the interaction between the treatment and the substrate type.
Studies on the prevalence of Phytophthora species in an urban forest environment highlighted the need to understand which Phytophthora species become invasive and the pathways by which they move into the natural ecosystem [44]. There is a substantial capacity for several Phytophthora species such as Phytophthora × cambivora [12]; Phytophthora ramorum [10,11]; and Phytophthora cinnamomi to survive in potting mix components or soil [5,8,13,14]. This current work has added further evidence for pathogen survival, demonstrating specifically that the isolates P. cryptogea E2 and P. cactorum P-138 survived and could be recovered 21 months after inoculation into commercial potting substrates. Other soil-borne pathogens were reported to have shorter term recovery, including, for example, the recovery of P. ramorum up to 14 months after inoculation [11], Fusarium verticillioides and P. cinnamomi at 17 months [14], and P. × cambivora after 23 days [12]. However, the differences in recovery could also be related to the inoculum density between the studies and/or the unit of measurement used between these studies, i.e., chlamydospores and oospores [11]; PCR quantification and zoospores [12]; oospores [9]; oospores, stromata, and thick-walled chlamydospores [8]; or colony forming units [14]. Moreover, very little information has been reported about the actual infectivity of the recovered resting pathogen propagules, i.e., the ability to initiate disease at a new location in the presence of a suitable host plant.
Inoculation assays were carried out using E. globulus as a host plant firstly to study the pathogenicity of the isolates P. cryptogea E2 and P. cactorum P138 on this plant species; secondly, to determine the potential ability of the pathogen resting propagules in the substrate to initiate disease after a long period of host absence; and, thirdly, to compare the relative susceptibility to and virulence of ‘fresh’ (P. cryptogea 0 and P. cactorum 0) and ‘old’ (P. cryptogea 21 and P. cactorum 21) inocula.
In the current study, both ‘fresh’ and ‘21 month’ inocula of P. cryptogea and P. cactorum on E. globulus plants showed significant pathogenicity compared to the pathogen-free controls. The mortality, plant height, wet and dry weight, root, and foliar plant disease severity were significantly different to the controls. In the comparison of virulence of the ‘fresh’ versus ‘21 month’ inocula, virulence was greater in the freshly inoculated substrate than in the substrate 21 months after inoculation. However, this difference was only marginally significant for the variables of mortality and plant disease severity, and it is possible that full development of symptoms and mortality rates for the 21-month inocula required a longer period of incubation. This effect would be consistent with the knowledge that the spread of oomycetes in potting substrates, and through the international plant trade, may pose a risk to the environment as it may take time for any resulting symptoms to be observable and the pathogen(s) to be detected. Furthermore, fungicides, which are commonly used under nursery conditions, can hide symptoms but do not always kill pathogens. With the lack of evident disease symptoms, infected plants could pass inspection at borders with the consequent risk of pathogen spread to new environments ultimately resulting in severe damage [4,22,45]. This is borne out by a comprehensive review in 2018 by Jung et al. [16] that highlighted that the vast majority of canker, decline, and dieback diseases caused by soil- and airborne Phytophthora species in forests and natural ecosystems are driven by introduced invasive Phytophthora species, with the planting of infested nursery stock proven to be the main pathway between and within continents for the movement of Phytophthora species [16]. This review is a sobering read as it brings together and highlights the considerable body of individual research studies that show a clear link between the ‘plants for planting’ pathway and subsequent impacts in natural ecosystems [4,16,21].
Overall, the current study added evidence for the survival of Phytophthora spp. inoculum in the absence of a host and the potential ability to initiate disease on new hosts when optimal biotic and abiotic environmental conditions were present, despite the lack of a suitable host, over a protracted period. Regarding the implications for the international plant trade, the fact that these pathogens survived in both PF and PB potting media and remained capable of infecting roots of plants suggests that, as containers may also be contaminated, the thermosterilization of potting media at the nursery level should be the very first step of prevention in any management program [45]. This procedure is particularly necessary since it may take time for any resulting symptoms to be observable and the pathogen(s) to be detected, which may be exacerbated by the application of fungicides commonly used under nursery conditions and which can hide symptoms but do not always kill pathogens.
Recent studies on the economic impact of invasive alien species, using data from the global database of reported monetary costs of IAS, highlight the pivotal role that introduction pathways play, with species introduced unintentionally through ‘packing material’ and ‘contamination of plants’ accounting for the highest total global costs per pathway category of USD 83 bn and USD 473 bn, respectively [46]. In addition, the total costs due to species being introduced unintentionally were found to be more in terms of damage, management, and mixed costs than species introduced intentionally. Brasier, in a review in 2008 [22], and the scientific community in general has for many years advocated for the focus on pathway regulation. It is now at least recognized that managing these unintentional pathways especially through ‘Agriculture’, ‘Horticulture’, and ‘Ornamental trade’ should be a focus of future biosecurity efforts, which essentially must adapt to the exponential increase in the imports of living plants and growing trends in global shipping.
Reducing the pathogen load in the plants for planting pathways is essential for attempts at improving the overall biosecurity in all parts of the world [4,22,47] Other approaches for reducing the impacts of invasive pathogens, such as testing and deploying host provenances showing greater resistance to a dominant pathogen [48], may prove successful but must also take into account the influence(s) of climate change on both the pathogens and hosts [49,50,51,52]. The often-reported diversity of Phytophthora species in regions with pathogen damage is a further factor complicating any approach using host resistance [30,44,53,54].
5. Conclusions
Plant-growing substrates can clearly vector soil-borne oomycete and fungal pathogens, which, when introduced into new ecosystems, can result in severe damage to the newly exposed native plants. However, the overall factors affecting pathogen viability remain unclear. The physical structure of the soil at a micro-scale plays a vital role in soil function, microbiome composition, trophic interactions, and biogeochemical cycles [55]. Thus, the soil physical structure clearly shapes trophic interactions and influences the habitat and life cycles of most soil organisms. A thorough understanding of the interaction of oomycetes and soil properties could provide a much-needed clarification to generate more informed decision-making protocols for disease management practices at the nursery level. Future research into minimizing invasive Phytophthora diseases in natural ecosystems should focus on: (i) developing new commercial potting substrate formulations that allow for cleaner production methods, (ii) the use of the most promising phytosanitary management strategies and measures, (iii) understanding the effect of soil conditions and seasonal flooding, (iv) assessing the impact of global warming on the spatial distribution and severity of plant diseases, (v) evaluating the ability of pathogens to adapt to changing environmental parameters, and (vi) developing and optimizing rapid molecular identification via eDNA techniques that are portable and user friendly to facilitate early detection. Continued focused collaborative research will undoubtedly contribute to meaningful management and control measures in the future.
Author Contributions
Conceptualization, S.W., P.v.W. and D.M.; methodology, C.B.-C. and S.W.; formal analysis, C.B.-C.; investigation, C.B.-C.; writing—original draft preparation, C.B.-C.; writing—review and editing, C.B.-C., S.W., D.M. and P.v.W.; funding acquisition, S.W. and P.v.W. All authors have read and agreed to the published version of the manuscript.
Funding
This work was financially supported by the European Union Horizon 2020 (H2020) Marie Skłodowska-Curie Actions Innovative Training Network PROTECTA H2020-MSCA-ITN-2017 call, under grant agreement number 766048.
Data Availability Statement
Phytophthora cactorum P-138 (GenBank Accession MF115318); Phytophthora cryptogea E2 internal reference gene (Genbank accession in progress—temporary accession number: OQ430842).
Acknowledgments
The authors would like to acknowledge the excellent technical support provided by Hedda Weitz and Jaime Buckingham.
Conflicts of Interest
The authors declare no conflict of interest.
References
- Jung, T.; Colquhoun, I.J.; Hardy, G.E.S.J. New Insights into the Survival Strategy of the Invasive Soilborne Pathogen Phytophthora Cinnamomi in Different Natural Ecosystems in Western Australia. For. Pathol. 2013, 43, 266–288. [Google Scholar] [CrossRef]
- Pérez-Sierra, A.; López-García, C.; León, M.; García-Jiménez, J.; Abad-Campos, P.; Jung, T. Previously Unrecorded Low-Temperature Phytophthora Species Associated with Quercus Decline in a Mediterranean Forest in Eastern Spain. For. Pathol. 2013, 43, 331–339. [Google Scholar] [CrossRef]
- Rahman, M.Z.; Uematsu, S.; Suga, H.; Kageyama, K. Diversity of Phytophthora Species Newly Reported from Japanese Horticultural Production. Mycoscience 2015, 56, 443–459. [Google Scholar] [CrossRef]
- Benavent-Celma, C.; López-García, N.; Ruba, T.; Ściślak, M.E.; Street-Jones, D.; van West, P.; Woodward, S.; Witzell, J. Current Practices and Emerging Possibilities for Reducing the Spread of Oomycete Pathogens in Terrestrial and Aquatic Production Systems in the European Union. Fungal Biol. Rev. 2021, 40, 19–36. [Google Scholar] [CrossRef]
- Mircetich, S.M.; Zentmyer, G.A. Existence of Phytophthora Cinnamomi As Chlamydospores and Oospores in Roots and Soil. Phytopathology 1967, 51, 117–124. [Google Scholar]
- Van West, P.; Morris, B.M.; Reid, B.; Appiah, A.A.; Osborne, M.C.; Campbell, T.A.; Shepherd, S.J.; Gow, N.A.R. Oomycete Plant Pathogens Use Electric Fields to Target Roots. Mol. Plant-Microbe Interact. 2002, 15, 790–798. [Google Scholar] [CrossRef]
- Van West, P.; Appiah, A.A.; Gow, N.A.R. Advances in Research on Oomycete Root Pathogens. Physiol. Mol. Plant Pathol. 2003, 62, 99–113. [Google Scholar] [CrossRef]
- Crone, M.; McComb, J.A.; O’Brien, P.A.; Hardy, G.E.S.J. Survival of Phytophthora Cinnamomi as Oospores, Stromata, And Thick-Walled Chlamydospores in Roots of Symptomatic and Asymptomatic Annual and Herbaceous Perennial Plant Species. Fungal Biol. 2013, 117, 112–123. [Google Scholar] [CrossRef]
- Babadoost, M.; Pavon, C. Survival of Oospores of Phytophthora Capsici in Soil. Plant Dis. 2013, 97, 1478–1483. [Google Scholar] [CrossRef]
- Vercauteren, A.; Riedel, M.; Maes, M.; Werres, S.; Heungens, K. Survival of Phytophthora Ramorum in Rhododendron Root Balls and in Rootless Substrates. Plant Pathol. 2013, 62, 166–176. [Google Scholar] [CrossRef]
- Linderman, R.G.; Davis, E.A. Survival of Phytophthora Ramorum Compared to Other Species of Phytophthora in Potting Media Components, Compost, and Soil. Horttechnology 2006, 16, 502–507. [Google Scholar] [CrossRef]
- Vannini, A.; Breccia, M.; Bruni, N.; Tomassini, A.; Vettraino, A.M. Behaviour and Survival of Phytophthora Cambivora Inoculum in Soil-like Substrate under Different Water Regimes. For. Pathol. 2012, 42, 362–370. [Google Scholar] [CrossRef]
- Kuhlman, G.E. Survival and Pathogenicity of Phytophthora Cinnamomi in Several Western Oregon Soils. For. Sci. 1964, 10, 151–158. [Google Scholar] [CrossRef]
- Puértolas, A.; Boa, E.; Bonants, P.J.M.; Woodward, S. Survival of Phytophthora Cinnamomi and Fusarium Verticillioides in Commercial Potting Substrates for Ornamental Plants. J. Phytopathol. 2018, 166, 484–493. [Google Scholar] [CrossRef]
- Green, S.; Cooke, D.E.L.; Dunn, M.; Barwell, L.; Purse, B.; Chapman, D.S.; Valatin, G.; Schlenzig, A.; Barbrook, J.; Pettitt, T.; et al. Phyto-Threats: Addressing Threats to Uk Forests and Woodlands from Phytophthora; Identifying Risks of Spread in Trade and Methods for Mitigation. Forests 2021, 12, 1617. [Google Scholar] [CrossRef]
- Jung, T.; Pérez-Sierra, A.; Durán, A.; Jung, M.H.; Balci, Y.; Scanu, B. Canker and Decline Diseases Caused by Soil- and Airborne Phytophthora Species in Forests and Woodlands. Pers. Mol. Phylogeny Evol. Fungi 2018, 40, 182–220. [Google Scholar] [CrossRef]
- Paap, T.; Burgess, T.I.; Wingfield, M.J. Urban Trees: Bridge-Heads for Forest Pest Invasions and Sentinels for Early Detection. Biol. Invasions 2017, 19, 3515–3526. [Google Scholar] [CrossRef]
- Hulbert, J.M.; Paap, T.; Burgess, T.I.; Roets, F.; Wingfield, M.J. Botanical Gardens Provide Valuable Baseline Phytophthora Diversity Data. Urban For. Urban Green. 2019, 46, 126461. [Google Scholar] [CrossRef]
- Hulbert, J.M.; Agne, M.C.; Burgess, T.I.; Roets, F.; Wingfield, M.J. Urban Environments Provide Opportunities for Early Detections of Phytophthora Invasions. Biol. Invasions 2017, 19, 3629–3644. [Google Scholar] [CrossRef]
- Wu, E.J.; Wang, Y.P.; Yang, L.N.; Zhao, M.Z.; Zhan, J. Elevating Air Temperature May Enhance Future Epidemic Risk of the Plant Pathogen Phytophthora Infestans. J. Fungi 2022, 8, 808. [Google Scholar] [CrossRef]
- Gomes Marques, I.; Solla, A.; David, T.S.; Rodríguez-González, P.M.; Garbelotto, M. Response of Two Riparian Woody Plants to Phytophthora Species and Drought. For. Ecol. Manag. 2022, 518, 120281. [Google Scholar] [CrossRef]
- Brasier, C.M. The Biosecurity Threat to the UK and Global Environment from International Trade in Plants. Plant Pathol. 2008, 57, 792–808. [Google Scholar] [CrossRef]
- IPPC. Recommendation on: Internet Trade (e-Commerce) in Plants and Other Regulated Articles; IPPC: Rome, Italy, 2017. [Google Scholar]
- Bonanomi, G.; Antignani, V.; Capodilupo, M.; Scala, F. Identifying the Characteristics of Organic Soil Amendments That Suppress Soilborne Plant Diseases. Soil Biol. Biochem. 2010, 42, 136–144. [Google Scholar] [CrossRef]
- Aleandri, M.P.; Chilosi, G.; Bruni, N.; Tomassini, A.; Vettraino, A.M.; Vannini, A. Use of Nursery Potting Mixes Amended with Local Trichoderma Strains with Multiple Complementary Mechanisms to Control Soil-Borne Diseases. Crop Prot. 2015, 67, 269–278. [Google Scholar] [CrossRef]
- Chilosi, G.; Aleandri, M.P.; Bruni, N.; Tomassini, A.; Torresi, V.; Muganu, M.; Paolocci, M.; Vettraino, A.; Vannini, A. Assessment of Suitability and Suppressiveness of On-Farm Green Compost as a Substitute of Peat in the Production of Lavender Plants. Biocontrol Sci. Technol. 2017, 27, 539–555. [Google Scholar] [CrossRef]
- Morales, A.B.; Ros, M.; Ayuso, L.M.; Bustamante, M.d.l.A.; Moral, R.; Pascual, J.A. Agroindustrial Composts to Reduce the Use of Peat and Fungicides in the Cultivation of Muskmelon Seedlings. J. Sci. Food Agric. 2017, 97, 875–881. [Google Scholar] [CrossRef]
- Jeffers, S.N.; Martin, S.B. Comparison of Two Media Selective for Phytophthora and Pythium Species. Plant Dis. 1986, 70, 1038–1043. [Google Scholar] [CrossRef]
- Puertolas, A.; Bonants, P.J.M.; Boa, E.; Woodward, S. Application of Real-Time PCR for the Detection and Quantification of Oomycetes in Ornamental Nursery Stock. J. Fungi 2021, 7, 87. [Google Scholar] [CrossRef]
- Vettraino, A.M.; Natili, G.; Anselmi, N.; Vannini, A. Recovery and Pathogenicity of Phytophthora Species Associated with a Resurgence of Ink Disease in Castanea Sativa in Italy. Plant Pathol. 2001, 50, 90–96. [Google Scholar] [CrossRef]
- Johnson, L.F.; Curl, E.A. Burgess Methods for Research on the Ecology of Soil-Borne Plant Pathogens. In Methods for Research on the Ecology of Soil-Borne Plant Pathogens; Burgess Publishing: Minneapolis, MN, USA, 1972; p. 426. [Google Scholar]
- Gerlach, R.W.; Dobb, D.E.; Raab, G.A.; Nocerino, J.M. Gy Sampling Theory in Environmental Studies. 1. Assessing Soil Splitting Protocols. J. Chemom. 2002, 16, 321–328. [Google Scholar] [CrossRef]
- Allen, S.E. Chemical Analysis of Ecological Materials, 2nd ed.; Blackwell Scientific Publications: Oxford, UK, 1989. [Google Scholar]
- Rojas, J.A.; Jacobs, J.L.; Napieralski, S.; Karaj, B.; Bradley, C.A.; Chase, T.; Esker, P.D.; Giesler, L.J.; Jardine, D.J.; Malvick, D.K.; et al. Oomycete Species Associated with Soybean Seedlings in North America-Part II: Diversity and Ecology in Relation to Environmental and Edaphic Factors. Phytopathology 2017, 107, 293–304. [Google Scholar] [CrossRef] [PubMed]
- Strack, M.; Waddington, J.M.; Turetsky, M.; Roulet, N.T.; Byrne, K.A. Northern Peatland, Greenhouse Gas Exchange and Climate Change. In Peatlands and Climate Change; International Peat Socie: Jyväskylä, Finland, 2008. [Google Scholar]
- Bonanomi, G.; Antignani, V.; Pane, C.; Scala, F. Suppression of Soilborne Fungal Diseases with Organic Amendments. J. Plant Pathol. 2007, 89, 311–324. [Google Scholar]
- Mazzola, M.; Granatstein, D.M.; Elfving, D.C.; Mullinix, K. Suppression of Specific Apple Root Pathogens by Brassica Napus Seed Meal Amendment Regardless of Glucosinolate Content. Phytopathology 2001, 91, 673–679. [Google Scholar] [CrossRef] [PubMed]
- Tilston, E.L.; Pitt, D.; Groenhof, A.C. Composted Recycled Organic Matter Suppresses Soil-Borne Diseases of Field Crops. New Phytol. 2002, 154, 731–740. [Google Scholar] [CrossRef] [PubMed]
- Judelson, H.S.; Ah-Fong, A.M.V. Exchanges at the Plant-Oomycete Interface That Influence Disease. Plant Physiol. 2019, 179, 1198–1211. [Google Scholar] [CrossRef] [PubMed]
- Moreau, D.; Bardgett, R.D.; Finlay, R.D.; Jones, D.L.; Philippot, L. A Plant Perspective on Nitrogen Cycling in the Rhizosphere. Funct. Ecol. 2019, 33, 540–552. [Google Scholar] [CrossRef]
- Sparks, D.L. Methods of Soil Analysis. Chemical Methods; Sparks, D.K., Page, A.L., Helmke, P.A., Loeppert, R.H., Eds.; Soil Science Society of America: Madison, WI, USA, 1996. [Google Scholar]
- Jackson, B.E.; Wright, R.D.; Alley, M.M. Comparison of Fertilizer Nitrogen, Nitrogen Immobilization, Carbon Dioxide Efflux, and Leaching in Peat-Lite, Pine, and Pine Tree Substrates. HortScience 2009, 44, 781–790. [Google Scholar] [CrossRef]
- Boyer, C.R.; Torbert, H.A.; Gilliam, C.H.; Fain, G.B.; Gallagher, T.V.; Sibley, J.L. Nitrogen Immobilization in Plant Growth Substrates: Clean Chip Residual, Pine Bark, and Peatmoss. Int. J. Agron. 2012, 2012, 1–8. [Google Scholar] [CrossRef]
- Khdiar, M.Y.; Barber, P.A.; Hardy, G.E.S.; Shaw, C.; Steel, E.J.; McMains, C.; Burgess, T.I. Association of Phytophthora with Declining Vegetation in an Urban Forest Environment. Microorganisms 2020, 8, 973. [Google Scholar] [CrossRef]
- Stewart-Wade, S.M. Plant Pathogens in Recycled Irrigation Water in Commercial Plant Nurseries and Greenhouses: Their Detection and Management. Irrig. Sci. 2011, 29, 267–297. [Google Scholar] [CrossRef]
- Turbelin, A.J.; Diagne, C.; Hudgins, E.J.; Moodley, D.; Kourantidou, M.; Novoa, A.; Haubrock, P.J.; Bernery, C.; Gozlan, R.E.; Francis, R.A.; et al. Introduction Pathways of Economically Costly Invasive Alien Species. Biol. Invasions 2022, 24, 2061–2079. [Google Scholar] [CrossRef]
- Jung, T.; Orlikowski, L.; Henricot, B.; Abad-Campos, P.; Aday, A.G.; Aguín Casal, O.; Bakonyi, J.; Cacciola, S.O.; Cech, T.; Chavarriaga, D.; et al. Widespread Phytophthora Infestations in European Nurseries Put Forest, Semi-Natural and Horticultural Ecosystems at High Risk of Phytophthora Diseases. For. Pathol. 2016, 46, 134–163. [Google Scholar] [CrossRef]
- Rodríguez-Romero, M.; Cardillo, E.; Santiago, R.; Pulido, F. Susceptibility to Phytophthora cinnamomi of Six Holm Oak (Quercus Ilex) Provenances: Are Results under Controlled vs. Natural Conditions Consistent? For. Syst. 2022, 31, e011. [Google Scholar] [CrossRef]
- Ireland, K.B.; Hardy, G.E.S.J.; Kriticos, D.J. Combining Inferential and Deductive Approaches to Estimate the Potential Geographical Range of the Invasive Plant Pathogen, Phytophthora Ramorum. PLoS ONE 2013, 8, e0063508. [Google Scholar] [CrossRef]
- Duque-Lazo, J.; Navarro-Cerrillo, R.M.; van Gils, H.; Groen, T.A. Forecasting Oak Decline Caused by Phytophthora cinnamomi in Andalusia: Identification of Priority Areas for Intervention. For. Ecol. Manag. 2018, 417, 122–136. [Google Scholar] [CrossRef]
- Serrano, M.S.; Romero, M.Á.; Homet, P.; Gómez-Aparicio, L. Climate Change Impact on the Population Dynamics of Exotic Pathogens: The Case of the Worldwide Pathogen Phytophthora cinnamomi. Agric. For. Meteorol. 2022, 322, 109002. [Google Scholar] [CrossRef]
- Stenlid, J.; Oliva, J. Phenotypic Interactions between Tree Hosts and Invasive Forest Pathogens in the Light of Globalization and Climate Change. Philos. Trans. R. Soc. B Biol. Sci. 2016, 371, 20150455. [Google Scholar] [CrossRef]
- Jung, T.; La Spada, F.; Pane, A.; Aloi, F.; Evoli, M.; Jung, M.H.; Scanu, B.; Faedda, R.; Rizza, C.; Puglisi, I.; et al. Diversity and Distribution of Phytophthora Species in Protected Natural Areas in Sicily. Forests 2019, 10, 259. [Google Scholar] [CrossRef]
- Matsiakh, I.; Kramarets, V.; Cleary, M. Occurrence and Diversity of Phytophthora Species in Declining Broadleaf Forests in Western Ukraine. For. Pathol. 2021, 51, e12662. [Google Scholar] [CrossRef]
- Erktan, A.; Or, D.; Scheu, S. The Physical Structure of Soil: Determinant and Consequence of Trophic Interactions. Soil Biol. Biochem. 2020, 148, 107876. [Google Scholar] [CrossRef]


Disclaimer/Publisher’s Note: The statements, opinions and data contained in all publications are solely those of the individual author(s) and contributor(s) and not of MDPI and/or the editor(s). MDPI and/or the editor(s) disclaim responsibility for any injury to people or property resulting from any ideas, methods, instructions or products referred to in the content. |
© 2023 by the authors. Licensee MDPI, Basel, Switzerland. This article is an open access article distributed under the terms and conditions of the Creative Commons Attribution (CC BY) license (https://creativecommons.org/licenses/by/4.0/).