Article

Evaluation of Growth Conditions, Antioxidant Potential, and Sensory Attributes of Six Diverse Microgreens Species

1
Division of Biochemistry, Indian Agricultural Research Institute, New Delhi 110012, India
2
Division of Genetics, Indian Agricultural Research Institute, New Delhi 110012, India
3
Division of Physiology, Biochemistry and Post-Harvest Technology, Central Plantation Crops Research Institute, Kasaragod 671124, India
4
Indian Council of Agricultural Research, Krishi Bhawan, New Delhi 110001, India
5
World Vegetable Center, South Asia, ICRISAT Campus Patancheru, Hyderabad 502324, India
*
Author to whom correspondence should be addressed.
These authors contributed equally to this work.
Agriculture 2023, 13(3), 676; https://doi.org/10.3390/agriculture13030676
Submission received: 31 December 2022 / Revised: 1 March 2023 / Accepted: 6 March 2023 / Published: 14 March 2023
(This article belongs to the Special Issue Crop Improvement through Conventional and Molecular Approaches)

Abstract

:
Microgreens belong to a class of functional foods with valuable nutritional elements and diverse health benefits when consumed as food supplements. Its consumption has increased sharply due to the abundance of different health-promoting components than their mature plants. The present study investigated the growth conditions and nutritional profiles of six crops (mungbean, lentil, red radish, pearl-millet, mustard, and red cabbage) as microgreens grown under the light with a 16 h light/8 h dark cycle. Firstly, the optimum temperature and the day of harvesting of each of the microgreens for their maximum yield were standardized. The optimum temperature ranged from 24 to 28 °C, and the best stage for their harvesting ranged from the 6th to 13th day for all six microgreens species. Physiological parameters such as height, yield, color, moisture content, seed weight to fresh weight (FW) ratio, and FW to dry weight (DW) were also estimated. All the microgreens were analyzed for the total phenolics content, total anthocyanin content, vitamin C, free radical scavenging activity, dietary fiber, and phytic acid contents at the harvesting stage. Total phenolics, total anthocyanin, and vitamin C contents ranged from 55 to 1240 mg/100 g, 25 to 186 mg/100 g, and 22 to 86 mg/100 g, respectively, in the studied microgreens. Red cabbage and pearl-millet microgreens accumulated higher phenolics than other studied microgreens, while total anthocyanin content was higher in red radish and pearl-millet microgreens. Vitamin C content was recorded as highest in red cabbage microgreens. DPPH-based free radical scavenging activity ranged from 62–84% and was highest in red cabbage microgreens. All the microgreens were also analyzed for their dietary fiber (DF) content which ranged from 2.5–12.5% and was recorded as maximum in pearl millet microgreens. The findings of this study offer helpful information on the growth circumstances necessary to produce microgreens with the greatest nutrient and health benefits.

1. Introduction

The world population will cross the 9.7 billion mark by 2050 and 11.2 billion by 2100, as per the United Nations projection [1]. The constant increase in the world population is resulting in increased urbanization and chronic disease incidence, directly linked to poor diet quality and malnutrition, among other factors [2,3,4]. Food nutritional quality, biodiversity, and sustainable crop production all contribute to the quality of food and nutritional security, which in turn depends on a healthy environment and sufficient resources [5]. Environmental resources and plant biodiversity are significantly impacted by global climate change [6]. The present challenge requires food with a high standard of nutrition to feed the expanding world population, simultaneously defending the change in environmental conditions.
Microgreens are gaining popularity and grabbing the attention of people as healthy food choices. Microgreens have the great potential to significantly reduce health problems. These are the young, immature greens and the edible seedlings after sprouting of many vegetables, herbs, and grains, including the wild relatives from diverse families of plants like Brassicaceae, Fabaceae, Asteraceae, Amaranthaceae, Cucurbitaceae, Apiaceae, Amaryllidaceae and Lamiaceae [7]. Phenotypically, microgreens have the cotyledon, stalks, and first genuine leaves and are harvested ∼6–15 days following the emergence of the seedlings. Microgreens can be produced in a variety of growing mediums like soil, a mixture of cocopeat, and vermiculite, including the loose and soilless germination media [8]. According to various reports on the nutritional components of microgreens, they are high in antioxidants with a variety of vitamins, minerals, and health-promoting bioactive components. These greens can be produced in homes, restaurants, schools, etc., and a controlled environment also makes them available throughout the year. Microgreens are prized as nutraceuticals since they guard against several lifestyle diseases. For instance, compared to their mature counter-adult plants, broccoli sprouts and microgreens are rich in a variety of bioactive components, have a stronger antioxidant capacity, and have higher anti-inflammatory and anticancer activities [9,10]. These are rich in phytonutrients and antioxidants but low in energy due to the presence of lesser amounts of macromolecules [11]. As the seed germination starts, several metabolic changes occur inside the seed, which also change the seed morphology. Seed germination causes the induction of various enzymes responsible for the conversion of certain macromolecules (carbohydrates, protein, and fats) into smaller molecules (monomers of carbohydrates, amino acids, and fatty acids) that can be absorbed easily in the human body. During seed germination, metabolic changes also include the synthesis of some phytochemicals required for the germination and growth of plants, thus rapidly increasing the content of various vitamins and other antioxidants. The synthesis of these phytochemical and bioactive compounds in the microgreens provides huge beneficial effects to the human body as they are also absorbed quickly [12].
The nutritional composition of microgreens has been published in several studies, but there has not been an assessment of their overall nutritional rating [13,14,15]. As reviewed by different authors [16,17,18], their studies have reported that in addition to having different kinds of phytochemicals, microgreens are also a source of antioxidants and other health-promoting compounds, and for this reason, microgreens have become increasingly popular as functional foods.
The sensory attributes of a food product, including microgreens, are often just as important as antioxidant potential. Generally, fresh produce quality is determined by several sensory attributes, such as appearance, texture, and flavor [19,20]. In addition to appearance, other organoleptic characteristics (such as flavor and texture) are crucial to consumer satisfaction and repeat purchases. Consumers’ first purchase decisions are influenced by the appearance of the product, which is the initial quality attribute that catches their attention and affects their decision [19,21]. A consumer’s decision to buy food is often impacted by the nutritional value of the food as health awareness increases. For this reason, food products should be characterized by both sensory and nutritional attributes.
There were six microgreens investigated in the present study, including vegetables, legumes, and cereals, some of which had never been investigated previously. The present study aimed to standardize the optimum growth conditions of six selected microgreens and evaluate their antioxidant potential with sensory attributes. After the cultivation of all six microgreens in their most suitable environment, they were harvested at the best stage. We determined the yield as well as certain antioxidants and phytic acid.

2. Materials and Methods

2.1. Seed Material for Microgreens Production

Seeds of all six species (mungbean, lentil, red radish, pearl-millet, mustard, and red cabbage) were obtained from the Division of Genetics, and Division of Vegetable Science IARI, New Delhi, with more than 85% germination percentage and without any seed treatment.

2.2. Standardization of Microgreens Production and Growing Conditions

For the standardization of microgreens production methodology under controlled conditions, seeds of six crops, viz., mungbean, lentil, red radish, pearl millet, mustard, and red cabbage, were used (Table 1). Seeds were first soaked in distilled water for 24 h and then sown in seedling trays of cell size 60 × 30 × 4 cm with three replicates. The growing media was a mixture of coco peat, vermiculite, and sand in the ratio of 1.5:1.5:1, and about a 5 cm thick layer was used for all crop species [22]. The soaked seeds were homogeneously spread on the prepared bed of growing mixture and covered with the same mixture (approximately 1 cm). The seed-sowed trays were kept under 20 watts of warm light emitting diode (LED) lamps (GreenPower LED production module; Philips) and watered twice a day with a spray bottle. There was a 16/8-h light/dark regime in operation, a relative humidity of 65% to 75%, a temperature of 20 °C to 30 °C, and a relative humidity of 65% to 75%. For the reproducibility of results, a new set of microgreens were also grown after an interval of 20 days. Harvesting of each microgreens species was done separately from the 4th to the 13th day after sowing. Each microgreen was carefully harvested by cutting the stem about 1.0 cm above the growing medium with clean scissors. Microgreens were harvested, and their total fresh weight (FW) was calculated right away using an analytical balance.

2.3. Estimation of Moisture Content

A thermogravimetric analyzer was used to dry all freshly harvested microgreens samples (Model ATS120, Axis spolka zoo moisture meter, Poland). The analyzer’s temperature management was precise enough to create isothermal drying conditions in a short period of time. The thermogravimetric analyzer’s primary technical parameters are as follows: with a precision of 0.01%, a balance capacity of 120 g, a top-loading pan balance, a furnace that ranged from ambient to 160 °C, a precision of 0.01%; and a precision of 0.01%, the balance is a top-loading pan balance [23].

2.4. Preparation of Methanolic Extract

For the assessment of free radical scavenging activity and total phenolics content, the extraction was done precisely after 3.0 h of harvesting of microgreens as previously described [24] using 80% (v/v) methanol. Briefly, 1.0 g of each of the microgreens was macerated with 10 mL of solvent and extracted by using the magnetic stirrer for 3.0 h at 25 ± 2 °C. Using Whatman No. 1 filter paper, the extraction mixture was filtered, and the filtrate was immediately brought up to a volume of 50 mL with 80% (v/v) methanol and stored at 4.0 °C. On the same day, all additional evaluations were conducted using the stock solution. The extract was also used to determine the total phenolics content and to perform the DPPH assay.

2.5. Radical Scavenging Activity in DPPH

Free radical scavenging activity assay was performed by using 2,2-diphenyl-1-picrylhydrazyl (DPPH) as described by Niroula et al. [24] with minor modifications. Briefly, in the extracted solution (0.4 mL), 3.6 mL of methanolic 0.006% DPPH solution (w/v) was mixed. After proper mixing, the resulting mixture was kept in the dark for 30 min at 25 ± 2 °C. The absorbance was measured with a UV–VIS spectrophotometrically (HITACHI, U-2900) at 517 nm. Ascorbic acid equivalent antioxidant capacities (EAC) of dry-weight samples required to remove 50% of DPPH radicals (IC50 values) were calculated. A standard curve was prepared with different concentrations (0–25 μg/mL) of ascorbic acid. The DPPH radical scavenging capacity (%) of samples and standard was calculated using the equation:
DPPH radical scavenging activity (%) = [(Absorbance of Blank − Absorbance of Sample)/Absorbance of Blank] × 100
where 80% methanol solution was used as Blank.

2.6. Total Phenolics Content (TPC)

TPC was estimated in the microgreens using Folins Ciocalteau (F-C) reagent method as performed by Niroula et al. [24] with minor changes. Briefly, 0.5 mL of the sample extract was mixed with 2.0 mL of 10% F-C reagent and allowed to stand at room temperature for about 10 min. Further, 2.0 mL of sodium carbonate (7.5%, w/v) reagent was added to the reaction mixture and mixed properly. Then, 2.0 mL of distilled water was added to the reaction mixture and incubated at 40 °C for 45 min. Took off the reaction mixture from 40 °C and cooled at room temperature for 10 min. After cooling the sample at room temperature, the absorbance was recorded at 765 nm in a spectrophotometer (HITACHI, U-2900). Gallic acid was used for the preparation of the standard calibration curve using different concentrations (0.001–0.006 mg/mL). TPC was calculated as gallic acid equivalent (GAE).

2.7. Total Anthocyanin Content (TAC)

Total anthocyanin content (TAC) was assessed with the pH-differential method described by Giusti and Wrolstad [25] with few changes. Two dilutions of each sample were prepared by adding 1.0 mL of sample extract into a 10 mL volumetric flask. Both dilutions were performed using potassium chloride buffer (pH 1.0) for one and sodium acetate buffer for the other (pH 4.5). After around 15 min, both reaction samples were equilibrated. The absorbance of each dilution was measured at 510 and 700 nm in comparison to a blank as distilled water. After sample preparation, all spectrophotometer measurements were performed between 15 and 1.0 h afterward. The total anthocyanin content of the sample was calculated using the following formula:
A = ( Abs 510 Abs 700 )   pH   1.0 ( Abs 510 Abs 700 )   pH   4.5
The following formula was used to determine the concentration of monomeric anthocyanin pigment in the original sample:
Anthocyanin pigment (monomeric) (mg/L) = (A × MW × DF × 1000)/(ε × 1) and further converted to mg of total anthocyanin content/100 g sample. Where MW—the molecular weight
  • DF—the dilution factor and
  • ε—the molar absorptivity
The pigment content was calculated for cyanidin-3-glucoside, where MW = 449.2 and ε = 26,900.

2.8. Ascorbic Acid and Dietary Fiber Content

Ascorbic acid content was assessed according to AOAC (2005) method with minor changes. The sample extraction was prepared within 1.0 h of microgreens harvest. Briefly, 1.0 g of fresh microgreens sample was macerated in 10 mL of cooled metaphosphoric acid (5%, w/v) made in acetic acid (10%, v/v). The mixture was vortexed at room temperature for approximately 5.0 min and then centrifuged at 8000 rpm for 10 min at 4 ºC. The resulting supernatant, which had a volume of 25 mL, was collected and filtered through Whatman No. 1 filter paper. A reaction mixture containing 2.0 mL of sample extract, 1.0 mL of 2,6-dichlorophenol indophenols (0.02% w/v), 2.0 mL of thiourea (2% w/v), and 1.0 mL of 2,4-dinitrophenylhydrazine (2% in 5M H2SO4) was prepared for the ascorbic test. The assay components were mixed properly and kept at 50 °C for 60 min with occasional stirring. The reaction mixture was kept in ice to maintain the temperature at 4 °C. Carefully, 4.0 mL of 85% H2SO4 was added to the contents by constant gentle shaking for proper mixing and incubated for 30.0 min. Absorbance of the resulting mixture was recorded at 520 nm. Ascorbic acid in different concentrations was used for the preparation of the standard curve.
For the determination of dietary fiber content in microgreens, the sample was prepared exactly within 1.0 h of microgreens harvest. The amount of dietary fiber was acid was determined according to AOAC 962.09 crude fiber by filter method.

2.9. Antioxidant Enzymes Assay and Hydrogen Peroxide Content

For each microgreen, 1 g was homogenized in a 2 mL ice-cold solution with 50 mM potassium phosphate/biphosphate (pH 7.8), 5 mM cysteine, 0.1 mM EDTA, polyvinyl polypyrrolidone (PVPP; 1%) and Triton X-100 (0.2%). Filtered extracts were centrifuged at 4 °C for 20 min at 8000 g using two layers of nylon cloth. Sephadex G-25 fine columns (Amersham Pharmacia Biotech., Amersham, UK), equilibrated with the extraction buffer, were used to filter the supernatant. The resultant filtrate was utilized to measure various enzyme activities. Every step was carried out at 4 ºC. According to the procedures outlined by Permar et al. [26], the activities of catalase, peroxidase, ascorbate peroxidase, and superoxide dismutase were determined. The extraction buffer also included 20 mM sodium ascorbate for the ascorbate peroxidase activity assay. Absorbances were recorded on a HITACHI U-2900 spectrophotometer.
All of the microgreens’ samples were assessed for endogenous H2O2 production, as described by Singh et al. [27], with a few minor modifications. Each microgreens sample was homogenized in 1.0 mL of 0.1 M phosphate buffer (pH 7.2) to assay H2O2. The homogenate was centrifuged at 10,000 g for 10 min under chilled (4 °C) conditions. The resultant supernatant was applied to calculate H2O2 levels. For the determination of endogenous H2O2, 3.0 mL of the produced reagent solution (100 mL includes 0.234 g of phenol, 0.1 g of 4-aminoantipyrine, and 1.0 mL of 0.1 M phosphate buffer, pH 7.2) was employed. In nmoL/g of fresh weight, the quantifiable H2O2 was expressed. The HITACHI U-2900 spectrophotometer was used to conduct the spectrophotometer analysis.

2.10. Phytic Acid Content

Using the Megazyme kit (K-PHYT, Megazyme, Bray, Ireland), the phytic acid concentration in each sample of microgreens was measured. For the extraction of phytic acid, fresh microgreen samples weighing 1.0 g each were extracted with 20 mL of 0.65 M HCl for 3 h at room temperature and centrifuged at 5000 rpm. 1.0 mL of NaOH (0.75 M) was added in supernatant to neutralize the content. For determining the total phosphorus content in the sample, 0.6 mL of distilled water was added to 0.05 mL of sample extract, followed by the addition of 0.2 mL of 0.25 M sodium acetate buffer and 0.02 mL of phytase (12,000 U/mL) provided in the kit. The resultant mixture was kept at 40 °C for 10 min duration for enzymatic action. Further, 0.2 mL of 0.4 M glycine buffer was added to the mixture, followed by 0.02 mL of alkaline phosphatase (80 U/mL). To stop the reaction, 0.3 mL of trichloroacetic acid (50%) was added, and the resulting contents were centrifuged at 6000 rpm for 10.0 min.
A color reagent made up of 5 parts of 10% ascorbic acid in 1.0 M H2SO4, and 1 part of 5% ammonium molybdate was added to 1.0 mL of the supernatant. At 655 nm, the absorbance was measured. Free phosphorus was also determined simultaneously with the total phosphorus content. A total of 50 µL of the neutralized extract was mixed with 0.2 mL of 250 mM sodium acetate buffer and 0.62 mL of distilled water, followed by incubation at 40 °C for around 10 min. Further, 0.2 mL of glycine buffer and 0.02 mL of distilled water were added to the mixture, and the reaction was further stopped by the addition of trichloroacetic acid. The resulting mixture was centrifuged as described in the protocol, 1.0 mL of the supernatant was combined with 0.5 mL of colorant before the absorbance at 655 nm was measured. The kit’s standard solution was used to plot a phosphorus calibration curve as well. The following formulas were used to determine the amounts of phosphorus and phytic acid in each sample:
Phosphorus (g/100 g) = Abs for standard × 0.1112 × ΔAphosphorus
where; ΔAphosphorus = Difference between the total phosphorus and the free phosphorus
Phytic acid (g/100 g) = Phosphorus/0.282

2.11. Visual Quality and Sensory Evaluation

A trained panel of five judges with experience with microgreens and freshly cut vegetables evaluated the visual quality and sensory quality of all six microgreens (Table 2). According to Berba and Uchanski [28], a 5-point scale was used to rate the visual quality. (Table 3).
Olfactive quality, as the appearance of off-odors, was also evaluated on a 5-point scale as determined by (1 = no off odor and 5 = extremely strong off odor) [29].

2.12. Statistical Analysis

All the analyses were carried out in triplicates and represented as mean ± SD. Using the SPSS program, statistical analysis was carried out (version 24.0, USA). Using the Tukey post hoc test, a one-way ANOVA was used to compare the means. Differences were deemed significant when p ≤ 0.05.

3. Results and Discussion

3.1. Optimization of Growth Conditions for Microgreen Production

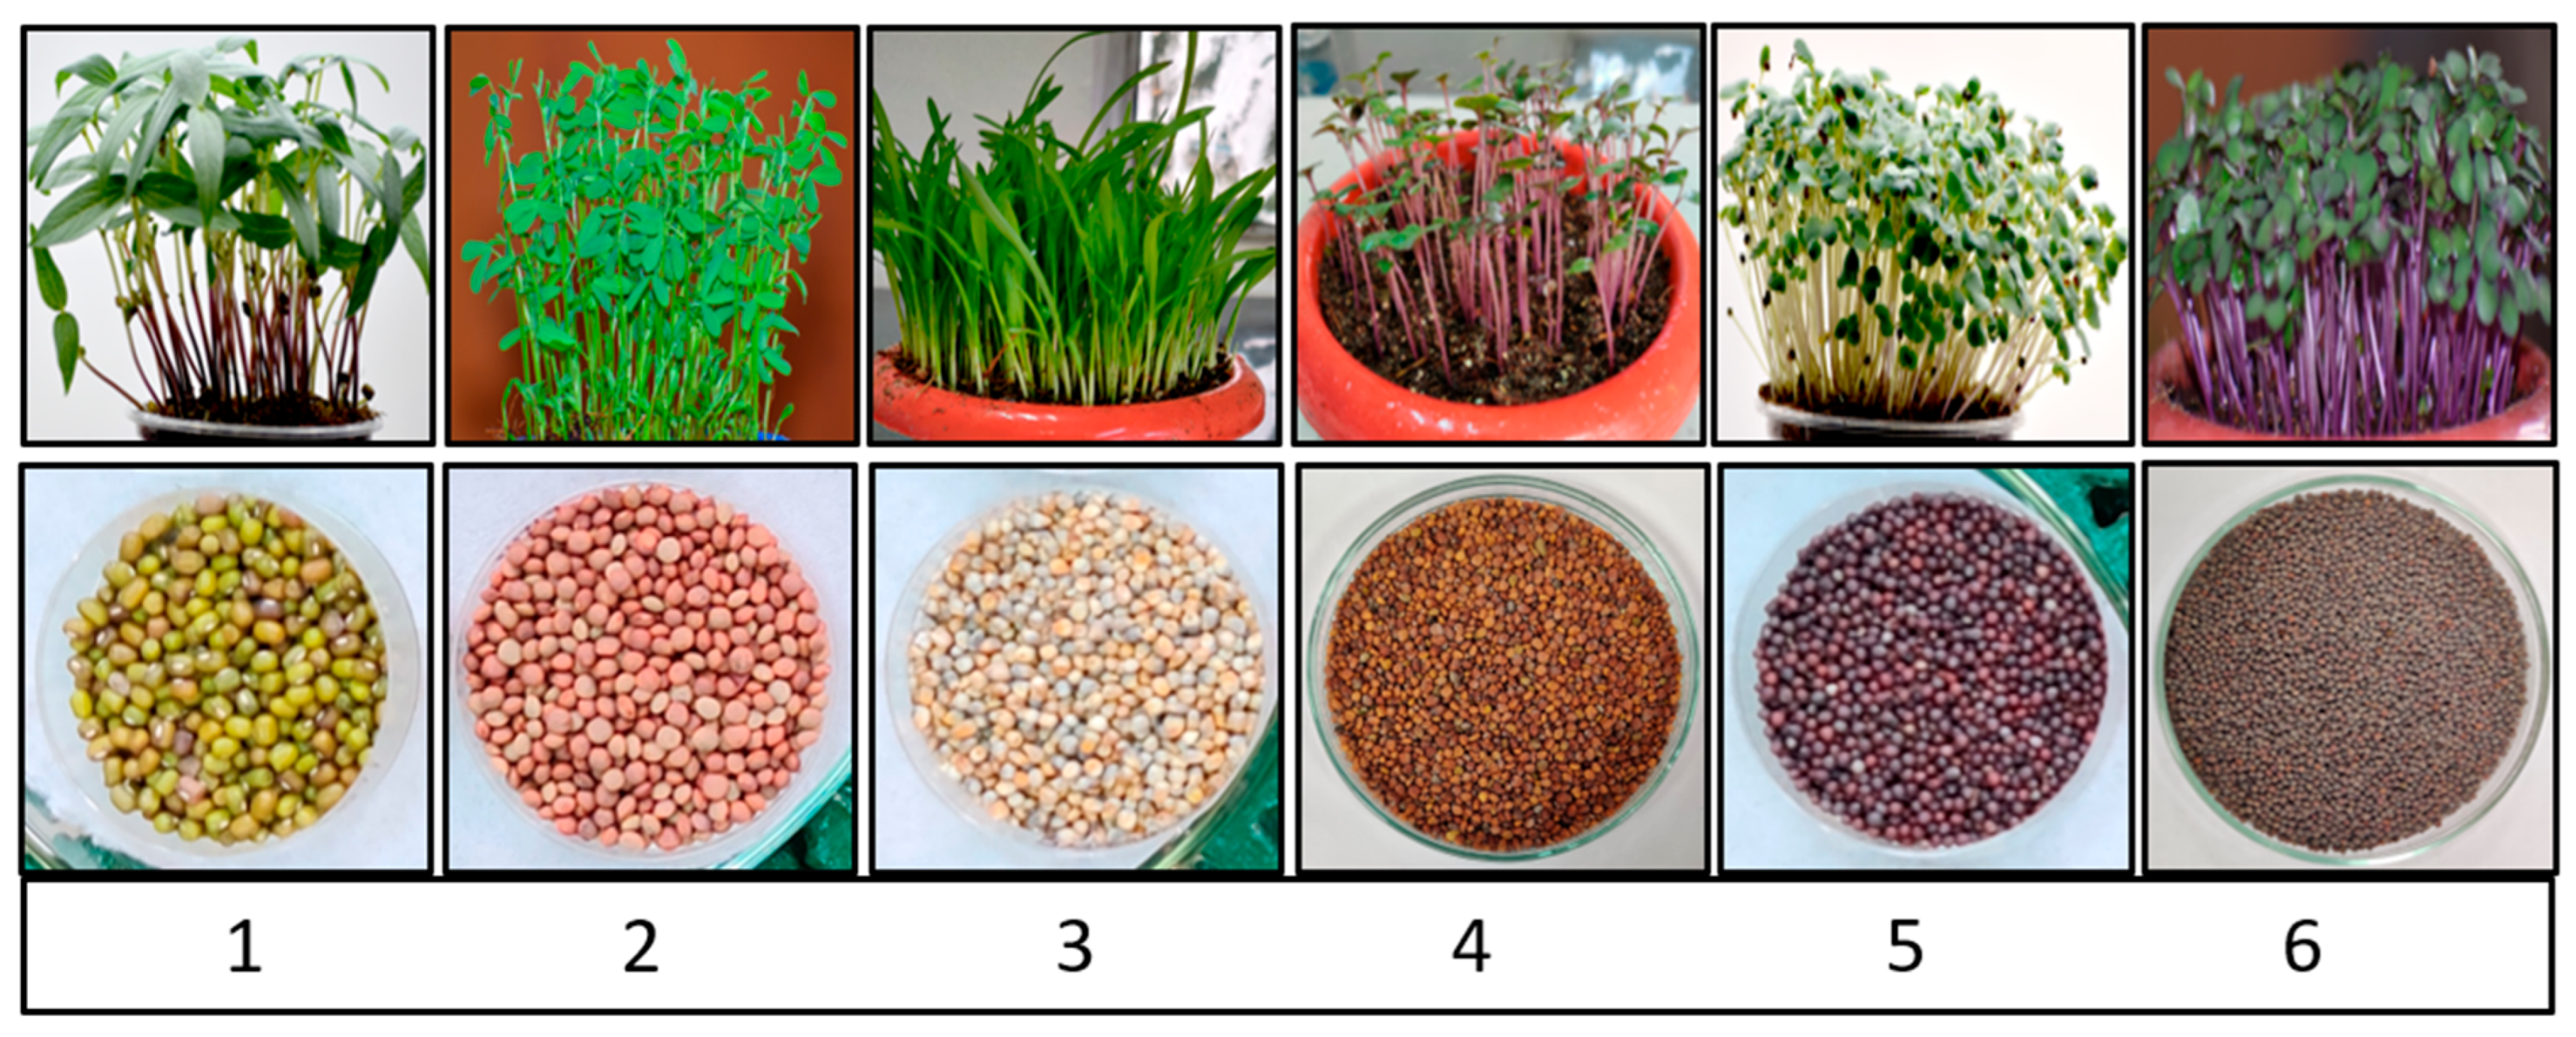
Microgreens, unlike sprouts (the early stage of microgreens), require regular watering and a growing medium. Under controlled conditions, the experimental setup for optimizing six microgreens (mungbean, lentil, pearl millet, red radish, mustard, and red cabbage) was standardized (Figure 1). To begin, the germination percentage of each microgreens seed was calculated at various temperatures (20–30 °C), and the ideal temperature for their maximum germination percentage was determined. At 28 °C, mungbean, lentil, and pearl millet germinated at maximum rates of 95, 90, and 85%, respectively. While red radish germinated at a maximum of 75% at 26 °C, mustard and red cabbage germinated at a maximum of 90 and 75% at 24 °C, respectively (Table 4). Germination was majorly affected by the temperature; extreme high/low temperatures decreased the seed germination percentage significantly. Seedlings require only water and light for microgreens cultivation after they have sprouted [28]. The plants were exposed to warm yellow light and watered every day until the first set of real leaves emerged. Indoor grow lamps are frequently used instead of natural lighting by growers. Customization is possible with LED lighting to optimize spectral composition to meet plant photoreceptors’ productivity, plant shape, and nutritional content [29]. LED lighting systems provide many advantages in terms of efficiency and are less harmful to the environment than other types of light [30].
After standardizing the optimum temperature for each microgreens species, the best day to harvest them was determined based on their morphological characteristics. When their cotyledonary leaf gets fully extended, they are ready to harvest. On the 7th day, mung bean and lentil were harvested, red radish, mustard, and red cabbage on the 8th day, and pearl millet on the 10th day. Each microgreen’s height was measured at the time of harvesting. Mungbean and lentils reached heights of 9 and 8 cm on the seventh day, respectively. While red radish, mustard, and red cabbage reached their maximum heights of 8, 9, and 8 cm, respectively, on the 8th day. On the 10th day of harvest, pearl millet reached its maximum height of 14 cm (Table 5). Xiao et al. [31] recommended harvesting microgreens from the Brassica family on day 7. Harvesting microgreens depends upon the height and leaf area. Green radish microgreens reached their maximum height of roughly 6 cm on the 8th day, whereas lettuce, mustard, and sesame reached their maximum height within 14 days. The intensity of sole-source light-emitting diodes have a significant impact on the growth, height and appearance quality of microgreens [32]. Mostly, microgreen’s true leaves fully developed in 8–10 days, with few exceptions like finger millet and red amaranth showed comparatively slow growth, and true leaves emerged on days 13 and 14 in finger millet and red amaranth, respectively [33].

3.2. Physical Appearance and Yield Attributes

For the evaluation of the yield attributes of each microgreens species, the seed rate (g) for sowing in the trays (30 × 60 × 4 cm) was standardized. For mungbean and lentil, seed rates were 40 g, 25 g for pearl millet, and 10 g each for red radish, mustard, and red cabbage seeds. Mungbean yield ranged from 180 to 220 g, and lentil yield was 140–160 g as fresh weight on the 7th day. While red radish, mustard, and red cabbage yield ranged from 150 to 170 g, 140 to 160 g, and 120 to 130 g on the 8th day. Pearl millet showed the lowest yield of 40–45 g on the 10th day among the selected microgreens. Dry weight was also estimated for each of the microgreens after keeping them at 40 °C for 24 h. The dry weight ranged from 3.2 to 5.0 g in all microgreens. In a study, 25 commercially available microgreens were assayed for dry weight and ranged from 4.6 to 10.2% [32]. One of the key characteristics that influence customers’ selection of microgreens and their financial worth is their color. The color was green for mungbean, lentil, pearl millet, and mustard, reddish green for red radish, and purplish green for red cabbage at the time of harvesting (Table 6).

3.3. Antioxidant Potential of Microgreens

The antioxidant potential in terms of radical scavenging activity (DPPH), total phenolics, anthocyanin, ascorbic acid, and phytic acid contents of each microgreen was estimated in the freshly harvested microgreens samples (Table 7). In the DPPH assay, free radicals containing DPPH react with sample antioxidants, and by donating a hydrogen atom, the antioxidants reduce the DPPH [33]. Each microgreens sample was evaluated for free radical scavenging activity, and the values ranged from 72 to 87%. Among all six microgreens, pearl millet showed the lowest 72%, whereas red cabbage showed the highest 87% free radical activity at the time of harvesting. Ghoora et al. [11] also reported high values of DPPH activity in a few of the microgreens.
Phenolic compounds, the largest group of secondary metabolites, are primarily found in almost all fruits and vegetables and are the products of the phenylpropanoid biosynthesis pathway. Plant phenolic compounds include proanthocyanidins, flavonoids, lignans and lignin, cinnamic acid, benzoic acid, stilbenes, coumarins, etc. [34]. The current study observed a significant variation in the total phenolic content in all six selected microgreens with a range of 52.62 to 1136.10 μg GAE/100 g FW. The highest total phenolics content (TPC) was found in pearl millet microgreens, and the lowest was found in the mustard microgreens at the time of harvesting. It should be highlighted as well that pearl millet and red cabbage recorded the highest DPPH activity and mustard as the lowest DPPH activity. A high positive association between TPC and DPPH scavenging activity has also been shown in another research [11]. Agarwal et al. [32] also reported a higher total phenolics content of radish, fenugreek, and roselle microgreens than the broccoli, red cabbage, radish, and purple radish microgreens. Different intrinsic and extrinsic factors, including species, growth circumstances, harvest maturity, and postharvest circumstances, may contribute to the variation in total phenolics content among different microgreens [35,36]. The phenolic compounds have antioxidant properties and are beneficial to human health in a number of ways. Its strong antioxidant efficacy comes from its capacity to scavenge free radicals, give electrons to oxidizing species, and indirectly reduce the buildup of reactive oxygen species. (ROS) [34].
Another crucial phytochemical component in plants, i.e., anthocyanin pigments, are responsible for the attractive orange, red, blue, or purple coloration of several plant tissues [37]. Red cabbage and red radish exhibit purplish-red and radish hypocotyls, respectively, owing to the abundance of anthocyanins. The total anthocyanin content was estimated in all six selected microgreens, and observed the highest content in red radish (186 mg/100 g FW). The accumulation of these color pigments not only contributes to the attractiveness of the microgreens but also has biological activities, making them an important component of human health [11,38,39].
The most valuable antioxidant for living beings, including plants, is ascorbic acid (vitamin C). During various physical or physiological stresses, the free ascorbic acid oxidizes into dehydroascorbic acid and protects from oxidative damage to plants as well as human beings [39]. The present study determined the amount of ascorbic acid in each microgreen on the day of harvest, as shown in Table 6. The ascorbic acid content ranged from 28.48 mg/100 g FW (lowest; red radish) to 140.22 mg/100 g FW (highest; red cabbage). Mustard microgreens showed 60.68 mg/100 g, the second-highest amount of ascorbic acid in the brassica family. Xiao et al. [31] also evaluated ascorbic acid content in 25 commercial plant micro-sprouts (20.4–131.6 mg/100 g FW), and rice grass (0.243 mg/g FW) and wheatgrass (0.487 mg/g FW) found similar to this research. The dietary fiber content also has prominent health benefits, and their content ranges from 2.26 to 6.48%. The highest amount of dietary fiber was recorded in pearl millet. Mlinarić et al. [40] also reported the antioxidant potential and dietary fiber content of radish microgreens and showed higher as compared to the mature counterpart. In addition to the antioxidant potential of the microgreens, we have also estimated the growth inhibitory factor, phytic acid, in all the six selected microgreens. Phytic acid is known as a major anti-nutritional factor in several plants. As expected, phytic acid contents were reduced in the microgreens as compared to the content in their seeds. In the selected microgreens, pearl millet microgreens showed the highest (0.304 g/100 g FW), and red radish showed the lowest (0.156 g/100 g FW) phytic acid content.
Antioxidant enzymes are major components of the living system and determine the antioxidant potential of the cell. Four major antioxidant enzymes viz catalase, peroxidase, ascorbate peroxidase, and superoxide dismutase activities were estimated in all the microgreens. Increased activity indicates a lesser accumulation of reactive oxygen species (ROS). Plants have developed an antioxidant defense system, which includes antioxidant enzymes like; catalase, peroxidase, ascorbate peroxidase, superoxide dismutase, etc., to combat oxidative damage in severely unfavorable environments [41]. A heme-containing enzyme called catalase has the ability to directly dismutate H2O2 into H2O and O2. Its rate of turnover is among the highest among all enzymes. Red cabbage had the lowest activity levels, while pearl millet had the highest. During the investigation, peroxidase—another significant enzyme involved in H2O2-scavenging—was also examined. Moreover, it is an enzyme that uses heme to catalyze the single electron oxidation of a number of substrates at the expense of H2O2. In plants, peroxidase is engaged in a number of processes. Red cabbage had the lowest activity levels, and pearl millet had the highest levels. Ascorbate peroxidase utilizes ascorbate as the electron donor and scavenges ROS (H2O2) through the ascorbate-GSH cycle. Compared to other scavenging enzymes, it has a higher affinity for H2O2. Its activity was highest in red cabbage and lowest in pearl millet microgreens. Superoxide dismutase, the most effective intracellular enzymatic antioxidant, removes O-2 by catalyzing its dismutation and produces H2O2. Its activity was also highest in red cabbage and lowest in mungbean. Wang et al. [41] also reported the increased activities of antioxidant enzymes in microgreens. Several conditions, like seed germination, biotic and abiotic stresses may cause the occurrence of oxidative stresses in plants by increasing the production and accumulation of ROS. The production and accumulation of H2O2 in plants can be controlled or reduced by the plant’s antioxidants and antioxidant enzymes system. Whereas under severe stresses, ROS are overproduced and cause damage to cellular machinery [41]. Hydrogen peroxide accumulation was determined in all the microgreens samples and the highest accumulation was in mungbean, whereas the lowest accumulation was in red radish (Table 8).

3.4. Sensory Evaluation of Microgreens

On sensory evaluation, firstly, the visual quality and olfactive results were recorded (Table 9). Both visual quality and olfactive depend upon the different enzymatic and metabolic activities that occurred in the selected microgreens. Mustard microgreen was the first to undergo deterioration, and its visual quality showed some changes after four days. However, the other microgreens retained their visual quality after four days. After six days, the olfactive properties of pearl millet, mustard, and red radish were still optimal, while all other sensory scores pointed out the presence of visual and olfactive defects. However, the sensory quality was still satisfactory. After ten days, all the selected microgreens samples differed substantially. Red cabbage had the lowest overall score for both visual and olfactory quality, whereas pearl millet received the highest overall score for both.
Among all, mungbean and lentil microgreens showed only moderately objectionable defects and were still above the marketability threshold. Broccoli microgreens were used for a sensory shelf-life extension of up to 21 days by other authors using some salts preharvest treatments [42,43,44]. According to Kou et al. [45], broccoli microgreens washed with chlorine continued to taste good even after 11 days, whereas post-harvest treated microgreens showed a shorter sensory shelf-life. According to Chandra et al. [46], chlorine-treated fresh-cut Tah Tasai cabbage microgreens had off-odors that were tolerable for seven days. Some authors also observed the increased shelf-life of microgreens treated with chemicals other than chlorine. Xiao et al. [32] reported the sensory acceptability of radish microgreens from 8 days to 16 days by using different conditions with different rates of respiration. In a sensory evaluation test of 12 microgreen species in young adult participants, Caracciolo et al. [29] found that the total acceptability was significantly determined by sensory qualities (e.g., aroma, bitterness, astringency, grassy, heat, and sourness).

4. Conclusions

Microgreens are novel functional food sources and have shown an increase in their acceptability and popularity on the market due to their high nutrient density and promotion of human health. The present study focused on optimizing the growth conditions and evaluating the nutritional quality of a few microgreens along with their sensory attributes. Interesting properties were highlighted for the studied microgreens, mainly regarding optimizing the temperature, light, and estimation of antioxidant potential, antinutritional components, and sensory acceptance. These findings point to the potential for defining nutritional profiles that are genotype-specific as well as for further utilizing the quality potential of microgreens. The study demonstrates that optimum growth conditions are important to enhance microgreen productivity, texture, appearance, sensory acceptance, and nutritional components.

Author Contributions

A.S.D.: Conceptualization, methodology, formal analysis, validation, investigation, writing—original draft; writing—review and editing. H.K.D. and G.P.M.: conceptualization, investigation, resources, writing—original draft, writing—review and editing. M.T.T., V.T. and M.A.: methodology, formal analysis, validation, N.L.M.: resources, writing—original draft. S.V.R. and S.N.: validation, writing—review and editing. R.R.K. and S.G.: Funding acquisition. R.M.N.: writing—review and editing. S.P.: supervision, writing—review and editing. All authors have read and agreed to the published version of the manuscript.

Funding

This study was supported by ICAR-Indian Agricultural Research Institute, New Delhi-110012, through the Indian Council of Agricultural Research, India and DRDO-LSRB (Life Science Re-search Board), New Delhi (LSRB-333). Ramakrishnan M. Nair gratefully acknowledges the long-term strategic donors to the World Vegetable Center: Taiwan, United States Agency for International Development (USAID), UK Government’s Foreign, Commonwealth & Development Office (FCDO), Australian Centre for International Agricultural Research (ACIAR), Germany, Thailand, Philippines, Korea, Japan, and funding from ACIAR Project on International Mungbean Improvement Network (CROP/2019/144). The funders had no role in the study design, data col-lection, analysis, the decision to publish, or preparation of the manuscript.

Institutional Review Board Statement

Not applicable.

Data Availability Statement

All the data described in this study are available within the article.

Acknowledgments

The technical support received from Monica Jolly (Indian Agricultural Research Institute, New Delhi) and Tsering Stobdan (Scientist F, Defence Institute of High Altitude Research, Defence Research & Development Organisation, Leh, Ladakh) is duly acknowledged.

Conflicts of Interest

The authors declare no conflict of interest.

References

  1. FAO. The State of Food Security and Nutrition in the World. 2022. Available online: http://www.fao.org/state-of-food-security-nutrition/en/ (accessed on 10 January 2022).
  2. Jurowski, K.; Szewczyk, B.; Nowak, G.; Piekoszewski, W. Biological consequences of zinc deficiency in the pathomechanisms of selected diseases. JBIC J. Biol. Inorg. Chem. 2014, 19, 1069–1079. [Google Scholar] [CrossRef] [PubMed] [Green Version]
  3. Estrade, S.; Majorel, C.; Tahhan, N.; Dulac, Y.; Baunin, C.; Gennero, I.; Chaix, Y.; Salles, P.; Edouard, T. Severe nutritional rickets in young children: Resurgence of an old disease. Arch. Pediatr. Organe Off. Soc. Fr. Pediatr. 2017, 24, 737–742. [Google Scholar] [CrossRef]
  4. Rosique-Esteban, N.; Guasch-Ferré, M.; Hernández-Alonso, P.; Salas-Salvadó, J. Dietary magnesium and cardiovascular disease: A Review with emphasis in epidemiological studies. Nutrients 2018, 10, 168. [Google Scholar] [CrossRef] [Green Version]
  5. Thompson, B.; Amoroso, L. Improving Diets and Nutrition: Food-Based Approaches; CABI: Oxfordshire, UK, 2014. [Google Scholar] [CrossRef] [Green Version]
  6. Weiskopf, S.R.; Rubenstein, M.A.; Crozier, L.G.; Gaichas, S.; Griffis, R.; Halofsky, J.E.; Hyde, K.J.W.; Morelli, T.L.; Morisette, J.T.; Muñoz, R.C.; et al. Climate change effects on biodiversity, ecosystems, ecosystem services, and natural resource management in the United States. Sci. Total Environ. 2020, 733, 137782. [Google Scholar] [CrossRef] [PubMed]
  7. Kyriacou, M.C.; Rouphael, Y.; Di Gioia, F.; Kyratzis, A.; Serio, F.; Renna, M.; De Pascale, S.; Santamaria, P. Micro-scale vegetable production and the rise of microgreens. Trends Food Sci. Technol. 2016, 57, 103–115. [Google Scholar] [CrossRef]
  8. Gioia Di, F.; Renna, M.; Santamaria, P. Sprouts, microgreens and “baby leaf” vegetables. In Minimally Processed Refrigerated Fruits and Vegetables; Food Engineering Series; Yildiz, F., Wiley, R., Eds.; Springer: Boston, MA, USA, 2017; pp. 403–432. [Google Scholar] [CrossRef]
  9. Kopsell, D.A.; Sams, C.E.; Barickman, T.C.; Morrow, R.C. Sprouting broccoli accumulate higher concentrations of nutritionally important metabolites under narrow-band light-emitting diode lighting. J. Am. Soc. Hortic. Sci. 2014, 139, 469–477. [Google Scholar] [CrossRef] [Green Version]
  10. Moreira-Rodríguez, M.; Nair, V.; Benavides, J.; Cisneros-Zevallos, L.; Jacobo-Velázquez, D.A. UVA, UVB light, and methyl jasmonate, aloneor combined, redirect the biosynthesis of glucosinolates, phenolics, carotenoids, and chlorophylls in broccoli sprouts. Int. J. Mol. Sci. 2017, 18, 2330. [Google Scholar] [CrossRef] [Green Version]
  11. Ghoora, M.D.; Haldipur, A.C.; Srividya, N. Comparative evaluation of phytochemical content, antioxidant capacities and overall antioxidant potential of select culinary microgreens. J. Agric. Food Res. 2020, 2, 100046. [Google Scholar] [CrossRef]
  12. Wojdylo, A.; Nowicka, P.; Tkacz, K.; Turkiewicz, I.P. Sprouts vs. microgreens as novel functional foods: Variation of nutritional and phytochemical profiles and their in vitro bioactive properties. Molecules 2020, 25, 4648. [Google Scholar] [CrossRef]
  13. Weber, C.F. Broccoli microgreens: A mineral-rich crop that can diversify food systems. Front. Nutr. 2017, 4, 7. [Google Scholar] [CrossRef]
  14. Allegretta, I.; Gattullo, C.E.; Renna, M.; Paradiso, V.M.; Terzano, R. Rapid multielement characterization of microgreens via total-reflection X-ray fluorescence (TXRF) spectrometry. Food Chem. 2019, 296, 86–93. [Google Scholar] [CrossRef] [PubMed]
  15. Mishra, G.P.; Dikshit, H.K.; Tontang, M.T.; Stobdan, T.; Sangwan, S.; Aski, M.; Singh, A.; Kumar, R.R.; Tripathi, K.; Kumar, S.; et al. Diversity in Phytochemical Composition, Antioxidant Capacities, and Nutrient Contents Among Mungbean and Lentil Microgreens When Grown at Plain-Altitude Region (Delhi) and High-Altitude Region (Leh-Ladakh), India. Front. Plant Sci. 2021, 12, 710812. [Google Scholar] [CrossRef]
  16. Bian, Z.H.; Yang, Q.C.; Liu, W.K. Effects of light quality on the accumulation of phytochemicals in vegetables produced in controlled environments: A review. J. Sci. Food Agric. 2015, 95, 869–877. [Google Scholar] [CrossRef] [PubMed]
  17. Mir, S.A.; Shah, M.A.; Mir, M.M. Microgreens: Production, shelf life, and bioactive components. Crit. Rev. Food Sci. Nutr. 2017, 57, 2730–2736. [Google Scholar] [CrossRef] [PubMed]
  18. Bhatt, P.; Sharma, S. Microgreens: A Nutrient Rich Crop that can Diversify Food System. Int. J. Pure Appl. Biosci. 2018, 6, 182–186. [Google Scholar] [CrossRef]
  19. Barrett, D.M.; Beaulieu, J.C.; Shewfelt, R. Color, flavor, texture, and nutritional quality of fresh-cut fruits and vegetables: Desirable levels, instrumental and sensory measurement, and the effects of processing. Crit. Rev. Food Sci. Nutr. 2010, 50, 369–389. [Google Scholar] [CrossRef]
  20. Kaur, J.; Gunjal, M.; Rasane, P.; Singh, J.; Kaur, S.; Poonia, A.; Gupta, P. Edible Packaging: An Overview. In Edible Food Packaging; Poonia, A., Dhewa, T., Eds.; Springer: Singapore, 2022. [Google Scholar] [CrossRef]
  21. Francis, G.A.; Gallone, A.; Nychas, G.J.; Sofos, J.N.; Colelli, G.; Amodio, M.L.; Spano, G. Factors affecting quality and safety of fresh-cut produce. Crit. Rev. Food Sci. Nutr. 2012, 52, 595–610. [Google Scholar] [CrossRef]
  22. Sangwan, S.; Kukreja, B.; Mishra, G.P.; Dikshit, H.K.; Singh, A.; Aski, M.; Kumar, A.; Taak, Y.; Stobdan, T.; Das, S.; et al. Yield optimization, microbial load analysis, and sensory evaluation of mungbean (Vigna radiata L.), lentil (Lens culinaris subsp. culinaris), and Indian mustard (Brassica juncea L.) microgreens grown under greenhouse conditions. PLoS ONE 2022, 17, e0268085. [Google Scholar] [CrossRef]
  23. Sadaka, S.; Atungulu, G. Grain sorghum drying kinetics under isothermal conditions using thermogravimetric analyzer. BioResources 2018, 13, 1534–1547. [Google Scholar] [CrossRef]
  24. Niroula, A.; Khatri, S.; Khadka, D.; Timilsina, R. Total phenolic contents and antioxidant activity profile of selected cereal sprouts and grasses. Int. J. Food Prop. 2019, 22, 427–437. [Google Scholar] [CrossRef] [Green Version]
  25. Giusti, M.M.; Wrolstad, R.E. Characterization and Measurement of Anthocyanins by UV-Visible Spectroscopy. In Current Protocols in Food Analytical Chemistry; Giusti, M.M., Wrolstad, R.E., Eds.; John Wiley and Sons, Inc.: Hoboken, NJ, USA, 2001; pp. F1.2.1–F1.2.13. [Google Scholar]
  26. Permar, V.; Singh, A.; Pandey, V.; Alatar, A.A.; Faisal, M.; Jain, R.K.; Praveen, S. Tospo viral infection instigates necrosis and premature senescence by micro RNA controlled programmed cell death in Vigna unguiculata. Physiol. Mol. Plant Pathol. 2014, 88, 77–84. [Google Scholar] [CrossRef]
  27. Singh, A.; Permar, V.; Basavaraj; Tomar, B.S.; Praveen, S. Effect of Temperature on Symptoms Expression and Viral RNA Accumulation in Groundnut Bud Necrosis Virus Infected Vigna unguiculata. Iran. J. Biotechnol. 2018, 16, e1846. [Google Scholar] [CrossRef] [PubMed]
  28. Berba, K.J.; Uchanski, M. Post-harvest Physiology of Microgreens. J. Young Investig. 2012, 24, 1. [Google Scholar]
  29. Caracciolo, F.; El-Nakhel, C.; Raimondo, M.; Kyriacou, M.C.; Cembalo, L.; De Pascale, S.; Rouphael, Y. Sensory Attributes and Consumer Acceptability of 12 Microgreens Species. Agronomy 2020, 10, 1043. [Google Scholar] [CrossRef]
  30. Turner, E.R.; Luo, Y.; Buchanan, R.L. Microgreen nutrition, food safety and shelf life: A review. J. Food Sci. 2020, 85, 870–882. [Google Scholar] [CrossRef] [Green Version]
  31. Xiao, Z.; Rausch, S.R.; Luo, Y.; Sun, J.; Yu, L.; Wang, Q.; Chen, P.; Yu, L.; Stommel, J.R. Microgreens of Brassicaceae: Genetic diversity of phytochemical concentrations and antioxidant capacity. LWT-Food Sci. Technol. 2019, 101, 731–737. [Google Scholar] [CrossRef]
  32. Agarwal, A.; Dutta Gupta, S. Impact of light emitting-diodes (LEDs) and its potential on plant growth and development in controlled-environment plant production system. Curr. Biotechnol. 2016, 5, 28–43. [Google Scholar] [CrossRef]
  33. Senevirathne, G.I.; Gama-Arachchige, N.S.; Karunaratne, A.M. Germination, harvesting stage, antioxidant activity and consumer acceptance of ten microgreens. Ceylon J. Sci. 2019, 48, 91–96. [Google Scholar] [CrossRef]
  34. Alam, P.; Alajmi, M.F.; Arbab, A.H.; Parvez, M.K.; Siddiqui, N.A.; Alqasoumi, S.I.; Al-Rehaily, A.J.; Al-Dosari, M.S.; Basudan, O.A. Comparative study of antioxidant activity and validated RP-HPTLC analysis of rutin in the leaves of different Acacia species grown in Saudi Arabia. Saudi Pharm. J. 2017, 25, 715–723. [Google Scholar] [CrossRef] [Green Version]
  35. Ho, C.T. Phenolic Compounds in Food: An Overview; ACS Symposium Series; American Chemical Society: Washington, DC, USA, 1992. [Google Scholar]
  36. Hollman, P.C.H. Evidence for health benefits of plant phenols: Local or systemic effects? J. Sci. Food Agric. 2001, 81, 842–852. [Google Scholar] [CrossRef]
  37. Lester, G.E.; Makus, D.J.; Hodges, D.M.; Jifon, J.L. Summer (Subarctic) versus winter (Subtropic) production affects spinach (Spinacia oleracea L.) leaf bionutrients: Vitamins (C, E, Folate, K1, provitamin A), lutein, phenolics, and antioxidants. J. Agric. Food Chem. 2013, 61, 7019–7027. [Google Scholar] [CrossRef] [PubMed]
  38. Stommel, J.R.; Whitaker, B.D.; Haynes, K.G.; Prohens, J. Genotype X environment interactions in eggplant for fruit phenolic acid content. Euphytica 2015, 205, 823–836. [Google Scholar] [CrossRef]
  39. Gonzalez, A.; Zhao, M.; Leavitt, J.; Lloyd, A.M. Regulation of the anthocyanin biosynthetic pathway by the TTG1/bHLH/Myb transcriptional complex in Arabidopsis seedlings. Plant J. 2008, 53, 814–827. [Google Scholar] [CrossRef] [PubMed]
  40. Mlinarić, S.; Piškor, A.; Melnjak, A.; Mikuška, A.; Šrajer Gajdošik, M.; Begović, L. Antioxidant Capacity and Shelf Life of Radish Microgreens Affected by Growth Light and Cultivars. Horticulturae 2023, 9, 76. [Google Scholar] [CrossRef]
  41. Wang, W.B.; Kim, Y.H.; Lee, H.S.; Kim, K.Y.; Deng, X.P.; Kwak, S.S. Analysis of antioxidant enzyme activity during germination of alfalfa under salt and drought stresses. Plant Physiol. Biochem. 2009, 47, 570–577. [Google Scholar] [CrossRef]
  42. Znidarcic, D.; Ban, D.; Sircelj, H. Carotenoid and chlorophyll composition of commonly consumed leafy vegetables in Mediterranean countries. Food Chem. 2011, 129, 1164–1168. [Google Scholar] [CrossRef]
  43. Peng, L.; Zou, L.; Su, Y.; Fan, Y.; Zhao, G. Effects of light on growth, levels of anthocyanin, concentration of metabolites in Fagopyrum tataricum sprout cultures. Int. J. Food Sci. Technol. 2015, 50, 1382–1389. [Google Scholar] [CrossRef]
  44. Hodges, D.W.; Forney, C.F.; Wismer, W.V. Antioxidant responses in harvested leaves of two cultivars of spinach differing in senescence rates. J. Am. Soc. Hortic. Sci. 2001, 126, 611–617. [Google Scholar] [CrossRef] [Green Version]
  45. Kou, L.; Yang, T.; Luo, Y.; Liu, X.; Huang, L.; Codling, E. Preharvest calcium application increases biomass and delays senescence of broccoli microgreens. Postharvest Biol. Technol. 2014, 87, 70–78. [Google Scholar] [CrossRef]
  46. Chandra, D.; Kim, J.G.; Kim, Y.P. Changes in microbial population and quality of microgreens treated with different sanitizers and packaging films. Hortic. Environ. Biotechnol. 2012, 53, 32–40. [Google Scholar] [CrossRef]
Figure 1. Microgreens grown from six different crops under controlled conditions. 1. Mungbean; 2. Lentil; 3. Pearl millet; 4. Red radish; 5. Mustard; 6. Red cabbage.
Agriculture 13 00676 g001
Table 1. Details of the crop species which are used as microgreens.
SpeciesFamilySeed Rate/Tray * (g)
Mungbean (Vigna radiata L.)Fabaceae40 ± 1.52
Lentil (Lens culinaris L.)Fabaceae40 ± 1.54
Pearlmillet (Cenchrus americanus L.)Poaceae25 ± 1.02
Red Radish (Raphanus raphanistrum L. subsp. sativus)Brassicaceae10 ± 0.64
Mustard (Brassica juncea L.)Brassicaceae10 ± 0.72
Red Cabbage (Brassica oleracea L. Capitata Group)Brassicaceae10 ± 0.85
* Tray size: 60 × 30 × 4 cm (l × b × h).
Table 2. Age and gender make-up of consumer panel in the consumer acceptance test.
Age (Years)
Gender20 or Less21–3031–4041–5050 or OlderTotal (%)
Female3344216 (64%)
Male221139 (36%)
Total5 (20%)5 (20%)5 (20%)5 (20%)5 (20%)25 (100%)
Table 3. Visual quality rating index of microgreens.
ScoreElucidationVisual Appearance
5Freshly collected without any deformity, physical and visible defects in the microgreensExcellent
4Very slight defects, but not disagreeable. Little (<10%) visible damage (i.e., affected cotyledons). Microgreens are turgid, not wiltedGood
3Slight undesirable defects, marketability threshold. Moderately yellowing (chlorosis). Some parts of microgreens are dry and wilted (<25%)Fair
2Excessive defects, not acceptable in the market, discolored hypocotyls (blue, black, and brown). Chlorosis on the cotyledon (>25%). Wilted and dried (>50%)Poor
1Not consumable, degraded product. 90–100% discolored and necrotic. Mold present, bad odor. Extensive rooting. Physical deterioration apparent (liquid present)Very Poor
Derived from: Berba and Uchanski [26].
Table 4. Germination percentage of selected crops at different temperatures.
CropGermination (%)
20 °C22 °C24 °C26 °C28 °C30 °C
Mungbean10–20 ± 1.42 cd35–40 ± 2.45 c40–45 ± 1.32 c50–70 ± 1.64 c60–95 ± 4.24 ab60–90 ± 3.86 ab
Lentil20–30 ± 2.46 c25–40 ± 1.82 d30–65 ± 1.48 d55–85 ± 2.56 bc70–90 ± 4.45 a70–85 ± 3.48 a
Pearl millet5–10 ± 0.38 d35–40 ± 2.84 c40–45 ± 1.64 bc50–70 ± 2.14 bc60–85 ± 3.24 ab70–80 ± 3.24 ab
Red Radish30–40 ± 2.56 b40–50 ± 2.96 bc40–60 ± 1.86 bc60–85 ± 3.26 a50–75 ± 2.56 b60–70 ± 2.88 b
Mustard30–40 ± 2.86 b40–60 ± 2.52 b70–90 ± 3.24 a60–80 ± 3.18 b60–70 ± 3.82 bc50–60 ± 2.64 bc
Red Cabbage40–50 ± 2.88 a50–70 ± 3.10 a50–70 ± 3.14 b50–60 ± 2.46 bc45–50 ± 2.42 c30–40 ± 2.14 c
Significant differences in values are indicated by different letters (p ≤ 0.05) and bold values indicate the highest score.
Table 5. Height of different microgreens species on different days after germination.
CropHeight (cm)
Day 3Day 4Day 5Day 6Day 7Day 8Day 9Day10Day11Day 12Day 13
Mungbean0.5–1.5 ± 0.111.0–2.0 ± 0.181.5–3.0 ± 0.243.0–7.0 ± 0.365.0–9.0 ± 0.426.0–12 ± 0.507–14 ± 0.528–15 ± 0.589–16 ± 0.7210–17 ± 0.7611–18 ± 0.70
Lentil0.5–1.5 ± 0.131.0–2.5 ± 0.182.0–4.0 ± 0.263.0–6.0 ± 0.325.0–8.0 ± 0.387.0–12 ± 0.488–12 ± 0.548–13 ± 0.609–14 ± 0.789–15 ± 0.7410–16 ± 0.78
Pearlmillet1.0–1.5 ± 0.111.0–2.0 ± 0.182.0–4.0 ± 0.243.0–7.0 ± 0.304.0–9.0 ± 0.406.0–10 ± 0.467–12 ± 0.468–14 ± 0.689–15 ± 0.7010–16 ± 0.7012–18 ± 0.82
Red Radish0.5–1.0 ± 0.121.0–2.0 ± 0.152.0–4.0 ± 0.283.0–5.0 ± 0.364.0–7.0 ± 0.385.0–8.0 ± 0.366–9 ± 0.427–10 ± 0.688–11 ± 0.648–12 ± 0.769–13 ± 0.68
Mustard0.5–1.5 ± 0.121.0–2.0 ± 0.161.5–3.0 ± 0.202.0–5.0 ± 0.324.0–7.0 ± 0.445.0–9.0 ± 0.466–11 ± 0.486–12 ± 0.647–13 ± 0.587–14 ± 0.748–15 ± 0.74
Red Cabbage0.5–1.0 ± 0.131.0–2.0 ± 0.142.0–4.0 ± 0.223.0–5.0 ± 0.284.0–6.0 ± 0.465.0–8.0 ± 0.427–9 ± 0.388–10 ± 0.609–11 ± 0.749–12 ± 0.7210–13 ± 0.76
Bold values indicate the highest and lowest score.
Table 6. Seed rate and yield attributes of different microgreens grown under a controlled environment.
CropSeed Rate (g)Fresh Weight (g)Dry Weight (g)Moisture FW (%)Moisture DW (%)Plant Color
Mungbean40 ± 1.52 a180–220 ± 5.68 a4.5–5.0 ± 0.14 a85–86 ± 2.78 c10–12 ± 0.24 cGreen
Lentil40 ± 1.54 a140–160 ± 6.34 b4.2–4.8 ± 0.16 a89–90 ± 3.24 b15–18 ± 0.26 bGreen
Pearl millet25 ± 1.02 b40–45 ± 7.26 c3–3.5 ± 0.12 b88–90 ± 3.42 b30–32 ± 0.32 aGreen
Red Radish10 ± 0.64 c150–170 ± 5.86 b3.5–4.0 ± 0.20 b90–92 ± 4.24 a13–15 ± 0.12 bcReddish Green
Mustard10 ± 0.72 c140–160 ± 8.12 b3.2–3.8 ± 0.16 bc90–91 ± 4.10 a12–14 ± 0.14 bcGreen
Red Cabbage10 ± 0.85 c120–130 ± 6.38 bc2.5–3.0 ± 0.12 c90–91 ± 4.28 a13–15 ± 0.10 bcPurplish Green
Significant Differences in values are indicated by different letters (p ≤ 0.05).
Table 7. Antioxidant activity and other bioactive components in microgreens.
CropTotal Antioxidant Activity (%)Total Phenolics (μgGAE/100 g FW)Anthocyanin (mg/100 g FW)Ascorbic Acid (mg/100 g FW)Phytic Acid (g/100 g FW)Dietary Fiber (g/100 g)
Mungbean80 ± 2.26 c840.68 ± 3.82 b62.12 ± 1.85 e16.34 ± 0.84 f0.238 ± 0.10 c3.48 ± 0.20 b
Lentil81 ± 2.28 bc988.24 ± 3.24 ab84.28 ± 1.26 d48.56 ± 0.92 c0.286 ± 0.12 b3.88 ± 0.16 b
Pearlmillet85 ± 2.02 a1136.10 ± 3.20 a108.42 ± 2.02 c35.14 ± 0.98 d0.304 ± 0.12 a6.48 ± 0.24 a
Red Radish84 ± 2.64 ab142.64 ± 2.64 c186.68 ± 1.84 a28.48 ± 1.04 e0.156 ± 0.14 d2.86 ± 0.18 c
Mustard72 ± 3.24 d52.62 ± 2.80 d24.62 ± 1.64 f60.68 ± 0.96 b0.168 ± 0.10 d2.26 ± 0.12 c
Red Cabbage87 ± 3.20 a1124.82 ± 3.24 a182.46 ± 1.24 b140.22 ± 0.94 a0.160 ± 0.10 d2.60 ± 0.16 c
Significant differences in values are indicated by different letters (p ≤ 0.05) and bold values indicate the highest and lowest score.
Table 8. Antioxidant enzyme activity and hydrogen peroxide content in microgreens.
CropCatalase
(U/g FW)
Peroxidase (U/g FW)Ascorbate Peroxidase (U/g FW)Superoxide Dismutase (U/g FW)H2O2 (nmol/g FW)
Mungbean392.84 ± 12.45 b246.36 ± 8.29 b124.08 ± 14.28 e24.78 ± 7.044.08 ± 0.048 a
Lentil294.62 ± 14.83 c228.02 ± 7.20 c202.64 ± 12.84 d39.86 ± 4.78 bc3.82 ± 0.026 a
Pearlmillet456.9 ± 14.26 a340.82 ± 8.92 a116.098 ± 11.04 e48.12 ± 8.98 b3.24 ± 0.047 ab
Red Radish246.12 ± 13.28 d198.45 ± 11.62 de340.92 ± 9.04 c36.28 ± 6.24 bc2.08 ± 0.064 c
Mustard298.24 ± 15.83 c202.46 ± 9.26 d497.924 ± 12.62 b30.88 ± 8.96 bc2.10 ± 0.020 bc
Red Cabbage230.68 ± 16.38 e184.04 ± 8.02 e682.46 ± 10.08 a64.08 ± 14.28 a2.18 ± 0.032 bc
Significant differences in values are indicated by different letters (p ≤ 0.05) and bold values indicate the highest and lowest score.
Table 9. Sensory attribute scores of all six selected microgreens on the day of harvest.
Storage (Days)MungbeanLentilPearl MilletRed RadishMustardRed Cabbage
VisualOlfactiveVisualOlfactiveVisualOlfactiveVisualOlfactiveVisualOlfactiveVisualOlfactive
0515151515151
2515151515151
4515151525252
6424242424342
8333242233423
10242333141514
Disclaimer/Publisher’s Note: The statements, opinions and data contained in all publications are solely those of the individual author(s) and contributor(s) and not of MDPI and/or the editor(s). MDPI and/or the editor(s) disclaim responsibility for any injury to people or property resulting from any ideas, methods, instructions or products referred to in the content.

