Abstract
Systematic evaluation of nitrogen (N) application in multi-crop production and its environmental impacts are of great significance for sustainable development of agriculture. Previous studies have focused on the evaluation of grain crops at the national and provincial levels, but ignored the county scale. Here, we evaluated the N rate, N use efficiency (NUE), N surplus, and greenhouse gas (GHG) emissions from the production of multiple crops including rice, wheat, maize, soybeans, tea, fruits, and vegetables at the county level of Fujian Province, China. The results showed that the N rates, N surpluses, and GHG emissions were generally higher, and NUEs were generally lower in the southern and southeastern coastal counties of Fujian Province, while the counties in the north and west had the opposite distribution trends. The N input and its negative environmental impacts for grain crops were generally lower than those for cash crops. The average NUE of all crops in Fujian Province in 2014 was 52.31%. The N input and N surplus for fruits accounted for 43.95% and 46.69% of those in the whole province, respectively. The evaluated framework we proposed in this study can be widely applied in the systematic evaluation of N input and its environmental footprints at the county scale for regions with multi-crop production.
1. Introduction
China is one of the most populous countries in the world; it feeds 18% of the world’s population on only 9% of the world’s arable land, and consumes 30% of the world’s synthetic fertilizer production [1]. The global nitrogen (N) fertilizer output reached 100 Tg in 2010, and as the world’s largest consumer and producer of fertilizer, China uses 30% of this for crop production [2]. Excessive N fertilizer use and lower N use efficiency (NUE) are common in China [3], which leads to significant N loss and produces serious environmental impacts [4], such as water and air pollution, increased greenhouse gas (GHG) emissions, biodiversity reduction, and ozone layer depletion [5]. Therefore, we need to quantify the N fertilizer use and its environmental impacts, which will provide a good reference for subsequent reduction of N rate, improvement of NUE, and mitigation of GHG emissions.
Previous studies have focused on the relationships among resources [6], the environment [7], and production of the crops [8], mainly at the national [5] and provincial levels [9]. The scholars mostly used field experiments [10], model simulations [11], and questionnaire evaluations [12]. The field experiments require researchers to observe the whole process of crop growth [11]. Meanwhile, model simulation, such as the Denitrification-Decomposition (DNDC) model [13,14], mainly emphasizes the role of carbon and N in the crop growth process. As for questionnaire evaluations [12], the commonly used form of face-to-face interviews may take too much time. Therefore, the above methods are not suitable for the analysis of spatial differences at the county scale, and an operational framework was needed to construct to study the N application and its environmental impacts at the county scale.
In addition, previous studies have evaluated N application and NUE of grain crops, such as rice, wheat, and maize [4,15]. Zhu et al. [16] evaluated N application and NUE of rice by changing the fertilization method. A study by An et al. [17] set up a field experiment framework to optimize N fertilizer management. Peng et al. [18] evaluated N fertilizer use on wheat and maize through field experiments. According to a study by Ti et al. [19], they developed a method for evaluating N fertilizer use and GHG emissions in open-air and greenhouse vegetables. However, previous studies mainly focused on the evaluation of resource and environmental impacts from grain crops, while less attention was paid to cash crops.
In this study, we take the multi-crop production system (including rice, wheat, maize, soybeans, tea, fruits, and vegetables) in Fujian Province as an example, and proposed four indicators of county level N rate, NUE, N surplus, and GHG emissions to assess the interrelationship between N fertilizer use and its environmental impacts at the county scale in Fujian Province. The objectives of this study are (i) to quantify the N fertilizer use and environmental impacts of multiple crops in Fujian Province and counties; (ii) to assess the differences in N fertilizer use and environmental impacts of different crops in Fujian Province and the spatial variations among counties.
2. Materials and Methods
2.1. Study Area
Fujian Province (23°33′ N to 28°20′ N, 115°50′ E to 120°40′ E) is located in southeastern China, on the coast of the East China Sea. Fujian Province borders Taiwan Province to the east, Zhejiang Province to the northeast, Jiangxi Province to the northwest, and Guangdong Province to the southwest (Figure 1). Close to the Tropic of Cancer, Fujian experiences a marine subtropical monsoon climate, which is warm and humid. For about 70% of the area of Fujian Province, the ≥10 °C annual accumulated temperatures are between 5000 °C and 7600 °C. Meanwhile, the average annual temperature varies from 17 °C to 21 °C, and the average annual precipitation varies from 1400 mm to 2100 mm, which provides an excellent climatic condition for human settlement and crop growth [20]. The total sown area of rice, wheat, maize, soybeans, tea, fruits, and vegetables in Fujian Province was 3.59 × 10⁷ ha in 2014.
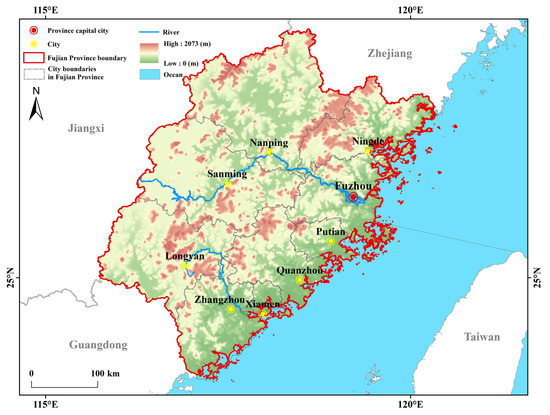
Figure 1.
The location and elevation of the Fujian Province, China.
2.2. Data Sources
In this study, grain crops include rice, wheat, maize and soybeans, and cash crops include tea, fruits, and vegetables. Crop harvested area, stock of pigs, sheep, goats, poultry, cattle (total stock of dairy, non-dairy, buffalo), and crop yield at the county scale in Fujian Province were obtained from the Fujian Statistical Yearbook and the National Statistical Yearbook, both published in 2015 [21,22]. We obtained data on livestock for the calculation of organic N fertilizer inputs for various crops. Spatial data of atmospheric N deposition in China was obtained from the spatial and temporal data set of wet deposition of atmospheric inorganic N in China (1996–2015) [23]. The N rate of rice, wheat, maize, and soybeans were mainly obtained from Zuo et al. [24]. The N rate of tea was obtained from Liang et al. [25], and the N rates of fruits and vegetables were obtained from the National Compilation Information on Cost and Benefit of Agricultural Products of 2015 [26]. The N fixation rates for various crops were obtained from Li and Smil et al. [27,28], and the N contents for various crops were obtained from Nielson et al. [29].
2.3. Methods
The N inputs for crops mainly include natural and anthropogenic inputs. Natural inputs include atmospheric N deposition and biological N fixation, and anthropogenic inputs include synthetic N fertilizer as well as manure N [30]. The evaluation indicators of N application and its environmental impacts include N rate, NUE, N surplus, and GHG emissions.
2.3.1. NUE
The NUE is the ratio of N fertilizer output at crop harvest to the total inputs of agricultural N fertilizer (including chemical fertilizer N input, organic fertilizer N input, N fixation, and atmospheric N deposition). We calculated the NUE of each crop as follows [31]:
whererepresents the NUE of crop i; represents the N content of crop i at the time of harvest (kg ha−1); represents the N rate of crop i (kg ha−1); represents the organic fertilizer N input of crop i (kg ha−1); represents the N fixation of crop i (kg ha−1) [27,28]; represents the atmospheric N deposition of crop i (kg ha−1); represents the yield of crop i (kg ha−1); represents the proportion of N in crop i during harvest (%) [29].
According to Bouwman et al. [32], the NH3 volatilization rates for different livestock types were 36% for cattle (dairy, non-dairy), pigs, and poultry, and 28% for buffalo, sheep, and goats. According to Zuo et al. [24], the N emissions rates were 3.4 kg head−1 yr−1, 9.6 kg head−1 yr−1, 66.9 kg head−1 yr−1, 35.2 kg head−1 yr−1, and 0.16 kg head−1 yr−1 for pigs, sheep, dairy cattle, other cattle, and poultry, respectively. According to Zuo et al. [24], the N recovery rates were 58%, 64%, 73%, 73%, and 65% for pigs, sheep, dairy cattle, other cattle, and poultry, respectively. The organic fertilizer N input was calculated as follows [24]:
where represents the organic N fertilizer input of crop i (kg ha−1); represents the number of livestock k at the end of the year (head); represents the N discharge rate of livestock k (kg head−1 yr−1); represents the N recovery rate of livestock k (%); represents the N volatilization rate of livestock k (%) [32]; is the crop harvest area (ha).
2.3.2. N Surplus
We considered N surplus as a reasonable indicator of N loss in the environment [31], but we did not consider the time and frequency of fertilizer application, which was calculated as follows:
whererepresents the excess N application of crop i (kg ha−1); represents the N rate of crop i (kg ha−1); represents the organic fertilizer N input of crop i (kg ha−1); represents the N fixation of crop i (kg ha−1); represents the atmospheric N deposition of crop i (kg ha−1); represents the N content of crop i at the time of harvest (kg ha−1).
2.3.3. GHG Emissions
Zuo et al. investigated GHG emissions from agricultural management, and determined that the GHG emissions from rice production include mainly CH4 and N2O, while other crops include only N2O. GHG emissions were calculated as follows [24]:
where represents the GHG emissions of crop i (kg CO2 eq); represents the N2O emission of crop i (kg N2O N); is the molecular conversion factor from N2 to N2O; represents the CH4 emissions from rice fields (kg CH4 C); 28 and 265 are global warming potential (GWP) [33].
- (1)
- N2O emissions from fertilizer
For direct N2O emissions from rice, wheat, and maize, this study used the results of the N2O emissions and N leaching index model based on N surplus by Chen et al. [34]. For direct N2O emissions from soybeans, we used the study results of Gerber et al. [35]. This study selected 1644 experimental samples worldwide and analyzed the relationship between direct N2O emissions and N fertilizer application. For direct N2O emissions from vegetables, we used the study results of Mei et al. that measured N2O fluxes in traditional vegetable planting regions in the Yangtze River Delta over a 4 year period [36]. For direct N2O emissions from fruits and tea, we used the study results of the emission factor method of Wang et al. [37]. The direct N2O emissions from rice, wheat, maize, soybeans, tea, fruits, and vegetables were calculated as follows [34,35,36,37]:
where represents the direct N2O emission of crop i (kg ha−1); represents the N surplus of crop i (kg ha−1); represents N rate of crop i (kg ha−1).
Indirect N2O emissions were calculated by using the emission factors from the Intergovernmental Panel on Climate Change (IPCC) Guidelines for National Greenhouse Gas Inventories [38].
For emissions from various crops, we used the study results from the reactive N loss model of Chen et al. [34]. The emissions were calculated as follows [34]:
where represents emissions of crop i (kg ha−1), represents N rate of crop i (kg ha−1).
For NH3 volatilization from rice, wheat, and maize, the study used the results of the N2O emissions and N leaching index model based on N surplus by Chen et al. [34]. For NH3 volatilization from soybeans, fruits, and tea, Zhang et al. showed that the crop NH3 volatilization rate was 12.9% in drylands based on data from 259 dryland samples in China [39]. For the NH3 volatilization from vegetables, Ti et al. derived that the NH3 volatilization rate was 19.4% of vegetables by estimating the N balance of greenhouse and open-air vegetables [19]. We calculated the NH3 volatilization of rice, wheat, maize, soybeans, tea, fruits, and vegetables as follows [19,34,39]:
where represents the NH3 volatilization of crop i (kg ha−1);
represents the N rate of crop i (kg ha−1).
For N leaching from rice, wheat, and maize, the study used the results of the N2O emissions and N leaching index model based on N surplus by Chen et al. [34]. For N leaching from soybeans, fruits, and tea, Zhang et al. derived the crop N leaching rate was 12.9% in drylands based on data from 259 dryland samples in China [39]. For the N leaching from vegetables, Ti et al. derived that N leaching rate was 19.4% for vegetables by estimating the N balance of greenhouse and open-air vegetables [19]. We calculated the N leaching of rice, wheat, maize, soybeans, tea, fruits, and vegetables as follows [19,34,39]:
where represents the N leaching amount of crop i (kg ha−1); represents the N surplus of crop i (kg ha−1); represents the N rate of crop i (kg ha−1).
- (2)
- CH4 emissions from rice fields
The CH4 calculation equation was from IPCC 2006, where the parameter reference values were taken from the study results of Zuo et al. The CH4 emissions from rice fields were calculated as follows [24,38]:
where represents the CH4 emission intensity (Gg CH4 yr−1); represents the CH4 emission factor (kg CH4 ha−1 day−1); represents the rice planting period (day); represents the rice planting area (ha); represent different ecosystems, water environments, and types and amounts of organic amendments, because CH4 emissions from rice may vary under other conditions.
The CH4 emission factor was calculated as follows:
where represents the adjusted daily emission factor of a particular harvested area; represents the baseline emission factors of continuously flooded fields without organic amendments; represents the scaling factor that considers the difference in the water regime across the cultivation period; represents the scaling factor that considers the difference in the water regime across the pre-season before the cultivation period; represents the scaling factor that varies with the type and amount of organic amendment applied.
The was calculated as follows:
where represents the scaling factor that varies with type and amount of organic amendment applied; i is the different types of organic amendment; is the application rate (kg ha−1) of organic amendments, for rice straw this is dry weight, and others use fresh weight; represents the conversion factor of the organic amendment i.
2.3.4. Statistical Analysis
First, we used SPSS software (created by three graduate students, Norman H. Nie, C. Hadlai (Tex) Hull and Dale H. Bent, at Stanford University in California, USA) to conduct an Analysis of Variance (ANOVA) on the top 10% and bottom 10% of counties by harvested area and the top 20% and bottom 20% by yield per unit area in Fujian Province. Secondly, we conducted Least Significant Difference (LSD) tests using SPSS software for the top 10% and bottom 10% of counties in terms of harvested area and the top 20% and bottom 20% counties in terms of yield per unit area for N rate, NUE, N surplus, and GHG emissions for various crops in Fujian Province. These two methods were used to demonstrate whether there were significant differences in areas with different harvested area or yield per unit area for N rate, NUE, N surplus, and GHG emissions.
3. Results
3.1. Analysis of N Rate in Multiple Crops at the County Scale in Fujian Province
In terms of crops, the fruits and tea had the highest N rate, they were 412.31 kg ha−1 and 308.05 kg ha−1, respectively (Figure 2e,f). This was because the main production areas of tea and fruits were mostly located in mountainous and hilly areas, the high annual rainfall and rapid dissolution of N fertilizer resulted in severe N leaching. Therefore, as perennial crops, tea and fruits need to increase the N rate to satisfy their growth. The vegetables had the third highest N rate (155.5 kg ha−1) among crops (Figure 2g). In summary, the N rates of cash crops (fruits, tea, and vegetables) were all greater than 150 kg ha−1. In contrast, the grain crops (rice, wheat, maize, and soybeans) had lower N rates than those of cash crops, which were all less than 130 kg ha−1. In particular, the soybeans had the lowest N rate (26.24 kg ha−1) among all crops, maybe because of its excellent N fixation capacity (Figure 2d). In terms of N input per unit of yield, we found that rice, wheat, soybeans, and vegetables generally required less N input per unit of yield. The high value region of N rate consumed per unit of yield for maize and fruits was mainly located in the counties of southern Fujian Province. The tea N input per unit of yield was the highest among the various crops, and in some counties exceeds 0.4 kg N kg−1 (Figure 3).
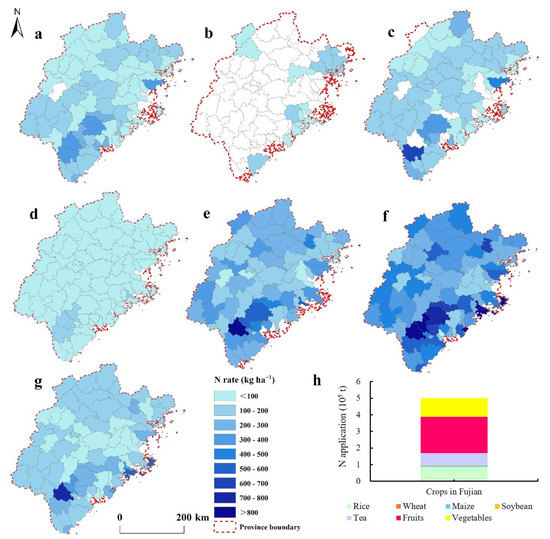
Figure 2.
The spatial patterns of N rate of various crops including rice (a), wheat (b), maize (c), soybeans (d), tea (e), fruits (f), and vegetables (g) at the county level in Fujian Province, as well as the N application amounts on various crops in Fujian Province (h).
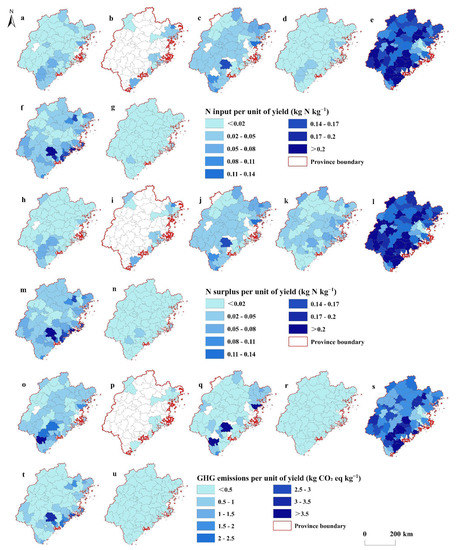
Figure 3.
The N input per unit of yield (a–g), the N surplus per unit of yield (h–n), and the GHG emissions per unit of yield (o–u) for rice (a,h,o), wheat (b,i,p), maize (c,j,q), soybeans (d,k,r), tea (e,l,s), fruits (f,m,t), and vegetables (g,n,u).
There were significant spatial variations of N rate among counties in Fujian Province. Counties in southern Fujian and along the southeast coast had higher N rates, such as Anxi County, Hua’an County, Licheng District of Putian City, Nanjing County, Pingtan County, Shishi City, and Xiuyu District of Putian City, while counties in northwest Fujian had relatively lower N rates. To explain the spatial variation of N rate by county, we conducted significance analysis for the top 10% and bottom 10% of counties by harvested area and the top 20% and bottom 20% by yield per unit area for each crop. We found that the harvested area and yield per unit area had significant impacts (p < 0.05) on the N rates of rice and soybeans (Figure 4a). For the whole province, the N application was 5.01 × 10⁵ t in 2014 (Figure 2h). Similar to the N rate of per unit area, the N application on fruits was also the highest (2.2 × 10⁵ t), accounting for 43.95% of the N application in Fujian Province, the highest N rate of per unit area, as well as the third highest harvested area (5.34 × 10⁵ ha) of all crops (Figure 2h). However, the N application on wheat was only 0.002 × 10⁵ t, accounting for 0.04% of the N application in Fujian Province (Figure 2h). The N applications on grain crops (0.94 × 10⁵ t) were much lower than that of cash crops (4.07 × 10⁵ t) because the N rate and harvested area (15 × 105 ha) of cash crops were much higher than the N rate and harvested area (8.95 × 10⁵ ha) of grain crops (Figure 2h).
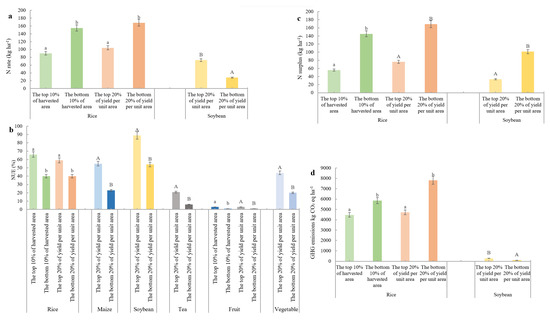
Figure 4.
Comparisons of N rate (a), NUE (b), N surplus (c), and GHG emissions (d) between counties in the top 10% and bottom 10% by harvested area as well as counties in the top 20% and bottom 20% by yield per unit area in Fujian Province. The a and b represent significance (p < 0.05), and the A and B represent highly significant (p < 0.01).
3.2. Analysis of NUE in Multiple Crops at the County Scale in Fujian Province
In terms of crops, soybeans had the highest NUE (72.08%), this was attributed to the high N fixation capacity of soybean itself (Figure 5d). As the main crop in Fujian Province, rice received a higher investment in capital and technology from local government and farmers, leading to the second highest NUE among all crops (51.19%) (Figure 5a). The lower NUE for vegetables (24.43%) was because vegetables were high-priced cash crops with short growth cycles and high returns, so farmers were used to increasing the N rate to increase yield and disregard the cost of N fertilizer and the environmental risk (Figure 5g). Meanwhile, the fruits and tea had lower NUEs, which were 2.33% and 7.11%, respectively (Figure 5e,f). This was a result of the higher N leaching rate in the hilly areas where tea and fruits are mostly grown. In general, the NUEs of grain crops were higher than those of cash crops.
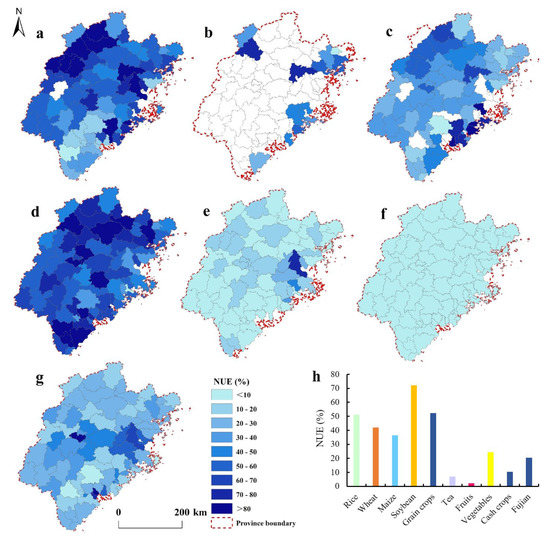
Figure 5.
The spatial patterns of NUE of various crops including rice (a), wheat (b), maize (c), soybeans (d), tea (e), fruits (f), and vegetables (g) at the county level in Fujian Province, as well as the NUE of various crops in Fujian Province (h).
There were obvious spatial differences in NUE among counties in Fujian Province, and the distribution pattern of NUE was opposite to that of N rate. Counties in the north and east Fujian had higher NUE, such as Dehua County, Fuan City, Jianou City, Sanyuan District, Sha County, Shaowu County, and Zhenghe County, while counties in the south had relatively lower NUE. We found that the top 10% and bottom 10% of counties by harvested area and the top 20% and bottom 20% by yield per unit area had significantly different impacts on NUE for rice, maize, soybeans, tea, fruits, and vegetables (p < 0.05) (Figure 4b). For the whole province, the NUE was 20.52% in Fujian Province, the NUEs of grain crops (52.31%) were higher than those of cash crops (10.32%) (Figure 5h).
3.3. Analysis of N Surplus in Multiple Crops at the County Scale in Fujian Province
In terms of crops, the N surplus in Fujian Province was the highest for fruits and the second highest for tea, which were 440.82 kg ha−1 and 320.5 kg ha−1 (Figure 6e,f), respectively. The lowest N surplus was for soybeans at 60.22 kg ha−1 (Figure 6d). The N surplus of cash crops were generally higher than that of grain crops. In terms of N surplus per unit of yield, the high-value regions of N surplus per unit of yield for rice, maize, and fruits were mainly located in the southern counties of Fujian Province. The tea N surplus per unit of yield was generally higher in the counties of Fujian Province. In some counties tea N surplus per unit of yield reached 0.5 kg N kg−1 (Figure 3).
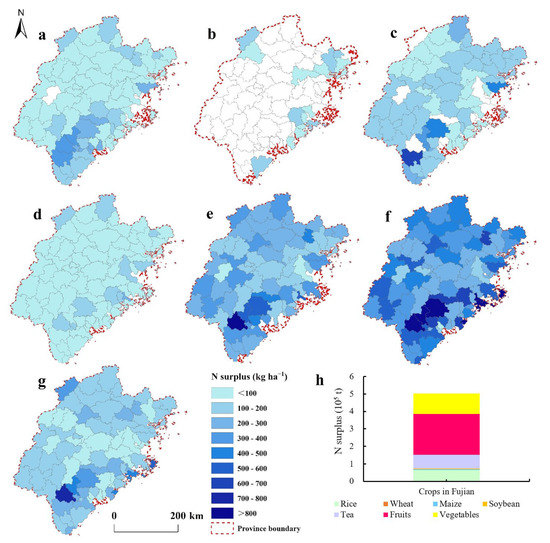
Figure 6.
The spatial patterns of N surplus of various crops including rice (a), wheat (b), maize (c), soybeans (d), tea (e), fruits (f), and vegetables (g) at the county level in Fujian Province, as well as the N surplus amounts of various crops in Fujian Province (h).
Counties in Fujian Province had significant spatial differences in N surplus. Counties in south Fujian had higher N surpluses, such as Hua’an County, Nanjing County, Pingtan County, Shishi City, and Xiuyu District of Putian City, while the northern and western counties had lower N surpluses. The distribution pattern of N surplus in each county was consistent with the N rate pattern, but opposite to the NUE pattern. We observed that the top 10% and bottom 10% of counties by harvested area and the top 20% and bottom 20% by yield per unit area had significantly different impacts (p < 0.05) on the N surpluses of rice and soybeans (Figure 4c). For the whole province, the N surplus was 5.04 × 10⁵ t in Fujian Province (Figure 6h). The N surplus of cash crops (4.31 × 10⁵ t), accounting for 85.42% of Fujian Province, was much higher than that of grain crops (0.73 × 10⁵ t) (Figure 6h). This was because the cash crops have higher N rate and lower N output than grain crops. The N surplus of fruits accounted for the largest proportion of Fujian Province (46.69%), while the N surplus of wheat accounted for the smallest proportion (0.04%). Wheat has the least environmental impacts because it has the smallest planted area (2.22 × 10³ ha) and has the lowest N surplus (83.12 kg ha−1) of all crops (Figure 6b).
3.4. Analysis of GHG Emissions in Multiple Crops at the County Scale in Fujian Province
In terms of crops, rice had the highest GHG emissions (5119.55 kg CO2 eq ha−1), for the rice production process produces not only N2O but also CH4 (Figure 7a). The GHG emissions of fruits and tea were listed as the second and third, which were 5031.55 kg CO2 eq ha−1 and 3759.85 kg CO2 eq ha−1, respectively (Figure 7e,f). The high GHG emissions from fruits and tea were attributed to the high N rate and N surplus of fruits and tea and the third and fourth largest planted areas of fruits and tea, respectively. Soybeans had the lowest GHG emissions (102.81 kg CO2 eq ha−1) (Figure 7d). In addition, the trend in the distribution GHG emissions per unit of yield for each county was consistent with the N surplus (Figure 3).
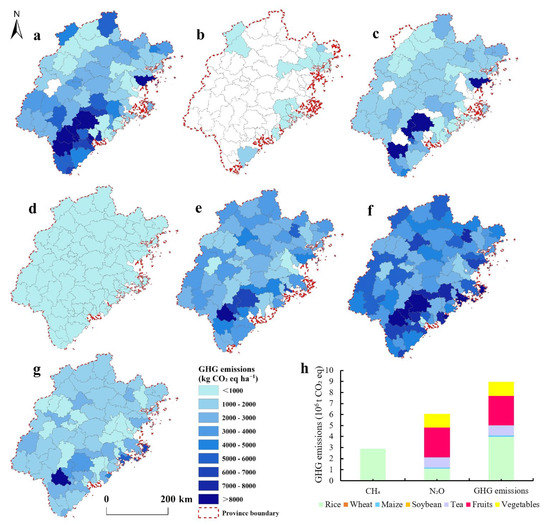
Figure 7.
The spatial patterns of GHG emissions of various crops including rice (a), wheat (b), maize (c), soybeans (d), tea (e), fruits (f), and vegetables (g) at the county level in Fujian Province, as well as the GHG emissions amounts of various crops in Fujian Province (h).
The GHG emissions in counties of Fujian Province had significant spatial differences. The GHG emissions of wheat and soybeans were generally lower in all counties. For other crops, the counties with high GHG emissions were mainly concentrated in the southern and southeastern coastal areas of Fujian Province, such as Hua’an County, Nanjing County, Pingtan County, Shishi City, and Xiuyu District of Putian City. The counties with lower GHG emissions were mainly concentrated in the northwestern part of Fujian Province. There were significant differences of the top 10% and bottom 10% of counties by harvested area and the top 20% and bottom 20% by yield per unit area on GHG emissions of rice and soybeans (p < 0.05) (Figure 4d). For the whole province, the GHG emissions were 8.95 × 10⁶ t CO2 eq in Fujian Province (Figure 7h). The GHG emissions of grain crops and cash crops were 4.1 × 10⁶ t CO2 eq and 4.85 × 10⁶ t CO₂ eq, respectively (Figure 7h). With the largest area among all crops in Fujian Province, the rice production accounted for 44.46% of the GHG emissions. The CH4 emissions from rice fields accounted for 32.3% of GHG emissions in Fujian Province. Wheat’s GHG emissions accounted for 0.01% of Fujian Province’s overall emissions.
4. Discussion
4.1. The Reasons for the Spatial Differences in N Fertilizer Use and Its Environmental Impacts among Counties
The counties in the south and southeast coast of Fujian Province had higher N rates, N surpluses, and GHG emissions than other counties, while their NUEs were the opposite. The distribution of N inputs and environmental impacts across counties were related to the level of economic development, farmers’ knowledge and income levels, and government policies in each county. In counties with lower levels of economic development and farmer knowledge, farmers were willing to invest more money to increase N fertilizer inputs in order to obtain higher crop yield. Therefore, this will result in higher N rates, N surpluses, and GHG emissions along with lower NUEs. In contrast, in counties with higher levels of economic development and farmer knowledge, farmers were more willing to invest their income in agricultural intensive management with higher mechanization and adopt improved N management techniques. Thus, it will lead to reduced N fertilizer use and environmental impacts as well as increased NUE [2]. In addition, government policies will have some influence on the N fertilizer use, such as the “Zero Growth in Chemical Fertilizer Use by 2020” policy proposed by the Ministry of Agriculture and Rural Development [40], and the fertilization guidance and financial investment policies for farmers in some counties of major agricultural production regions. Overall, we need to pay further attention to counties with higher N fertilizer use and their environmental impacts, and make good improvement recommendations. In addition, when we conducted significant difference analysis, we found that the harvested area and yield per unit area had significant impacts (p < 0.05) on the N rates of rice and soybeans. This is because rice and soybean production in the counties of the top 10% by the harvested area and the top 20% by the yield per unit area mostly used new varieties of planting, efficient cultivation planting system, highly efficient cultivation planting systems, more capital investment, and high mechanization [41]. Therefore, the counties in the top 10% by harvested area and top 20% by yield per unit area had lower N rates, N surpluses, and GHG emissions along with higher NUEs.
4.2. N Fertilizer Use on Multiple Crops at the County Scale in Fujian Province Compared with That in Other Regions
Compared to the results in China, Fujian Province had relatively lower N rates for most crops and higher NUEs for rice, wheat, and maize. This was because Fujian Province was mostly smaller farms, which were suitable for small-scale mechanization. Additional demonstration trials were conducted by local agricultural departments to convince small-hold farmers to improve their N fertilizer management practices. At the same time, it encouraged farmers to improve their farm facilities and provided financial subsidies. These practices improved the ability of smallholders to cope with the upfront opportunity costs of adopting improved N management practices that could improve crop yields and NUE [2]. Meanwhile, Fujian Province’s rice cultivation technology was more prominent among the provinces, the hybrid rice seed production area and yield in Fujian Province ranked first in the country [42]. For the grain crops, the N rates for rice, wheat, and maize in Fujian Province were 110.04 kg ha−1, 84.07 kg ha−1, and 128.34 kg ha−1, respectively, which was lower than those in China from 2007 to 2009—210 kg ha−1 for rice, 210 kg ha−1 for wheat, and 220 kg ha−1 for maize [43]. For the cash crops, the N rate of fruits and vegetables were 412.31 kg ha−1 and 155.5 kg ha−1 in Fujian Province, which were also lower than those in China overall (555 kg ha−1 for fruits and 388 kg ha−1 for vegetables) [43]. Further research is needed to determine the optimal N rate for each crop to improve N fertilizer use and reduce environmental impacts [1]. Similarly, the NUEs of rice (51.19%), wheat (42.04%), and maize (36.53%) in this study were also slightly higher than that in China overall (42.4% for rice, 50.1% for wheat, and 20.9% for maize after optimization) [4]. For the cash crops in Fujian Province, the NUE of tea (7.11%) was slightly lower than that of Japan (with NUE of 10–20% from 1965 to 2016) [44]. Meanwhile, with a value of 2.33%, the NUE of fruits in Fujian Province was also lower than that of Japan (9.1% in 2011). In addition, we also found the NUE of vegetables (24.43%) was only half of that in France in 2011 (47.97%) [31]. The lower NUE of cash crops compared to other countries was different because of the fertilization habits of farmers, who were accustomed to more fertilization in China. For example, there were N inputs of 215.08 kg ha−1 and 107.45 kg ha−1 for vegetables in Fujian Province and France, respectively [31].
4.3. Environmental Impacts of Multiple Crops at the County Scale in Fujian Province Compared with Those in Other Regions
According to the criteria of N surplus (less than 80 kg ha−1) proposed by the European Union (EU) [45], the current situation in Fujian Province had a N surplus of 82.14 kg ha−1 for grain crops and 287.21 kg ha−1 for cash crops, which was closer to the reference value for grain crops and higher for cash crops. Under economically optimal N management, the N surplus of rice in southeastern China was 150 kg ha−1 [46]. In this study, the N surplus of rice, wheat, and maize in Fujian Province were 82.01 kg ha−1, 83.12 kg ha−1, and 114.95 kg ha−1, respectively, which were significantly lower than the county-weighted average N surpluses of wheat, maize, and rice in China from 2005 to 2014 (122 kg ha−1 for wheat, 134 kg ha−1 for maize, and 140 kg ha−1 for rice) [15]. Similarly, the CH4 emissions from rice fields in Shanghai reached 3.23 × 10⁴ t in 2013 [14], while CH4 emissions from rice fields in Fujian Province was 10.68 × 10⁴ t in 2014. This was because the rice cultivation area in Fujian Province was larger than that in Shanghai, and therefore there were more CH4 emissions. The GHG emissions per unit area of 14 typical tea regions in China ranged from 3.22 to 9.76 t CO₂ eq ha−1 [37], and the GHG emissions per unit area of tea in Fujian Province in 2014 was 5.07 t CO2 eq ha−1, which was in line with the level of GHG emissions of tea regions in China. Meanwhile, with a value of 2698.83 kg CO2 eq ha−1, the GHG emissions per unit area of vegetables in Fujian Province was also lower than that of China overall (6244 kg CO2 eq ha−1) [47]. This means that the GHG emissions from vegetables in Fujian Province were smaller than those in other regions of China, and its environmental impacts of vegetables was slighter. In addition, there was still a gap between the GHG emissions of various crops in Fujian Province and developed countries, and we should compare with results from other developed countries to determine the mitigation potential of GHG emissions [48].
4.4. Limitations
Although many factors were considered in our study, there were some limitations and uncertainties. First, we obtained data on the N rate of various crops from other studies and statistical yearbooks. However, we systematically adjusted the data for some of the unreasonable N rates in some counties. Secondly, we used reference values in the calculation that were not locally from in Fujian Province. For example, the N leaching rate data used in the calculation of N leaching from soybeans, fruits, and tea were obtained from 259 dryland samples. Although the data of dryland samples for the N leaching rate were not from Fujian Province, they were from China, so it is reasonable.
5. Conclusions
We proposed a systematic evaluation framework of N application and its environmental impacts on various crops at the county scale, which was based in Fujian Province, China. Based on the amount per unit area, both fruits and tea in Fujian Province had higher N rates and N surpluses, and soybeans were opposite. The NUEs for both rice and soybeans were more than 50%, while fruits were the lowest. Rice and fruits had higher GHG emissions, and soybeans had the lowest GHG emissions. In general, compared with the cash crops, the grain crops had higher NUEs and lower N rates, N surpluses, and GHG emissions.
For the spatial pattern, the distribution patterns of N rates, N surpluses, and GHG emissions were consistent, with high values in the southern and southeastern coastal areas of Fujian Province, and low values in the northwestern counties. However, the NUEs had the opposite pattern to the other three indicators. Regarding the total amounts of the whole province, the grain crops also had higher NUEs and lower N rates, N surpluses and GHG emissions. Fruits contributed the highest proportion of N application (43.95%) and N surplus (46.69%) in Fujian Province. In addition, rice contributed the highest proportion of GHG emissions (44.46%) in Fujian Province. Our proposed framework for systematic evaluation of N fertilizer use in multi-crop production and its environmental impacts can provide scientific references and technical supports for other agricultural regions with similar characteristics at the county scale.
Author Contributions
Conceptualization, W.S. and X.S.; methodology, J.X. and R.D.; validation, X.W.; writing—original draft preparation, J.L.; writing—review and editing, W.S. and X.S.; supervision, W.S. and X.S.; funding acquisition, W.S. All authors have read and agreed to the published version of the manuscript.
Funding
This study was supported by the Science Fund for Creative Research Groups of the National Natural Science Foundation of China (Grant No. 72221002), the Strategic Priority Research Program of the Chinese Academy of Sciences (No. XDA23100202), and the National Key Research and Development Program of China (2022YFB3903504).
Institutional Review Board Statement
Not applicable.
Informed Consent Statement
Not applicable.
Data Availability Statement
Not applicable.
Conflicts of Interest
The authors declare no conflict of interest.
References
- Ren, K.Y.; Xu, M.G.; Li, R.; Zheng, L.; Liu, S.G.; Reis, S.; Wang, H.Y.; Lu, C.A.; Zhang, W.J.; Gao, H.; et al. Optimizing nitrogen fertilizer use for more grain and less pollution. J. Clean. Prod. 2022, 360, 132180. [Google Scholar] [CrossRef]
- Yan, X.Y.; Xia, L.L.; Ti, C.P. Temporal and spatial variations in nitrogen use efficiency of crop production in China. Environ. Pollut. 2022, 293, 118496. [Google Scholar] [CrossRef] [PubMed]
- Zhang, G.; Wang, X.K.; Sun, B.F.; Zhao, H.; Lu, F.; Zhang, L. Status of mineral nitrogen fertilization and net mitigation potential of the state fertilization recommendation in Chinese cropland. Agric. Syst. 2016, 146, 1–10. [Google Scholar] [CrossRef]
- Gu, B.J.; Van Grinsven, H.J.M.; Lam, S.K.; Oenema, O.; Sutton, M.A.; Mosier, A.; Chen, D. A credit system to solve agricultural nitrogen pollution. Innovation 2021, 2, 100079. [Google Scholar] [CrossRef]
- Zhang, X.; Zou, T.; Lassaletta, L.; Mueller, N.D.; Davidson, E.A.; Tubiello, F.N.; Lisk, M.D.; Lu, C.; Conant, R.T.; Dorich, C.D.; et al. Quantification of global and national nitrogen budgets for crop production. Nat. Food 2021, 2, 529–540. [Google Scholar] [CrossRef]
- Zhai, Y.J.; Zhang, T.Z.; Bai, Y.Y.; Ji, C.X.; Ma, X.T.; Shen, X.X.; Hong, J.L. Energy and water footprints of cereal production in China. Resour. Conserv. Recycl. 2021, 164, 105150. [Google Scholar] [CrossRef]
- Khoshnevisan, B.; Rafiee, S.; Pan, J.; Zhang, Y.; Liu, H. A multi-criteria evolutionary-based algorithm as a regional scale decision support system to optimize nitrogen consumption rate: A case study in North China Plain. J. Clean. Prod. 2020, 256, 120213. [Google Scholar] [CrossRef]
- Ma, L.; Bai, Z.H.; Ma, W.Q.; Guo, M.C.; Jiang, R.F.; Liu, J.G.; Oenema, O.; Velthof, G.L.; Whitmore, A.P.; Crawford, J.; et al. Exploring future food provision scenarios for China. Environ. Sci. Technol. 2019, 53, 1385–1393. [Google Scholar] [CrossRef]
- Sun, C.; Chen, L.; Zhai, L.M.; Liu, H.B.; Wang, K.; Jiao, C.; Shen, Z.Y. National assessment of nitrogen fertilizers fate and related environmental impacts of multiple pathways in China. J. Clean. Prod. 2020, 277, 123519. [Google Scholar] [CrossRef]
- Zhang, D.; Wang, H.Y.; Pan, J.T.; Luo, J.F.; Liu, J.; Gu, B.J.; Liu, S.; Zhai, L.M.; Lindsey, S.; Zhang, Y.T.; et al. Nitrogen application rates need to be reduced for half of the rice paddy fields in China. Agric. Ecosyst. Environ. 2018, 265, 8–14. [Google Scholar] [CrossRef]
- Tang, X.P.; Song, N.; Chen, Z.F.; Wang, J.L.; He, J.Q. Estimating the potential yield and ETc of winter wheat across Huang-Huai-Hai Plain in the future with the modified DSSAT model. Sci. Rep. 2018, 8, 15370. [Google Scholar] [CrossRef] [PubMed]
- Yin, Y.; Zhao, R.F.; Yang, Y.; Meng, Q.F.; Ying, H.; Cassman, K.G.; Cong, W.F.; Tian, X.S.; He, K.; Wang, Y.C.; et al. A steady-state N balance approach for sustainable smallholder farming. Proc. Natl. Acad. Sci. USA 2021, 118, e2106576118. [Google Scholar] [CrossRef]
- Tian, Z.; Fan, Y.D.; Wang, K.; Zhong, H.L.; Sun, L.X.; Fan, D.L.; Tubiello, F.N.; Liu, J.G. Searching for “Win-Win” solutions for food-water-GHG emissions tradeoffs across irrigation regimes of paddy rice in China. Resour. Conserv. Recycl. 2021, 166, 105360. [Google Scholar] [CrossRef]
- Zhao, Z.; Cao, L.K.; Deng, J.; Sha, Z.M.; Chu, C.B.; Zhou, D.P.; Wu, S.H.; Lv, W.G. Modeling CH4 and N2O emission patterns and mitigation potential from paddy fields in Shanghai, China with the DNDC model. Agric. Syst. 2020, 178, 102743. [Google Scholar] [CrossRef]
- Zhang, Q.S.; Li, T.Y.; Yin, Y.L.; Ying, H.; Cui, Z.L.; Zhang, F.S. Targeting hotspots to achieve sustainable nitrogen management in China’s smallholder-dominated cereal production. Agronomy 2021, 11, 557. [Google Scholar] [CrossRef]
- Zhu, C.H.; Xiang, J.; Zhang, Y.P.; Zhang, Y.K.; Zhu, D.F.; Chen, H.Z. Mechanized transplanting with side deep fertilization increases yield and nitrogen use efficiency of rice in Eastern China. Sci. Rep. 2019, 9, 5653. [Google Scholar] [CrossRef]
- An, N.; Wei, W.L.; Qiao, L.; Zhang, F.S.; Christie, P.; Jiang, R.F.; Dobermann, A.; Goulding, K.W.T.; Fan, J.L.; Fan, M.S. Agronomic and environmental causes of yield and nitrogen use efficiency gaps in Chinese rice farming systems. Eur. J. Agron. 2018, 93, 40–49. [Google Scholar] [CrossRef]
- Peng, Z.P.; Liu, Y.N.; Li, Y.C.; Abawi, Y.; Wang, Y.Q.; Men, M.X.; Duc Anh, A.V. Responses of nitrogen utilization and apparent nitrogen loss to different control measures in the wheat and maize rotation system. Front. Plant. Sci. 2017, 8, 160. [Google Scholar] [CrossRef]
- Ti, C.P.; Luo, Y.X.; Yan, X.Y. Characteristics of nitrogen balance in open-air and greenhouse vegetable cropping systems of China. Environ. Sci. Pollut. Res. 2015, 22, 18508–18518. [Google Scholar] [CrossRef]
- Fujian Provincial Department of Natural Resources. Main Data Bulletin of the Third Land Survey of Fujian Province. 2021. Available online: http://zrzyt.fujian.gov.cn/zwgk/zfxxgkzl/zfxxgkml/tdgl_19753/202112/t20211231_5805488.htm (accessed on 20 December 2022).
- Fujian Provincial Bureau of Statistics. 2015. Available online: https://tjj.fujian.gov.cn/ (accessed on 20 December 2022).
- National Bureau of Statistics. 2015. Available online: https://www.stats.gov.cn/ (accessed on 20 December 2022).
- Jia, Y.L.; Wang, Q.F.; Zhu, J.X.; Chen, Z.; He, N.P.; Yu, G.R. A spatial and temporal dataset of atmospheric inorganic nitrogen wet deposition in China (1996–2015). China Sci. Data 2018, 4, 1–10. [Google Scholar]
- Zuo, L.J.; Zhang, Z.X.; Carlson, K.M.; MacDonald, G.K.; Brauman, K.A.; Liu, Y.C.; Zhang, W.; Zhang, H.Y.; Wu, W.B.; Zhao, X.L.; et al. Progress towards sustainable intensification in China challenged by land-use change. Nat. Sustain. 2018, 1, 304–313. [Google Scholar] [CrossRef]
- Liang, L.; Ridoutt, B.G.; Wang, L.Y.; Xie, B.; Li, M.H.; Li, Z.B. China’s tea industry: Net greenhouse gas emissions and mitigation potential. Agriculture 2021, 11, 363. [Google Scholar] [CrossRef]
- Price Department, NDRC. National Compilation of Agricultural Cost-Benefit Information; China Statistics Press: Beijing, China, 2015. [Google Scholar]
- Li, H.; Qin, L.; He, H. Characteristics of the water footprint of rice production under different rainfall years in Jilin Province, China. J. Sci. Food Agric. 2018, 98, 3001–3013. [Google Scholar] [CrossRef]
- Smil, V. Nitrogen in crop production: An account of global flows. Globol Biogeochem. Cy. 1999, 13, 647–662. [Google Scholar] [CrossRef]
- Nielson, R.; Mays, M.; Goss, D. Agricultural Waste Management Field Handbook; USDA: Washington, DC, USA, 1996. [Google Scholar]
- Chukalla, A.D.; Krol, M.S.; Hoekstra, A.Y. Grey water footprint reduction in irrigated crop production: Effect of nitrogen application rate, nitrogen form, tillage practice and irrigation strategy. Hydrol. Earth Syst. Sci. 2018, 22, 3245–3259. [Google Scholar] [CrossRef]
- Zhang, X.; Davidson, E.A.; Mauzerall, D.L.; Searchinger, T.D.; Dumas, P.; Shen, Y. Managing nitrogen for sustainable development. Nature 2015, 528, 51–59. [Google Scholar] [CrossRef]
- Bouwman, A.F.; Lee, D.S.; Asman, W.A.H.; Dentener, F.J.; VanderHoek, K.W.; Olivier, J.G.J. A global high–resolution emission inventory for ammonia. Globol Biogeochem. Cy. 1997, 11, 561–587. [Google Scholar] [CrossRef]
- IPCC. IPCC WGI Fifth Assessment Report. 2013. Available online: https://archive.ipcc.ch/report/ar5/wg1/ (accessed on 20 December 2022).
- Chen, X.P.; Cui, Z.L.; Fan, M.S.; Vitousek, P.; Zhao, M.; Ma, W.Q.; Wang, Z.L.; Zhang, W.J.; Yan, X.Y.; Yang, J.C.; et al. Producing more grain with lower environmental costs. Nature 2014, 514, 486–489. [Google Scholar] [CrossRef] [PubMed]
- Gerber, J.S.; Carlson, K.M.; Makowski, D.; Mueller, N.D.; De Cortazar-Atauri, I.G.; Havlik, P.; Herrero, M.; Launay, M.; O’Connell, C.S.; Smith, P.; et al. Spatially explicit estimates of N2O emissions from croplands suggest climate mitigation opportunities from improved fertilizer management. Glob. Chang. Biol. 2016, 22, 3383–3394. [Google Scholar] [CrossRef]
- Mei, B.L.; Zheng, X.H.; Xie, B.H.; Dong, H.B.; Yao, Z.S.; Liu, C.Y.; Zhou, Z.X.; Wang, R.; Deng, J.; Zhu, J.G. Characteristics of multiple–year nitrous oxide emissions from conventional vegetable fields in southeastern China. J. Geophys. Res. 2011, 116, D12113. [Google Scholar] [CrossRef]
- Wang, F.; Chen, Y.; Wu, Z.; Jiang, F.; Zhang, W.; Weng, B.; You, C.M. Estimation of greenhouse gas emissions from chemical nitrogen fertilizer application and production and transportation processes in a typical tea region in China. Tea. Sci. 2020, 40, 205–214. [Google Scholar]
- IPCC. IPCC Guidelines for National Greenhouse Gas Inventories. 2006. Available online: https://www.ipcc-nggip.iges.or.jp/public/2006gl/chinese/index.html (accessed on 20 December 2022).
- Zhang, W.F.; Dou, Z.X.; He, P.; Ju, X.T.; Powlson, D.; Chadwick, D.; Norse, D.; Lu, Y.L.; Zhang, Y.; Wu, L.; et al. New technologies reduce greenhouse gas emissions from nitrogenous fertilizer in China. Proc. Natl. Acad. Sci. USA 2012, 110, 8375–8380. [Google Scholar] [CrossRef]
- Liu, Y.X.; Heuvelink, G.B.M.; Bai, Z.G.; He, P.; Xu, X.P.; Ma, J.C.; Masiliūnas, D. Space-time statistical analysis and modelling of nitrogen use efficiency indicators at provincial scale in China. Eur. J. Agron. 2020, 115, 126032. [Google Scholar] [CrossRef]
- Chai, Q.; Nemecek, T.; Liang, C.; Zhao, C.; Yu, A.; Coulter, J.A.; Wang, Y.F.; Hu, F.; Wang, L.; Siddique, K.H.M.; et al. Integrated farming with intercropping increases food production while reducing environmental footprint. Proc. Natl. Acad. Sci. USA 2021, 118, e2106382118. [Google Scholar] [CrossRef]
- Fujian Provincial Department of Agriculture and Rural Development. 2023. Available online: https://nynct.fujian.gov.cn/ (accessed on 3 March 2023).
- Wu, L.; Zhang, W.F.; Chen, X.P.; Cui, Z.L.; Fan, M.S.; Chen, Q.; Zhang, F.S. Nitrogen fertilizer inputs and production efficiency on Chinese farms. Soil Fertil. Sci. China 2016, 4, 76–83. [Google Scholar]
- Hirono, Y.; Sano, T.; Eguchi, S. Changes in the nitrogen footprint of green tea consumption in Japan from 1965 to 2016. Environ. Sci. Pollut. Res. Int. 2021, 28, 44936–44948. [Google Scholar] [CrossRef] [PubMed]
- Oenema, O.; Brentrup, F.; Lammel, J.; Bascou, P.; Billen, G.; Dobermann, A.; Erisman, J.W.; Garnett, T.; Hammel, M.; Haniotis, T.; et al. Nitrogen Use Efficiency (NUE) an Indicator for the Utilization of Nitrogen in Food Systems; Wageningen University: Wageningen, The Netherlands, 2015. [Google Scholar]
- Zhang, C.; Ju, X.T.; Powlson, D.; Oenema, O.; Smith, P. Nitrogen surplus benchmarks for controlling N pollution in the main cropping systems of China. Environ. Sci. Technol. 2019, 53, 6678–6687. [Google Scholar] [CrossRef]
- Zhang, F.; Liu, F.B.; Ma, X.; Guo, G.Z.; Liu, B.; Cheng, T.H.; Liang, T.; Tao, W.L.; Chen, X.P.; Wang, X.Z. Greenhouse gas emissions from vegetables production in China. J. Clean. Prod. 2021, 317, 128449. [Google Scholar] [CrossRef]
- Yuan, S.; Linquist, B.A.; Wilson, L.T.; Cassman, K.G.; Stuart, A.M.; Pede, V.; Miro, B.; Saito, K.; Agustiani, N.; Aristya, V.E.; et al. Sustainable intensification for a larger global rice bowl. Nat. Commun. 2021, 12, 7163. [Google Scholar] [CrossRef]
Disclaimer/Publisher’s Note: The statements, opinions and data contained in all publications are solely those of the individual author(s) and contributor(s) and not of MDPI and/or the editor(s). MDPI and/or the editor(s) disclaim responsibility for any injury to people or property resulting from any ideas, methods, instructions or products referred to in the content. |
© 2023 by the authors. Licensee MDPI, Basel, Switzerland. This article is an open access article distributed under the terms and conditions of the Creative Commons Attribution (CC BY) license (https://creativecommons.org/licenses/by/4.0/).