Abstract
The ability to obtain an accurate measure of irrigation water use is urgently needed in order to provide further scientific guidance for irrigation practices. This investigation took soil moisture and precipitation as the study objects and quantitatively analyzed their relationship by establishing four models: a linear model, a logarithmic model, a soil water balance model, and a similarity model. The results from building models on every site clearly revealed the relationship between soil moisture and precipitation and confirmed the feasibility of estimating irrigation water use when soil moisture data are known. Four models combined with soil moisture data were used to estimate irrigation water use. First, the 16 sites which monitor soil moisture conditions in Hebi City were identified as study objects, from which everyday meteorological data (temperature, precipitation, atmospheric pressure, wind speed, sunshine duration) and soil moisture data from 2015 to 2020 (totaling six years) were collected. Second, the eligible data from the first four years in the date range were used to create four kinds of models (linear model, logarithmic model, soil water balance model, and similarity model) to estimate the amount of water input to the soil surface based on soil moisture. Third, the eligible data from the last two years in the established date range were used to verify the established models on every site and then judge the accuracy of the models. For example, for site 53990, the RMSE of the linear model, logarithmic model, soil water balance model, and similarity model was 10,547, 10,302, 8619, and 7524, respectively. The results demonstrate that the similarity model proposed in this study can express the quantitative relationship between soil moisture and precipitation more accurately than the other three models. Based on this conclusion, the eligible soil moisture data known in the specific site were ultimately used to estimate the irrigation water use in the field by the relationship expressed in the similarity model. Compared with the amount of irrigation water data recorded, the estimated irrigation water use yielded by the similarity model in this study was 18.11% smaller. In a future study, microwave satellite remote sensing of soil moisture data, such as SMAP and SMOS soil moisture data, will be used to evaluate the performance of estimated regional irrigation water use.
1. Introduction
Agricultural irrigation helps guarantee human food production; however, its application consumes large amounts of fresh water [1,2]. More than 70% of the world’s total water intake is for irrigation, 90% of which represents consumptive water use [3,4]. In recent years, the annual amount of water used for agriculture has been about 350 billion m³ in China, and the average amount of irrigation water applied per acre of irrigated farmland has reached 350 m3 [5]. Long-term, large-scale irrigation from rivers, reservoirs, and aquifers disturbs the runoff of more than half of the world’s rivers and can also significantly alter the surface water cycle [6]. In particular, large amounts of groundwater are extracted for farmland irrigation in arid and semi-arid areas, making the recharge rate of groundwater less than the extraction rate and leading to such adverse consequences as surface subsidence, collapse, and seawater intrusion [7,8].
Irrigation water use is a key parameter for quantifying farmland irrigation [9] and also serves as the basis for studying human irrigation activities and their impacts on earth systems [10,11,12]. For example, in hydrological and land surface numerical models, the water resources management process must reflect two interacting aspects: water amount along with water supply and distribution [13,14]. The amount of available water resources is limited by the water supply and drives the allocation of water resources, which is reflected in the simulation as the process and total amount of water drawn from the water source. Irrigation represents a major source of water consumption. The precision of irrigation water use determines whether numerical models examining such topics as hydrology and land surface processes can accurately simulate human irrigation activities. In addition, irrigation water use is also the key to studying the impact of human irrigation activities on the ecological environment [15].
Existing studies on the impact of irrigation on surface water and heat can be divided into two categories: the statistical analysis method using observation data [1,16] and the numerical model simulation method [17,18]. The former method is used to compare and analyze differences in surface water and heat between irrigated areas and non-irrigated areas according to irrigation-related, meteorological, hydrological, and other observational data over a specified historical period [16]. In contrast, the latter method entails setting the time of occurrence and water amounts for farmland irrigation in the model. The model then simulates the interactive feedback process between surface hydrology and meteorology during the irrigation period and analyzes the influence of irrigation on surface water and heat [18]. Therefore, estimation of the ideal irrigation water use is vital to guide water-saving irrigation practices, perfect the numerical model to simulate the irrigation process, and study the influence of human irrigation activities on the ecological environment [19,20].
Previous studies have reported a strong positive correlation between increases in soil moisture and surface water input, such as precipitation and irrigation [21,22,23,24,25]. For example, in the state of Illinois, USA, after analyzing a 14-year soil moisture data set, researchers confirmed the positive correlation between soil moisture and rainfall, noting that the linear relationship between soil moisture changes and rainfall intensity was particularly significant in summer. In the Qilian Mountains of China [23], researchers studied the response of soil moisture to precipitation events and found that the soil moisture at 20 cm monitored at grassland and meadow sites increased rapidly after precipitation. Similarly, in the Hexi Corridor region of China, scholars confirmed through isotope analysis that higher rainfall correlated with greater precipitation infiltration [26]. In view of the connection between precipitation and soil moisture, some authors proposed a method to predict rainfall based on soil moisture data [24] by establishing a quantitative model between soil moisture and precipitation. This method estimated precipitation by using soil moisture data from the site and verified the feasibility of the inverse rainfall method based on soil moisture data [27,28].
Precipitation is a weather phenomenon in which condensed water vapor in the atmosphere descends to the Earth’s surface following a variety of patterns. One consequence is an increase in the water content of the soil where precipitation falls. In contrast, irrigation is an artificial method for replenishing the water in farmland when the soil water is inadequate to meet the needs of crop growth, which leads to a similar increase in soil water in the farmland. Thus, the effects of farmland irrigation and natural rainfall on soil moisture are very similar. Based on this phenomenon, Brocca et al. (2018) proposed a method to estimate irrigation water use via soil moisture [29]. Based on the principle of soil water balance, a quantitative expression model between surface soil water and surface water input was established. Then, a large number of precipitation data and soil moisture data were used to calibrate the model to be able to estimate surface water input (specifically from irrigation) based on surface soil moisture, and the model was subsequently applied to estimate regional irrigation water use.
Previous studies reported that the method could effectively capture the spatio-temporal distribution of regional irrigation water use. However, there is a large error in the irrigation water estimate [29,30]. Two reasons given for this outcome were calculation errors caused by noise in soil moisture data [31] and the error generated by the estimation model itself. In particular, the error generated by the model was identified as systematic deviation caused by the uneven distribution of sample data when the model was calibrated. This outcome can be attributed to the fact that precipitation is usually minor compared with irrigation water use, making it difficult to keep the distribution characteristics of precipitation data samples consistent with those of irrigation water use. Therefore, concentrating a large number of precipitation data in the small value interval will give the model a better fitting degree and higher accuracy of estimation in that interval. Contrariwise, the degree of fitting in the large value interval will be relatively poor, and the accuracy of estimation will be low, leading to a large error in the estimation of irrigation water use.
The current study sought to improve the accuracy of estimating irrigation water use via soil moisture, proposing a surface input water estimation model based on the similarity of soil water characteristics. The proposed model aimed to avoid the problem of modeling errors due to insufficient sample representation. Hebi City in Henan Province was selected as the research area, and soil moisture data and meteorological data from soil moisture monitoring sites were used to build the study models. A new similarity model was proposed in the study. Then, several models were used to estimate irrigation water use at the site. The accuracy of the irrigation water estimate was verified by comparing several models’ outputs with the recorded irrigation data for verification.
2. Basic Idea
The surface water input estimation model proposed in this paper is based on the following assumption: In the same location with a similar geographical environment, when n (n = 1, 2, 3, 4…) surface water input events occur, the initial surface soil water is consistent. Because the increase in soil water caused by these n events is also consistent, the input water of these n surface water input events can be considered to be the same (as shown in Figure 1). The assumption is based the Third Law of Geography [32].

Figure 1.
Surface water input prediction based on the similarity of soil moisture characteristics.
Based on the above assumptions, a large amount of precipitation data from historical records and soil moisture data drawn from the corresponding periods were used in this study to construct a characteristic set of soil moisture changes with known surface water input (Figure 1(a)). Next, the soil moisture data k (Figure 1(b)) in the period concerning surface water input to be examined were compared with the soil moisture data in the record set individually, and the record m with the most similar soil moisture characteristics in the record set was selected. Finally, the recorded precipitation was assigned to the surface water input event to be considered, and the input water value of this surface water input event was deduced after data processing. The overall diagram of the basic ideas of this research is illustrated in Figure 1.
3. Study Area and Data Sets
3.1. Study Area
Hebi City of Henan Province in China was selected as the research area (Figure 2). Specifically, the geographical location of the research area is in the north of Henan Province, covering an area of about 2140 km2. The landform of the area is mainly plain, with a few hills in the western region. The dominant soil type in this area is sandy loam. The study area features a temperate semi-moist monsoon climate type, characterized by dry weather with little rain in winter and hot and rainy weather in summer. The average annual rainfall in the region ranges from 500 to 800 mm, of which 60–80% occurs in summer. During the growing season of the crops in the study area, 3–7 applications of irrigation are often required to supplement the water requirements of the crops.

Figure 2.
(a) Location of In situ soil moisture sites in Hebi City and the land use of Hebi City. (b) The environment of each in situ soil moisture site.
In the study area, 16 automatic soil moisture monitoring stations were selected as research objects. The geographical location, environment, and land use of the in situ soil moisture sites are presented in Figure 2 and Table 1. Automatic soil moisture monitoring stations can provide timely meteorological data related to the location, such as precipitation, temperature, wind speed, sunshine duration, etc. Figure 2b portrays the data collection equipment.

Table 1.
Location and land use for the 16 in situ soil moisture sites.
3.2. Data Set
- (1)
- In situ soil moisture and precipitation data
Daily soil moisture data and precipitation data from 1 January 2015 to 31 December 2020 were obtained from 16 in situ soil moisture monitoring sites. At such monitoring sites, soil moisture data are automatically collected by Time-Domain Reflectometry (TDR) sensors. The sensor can obtain the volume and relative water content of soil every 10 cm within 10 to 100 cm of the surface. The data used in this experiment comprise the surface soil moisture data of 1–10 cm depth measured in the region where each site is located. In addition, the precipitation data representing daily precipitation were measured using an automatic rain gauge.
The time of irrigation and the relationship between soil moisture changes and precipitation could be determined according to the annual changes in soil moisture data and precipitation data at each station. Figure 3 displays the time series diagram of daily rainfall and soil moisture at the 53990 station. The figure demonstrates that soil moisture increased rapidly when precipitation occurred, and the amount of increase had a high correlation with rainfall. As can be seen from the figure, soil moisture also increased rapidly when there was no precipitation. Comparing the increased levels of soil moisture with irrigation time records confirmed that the sharp increase in soil moisture in the absence of precipitation was caused by irrigation. For example, the observed soil moisture data from station 53990 in 2017 reveals that manually recorded irrigation times occurred on 5 March, 31 May, 4 July, and 16 October, which was consistent with the soil moisture increase in the absence of rainfall, as shown in the figure.
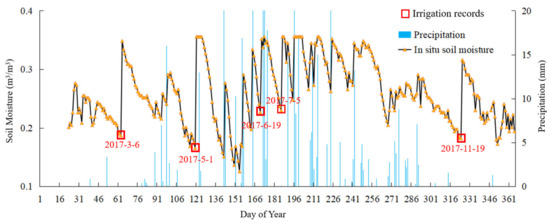
Figure 3.
Daily soil moisture and precipitation (53990, 2017).
The duration of precipitation events played a crucial role in the current study’s calculated results. Specifically, rainfall with an accumulation greater than or equal to 5 mm within three consecutive days was regarded as a precipitation event, and the sum of rainfall corresponding to the event was used as the rainfall data for processing. Meanwhile, the maximum increment in soil moisture within one day before and after the event was selected as the soil moisture data for processing. The reason for this selection was that a small amount of rainfall is typically intercepted by crops and the soil surface layer. Due to the hysteresis of soil moisture response to rainfall at a certain depth and the uncertainty of the recording time of the recorded soil moisture data [30], the decision was made to obtain the maximum increment of soil moisture from the day before rainfall to the day after rainfall. Data from 2015 to 2018 were used to build the model, while the data from 2019 to 2020 were used to verify the model.
- (2)
- Records of irrigation water use
The agricultural meteorological station in the study area (station 53990) recorded the details of irrigation water use, including irrigation times and irrigation water use per acre of land. The farmland where the in situ soil moisture site was located was an experimental field, and the irrigation water use was 80 mm per unit area.
- (3)
- Auxiliary data set
For the purposes of this research, in addition to the data at the site concerning temperature, pressure, wind speed, and sunshine time, meteorological data available for download from the China Meteorological Administration data sharing network (http://data.cma.cn/user/toLogin.html, accessed on 1 January 2021) were used to calculate evaporation at each site. Based on the meteorological data measured at each station, the Penman–Monteith formula was used to calculate the daily potential evapotranspiration at each station between 2015 and 2020. The Penman–Monteith formula is presented in Equation (1):
where ET0 represents the potential surface evapotranspiration [mm·d−1]. Rn is the net radiation amount [MJ·m−2·d−1], and G is the soil heat flux [MJ·m−2·d−1]. T denotes the daily average temperature at a height 2 m from the surface [°C]; u2 is the wind speed at a height 2 m from the surface [m·s−1]; es is the saturated vapor pressure [kPa]; ea is the actual vapor pressure [kPa]; Ce is the slope of water vapor pressure curve [kPa·°C−1]; and γ is the calculation constant of moisture [kPa·°C−1].
4. Methods
4.1. Calculation of Soil Moisture Similarity
4.1.1. Construction of the Samples of Soil Water Characteristics
Precipitation data are easier to obtain and more accurate than irrigation data. Therefore, precipitation data were selected to represent surface input water in this study, and the corresponding soil moisture change characteristics after the occurrence of precipitation events were obtained. The combination of precipitation data and soil moisture change characteristics was used to construct a soil moisture feature sample set. From the recorded precipitation events, those with a precipitation duration of <2 days and precipitation amount >5 mm were selected for the study’s precipitation data. Due to surface interception and evapotranspiration, a small amount of precipitation lasting a short time is unlikely to reach the soil; therefore, it cannot increase the water content in the soil [31]. In addition, soil water values before and after precipitation events were used to identify soil water characteristics.
Based on the above principles, precipitation data meeting the established constraints and soil water data corresponding to describing the characteristics of soil water changes were selected from each station. The data were recorded from 2015 to 2020. Next, 80% of the filtered data were used to build the sample set; the other 20% were used to validate the model. The similarity between the characteristics of soil water changes at point k to be predicted and the characteristics of soil water changes in the sample set (m1, m2, m3…) was then calculated.
4.1.2. Calculation of the Similarity of Soil Moisture Characteristics
The characteristics of soil water changes primarily include the initial value for soil water, the added value for soil water, and the duration of increase in soil water. In this study, the Manhattan distance formula was selected to measure the similarity of soil water characteristics. The calculation formula is as follows:
In Equation (2), pre_sw2 and pre_sw1 are soil moisture content before precipitation on the surface to be measured and the known surface; next_sw2 and next_sw1 are soil moisture content after precipitation on the surface to be measured and the known surface; and d is the distance from Manhattan to measure the similarity of soil moisture characteristics. In the scope of [0, |pre_sw2 − pre_sw1|), 0 indicates the highest similarity. Equation (3) was used to measure each uncertainty of the calculated results, as follows:
The parameters in Equation (3) are defined as in Equation (2), with a value range of [0, 1]. 0 indicates that the calculation result is the most uncertain; in other words, the characteristics of soil water change caused by the two soil water input events are very different. Conversely, 1 indicates that the calculation result is the most certain, meaning that the characteristics of soil water changes caused by the two soil water input events are completely consistent.
4.2. Contrast Models
Figure 4 displays the scatter plot of the relationship between precipitation and soil relative water content increments from 2015 to 2018 at station 53990. In the figure, the Pearson correlation coefficient r between soil moisture increment and rainfall is 0.809, indicating a strong correlation between soil moisture increment and rainfall at this site. Similar conclusions were also drawn from the data for the other sites.
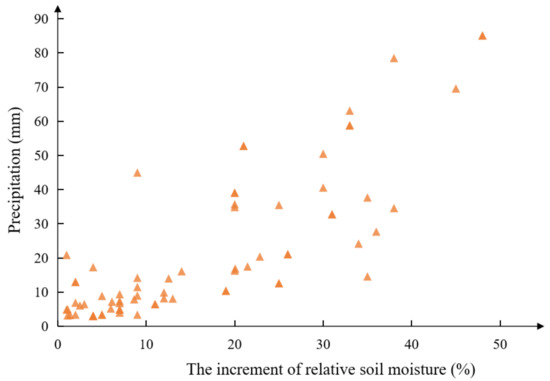
Figure 4.
Scatter plot for soil moisture and precipitation (53990).
In this study, three comparison models, including a linear model, a logarithmic model, and a soil water balance model [29], were selected to construct a quantitative relationship model between surface water input and soil water. These models and soil water data were used to inversely deduce surface water input, serving as a comparison model to verify the method proposed in this study.
4.2.1. Linear Model
The basic form of the linear model is shown in Equation (4).
y = a × + b
In Equation (4), y is the surface input water amount (rainfall), mm; x is the increment of soil relative water content, %; and a, b are the unknown parameters to be found by the model.
4.2.2. Logarithmic Model
The basic form of the log model is as follows:
y = a × lnx + b
In Equation (5), y is the surface input water amount (rainfall), mm; x is the increment of soil relative water content, %; and a, b are the unknown parameters to be found by the model.
4.2.3. Soil Water Balance Model
Brocca (2018) established a quantitative expression model between surface soil moisture and surface input water based on the principle of soil water balance. The author then calibrated the model with a large quantity of precipitation data and soil moisture data to obtain a model for estimating surface input water by soil moisture. The formula is as follows:
p(t) = Z × ds(t)/dt + r(t) + e(t) + g(t)
In Equation (6), Z represents soil porosity of a certain thickness (--); s(t) denotes soil relative saturation (%); t represents time (days); and p(t), r(t), e(t), and g(t) are precipitation, runoff, evapotranspiration, and drainage rate (mm·day−1), respectively. Assuming that all rainfall penetrates the soil (i.e., no surface runoff is generated), r(t) = 0. The drainage rate g(t) can be expressed as follows:
g(t) = a × s(t)b
In Equation (7), a and b are two nonlinear parameters representing soil drainage rate and relative saturation. The evapotranspiration can be calculated as the potential evapotranspiration multiplied by soil moisture. Finally, the soil water balance model can be described as follows:
p(t) = Z × ds(t)/dt + a × s(t)b + s(t) × ET0
The soil water balance model parameters were set according to soil moisture increment, soil moisture content after rainfall, and total potential evapotranspiration. The steps were as follows: (1) Set Z from 0 to 100 with a step of 0.1. (2) Set a from 0 to 50 with a step of 0.1. (3) Set b from 0 to 30 with a step of 0.1. These settings yield 1000 × 500 × 300 sets of parameters: Z, a, b. Refer to related literature [31] for the range of parameter values. Each set of parameters was substituted into the soil water balance equation to calculate the predicted rainfall data set, and the RMSE was calculated with the actual rainfall data set. When the RMSE reached the minimum value, the corresponding Z, a, and b were used as the parameters for modeling.
In the above model, according to the screening of precipitation data and soil moisture data from 2015 to 2020, 80% of the data were used to determine the value of model parameters, and 20% of the data were used to verify the model.
5. Results
5.1. Parameters of the Proposed Model
According to the constructed sample set, the Manhattan distance mean d and uncertainty mean U of all verification data sets at each site were calculated using the verification data from each site. The specific results are presented in Table 2. Notably, data from the O2913 and O2922 sites were missing, so these two points were not involved in the calculation. It can be seen from the table that uncertainty increased as the calculated average distance increased. Nevertheless, the uncertainty according to our calculations was low; as can be clearly seen from Table 2, the uncertainty was around 0.7, up to 0.782. This result indicates that the method proposed in this paper has a high certainty in estimating the surface water input. After analysis, the uncertainty of O2907 and other sites was small due to the large difference in soil water content status and the small quantity of data.
Table 2.
The mean Manhattan distance (d) and mean uncertainty (u) at each site.
Figure 5 illustrates the graph of the calculated Manhattan distance and the uncertainty at all sites. The two sites with no values in the figure are O2913 and O2922. As the figure demonstrates, the value of uncertainty does not indicate obvious distribution characteristics in space. Data analysis revealed that sites characterized by high uncertainty have a similar feature, that is, the number of samples in the characteristic set of soil water change is small. Therefore, the prediction accuracy of water input can be improved by increasing the number of samples in the characteristic set of soil water change in the later period, which is also an advantage of this method.
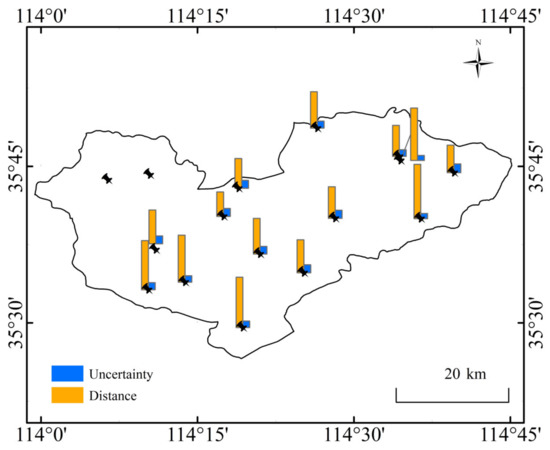
Figure 5.
The histogram of mean Manhattan distance and mean uncertainty at each site.
5.2. Parameters of the Contrast Models
Based on the selected precipitation data and soil moisture data, model parameters at each site were calculated, and the obtained linear model and logarithmic model parameters are presented in Table 3.
Table 3.
The parameters of linear model and logarithmic model.
According to the modeling data, the soil water balance model parameters at each site were calculated by using the parameter calibration method. The specific parameters of each model appear in Table 4.
Table 4.
The parameters related to the model of soil water balance.
5.3. Validation of the Simulation Results
Validation data were used to validate the models for each site, and the results can be seen in Table 5. At 53990, in Table 5, the RMSE between the rainfall data set deduced by the similarity model proposed in this study and the measured rainfall data set is 7524, while the corresponding R/A (RMSE/average) is 0.238. In the comparison model, the RMSE between the rainfall estimated by the linear model and the measured rainfall is 10,547, that of the logarithmic model is 10,302, and that of the soil water balance model is 8619, and the R/A corresponding to the three models were 0.512, 0.500, and 0.238.
Table 5.
Calculation results of relevant indicators of each site model.
The fitting degree of the three models was compared by the index R/A, and the data verification for other sites was integrated. In general, compared with the three comparison models, the similarity model had multiple sites with the minimum R/A. Therefore, the similarity model can better simulate the relationship between precipitation and soil moisture; consequently, this model was chosen to estimate irrigation water use in this paper.
6. Discussion
Irrigation information, such as the irrigation extent, irrigation timing and irrigation water use, is of great significance to many research fields [33,34,35]. Compared to the extraction of irrigation extent and irrigation timing, accurate estimation of irrigation water use in areas is more difficult because of the complex response of soil and crops after irrigation [31,36,37]. Therefore, how to effectively estimate irrigation water use has attracted a lot of attention from many disciplines. Brocca et al. (2013) proposed a new model for rainfall estimation through soil moisture observations [24], and the hourly rainfall data from three sites in Europe were used to validate the model. The results show that the new proposed model can well estimate rainfall via in situ soil moisture. In subsequent studies, the model was named SM2Rainfall by Brocca et al. (2014), and several satellite remote sensing of precipitation products and satellite remote sensing of soil moisture products were used to test the model in the area [27]. It was found that the precipitation estimated by the SM2Rainfall model could capture the temporal and spatial distribution characteristics of precipitation [27,28,38]. The effects of farmland irrigation and natural rainfall on soil moisture are very similar. Based on this phenomenon, Brocca et al. (2018) and some other researchers used the SM2Rainfall model to estimate regional irrigation water use via soil moisture [29,30,39,40]. However, there is a large error in the estimated irrigation water use. One reason is that the error generated by the model was identified as systematic deviation caused by the uneven distribution of sample data when the model was calibrated. The calibrated data (precipitation) are usually minor compared with irrigation water use, making it difficult to keep the distribution characteristics of precipitation data samples consistent with those of irrigation water use. In order to improve the estimation of irrigation water use, this study proposes a surface input water estimation model based on the similarity of soil water characteristics. The proposed model can avoid the problem of modeling errors due to insufficient sample representation. Compared with the linear model, logarithmic model, and SM2Rainfall model, the new proposed model in this study performs best in estimating surface input water over Henan Province (shown in Table 5).
The similarity model was then used to calculate the irrigation water use at the 53990 site. This is because the 53990 in situ soil moisture site was located in an experimental field. We only have the details of irrigation water use at this site. Factors used to measure the error of the inversion results included the RMSE and R/A of the irrigation water use data set calculated by the model and manually recorded irrigation water use data set. Compared with the recorded irrigation data, the average irrigation water use per unit area calculated by the soil water balance model was 65.51 mm, and the irrigation water use recorded by the monitoring station was 80 mm per incident. Therefore, relative to the recorded irrigation water use, the relative error of the irrigation water use calculated by the model was 18.11%. Notably, the irrigation water use retrieved in this study is small. A preliminary analysis was conducted because the rainfall data used in the modeling had a large range, including rainfall of various intensities. Low-intensity rainfall will be intercepted by ground cover or crop stems and leaves; thus, the change in soil moisture will be less reflected in this situation [25,41]. The irrigation water use was concentrated around 80 mm, introducing a lot of water into the soil. Lastly, due to the insufficient setting of data screening conditions used in modeling, the deviation of the model may also affect the final result [32].
In general, compared with the existing irrigation water use estimation methods, the similarity model proposed in this study can give full play to the advantages of individual representativeness of the sample. In addition, the similarity model can be easily improved with expansion of soil water characteristics samples. This advantage ensures that the estimation accuracy of the proposed method can be easily improved with an increase in the samples of soil water characteristics. It should be pointed out that this study only used in situ soil moisture data and weather data to validate the proposed method. The results show that the similarity model is significantly superior to the other three models (linear model, logarithmic model, SM2Rainfall model). However, it cannot draw a conclusion that the similarity model would perform better in estimating regional irrigation water use [42]. Therefore, in a future study, microwave satellite remote sensing of soil moisture data, such as the SMAP enhanced soil moisture product and SMAP/Sentinel-1 soil moisture product, will be used to evaluate the performance of estimated regional irrigation water use.
7. Conclusions
This study sought to calculate irrigation water use by establishing a similarity model to estimate surface water input based on soil water. The study incident included selecting 16 in situ soil moisture monitoring sites in Hebi City as research objects and quantitatively analyzing the relationship between soil water increment and rainfall. Next, the data from the last two years of the study data range were used to verify the established model, and the accuracy of the model was evaluated using RMSE. The results support the conclusion that the model based on the similarity principle can better express the quantitative relationship between soil moisture and precipitation. Finally, the similarity model and soil moisture data established in this study were selected to estimate irrigation water use in the field. Compared with the measured data, the irrigation water use estimated by the method in this paper was 18.11% smaller than the actual recorded data.
Author Contributions
Conceptualization, L.Z.; methodology, L.Z. and Z.G.; software, L.Z. and G.T.; validation, L.Z. and J.Z.; formal analysis, L.Z.; investigation, L.Z.; resources, L.Z.; data curation, L.Z.; writing—original draft preparation, L.Z.; writing—review and editing, L.Z.; visualization, L.Z.; supervision, L.Z.; project administration, L.Z.; funding acquisition, L.Z. All authors have read and agreed to the published version of the manuscript.
Funding
This research was funded by the Foundation of Anhui Province Key Laboratory of Physical Geographic Environment, China (2022PGE002), Postdoctoral Research Funding Program of Jiangsu Province (Grant No. 2020Z223), and the Project of Green Yang and Golden Phoenix, the National Natural Science Foundation of China (Grant No. 41771478).
Informed Consent Statement
Informed consent was obtained from all subjects involved in the study.
Data Availability Statement
All data included in this study are available upon request by contact with the corresponding author.
Conflicts of Interest
The authors declare no conflict of interest.
References
- Leng, G.; Huang, M.; Tang, Q.; Sacks, W.J.; Lei, H.; Leung, L.R. Modeling the effects of irrigation on land surface fluxes and states over the conterminous United States: Sensitivity to input data and model parameters. J. Geophys. Res. Atmos. 2013, 118, 9789–9803. [Google Scholar] [CrossRef]
- Toureiro, C.; Serralheiro, R.; Shahidian, S.; Sousa, A. Irrigation management with remote sensing: Evaluating irrigation requirement for maize under Mediterranean climate condition. Agric. Water Manag. 2017, 184, 211–220. [Google Scholar] [CrossRef]
- Siebert, S.; Döll, P.; Hoogeveen, J.; Faures, J.-M.; Frenken, K.; Feick, S. Development and validation of the global map of irrigation areas. Hydrol. Earth Syst. Sci. 2005, 9, 535–547. [Google Scholar] [CrossRef]
- Douglas, E.; Beltrán-Przekurat, A.; Niyogi, D.; Pielke, R.; Vörösmarty, C. The impact of agricultural intensification and irrigation on land–atmosphere interactions and Indian monsoon precipitation—A mesoscale modeling perspective. Glob. Planet. Chang. 2009, 67, 117–128. [Google Scholar] [CrossRef]
- Leng, G.; Huang, M.; Tang, Q.; Leung, L.R. A modeling study of irrigation effects on global surface water and groundwater resources under a changing climate. J. Adv. Model. Earth Syst. 2015, 7, 1285–1304. [Google Scholar] [CrossRef]
- Douglas, E.M.; Niyogi, D.; Frolking, S.; Yeluripati, J.B.; Pielke, R.A.; Niyogi, N.; Vörösmarty, C.J.; Mohanty, U.C. Changes in moisture and energy fluxes due to agricultural land use and irrigation in the Indian Monsoon Belt. Geophys. Res. Lett. 2006, 33, 5. [Google Scholar] [CrossRef]
- Ozdogan, M.; Gutman, G. A new methodology to map irrigated areas using multi-temporal MODIS and ancillary data: An application example in the continental US. Remote Sens. Environ. 2008, 112, 3520–3537. [Google Scholar] [CrossRef]
- Ferguson, I.M.; Maxwell, R.M. Human impacts on terrestrial hydrology: Climate change versus pumping and irrigation. Environ. Res. Lett. 2012, 7, 3061–3078. [Google Scholar] [CrossRef]
- Cheviron, B.; Vervoort, R.; Albasha, R.; Dairon, R.; Le Priol, C.; Mailhol, J.-C. A framework to use crop models for multi-objective constrained optimization of irrigation strategies. Environ. Model. Softw. 2016, 86, 145–157. [Google Scholar] [CrossRef]
- Lobell, D.B.; Bonfils, C. The Effect of Irrigation on Regional Temperatures: A Spatial and Temporal Analysis of Trends in California, 1934–2002. J. Clim. 2008, 21, 2063–2071. [Google Scholar] [CrossRef]
- Lobell, D.; Bala, G.; Mirin, A.; Phillips, T.; Maxwell, R.; Rotman, D. Regional Differences in the Influence of Irrigation on Climate. J. Clim. 2009, 22, 2248–2255. [Google Scholar] [CrossRef]
- Kang, S.; Eltahir, E.A.B. North China Plain threatened by deadly heatwaves due to climate change and irrigation. Nat. Commun. 2018, 9, 9. [Google Scholar] [CrossRef]
- Nazemi, A.; Wheater, H.S. On inclusion of water resource management in Earth system models—Part 2: Representation of water supply and allocation and opportunities for improved modeling. Hydrol. Earth Syst. Sci. 2015, 19, 63–90. [Google Scholar] [CrossRef]
- Nazemi, A.; Wheater, H.S. On inclusion of water resource management in Earth system models—Part 1: Problem definition and representation of water demand. Hydrol. Earth Syst. Sci. 2015, 19, 33–61. [Google Scholar] [CrossRef]
- Tang, Q.; Oki, T.; Kanae, S.; Hu, H. The Influence of Precipitation Variability and Partial Irrigation within Grid Cells on a Hydrological Simulation. J. Hydrometeorol. 2007, 8, 499–512. [Google Scholar] [CrossRef]
- Diffenbaugh, N.S. Influence of modern land cover on the climate of the United States. Clim. Dyn. 2009, 33, 945–958. [Google Scholar] [CrossRef]
- Haddeland, I.; Skaugen, T.; Lettenmaier, D.P. Anthropogenic impacts on continental surface water fluxes. Geophys. Res. Lett. 2006, 33, L08406. [Google Scholar] [CrossRef]
- Bonfils, C.; Lobell, D. Empirical evidence for a recent slowdown in irrigation-induced cooling. Proc. Natl. Acad. Sci. USA 2007, 104, 13582–13587. [Google Scholar] [CrossRef]
- Thenkabail, P.S.; Biradar, C.M.; Noojipady, P.; Dheeravath, V.; Li, Y.; Velpuri, M.; Gumma, M.; Gangalakunta, O.R.P.; Turral, H.; Cai, X.; et al. Global irrigated area map (GIAM), derived from remote sensing, for the end of the last millennium. Int. J. Remote Sens. 2009, 30, 3679–3733. [Google Scholar] [CrossRef]
- Puma, M.J.; Cook, B.I. Effects of irrigation on global climate during the 20th century. J. Geophys. Res-Atmos. 2010, 115, D16120. [Google Scholar] [CrossRef]
- Kirchner, J.W. Catchments as simple dynamical systems: Catchment characterization, rainfall-runoff modeling, and doing hydrology backward. Water Resour. Res. 2009, 45, 34. [Google Scholar] [CrossRef]
- Teuling, A.J.; Lehner, I.; Kirchner, J.W.; Seneviratne, S.I. Catchments as simple dynamical systems: Experience from a Swiss prealpine catchment. Water Resour. Res. 2010, 46, 15. [Google Scholar] [CrossRef]
- He, Z.; Zhao, W.; Liu, H.; Chang, X. The response of soil moisture to rainfall event size in subalpine grassland and meadows in a semi-arid mountain range: A case study in northwestern China’s Qilian Mountains. J. Hydrol. 2012, 420, 183–190. [Google Scholar] [CrossRef]
- Brocca, L.; Moramarco, T.; Melone, F.; Wagner, W. A new method for rainfall estimation through soil moisture observations. Geophys. Res. Lett. 2013, 40, 853–858. [Google Scholar] [CrossRef]
- Krier, R.; Matgen, P.; Goergen, K.; Pfister, L.; Hoffmann, L.; Kirchner, J.; Uhlenbrook, S.; Savenije, H.H.G. Inferring catchment precipitation by doing hydrology backward: A test in 24 small and mesoscale catchments in Luxembourg. Water Resour. Res. 2012, 48, W10525. [Google Scholar] [CrossRef]
- Zhou, H.; Zhao, W.H. Response of Soil Moisture to Precipitation Pulse by Stable Isotope in Desert Area of the Hexi Corrodo. J. Desert Res. 2016, 36, 1637–1645. (In Chinese) [Google Scholar] [CrossRef]
- Brocca, L.; Ciabatta, L.; Massari, C.; Moramarco, T.; Hahn, S.; Hasenauer, S.; Kidd, R.; Dorigo, W.; Wagner, W.; Levizzani, V. Soil as a natural rain gauge: Estimating global rainfall from satellite soil moisture data. J. Geophys. Res. Atmos. 2014, 119, 5128–5141. [Google Scholar] [CrossRef]
- Brocca, L.; Massari, C.; Ciabatta, L.; Moramarco, T.; Penna, D.; Zuecco, G.; Pianezzola, L.; Borga, M.; Matgen, P.; Martínez-Fernández, J. Rainfall estimation from in situ soil moisture observations at several sites in Europe: An evaluation of the SM2RAIN algorithm. J. Hydrol. Hydromech. 2015, 63, 201–209. [Google Scholar] [CrossRef]
- Brocca, L.; Tarpanelli, A.; Filippucci, P.; Dorigo, W.; Zaussinger, F.; Gruber, A.; Fernández-Prieto, D. How much water is used for irrigation? A new approach exploiting coarse resolution satellite soil moisture products. Int. J. Appl. Earth Obs. Geoinf. 2018, 73, 752–766. [Google Scholar] [CrossRef]
- Jalilvand, E.; Tajrishy, M.; Ghazi Zadeh Hashemi, S.A.; Brocca, L. Quantification of irrigation water using remote sensing of soil moisture in a semi-arid region. Remote Sens. Environ. 2019, 231, 111226. [Google Scholar] [CrossRef]
- Zhu, L.; Zhu, A.-X. Extraction of Irrigation Signals by Using SMAP Soil Moisture Data. Remote Sens. 2021, 13, 2142. [Google Scholar] [CrossRef]
- Zhu, A.X.; Lv, G.N.; Zhou, C.H. Geographic Similarity: Third Law of Geography. J. Geoinf. Sci. 2020, 22, 673–679. [Google Scholar] [CrossRef]
- Hu, X.; Shi, L.; Zeng, J.; Yang, J.; Zha, Y.; Yao, Y.; Cao, G. Estimation of actual irrigation amount and its impact on groundwater depletion: A case study in the Hebei Plain, China. J. Hydrol. 2016, 543, 433–449. [Google Scholar] [CrossRef]
- Chen, Y.; Lu, D.; Luo, L.; Pokhrel, Y.; Deb, K.; Huang, J.; Ran, Y. Detecting irrigation extent, frequency, and timing in a heterogeneous arid agricultural region using MODIS time series, Landsat imagery, and ancillary data. Remote Sens. Environ. 2017, 204, 197–211. [Google Scholar] [CrossRef]
- Li, X.; Jiang, W.; Duan, D. Spatio-temporal analysis of irrigation water use coefficients in China. J. Environ. Manag. 2020, 262, 110242. [Google Scholar] [CrossRef]
- Lawston, P.M.; Santanello, J.A.; Kumar, S.V. Irrigation Signals Detected from SMAP Soil Moisture Retrievals. Geophys. Res. Lett. 2017, 44, 11860–11867. [Google Scholar] [CrossRef]
- Zhao, H.; Hao, Z.; Zhang, C.; Wang, H.; Jiang, Y. Detecting Winter Wheat Irrigation Signals Using SMAP Gridded Soil Moisture Data. Remote Sens. 2019, 11, 2390. [Google Scholar] [CrossRef]
- Ciabatta, L.; Brocca, L.; Massari, C.; Moramarco, T.; Gabellani, S.; Puca, S.; Wagner, W. Rainfall-runoff modelling by using SM2RAIN-derived and state-of-the-art satellite rainfall products over Italy. Int. J. Appl. Earth Obs. Geoinf. 2016, 48, 163–173. [Google Scholar] [CrossRef]
- Zaussinger, F.; Dorigo, W.; Gruber, A.; Tarpanelli, A.; Filippucci, P.; Brocca, L. Estimating irrigation water use over the contiguous United States by combining satellite and reanalysis soil moisture data. Hydrol. Earth Syst. Sci. 2019, 23, 897–923. [Google Scholar] [CrossRef]
- Zohaib, M.; Choi, M. Satellite-based global-scale irrigation water use and its contemporary trends. Sci. Total. Environ. 2020, 714, 136719. [Google Scholar] [CrossRef]
- Crow, W.T.; van den Berg, M.J.; Huffman, G.J.; Pellarin, T. Correcting rainfall using satellite-based surface soil moisture retrievals: The Soil Moisture Analysis Rainfall Tool (SMART). Water Resour. Res. 2011, 47, 15. [Google Scholar] [CrossRef]
- Foster, T.; Mieno, T.; Brozovi, N.J.W.R.R. Satellite-based Monitoring of Irrigation Water Use: Assessing Measurement Errors and Their Implications for Agricultural Water Management Policy. Water. Resour. Res. 2020, 56, e2020WR028378. [Google Scholar] [CrossRef]


Disclaimer/Publisher’s Note: The statements, opinions and data contained in all publications are solely those of the individual author(s) and contributor(s) and not of MDPI and/or the editor(s). MDPI and/or the editor(s) disclaim responsibility for any injury to people or property resulting from any ideas, methods, instructions or products referred to in the content. |
© 2023 by the authors. Licensee MDPI, Basel, Switzerland. This article is an open access article distributed under the terms and conditions of the Creative Commons Attribution (CC BY) license (https://creativecommons.org/licenses/by/4.0/).