Article

A Study on Hyperspectral Apple Bruise Area Prediction Based on Spectral Imaging

1
College of Mechanical and Electronic Engineering, Shandong Agricultural University, Tai’an 271018, China
2
Provincial Key Laboratory of Horticultural Machinery and Equipment, Shandong Agricultural University, Tai’an 271018, China
*
Author to whom correspondence should be addressed.
Agriculture 2023, 13(4), 819; https://doi.org/10.3390/agriculture13040819
Submission received: 9 March 2023 / Revised: 27 March 2023 / Accepted: 29 March 2023 / Published: 31 March 2023
(This article belongs to the Special Issue Application of Chromatography and Spectroscopy in Agriculture)

Abstract

:
Achieving fast and accurate prediction of the fruit mechanical damage area is important to improve the accuracy and efficiency of apple quality grading. In this paper, the spectral data of all samples in the wavelength range from 376 to 1011 nm were collected, the sample set was divided by the physicochemical coeval distance method, and the spectral preprocessing methods were evaluated by establishing a full-wavelength artificial neural network model. The wavelength selection of spectral data was performed by competitive adaptive reweighted sampling, L1 parameter method, and the Pearson correlation coefficient method, and the partial least squares, artificial neural network, and support vector machine (Gaussian kernel) prediction models were established to predict the fruit bruise area size. The surface fitting was performed using the actual apple bruise area, and the regression surface equation of the damage time and damage height of the fruit was established. The results showed that (1) the preprocessing method of first-order difference + SG smoothing can make the prediction model more accurate; (2) the CARS-ANN prediction model has better prediction performance and higher operation efficiency, with the prediction set root mean square error of prediction and R-value of 0.1150 and 0.8675, respectively; (3) the sparrow search algorithm was used to optimize the model, which improved the accuracy of the prediction model. The root mean square error of prediction reached 0.0743 and The R-value reached 0.9739. (4) The relationship between spectral information, bruise area, damage time, and damage degree was obtained by combining the establishment of the fitted surface of the apple bruise area with the prediction model. This study is of application and extension value for the rapid nondestructive prediction of fruit bruise area.

1. Introduction

Apples are prone to mild bruises during picking, packing, and transportation, and early mild bruises are characterized by slight depressions, no juice spillage, and difficult recognition by the naked eye. In China, the quality of fruit sorting is mainly based on manual and machine vision sorting systems, which result in a significant waste of human and financial resources [1,2,3,4,5]. Traditional machine vision techniques can be used to detect surface defects and injuries of apples, but the recognition accuracy is not high for early mechanical damage or minor bruises [6,7,8,9,10].
In recent years, with the development of science and technology, optical sensing and imaging techniques have become effective tools for nondestructive testing and assessing the quality and safety of agricultural products. Hyperspectroscopy has been increasingly applied to fruit quality assessment due to its advantages of rich information, no damage to samples, and high detection accuracy [11,12,13,14,15,16,17,18,19,20]. In 2005, Qin et al. analyzed the spectral region from 692 to 856 nm to optimally identify the kernels of sour cherries [21] and used a portable hyperspectral imaging device to detect citrus rot in the 400–900 nm band [22].In 2010, Zhao et al. used hyperspectral image data obtained in the 408–1117 nm spectral range to detect minor abrasions of “crystal” pears and obtained better-sorting results by comparing four algorithms for minor abrasions of pears [23]. Rivera V et al. compared five methods for segmenting mangoes at selected wavelengths in multispectral images and finally selected k-NN for the classification of intact and bruised pixels The correct rate reached 98% [24]. Qibing Zhu et al. developed a partial least squares model using spectral scattering images for each impact energy level as well as pooled data to predict the susceptibility of apples to bruising with high prediction accuracy [11]. In 2014, Zhang Baohua et al. acquired spectral images in the 400–1000 nm band and used PC3 images after quadratic principal component analysis for apple bruise region detection with an accuracy of 95.8% [25]. In 2017, Shuxiang Fan et al. used the CARS-LS-SVM model as well as spectral band ratio images to detect early internal damage in blueberries, and the results showed that hyperspectral images can detect internal bruises in blueberries within 30 min after the mechanical impact [5]. The PLS-DA method was used to rapidly distinguish the ripening stage of the bruised oil tea fruit samples by using a hyperspectral imaging system. In 2021, Ye Sun et al. conducted a collision test on tomatoes and collected hyperspectral images of bruised tomatoes and used a partial least squares discriminant analysis model to classify bruised tomatoes with an overall classification accuracy of 90.93% [26]. In 2022, Zhang Zhen et al. analyzed the performance of spectral indices in the wavelength range from 350 to 2500 nm in determining apple hardness and used the dual-band combination method developed by them to identify effective spectral features as the best indicator of apple hardness with good results [27]. Using a hyperspectral imaging system, Jiang Huazhong et al. developed a PLS-DA model to rapidly zone the ripening stage of split oil tea fruit samples [28]. Yuan R. et al. developed the A-raw-iVISSA (interval variable iterative space shrinkage approach)-PLS-DA model by collecting reflectance, absorbance, and Kubelka–Monk spectral information of Lingwu long dates to predict their healing sensitivity with high accuracy [12].
Although more and more experts and scholars have used hyperspectral imaging technology for fruit quality evaluation in recent years and achieved many good results, relatively few studies have been conducted on the variation law of the fruit bruise area, and relatively few studies have been conducted on the influence law of damage degree and damage time on the bruise area of fruits. Therefore, this paper takes apples as an example and establishes a model for the change of the apple bruise area by acquiring and analyzing the hyperspectral images of apples to make a relatively accurate assessment of the damage time and damage degree of apples.

2. Materials and Methods

2.1. Sample Preparation

The test samples were all red Fuji apples, purchased on 20 March 2022, from Chengdao Supermarket in Tai’an, Shandong Province, and all apples were 8–9 cm in diameter with no obvious bruises. The hardness was measured as approximately 7.5 kg/cm2 using a Japanese triple hardness tester model LX-A, and the sugar content was measured as approximately 16.1% using an RY-107 model Toughness Brix tester. After the apples were delivered to the laboratory, the apples were numbered at room temperature (approximately 20 °C) and stored until the end of the experiment.

2.2. Damage Test and Construction of Hyperspectral Imaging System

The apple collision test bench was established as shown in Figure 1a. Apples were attached to the electromagnet with metal spheres of 25 mm in diameter, and the slider was controlled to stay at 20, 30, 40, 50, 60, and 70 cm from the top of the fruit, respectively, and the electromagnet was made to lose its magnetic force by power failure, and the metal spheres fell freely causing apple bruise. The hyperspectral image information was collected one by one when the samples were just bruised and when the bruised apples were left for 1 h, 6 h, 24 h, 72 h, and 120 h. To ensure the reliability of the test data, each group was repeated eight times.
The system used to acquire the spectra is shown in Figure 1b. The camera model is SOC710, and the equipment used for illumination is two 100 w adjustable tungsten halogen lamps; the spectral range acquired by this camera is 376–1011 nm, the resolution is 4.68 nm, and the number of bands is 128.

2.3. Sample Bruise Area Collection

The principal component analysis is a method for reducing the dimensionality of data. It regroups the original variables into a new set of mutually uncorrelated composite variables. The method removes a few less aggregated variables from the original data and retains as much information as possible about the data, depending on the actual needs.
As shown in Figure 2, the collected spectra were transformed by principal component analysis (PCA), the PC4 images with obvious bruised areas were selected, and the bruised areas were segmented by the maximum inter-class difference (Otsu) algorithm. Moreover, the bruised area of the fruit was calculated based on the actual reference ruler and image scale.

3. Results

3.1. Characteristics of Apple Spectral Curves

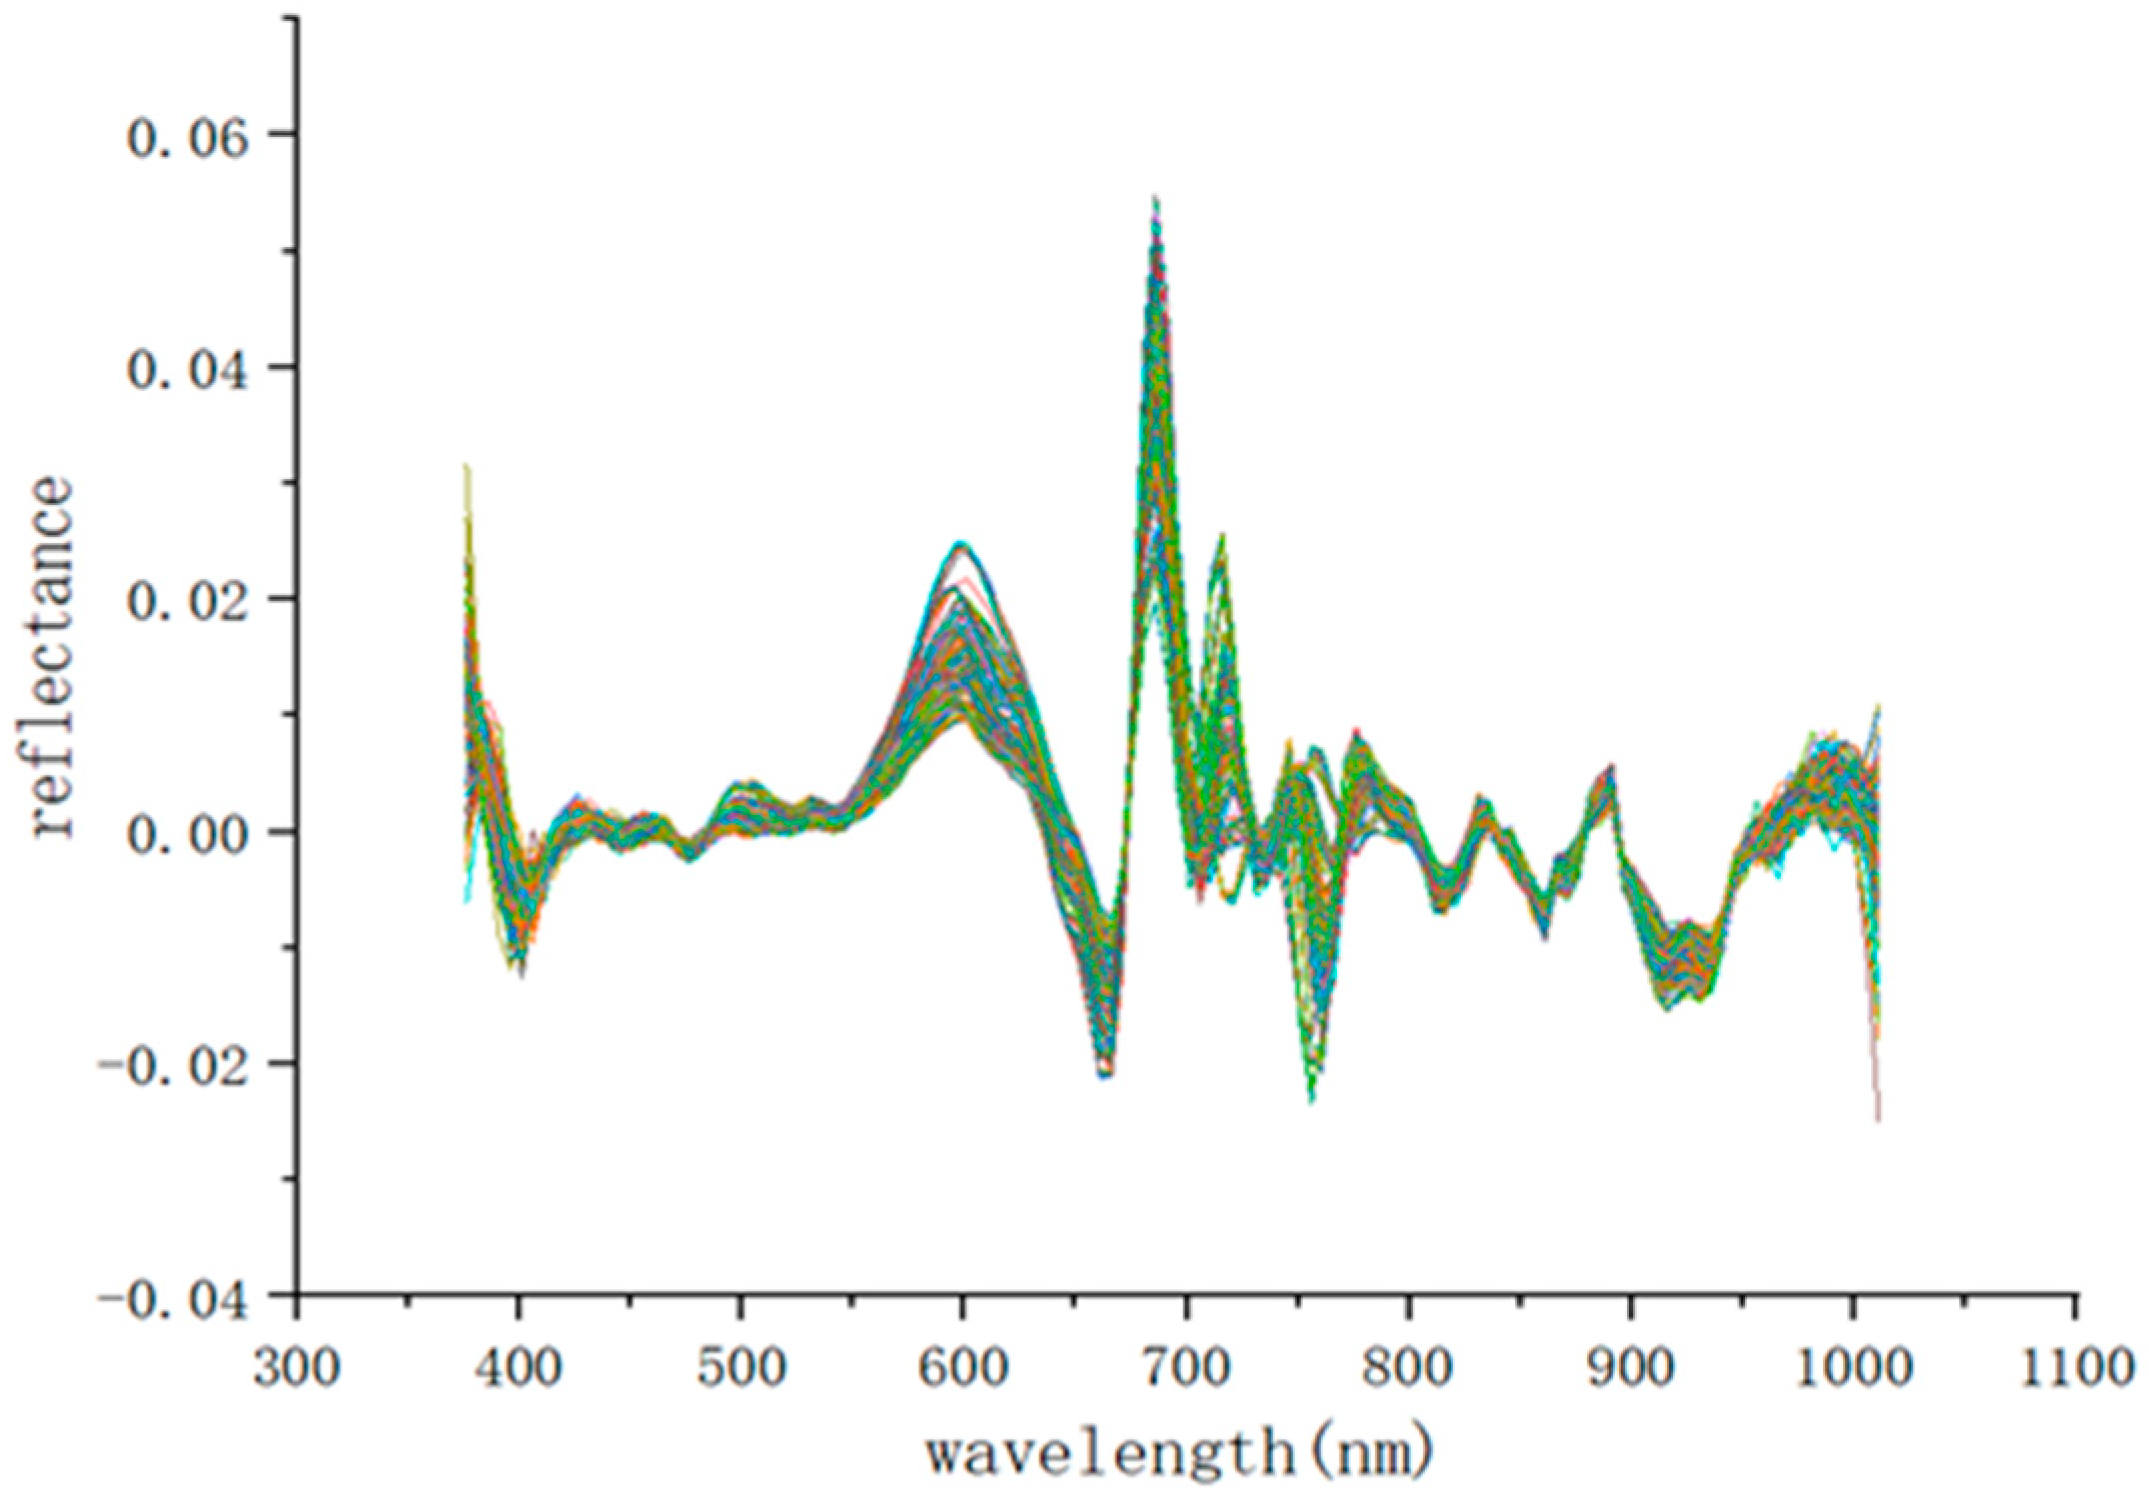
The spectral images were corrected and imported into the envi5.3 software. Through multiple validations, a marker size of 25 × 25 pixels was selected at the location of the bruise, and its average spectral curve was obtained. The average spectral profile is presented in Figure 3.
I = I R I D I w I D
In order to eliminate electronic noise generated by operation, environmental influences, etc., the acquired spectral image needs to be corrected according to Equation (1). The IR in the formula is the original hyperspectral image, IW is the spectral image acquired from the standard whiteboard, ID is the spectral image in full black, and I refers to the corrected spectral image.
As can be seen in Figure 3, the overall spectral profiles of the apple bruise sites at different times and degrees of damage are relatively similar, with two valleys near 680 nm and 970 nm, which are caused by changes in chlorophyll and changes in water content in the fruit. With the different heights of damage and time after damage, the spectral characteristics of the bruise parts of the fruit were changing, which may be due to the fact that the collision of the apple caused changes in the surface and internal cellular tissue of the fruit, resulting in weakened light scattering [29].

3.2. Sample Set Delineation

As shown in Equation (2), with the bruise area size as the Y variable and the spectral data as the X variable, the sample set partitioning based on the joint X-Y distance (SPXY) algorithm was used to divide the apple spectral data set into a training set, validation set, and test set in the ratio of 4:1:1.
d x ( p , q ) = j = 1 N x p ( j ) x q ( j ) 2 ; p , q [ 1 , N ] d y ( p , q ) = y p y q 2 = y p y q ; p , q [ 1 , N ] d x y ( p , q ) = d x ( p , q ) max p , q [ 1 , N ] d x ( p , q ) + d y ( p , q ) max p , q [ 1 , N ] d y ( p , q ) ; p , q [ 1 , N ]
where,
  • x: spectral data
  • y: bruise area
  • d: Euclidean distance between two samples
  • N: number of samples
Calculating the inter-sample distances can retain the characterization samples with the largest features, improve the representativeness of the samples, and facilitate the stability of the model. The results of the data set division are shown in Table 1.

3.3. Spectral Pretreatment

A single preprocessing method often cannot meet the model accuracy requirements. Therefore, in this paper, the common spectral preprocessing methods are divided into three categories: the first category is for baseline correction processing, including first-order differential and second-order differential; the second category is for eliminating the effect of scattering on the spectrum caused by different particle size and distribution uniformity, including multiplicative scatter correction (MSC) and standard normal variate transformation (SNV); the third category is for eliminating random noise and optimizing the signal, mainly by Savitzky–Golay (SG)and Gaussian Smoothing (GS). The above three types of pre-processing methods are combined two by two to process the original signal, and an ANN model is built to evaluate its accuracy. The results are shown in Table 2.
As can be seen from Table 2, the performance of the pre-processed spectral prediction is mostly higher than the original unprocessed spectral information, among which the model accuracy after first-order difference + SG processing is the highest, with the correlation coefficients of the calibration set and prediction set reaching 0.9028 and 0.9014, and the root mean square error of 0.2005 and 0.2045. The spectral information map after processing is shown in Figure 4. Therefore, the first-order difference + SG processing was subsequently used as a pre-processing method to participate in the subsequent modeling.

3.4. Feature Band Selection

The hyperspectral data collected in the experiment are all 696 × 520 × 128 pixels, and the data are lengthy and have many wavelengths unrelated to the detection target. Therefore, it is necessary to extract the feature wavelengths related to the detection target for subsequent modeling analysis.

3.4.1. Extraction of Feature Wavelengths Using Competitive Adaptive Reweighted Sampling (CARS)

Competitive adaptive reweighted sampling was used to extract the feature wavelengths for building the partial least squares regression model.
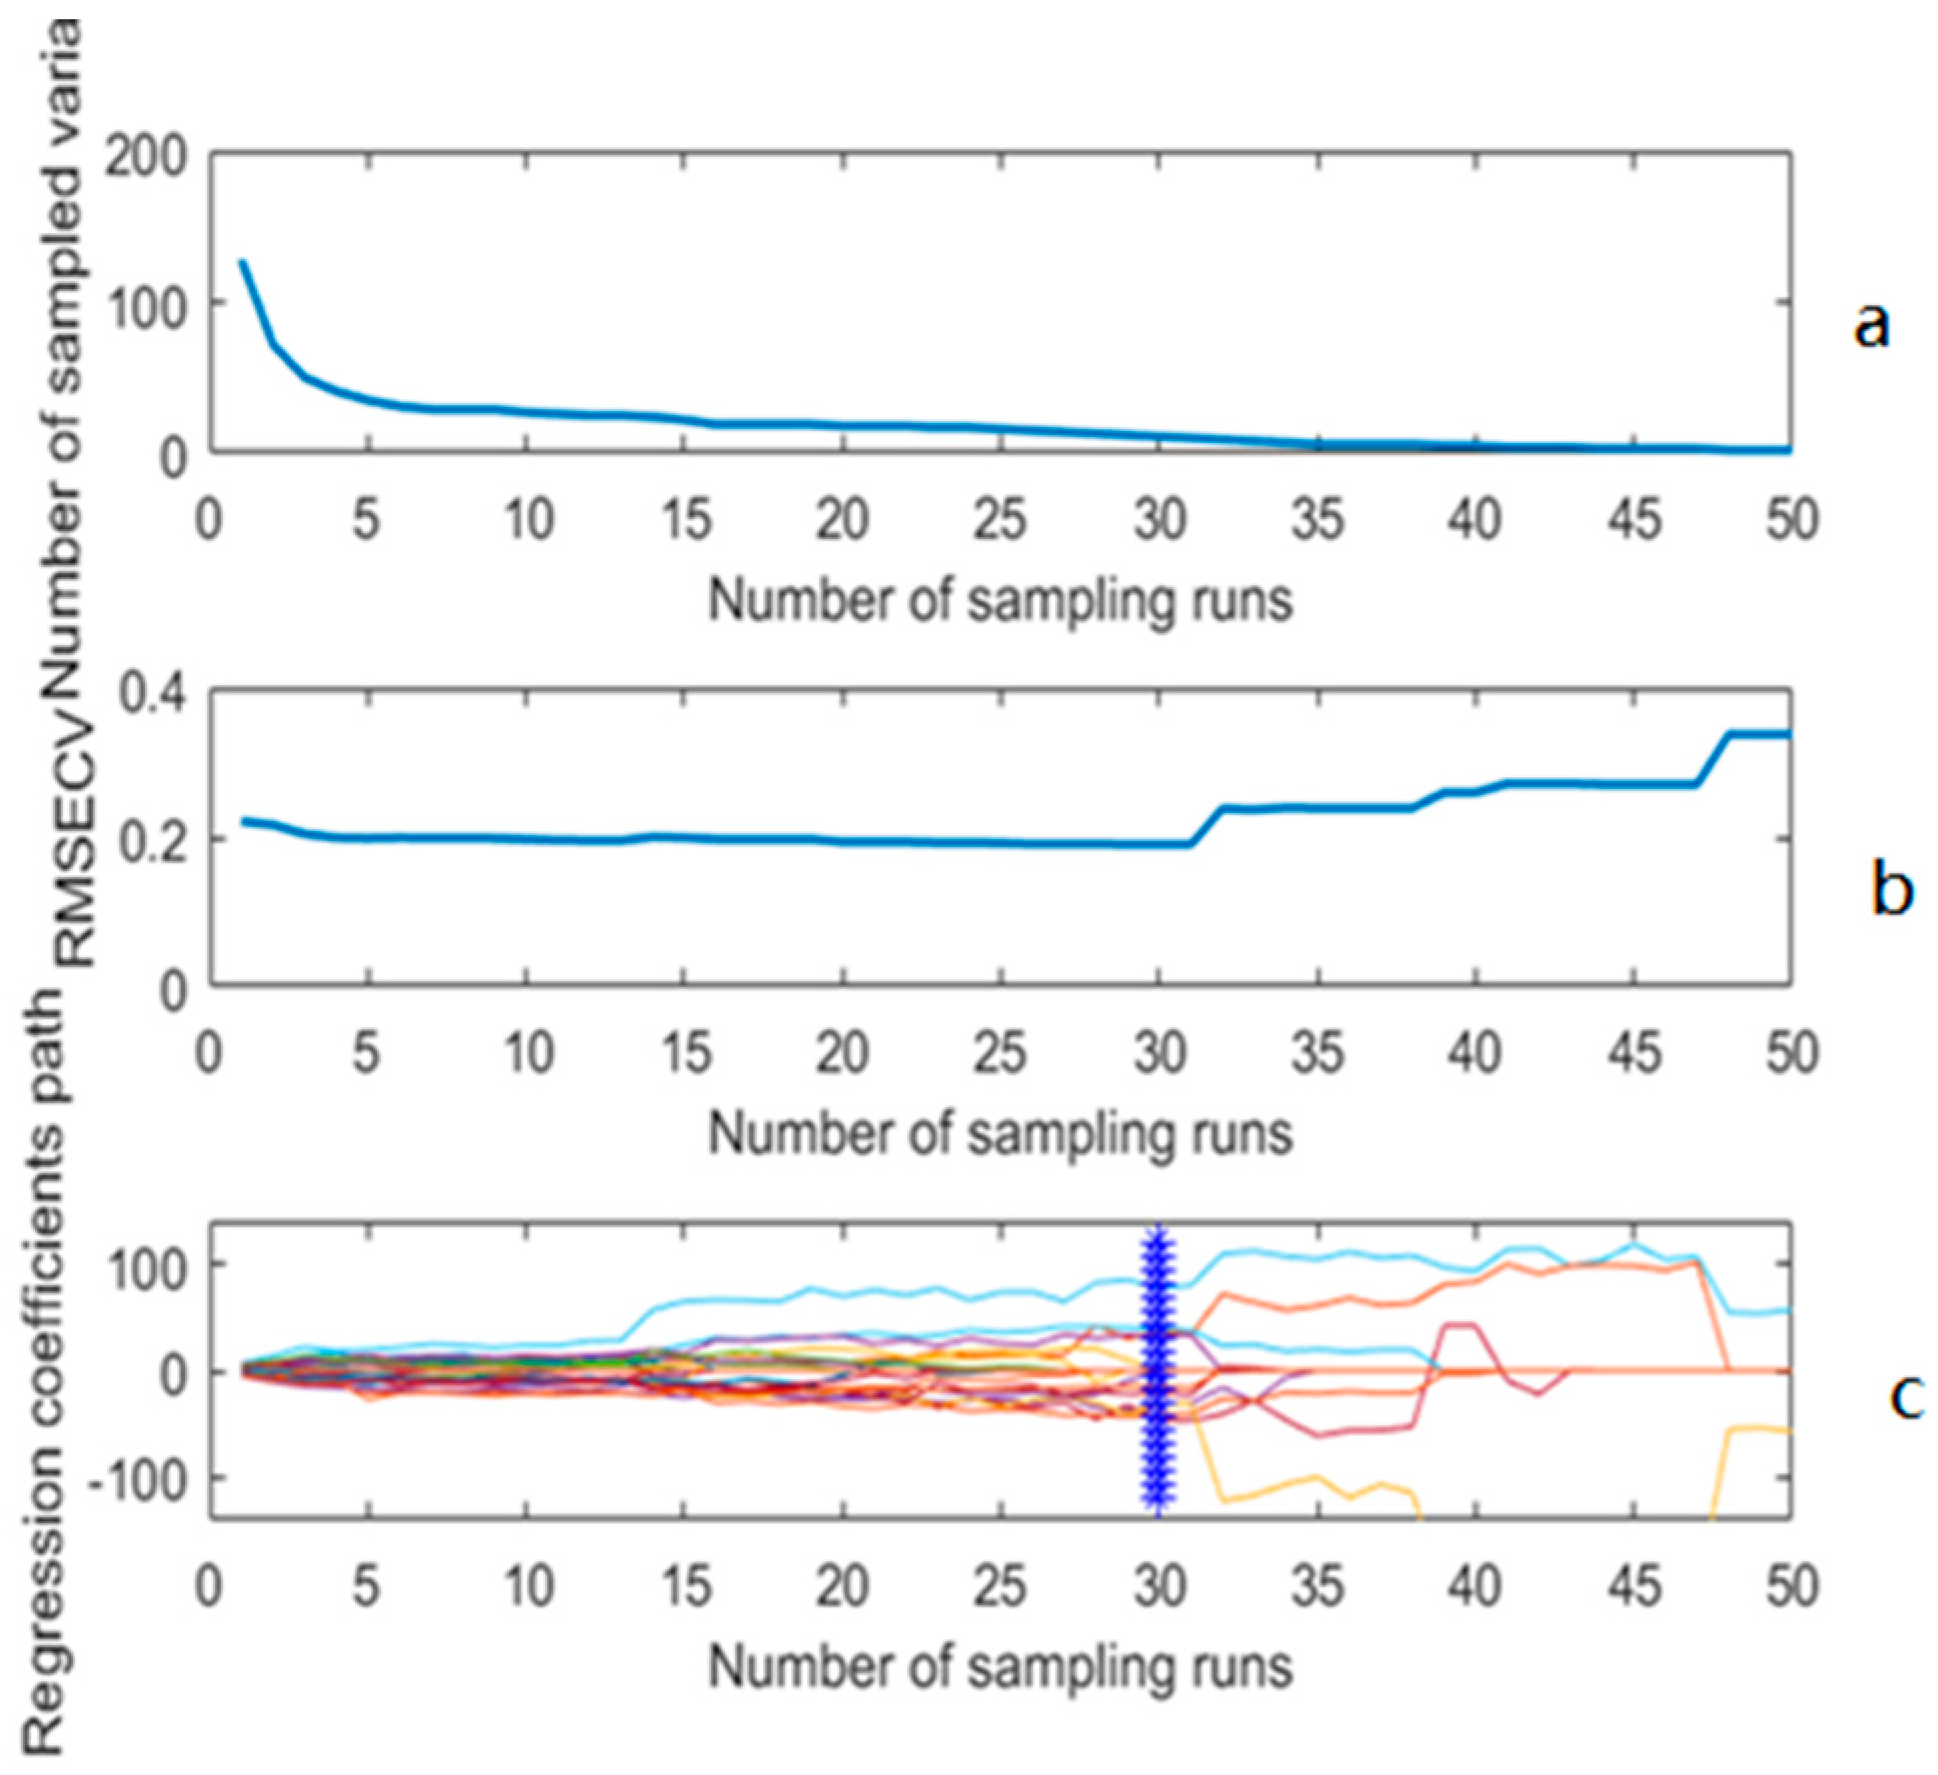
Figure 5 shows the schematic diagram of the sample image after processing by the CARS algorithm. As shown in Figure 5a, the number of wavelengths retained by the algorithm decreases as the number of samples increases, and the degree of variation in the number of retained wavelengths also decreases. Figure 5b plots the variation of RMSECV after 5-fold cross-validation, and the minimum RMSECV is 0.2177 when the number of samples is 5–32, and it continues to increase as the number of samples increases the RMSECV value. Figure 5c depicts how the regression coefficients for each variable change with iteration, and the star-shaped vertical line indicates the best model with the lowest RMSECV. Ultimately, the samples were subjected to wavelength screening by CARS, and a total of 11 wavelengths were screened out.

3.4.2. Extraction of Characteristic Wavelengths by Pearson Correlation Coefficient Method

The Pearson correlation coefficient method is a method for measuring the linear correlation between two variables, and its value range is [−1, 1]: −1 means a completely negative correlation, 1 means a completely positive correlation, and 0 means no linear correlation. The Pearson coefficient of each feature and the target variable is calculated based on Equation (3), and the top k largest features are selected as the final features by ranking according to the absolute value of the magnitude.
r = i = 1 n X i X ¯ Y i Y ¯ i = 1 n X i X ¯ 2 i = 1 n Y i Y   2

3.4.3. Feature Wavelength Extraction Using the L1 Norm Method

The feature selection method uses Lasso regression, which adds an L1 regularization term to constrain the parameters of the model based on its least squares method and makes a portion of the parameters shrink to zero.

3.5. Modeling

The PLS model obtains the mutually orthogonal feature vectors of the independent and dependent variables by projecting the high-dimensional data into the low-dimensional space, respectively, and then establishes a linear regression relationship between the feature vectors, which can overcome the multicollinearity problem of the data and performs well in small-sample prediction.
Gaussian kernel-based support vector machine (SVM) regression model is a nonlinear support vector regression that uses a Gaussian kernel to map the data from the original space to a high-dimensional feature space and then finds a hyperplane in the feature space that minimizes the sum of the error and regularization terms to accommodate the data with strong generalization capability.
The artificial neural network (ANN) regression modeling method is a method that uses artificial neural networks ANN for regression analysis, which consists of multiple artificial neurons with hierarchical and connection relationships to form a network structure and simulates the signal transmission between neurons utilizing mathematical expressions with strong topology. By choosing the appropriate number of hidden cells and network levels, feedforward networks can approximate nonlinear functions with arbitrary accuracy and are widely used in modeling and control [30].
In this paper, these three methods were applied to build a regression model of spectral data and apple bruise area.

4. Discussion

4.1. ANN Modeling Structure and Parameter Selection

In this paper, the trainlm (L-M) training method with good fitting problem-solving ability was used for model training in the ANN model construction process, and the parameter settings of the activation function and the number of hidden neurons were optimized.
Since the data in the training, validation, and test sets are partitioned by the SPXY algorithm and the data differences are small, the optimal structural parameters can be determined using the root mean squared error (RMSE) of the test set as a result of the model performance.
The hidden layer activation functions logsig and tanh and the output layer activation functions logsig, tanh, and sigmoid were tested. The test results are shown in Table 3. When the hidden layer activation function is logsig and the output layer activation function is tanh, the modeling effect is better than other combinations.
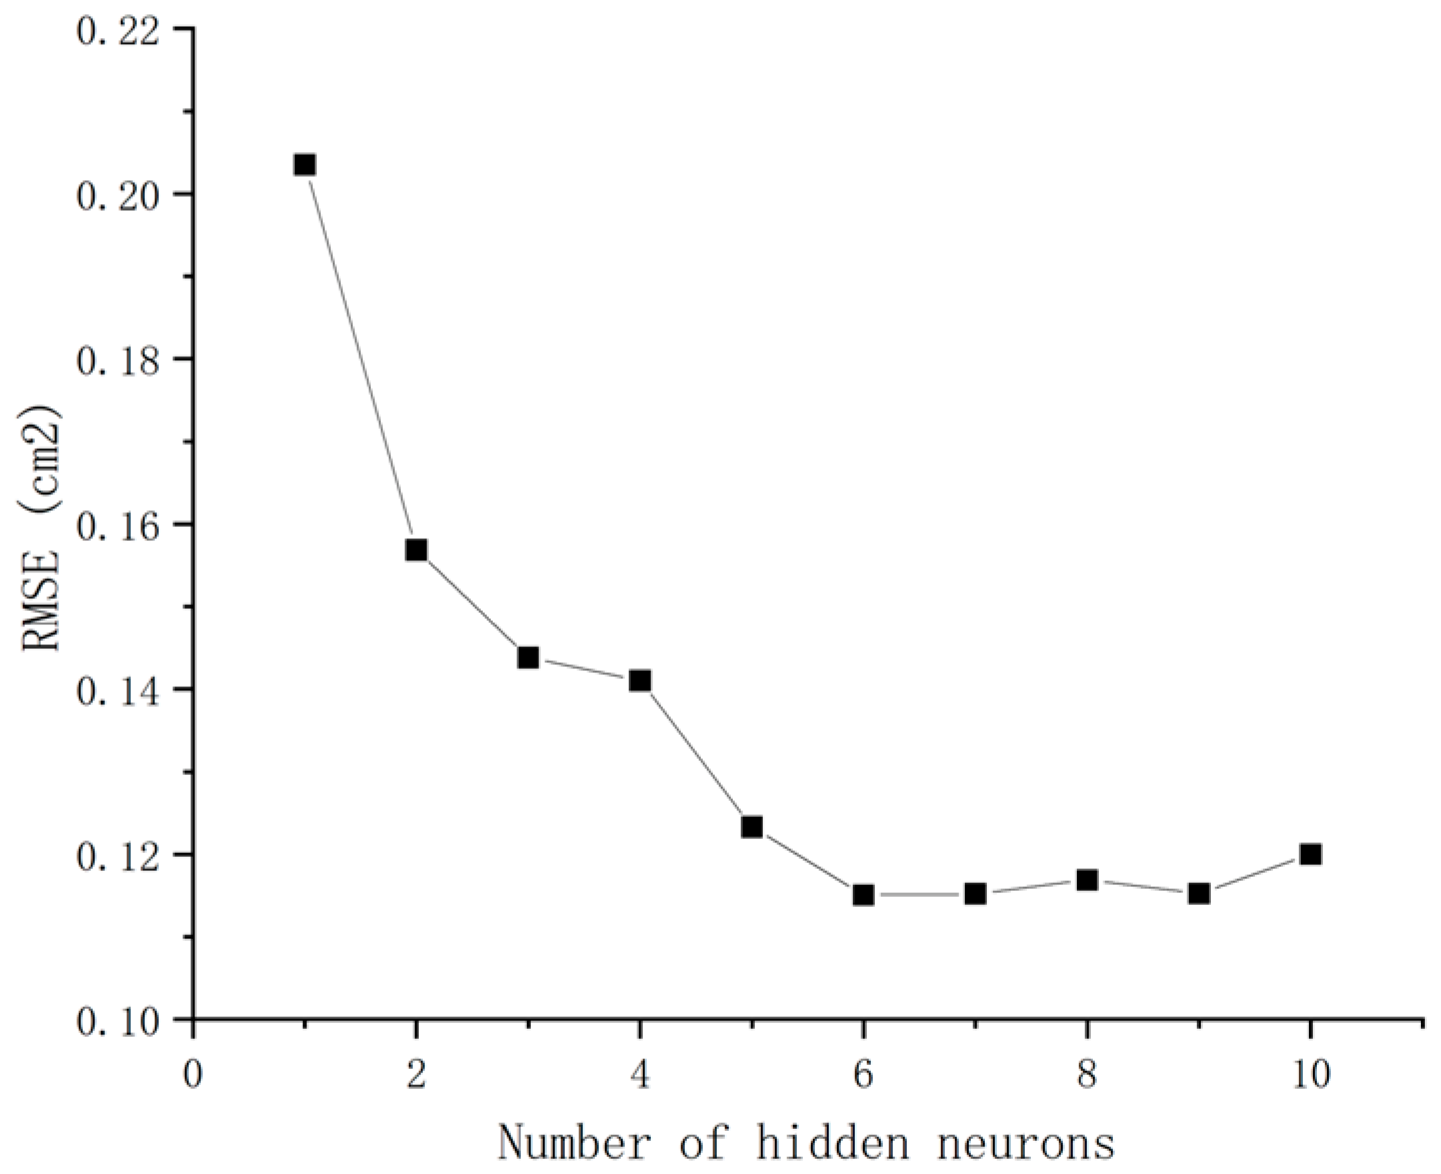
After several experiments and analyses, the number of hidden layers was set to 3 layers. The number of hidden layer neurons was set from 1 to 10 as the test results are shown in Figure 6, and the RMSE value of the model decreased significantly when the number of hidden neurons increased from 1 to 5. The RMSE value of the model was lowest when the number of hidden neurons exceeded 6. As the number of neurons continued to increase, the RMSE value tended to stabilize. Therefore, in the current study, the optimal number of hidden neurons was set to 6 to simplify the model structure.

4.2. Comparison of Modeling Methods

Three regression models based on apple hyperspectral data and apple bruise area were constructed by PLS, SVM, and ANN. Meanwhile, the prediction results of the apple bruise surface area for different feature selection methods were compared. Table 4 shows the prediction results of the apple bruise area based on different feature selection and regression methods. The closer the correlation coefficient R is to 1, the lower the RMSE is, which indicates that the accuracy of the prediction is higher and the correlation between the actual value and the predicted value is greater. From Table 4, it can be seen that the accuracy of ANN and SVM models is better than that of PLS regression models, and the reason for this is that the relationship between the apple bruise area and hyperspectral information may not be a simple linear relationship.
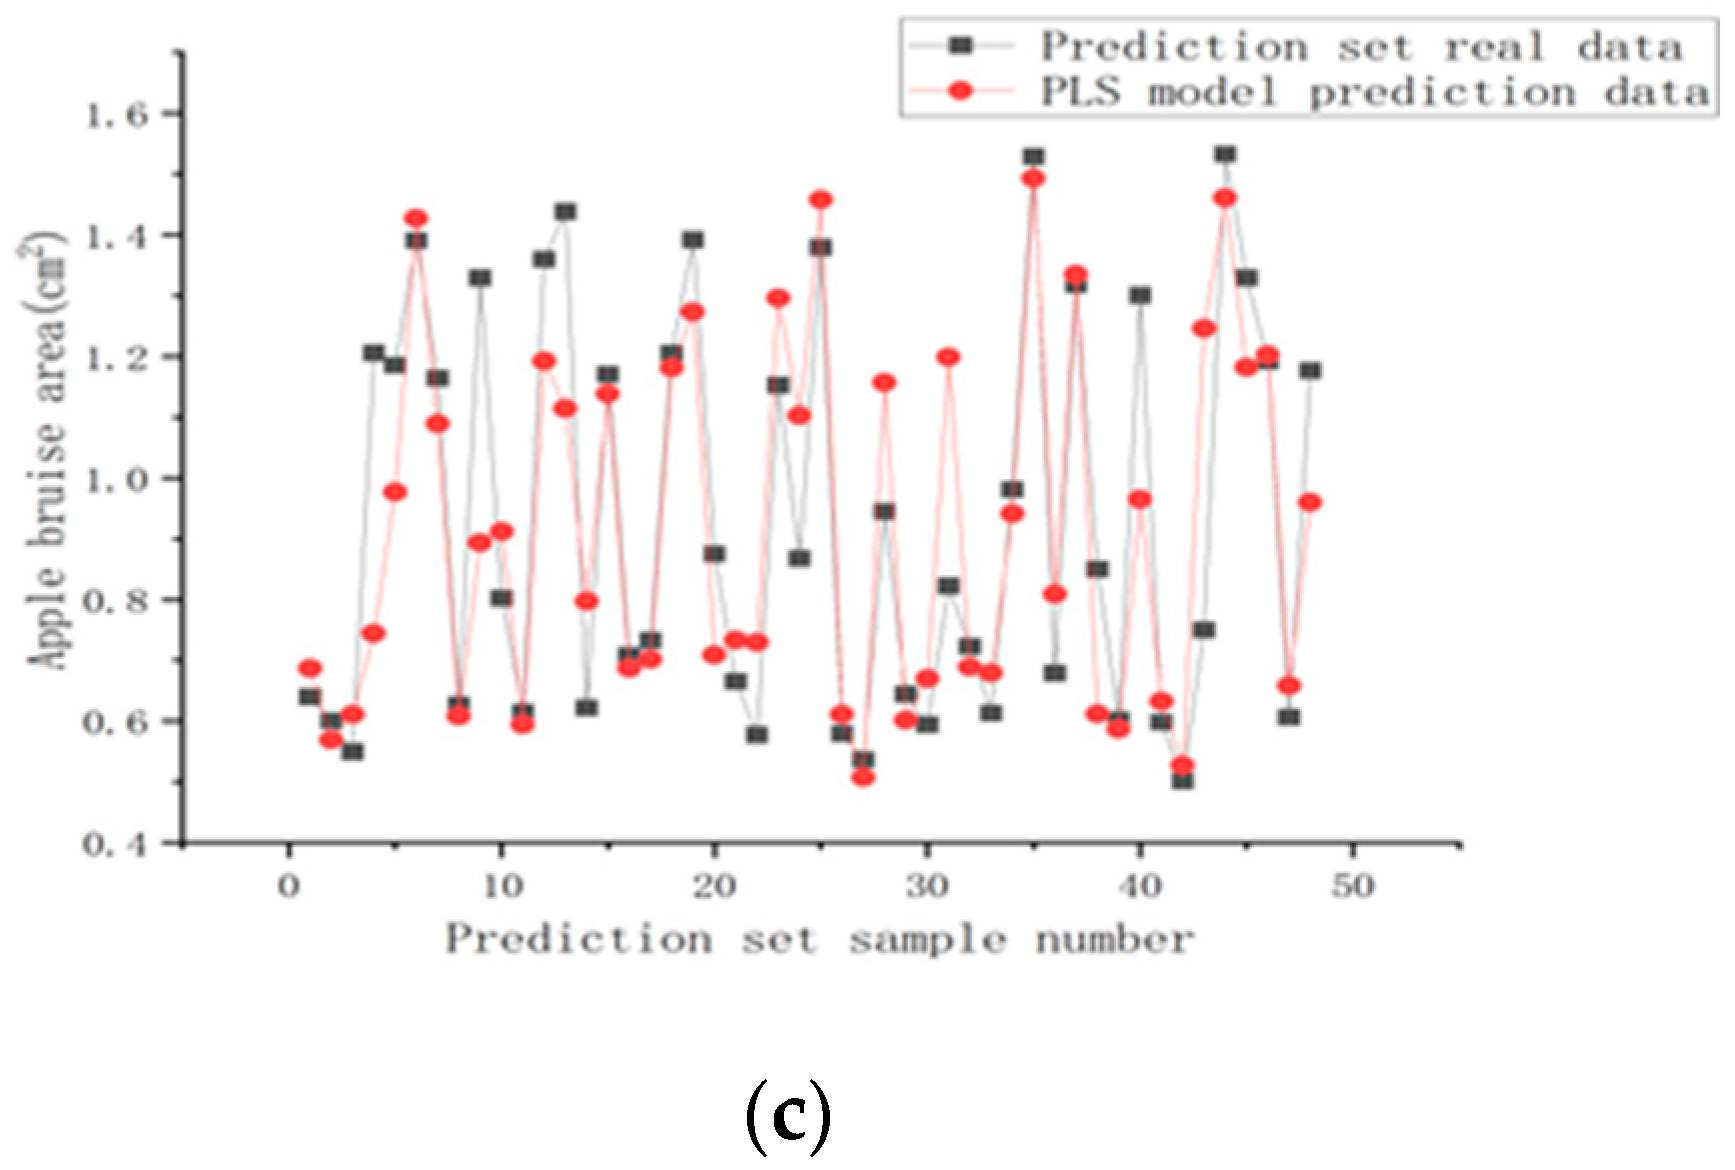
To further investigate the prediction performance of the three methods for CARS-based feature selection, the result plots of PLS, SVM, and ANN models for apple bruise area prediction are shown in Figure 7a–c, respectively. It can be seen from the figure that all three methods can capture the data variation of the apple bruise area, and most of the predicted values of the bruise area do not differ much from the actual values. Some of the predicted values of the CARS-PLS model have large deviations from the actual values, and the model accuracy is relatively low. The CARS-ANN model has the highest trajectory consistency and the smallest deviation from the actual values compared with the other two models. Combined with Table 4, the CARS-ANN model achieves an R-value of 0.8675 and an RMSE value of 0.1150. The model effect is relatively good, but there is still a possibility of optimization.

4.3. Model Optimization

The sparrow search algorithm (SSA) is a swarm intelligence optimization algorithm proposed by Jiankai Xue et al. inspired by the foraging and anti-predatory behaviors of sparrows [31]. The algorithm has the advantages of strong merit-seeking ability and fast convergence speed. The sparrow flocks foraging process is also a kind of finder–follower model with a detection and warning mechanism superimposed. The individual who finds the better food among the sparrows acts as the finder and the other individuals act as the followers, while a certain percentage of individuals in the population is selected for detection and warning, and if danger is found, the food is abandoned and safety comes first.
The steps are as follows:
  • Initialize the sparrow population location and fitness, set the number of producers (PD) = 0.7, the number of sparrows who perceive the danger (SD) = 0.1, the safety value (ST) = 0.6 parameters initial value, start the cycle and derive the current optimal sparrow individual location, and the best fitness value.
  • Foraging behavior, update the finder position according to Equation (4) and update the joiner position according to Equation (5).
X i , j t + 1 = X i , j t exp i a N   if   R 2 < S T X i , j t + Q L   if   R 2 S T
where,
  • Q: random number obeying normal distribution
  • L: unit row vector
  • N: maximum number of iterations
  • a: random number between [0, 1]
  • R2: alarm value
  • ST: safety value
  • X i , j t : the value of the jth dimension of the ith sparrow at iteration t
3.
Anti-predatory behavior, updating the location of the sparrow population according to Equation (6).
X I , j t + 1 = Q exp X worst t X I , j t i 2   if   i > n / 2 X P t + 1 + X I , j t X P t + 1 A + L   otherwise  
where,
  • Xworst: lowest adaptive sparrow location
  • XP: optimal position occupied by the producer
  • t: number of iterations
  • Q: random number obeying normal distribution
  • L: unit row vector
  • A: A row vector containing only 1 and −1 elements at random,
  • A+: AT(AAT)−1
X i , j t + 1 = X best   t + β X i , j t X best   t   if   f i > f b e s t X i , j t + K X i , j t X worst   t f i f w o r s t + ε   if   f i = f b e s t
where,
  • X best t : current global optimal position
  • β: random number that obeys normal distribution
  • K: a random number between [−1,1]
  • fi: individual fitness value
  • fworst: worst fitness values
  • fbest: the current global best values
  • Ɛ: a constant close to 0
4.
Update the historical optimal fitness and repeat steps 2 and 3 and end the loop when the maximum number of iterations is reached. The optimal individual position and fitness values are output. The optimization parameters and threshold process are shown in Figure 8.
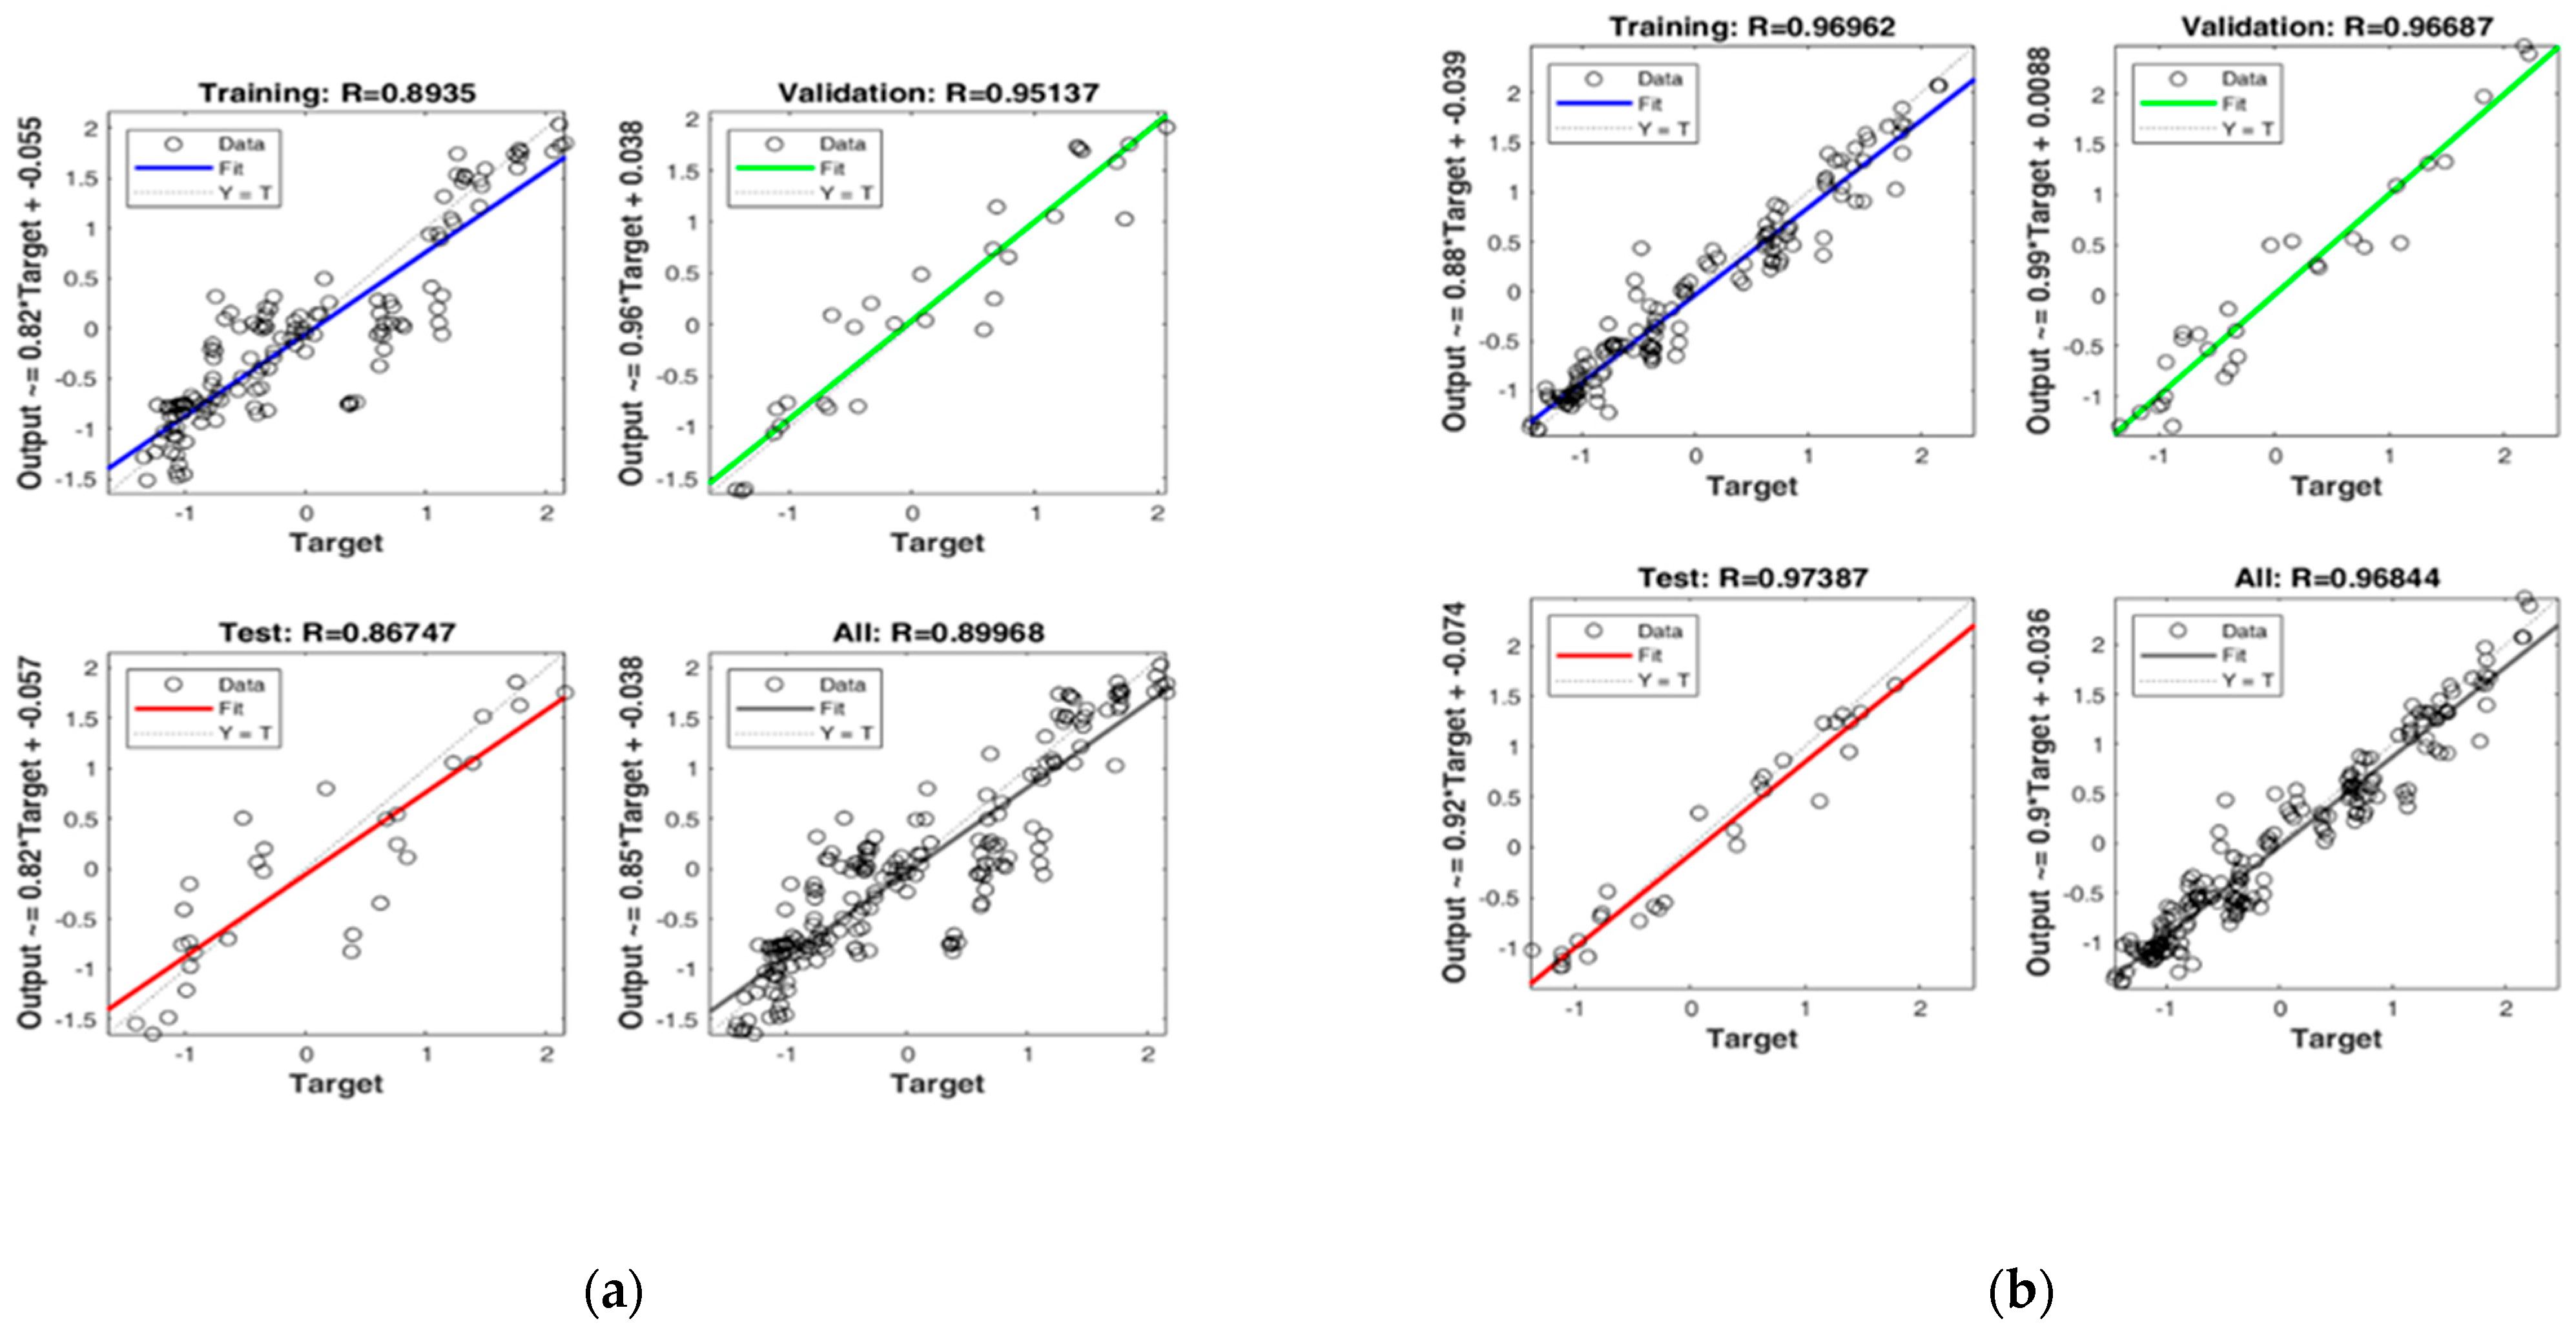
The regression coefficients of the training set, validation set, and prediction set before and after the optimization of the ANN model with SSA are shown in Figure 9. Figure 9a shows the before optimization and Figure 9b shows the regression coefficients after optimization. The results show that the correlation coefficient (R) of the modeling set, prediction set, and validation set all reach above 0.96 after the optimization of ANN model parameters and thresholds by the SSA sparrow search algorithm, and the optimization effect is obvious.

4.4. Construction of the Fitted Surface

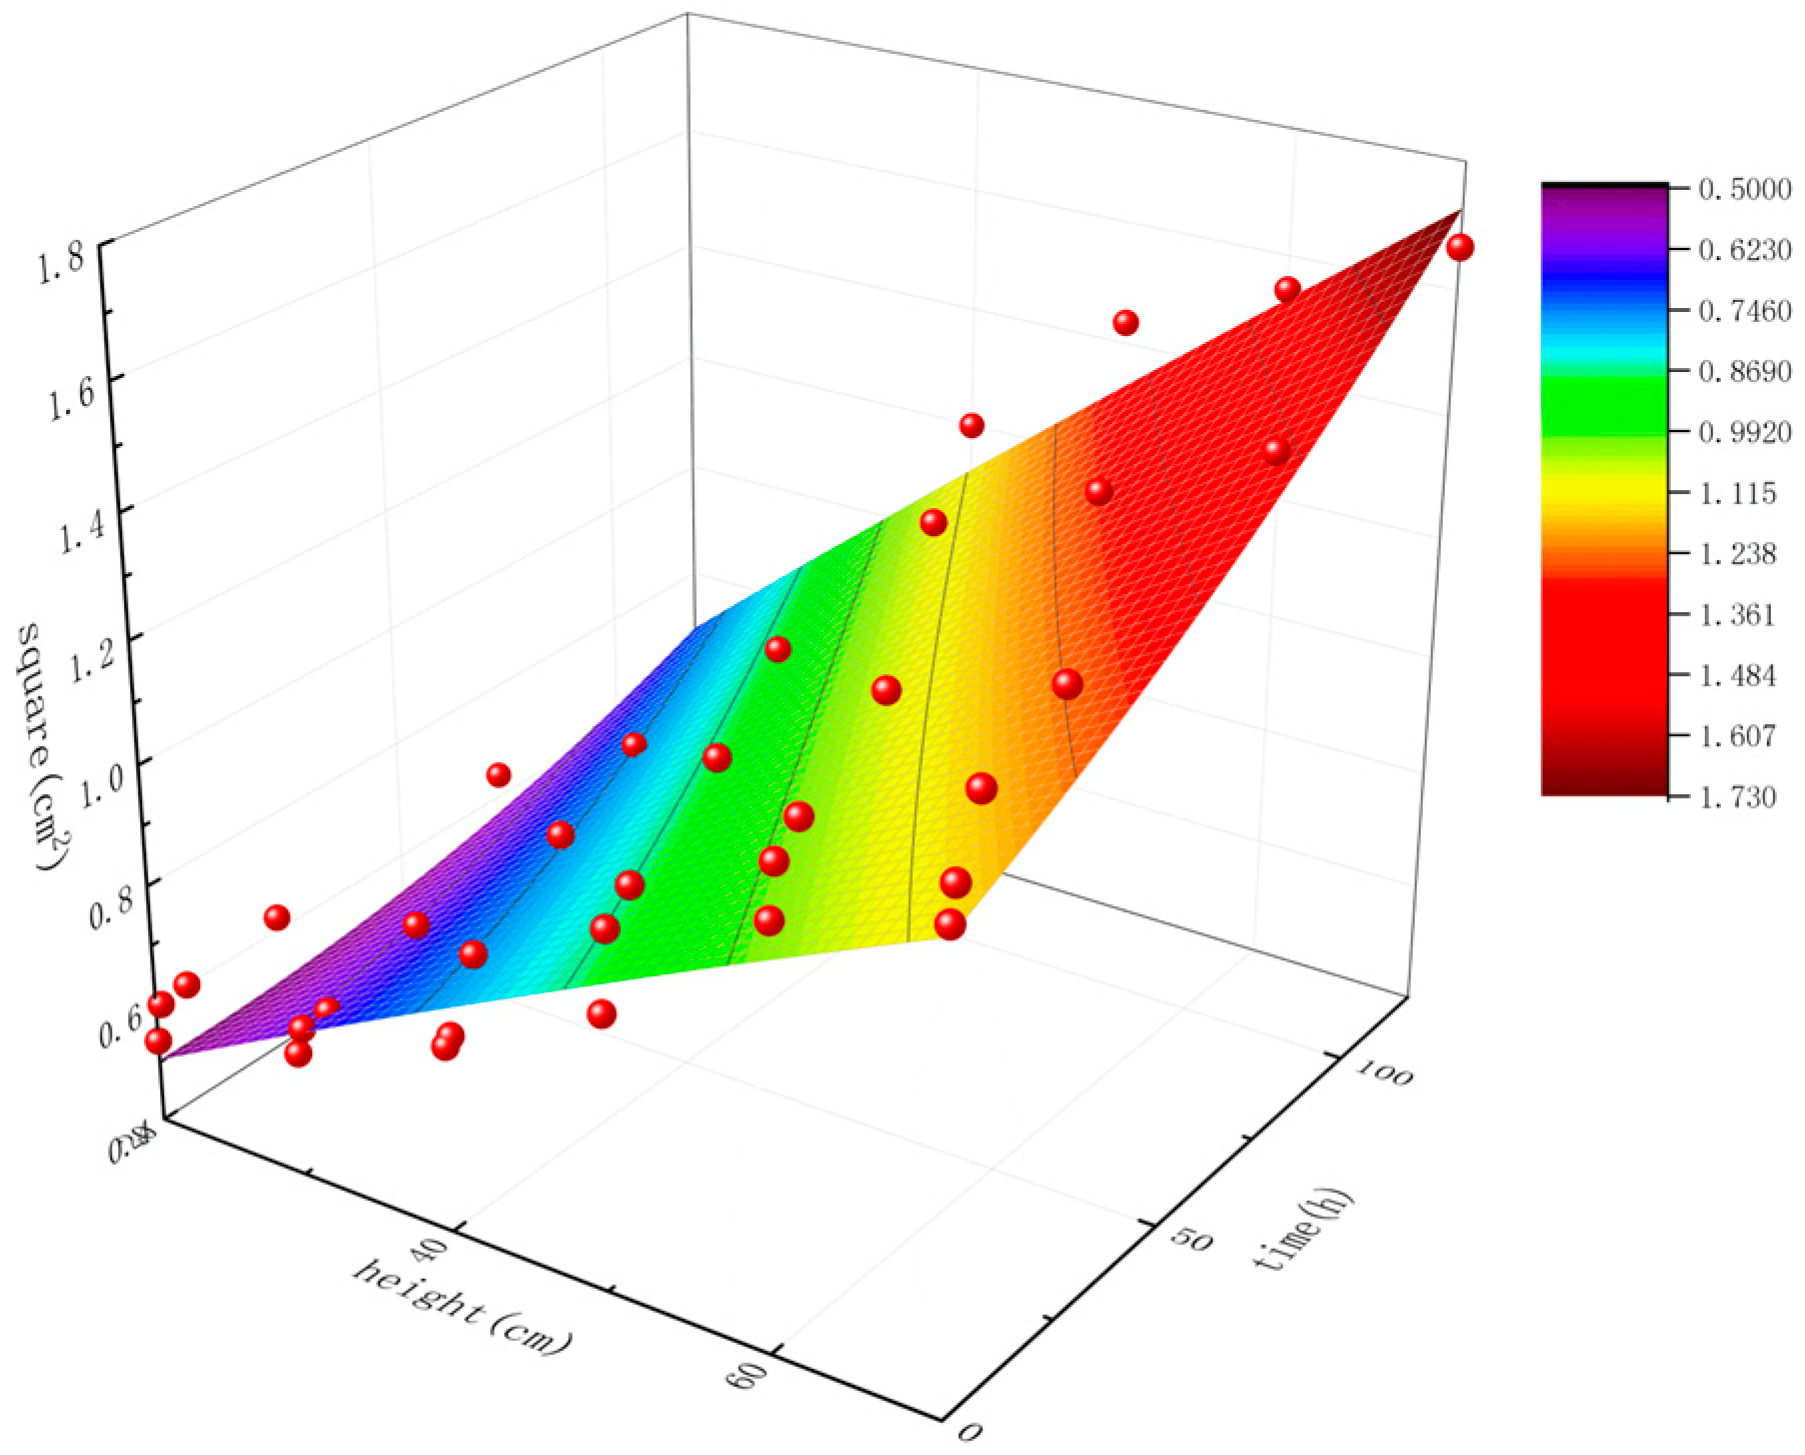
The mean value of the calculated actual apple bruise area was used as the dependent variable, and the damage height h and damage time t were used as the independent variables to establish the fitting surface using a polynomial fitting method, and the equation of the fitting surface is shown in Equation (7).
S = 0.22191 + 0.01449 h 0 . 0136 t 1 . 9363   ×   10 5 h 2 + 1 . 36925   ×   10 5 t 2 + 6 . 58789   ×   10 5 ht
where,
S: bruise area
t: damage time
h: ball drop height.
The fitted surface is shown in Figure 10, and the fitted R2 = 0.97028, residual sum of squares (RSS) = 0.09562, and the residual sum of squares contour plot are shown in Figure 11, which indicates the high degree of surface fitting. The relationship between the actual bruise area, injury time, and the degree of injury was obtained by the construction of the fitted surface.

4.5. Fruit Minor Mechanical Bruise Area Prediction

In this paper, the PLS, ANN, and SVM prediction models were established using the hyperspectral data of the fruit bruise change area, and SSA was used to optimize the models, and the relationship between the spectral information and the apple bruise area was obtained. Moreover, by constructing the fitted surface equations of the actual area, the damage time, and damage degree, the connection between the spectral information, the bruise area, the damage time, and the damage degree were finally obtained. The specific process is shown in Figure 12.

5. Conclusions

In this paper, we collected the spectral information of the apple bruise area by the collision test. A two-by-two combination of three categories of spectral preprocessing was used to process the raw spectral data, and its performance was evaluated by building a full-band ANN model. The results show that the preprocessing method of first-order differential + SG smoothing can make the prediction model more accurate.
CARS, Pearson, and L1 norm were used for wavelength selection, and the PLS, SVM (Gaussian kernel), and ANN training models were compared, respectively, and the results showed that the accuracy of the CARS + ANN model was higher, with RSME of 0.1150 and R2 of 0.8675.
The ANN model was optimized by using SSA, and the optimized model RMSEP reached 0.0743 and the R-value reached 0.9739, which improved the accuracy of the model. The association between spectral information and fruit bruising area was obtained.
The actual bruise area was measured by the collision test, and the resulting data were fitted to the surface to establish the regression surface equations for the fruit damage time and the damage height. The correlation between the spectral information, bruise area, damage time, and damage height was obtained by the prediction model and regression equation establishment. The method is of extended and applied value for rapid nondestructive prediction of fruit injury.

Author Contributions

Conceptualization, Y.Z.; methodology, Y.Z.; software, Y.Z.; validation, Y.Z. and Y.L.; formal analysis, Y.Z.; investigation, Y.Z.; resources, Y.S.; data curation, Y.L.; writing—original draft preparation, Y.Z.; writing—review and editing, Y.Z.; visualization, Y.Z.; supervision, A.G. and X.H.; project administration, S.J.; funding acquisition, Y.S. All authors have read and agreed to the published version of the manuscript.

Funding

We would like to acknowledge the financial support from the National Key Research and Development Plan of China for Intelligent Agricultural Machinery Equipment (2018YFD0700604, 2016YFD0701701), the Shandong Natural Science Foundation (ZR2019MEE092), the Innovation Team Fund for Fruit Industry of Modern Agricultural Technology System in Shandong Province (SDAIT-06-12), and the Shandong Agricultural University “Double First-class” Award and Subsidy Funds (SYL2017XTTD07).

Conflicts of Interest

The authors declare no conflict of interest.

Abbreviations

The following abbreviations are used in this manuscript:
iVISSAinterval variable iterative space shrinkage approach
SPXYSamples set partitioning based on joint X-Y distances
PLS-DApartial least squares discriminant analysis
PCAprincipal component analysis
RSSResidual Sum of Squares
MSCmultiplicative scatter correction
SNVstandard normal variate transformation
SGSavitzky–Golay
GSGaussian Smoothing
CARSCompetitive adaptive reweighted sampling
PLSpartial least squares
ANNArtificial Neural Network
SVMsupport vector machine
RMSERoot Mean Squared Error
SSAsparrow search algorithm

References

  1. Song, W.; Jiang, N.; Wang, H.; Guo, G. Evaluation of machine learning methods for organic apple authentication based on diffraction grating and image processing. J. Food Compos. Anal. 2020, 88, 103437. [Google Scholar] [CrossRef]
  2. Wang, J.; Sun, L.; Feng, G.; Bai, H.; Yang, J.; Gai, Z.; Zhao, Z.; Zhang, G. Intelligent detection of hard seeds of snap bean based on hyperspectral imaging. Spectrochim. Acta A Mol. Biomol. Spectrosc. 2022, 275, 121169. [Google Scholar] [CrossRef] [PubMed]
  3. Pan, X.; Sun, L.; Li, Y.; Che, W.; Ji, Y.; Li, J.; Li, J.; Xie, X.; Xu, Y. Non-destructive classification of apple bruising time based on visible and near-infrared hyperspectral imaging. J. Sci. Food Agric. 2019, 99, 1709–1718. [Google Scholar] [CrossRef] [PubMed]
  4. Zhiming, G.; Wenqian, H.; Liping, C.; Yankun, P.; Xiu, W. Shortwave infrared hyperspectral imaging for detection of pH value in Fuji apple. Int. J. Agric. Biol. Eng. 2014, 7, 130–137. [Google Scholar] [CrossRef]
  5. Fan, S.; Li, C.; Huang, W.; Chen, L. Detection of blueberry internal bruising over time using NIR hyperspectral reflectance imaging with optimum wavelengths. Postharvest Biol. Technol. 2017, 134, 55–66. [Google Scholar] [CrossRef]
  6. Che, W.; Sun, L.; Zhang, Q.; Tan, W.; Ye, D.; Zhang, D.; Liu, Y. Pixel based bruise region extraction of apple using Vis-NIR hyperspectral imaging. Comput. Electron. Agric. 2018, 146, 12–21. [Google Scholar] [CrossRef]
  7. Wu, L.; He, J.; Liu, G.; Wang, S.; He, X. Detection of common defects on jujube using Vis-NIR and NIR hyperspectral imaging. Postharvest Biol. Technol. 2016, 112, 134–142. [Google Scholar] [CrossRef]
  8. Tian, X.; Wang, Q.; Huang, W.; Fan, S.; Li, J. Online detection of apples with moldy core using the Vis/NIR full-transmittance spectra. Postharvest Biol. Technol. 2020, 168, 111269. [Google Scholar] [CrossRef]
  9. Qin, J.; Lu, R. Detection of pits in tart cherries by hyperspectral transmission imaging. Trans. ASAE 2005, 48, 1963–1970. [Google Scholar] [CrossRef]
  10. Zhang, X.; Sun, J.; Li, P.; Zeng, F.; Wang, H. Hyperspectral detection of salted sea cucumber adulteration using different spectral preprocessing techniques and SVM method. LWT 2021, 152, 112295. [Google Scholar] [CrossRef]
  11. Zhang, M.; Li, G. Visual detection of apple bruises using AdaBoost algorithm and hyperspectral imaging. Int. J. Food Prop. 2018, 21, 1598–1607. [Google Scholar] [CrossRef] [Green Version]
  12. Yuan, R.; Guo, M.; Li, C.; Chen, S.; Liu, G.; He, J.; Wan, G.; Fan, N. Detection of early bruises in jujubes based on reflectance, absorbance and Kubelka-Munk spectral data. Postharvest Biol. Technol. 2022, 185, 111810. [Google Scholar] [CrossRef]
  13. Xing, J.; De Baerdemaeker, J. Bruise detection on ‘Jonagold’ apples using hyperspectral imaging. Postharvest Biol. Technol. 2005, 37, 152–162. [Google Scholar] [CrossRef]
  14. Wang, J.; Chang, C.-I. Independent component analysis-based dimensionality reduction with applications in hyperspectral image analysis. IEEE Trans. Geosci. Remote Sens. 2006, 44, 1586–1600. [Google Scholar] [CrossRef]
  15. Wenyi, T.; Laijun, S.; Fei, Y.; Wenkai, C.; Dandan, Y.; Dan, Z.; Borui, Z. The feasibility of early detection and grading of apple bruises using hyperspectral. J. Chemom. 2018, 32, e3067. [Google Scholar] [CrossRef]
  16. Wang, Z.; Tian, S. Ground object information extraction from hyperspectral remote sensing images using deep learning algorithm. Microprocess. Microsyst. 2021, 87, 104394. [Google Scholar] [CrossRef]
  17. Lee, W.-H.; Kim, M.S.; Lee, H.; Delwiche, S.R.; Bae, H.; Kim, D.-Y.; Cho, B.-K. Hyperspectral near-infrared imaging for the detection of physical damages of pear. J. Food Eng. 2014, 130, 1–7. [Google Scholar] [CrossRef]
  18. Tian, X.; Li, J.; Wang, Q.; Fan, S.; Huang, W.; Zhao, C. A multi-region combined model for non-destructive prediction of soluble solids content in apple, based on brightness grade segmentation of hyperspectral imaging. Biosyst. Eng. 2019, 183, 110–120. [Google Scholar] [CrossRef]
  19. Bai, Y.; Xiong, Y.; Huang, J.; Zhou, J.; Zhang, B. Accurate prediction of soluble solid content of apples from multiple geographical regions by combining deep learning with spectral fingerprint features. Postharvest Biol. Technol. 2019, 156, 110943. [Google Scholar] [CrossRef]
  20. Baranowski, P.; Mazurek, W.; Pastuszka-Woźniak, J. Supervised classification of bruised apples with respect to the time after bruising on the basis of hyperspectral imaging data. Postharvest Biol. Technol. 2013, 86, 249–258. [Google Scholar] [CrossRef]
  21. Huang, Y.; Lu, R.; Chen, K. Detection of internal defect of apples by a multichannel Vis/NIR spectroscopic system. Postharvest Biol. Technol. 2020, 161, 111065. [Google Scholar] [CrossRef]
  22. Qin, J.; Burks, T.F.; Kim, M.S.; Chao, K.; Ritenour, M.A. Citrus canker detection using hyperspectral reflectance imaging and PCA-based image classification method. Sens. Instrum. Food Qual. Saf. 2008, 2, 168–177. [Google Scholar] [CrossRef]
  23. Zhao, J.; Ouyang, Q.; Chen, Q.; Wang, J. Detection of bruise on pear by hyperspectral imaging sensor with different classification algorithms. Sens. Lett. 2010, 8, 570–576. [Google Scholar] [CrossRef]
  24. Rivera, N.V.; Gómez-Sanchis, J.; Chanona-Pérez, J.; Carrasco, J.J.; Millán-Giraldo, M.; Lorente, D.; Cubero, S.; Blasco, J. Early detection of mechanical damage in mango using NIR hyperspectral images and machine learning. Biosyst. Eng. 2014, 122, 91–98. [Google Scholar] [CrossRef]
  25. Zhang, B.; Huang, W.; Li, J.; Zhao, C.; Liu, C.; Huang, D.; Gong, L. Detection of Slight Bruises on Apples Based on Hyperspectral Imaging and MNF Transform. Spectrosc. Spectr. Anal. 2014, 34, 6. [Google Scholar] [CrossRef]
  26. Sun, Y.; Pessane, I.; Pan, L.; Wang, X. Hyperspectral characteristics of bruised tomatoes as affected by drop height and fruit size. LWT 2021, 141, 110863. [Google Scholar] [CrossRef]
  27. Zhang, Z.; Liu, Y.; Liu, L.; Pan, Y.; Fu, Y.; Li, H.; Li, C. Estimation of apple firmness using hyperspectral spectral indices. Spectrosc. Lett. 2022, 55, 146–156. [Google Scholar] [CrossRef]
  28. Jiang, H.; Hu, Y.; Jiang, X.; Zhou, H. Maturity Stage Discrimination of Camellia oleifera fruit using visible and near-infrared hyperspectral imaging. Molecules 2022, 27, 6318. [Google Scholar] [CrossRef]
  29. Tan, W.; Sun, L.; Yang, F.; Che, W.; Ye, D.; Zhang, D.; Zou, B. Study on bruising degree classification of apples using hyperspectral imaging and GS-SVM. Optik 2018, 154, 581–592. [Google Scholar] [CrossRef]
  30. Xu, A.; Li, R.; Chang, H.; Xu, Y.; Li, X.; Lin, G.; Zhao, Y. Artificial neural network (ANN) modeling for the prediction of odor emission rates from landfill working surface. Waste Manag. 2022, 138, 158–171. [Google Scholar] [CrossRef]
  31. Xue, J.; Shen, B. A novel swarm intelligence optimization approach: Sparrow search algorithm. Syst. Sci. Control Eng. 2020, 8, 22–34. [Google Scholar] [CrossRef]
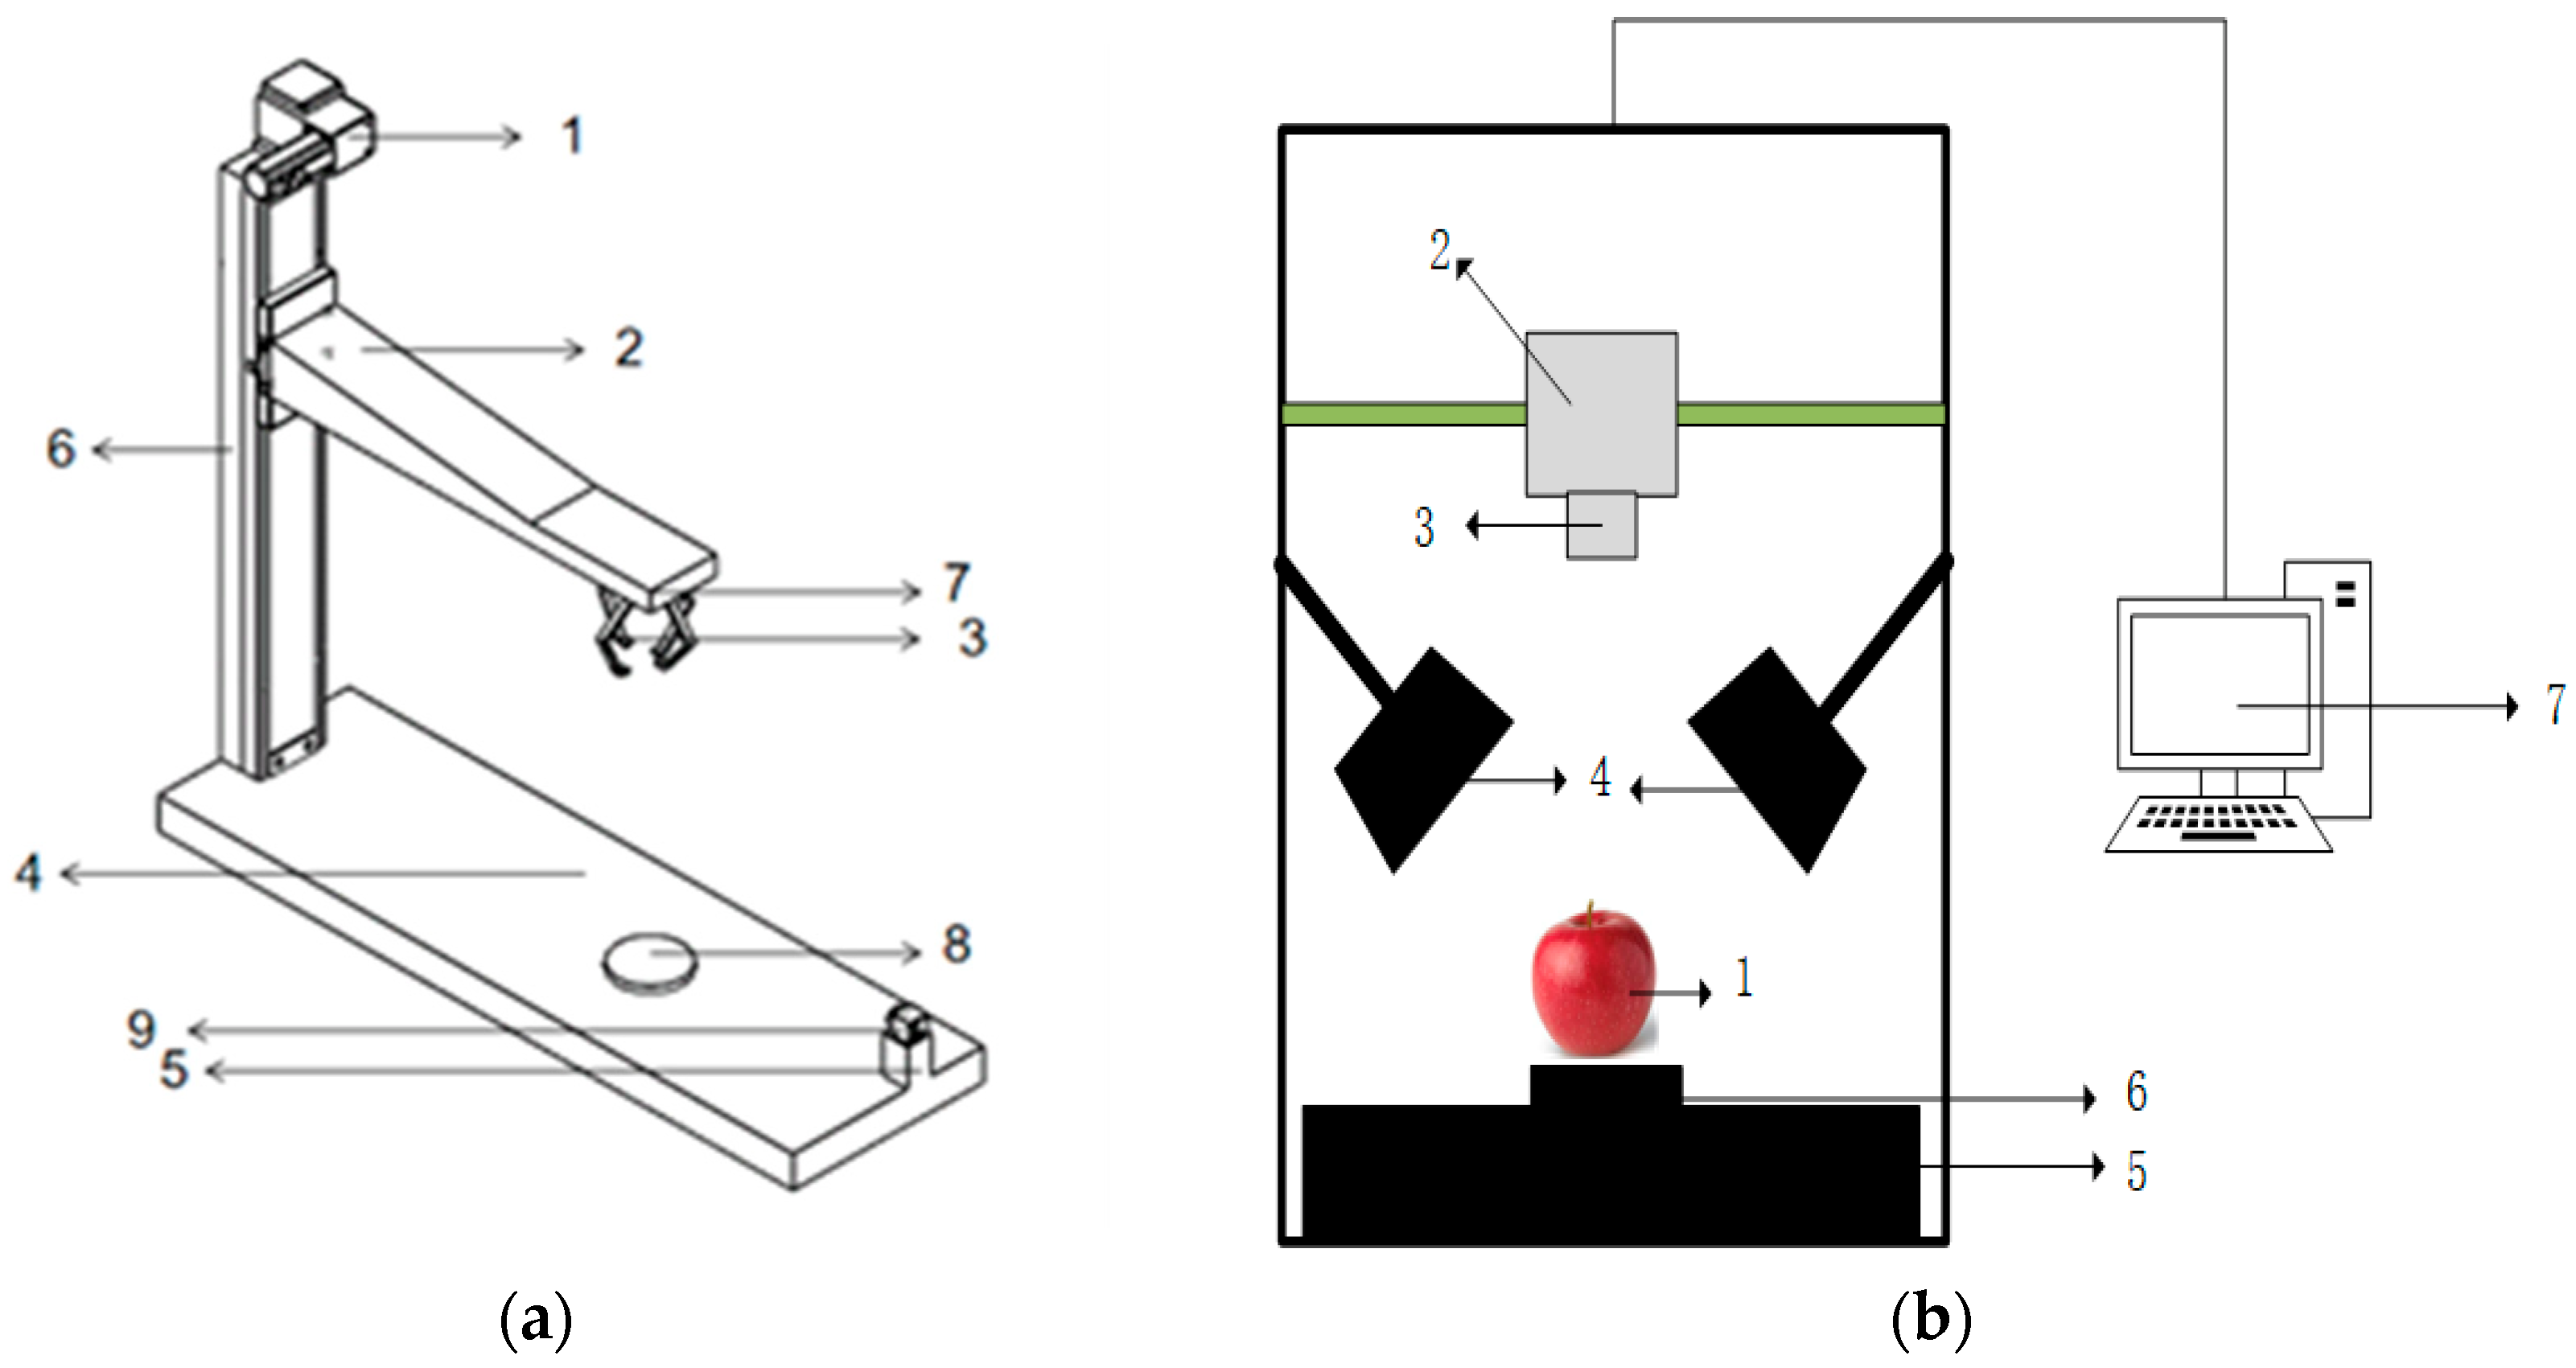
Figure 1. Fruit damage test bench and hyperspectral imaging system (a) fruit damage test bench 1. motor; 2. slider linkage mechanism; 3. robot; 4. Base; 5. camera placing table; 6. scale; 7. Solenoid; 8. fruit placing table; 9. high-speed camera; (b) hyperspectral imaging system. 1. apple; 2. camera; 3. lens; 4. light source; 5. shelf; 6. tray; 7. upper computer.
Agriculture 13 00819 g001
Figure 2. Bruise area extraction.
Agriculture 13 00819 g002
Figure 3. Spectral curves of all apple samples.
Agriculture 13 00819 g003
Figure 4. Savitzky–Golay + first-order difference preprocessing diagram.
Agriculture 13 00819 g004
Figure 5. The effective wavelength selected by competitive adaptive reweighted sampling.
Agriculture 13 00819 g005
Figure 6. Hidden layer parameter optimization.
Agriculture 13 00819 g006
Figure 7. Apple bruise area regression results (a) the result plots of ANN model for apple bruise area prediction; (b) the result plots of SVM model for apple bruise area prediction; (c) the result plots of PLS model for apple bruise area prediction.
Agriculture 13 00819 g007aAgriculture 13 00819 g007b
Figure 8. The sparrow search algorithm optimization ANN flow chart.
Agriculture 13 00819 g008
Figure 9. Regression coefficients before and after ANN optimization (a) Regression coefficients before ANN optimization; (b) Regression coefficients after ANN optimization.
Agriculture 13 00819 g009
Figure 10. Fitted surface plot of apple bruise area.
Agriculture 13 00819 g010
Figure 11. Residual contour map.
Agriculture 13 00819 g011
Figure 12. Flow chart of fruit bruise area prediction.
Agriculture 13 00819 g012
Table 1. Area of apple bruises.
Sample SetNumber of SamplesMaximum Value/cm2Minimum Value/cm2Mean Value/cm2Standard Deviation/cm2
training set961.66720.50660.95990.3270
validation set481.66220.51160.95470.3304
text set481.65090.52030.97740.3245
Table 2. Full-wavelength ANN prediction models for different pretreatment methods.
Pre-Processing MethodValidation SetText Set
RRMSERRMSE
RAW0.80150.25540.91010.2754
First-order differential +MSC0.85540.27560.85310.2883
First-order differential +SNV0.87750.20040.84660.2210
First-order differential +SG0.90280.20050.90140.2045
First-order differential +GS0.84670.23200.83990.2487
Second difference +MSC0.80510.26940.80020.2808
Second difference +SNV0.83240.24060.82870.2536
Second difference +SG0.82140.26110.81570.2628
Second difference +GS0.85250.23590.84530.2498
MSC + SG0.83730.25250.83410.2547
MSC + GS0.71450.51040.71160.5112
SNV + SG0.84640.24990.83380.2501
SNV + GS0.72820.39790.72450.5025
Table 3. Activation function optimization.
Combination of Hidden Layer Output Layer Activation FunctionsRMSE
logsig/logsig0.12074
logsig/tanh0.11503
logsig/sigmoid0.14382
tanh/logsig0.11964
tanh/tanh0.12105
tanh/sigmoid0.14977
Table 4. Comparison of different models for predictive modeling of apple bruise area.
CARSL1 NormPearson
RRMSERRMSERRMSE
ANN0.86750.11500.84100.11990.84890.1555
SVM0.85470.12060.85330.12380.85240.1220
PLS0.74010.21770.81440.16250.80140.1437
Disclaimer/Publisher’s Note: The statements, opinions and data contained in all publications are solely those of the individual author(s) and contributor(s) and not of MDPI and/or the editor(s). MDPI and/or the editor(s) disclaim responsibility for any injury to people or property resulting from any ideas, methods, instructions or products referred to in the content.