
Factors Influencing the Spatial Distribution of Regulating Agro-Ecosystem Services in Agriculture Soils: A Case Study of Slovakia


Abstract
:1. Introduction
2. Materials and Methods
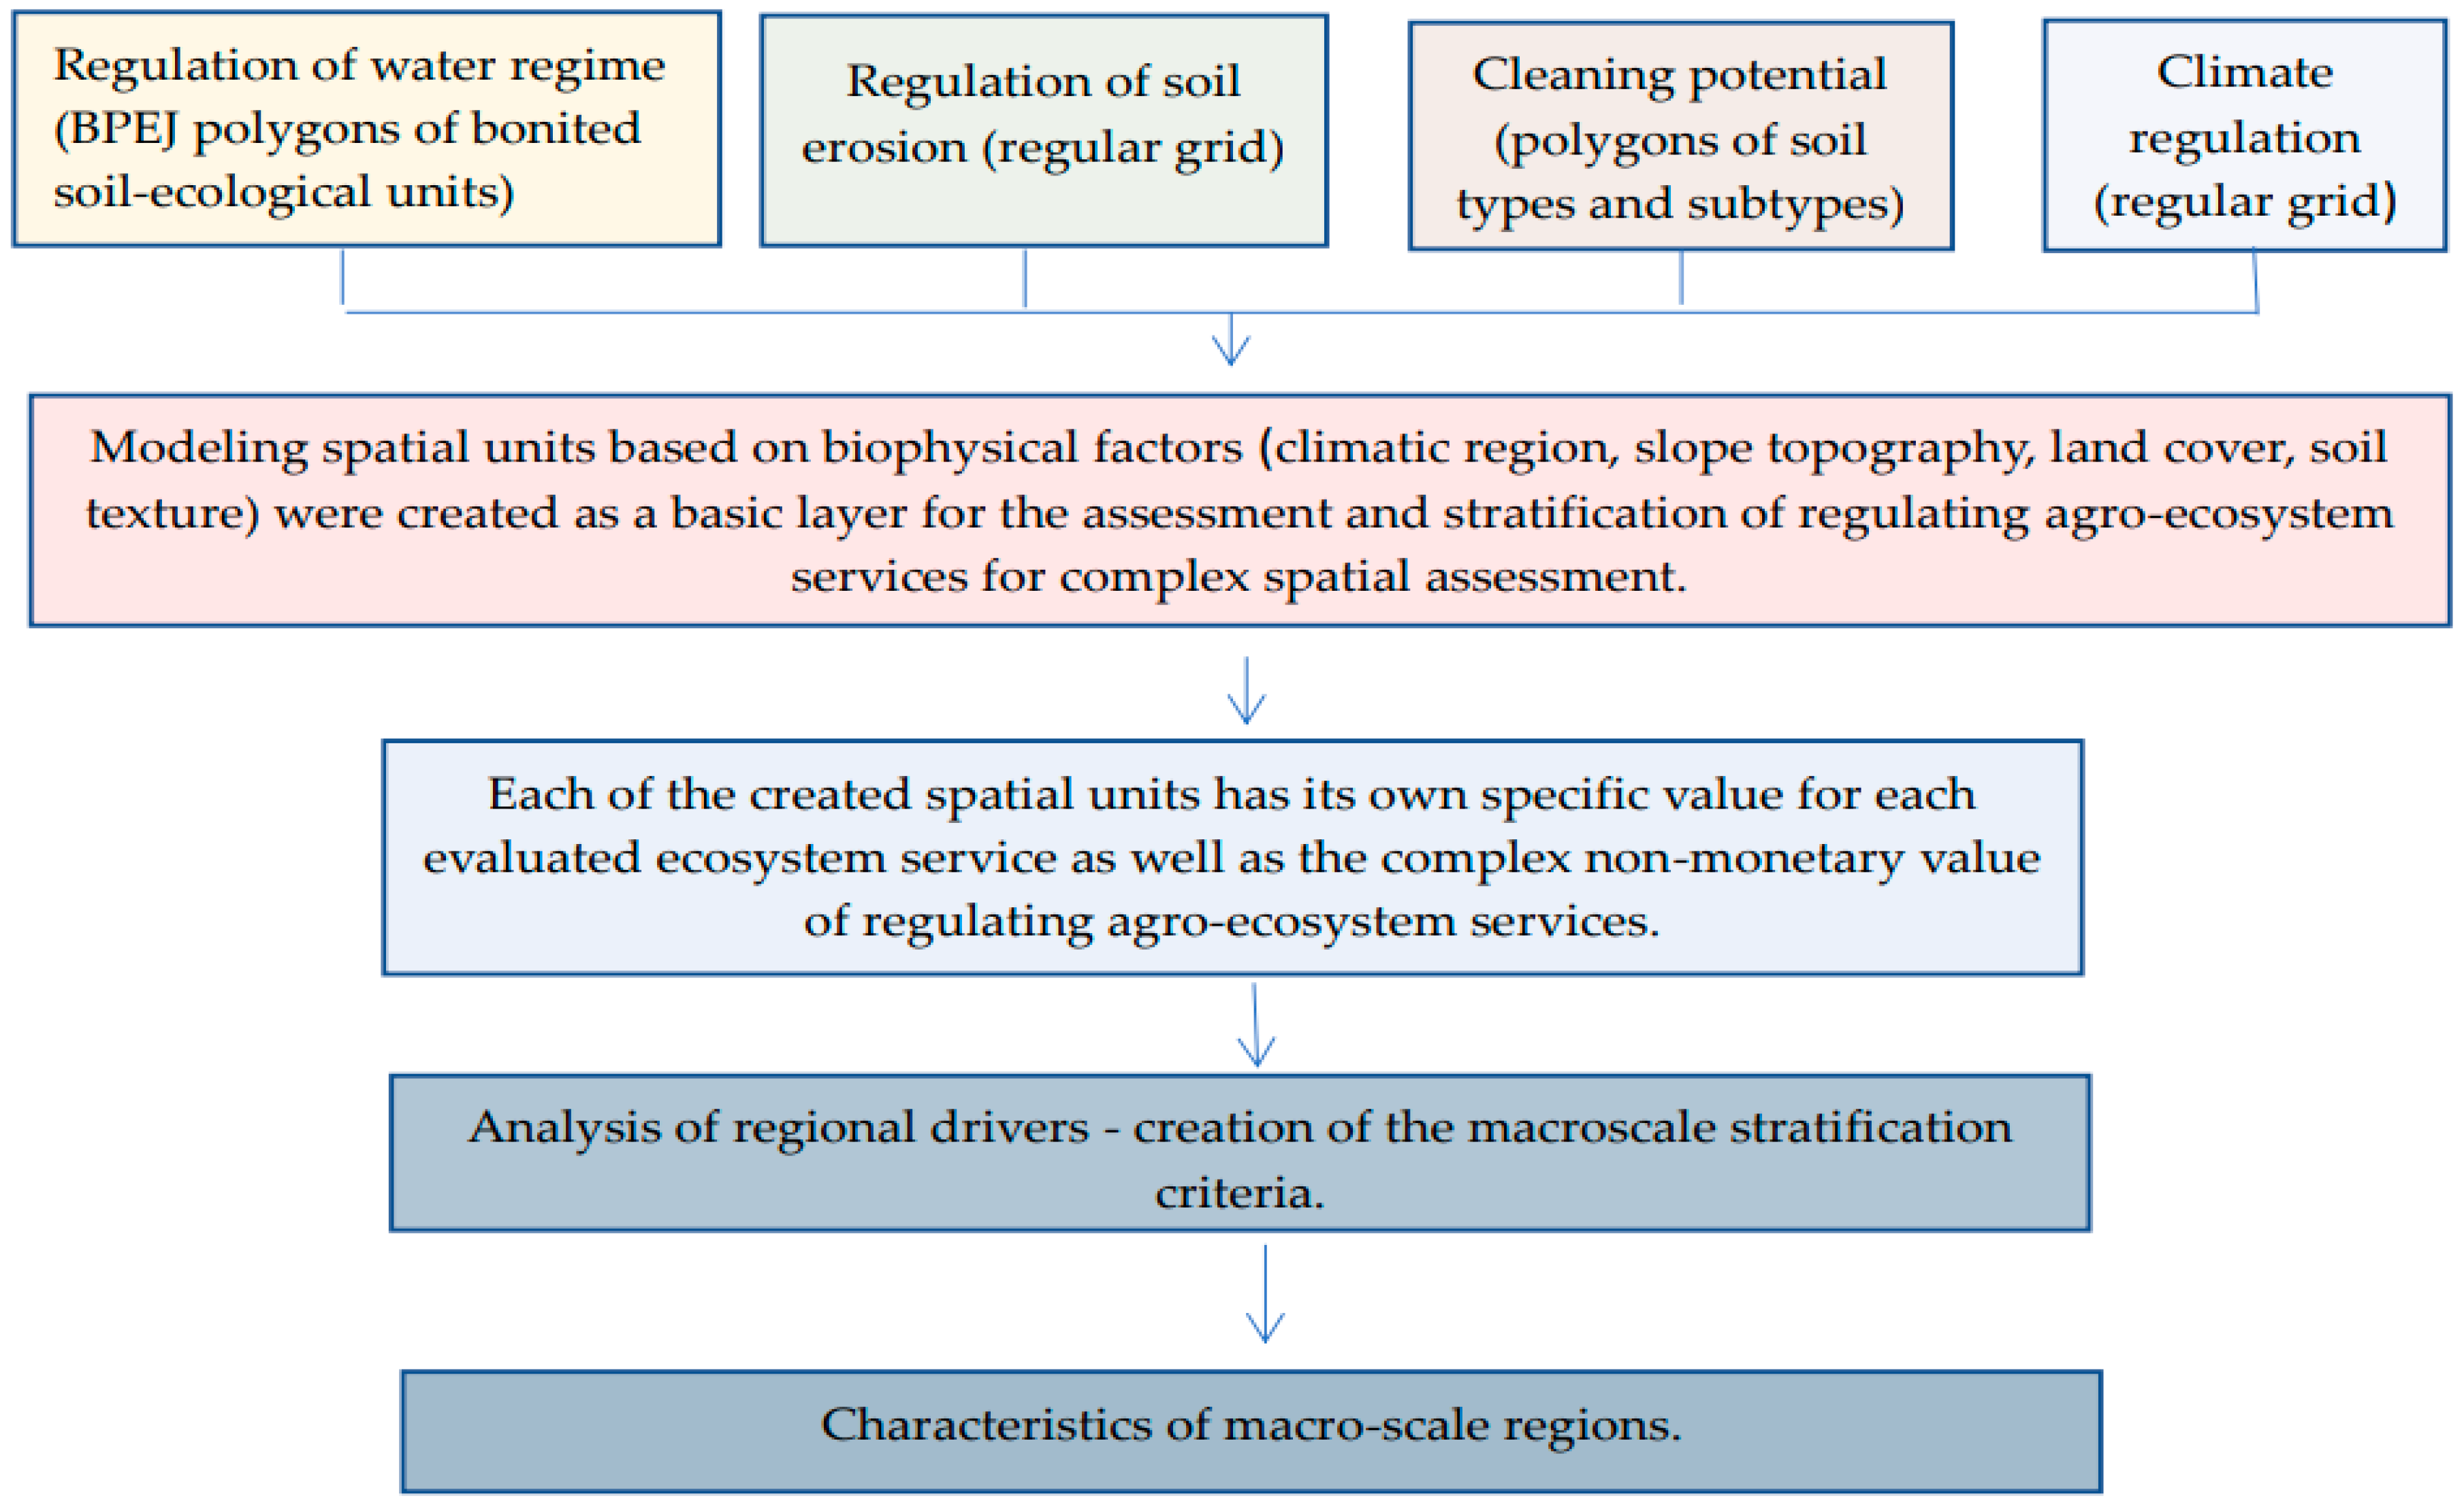
2.1. The Theoretical and Methodological Baselines of the Agro-Ecosystem Services Assessment
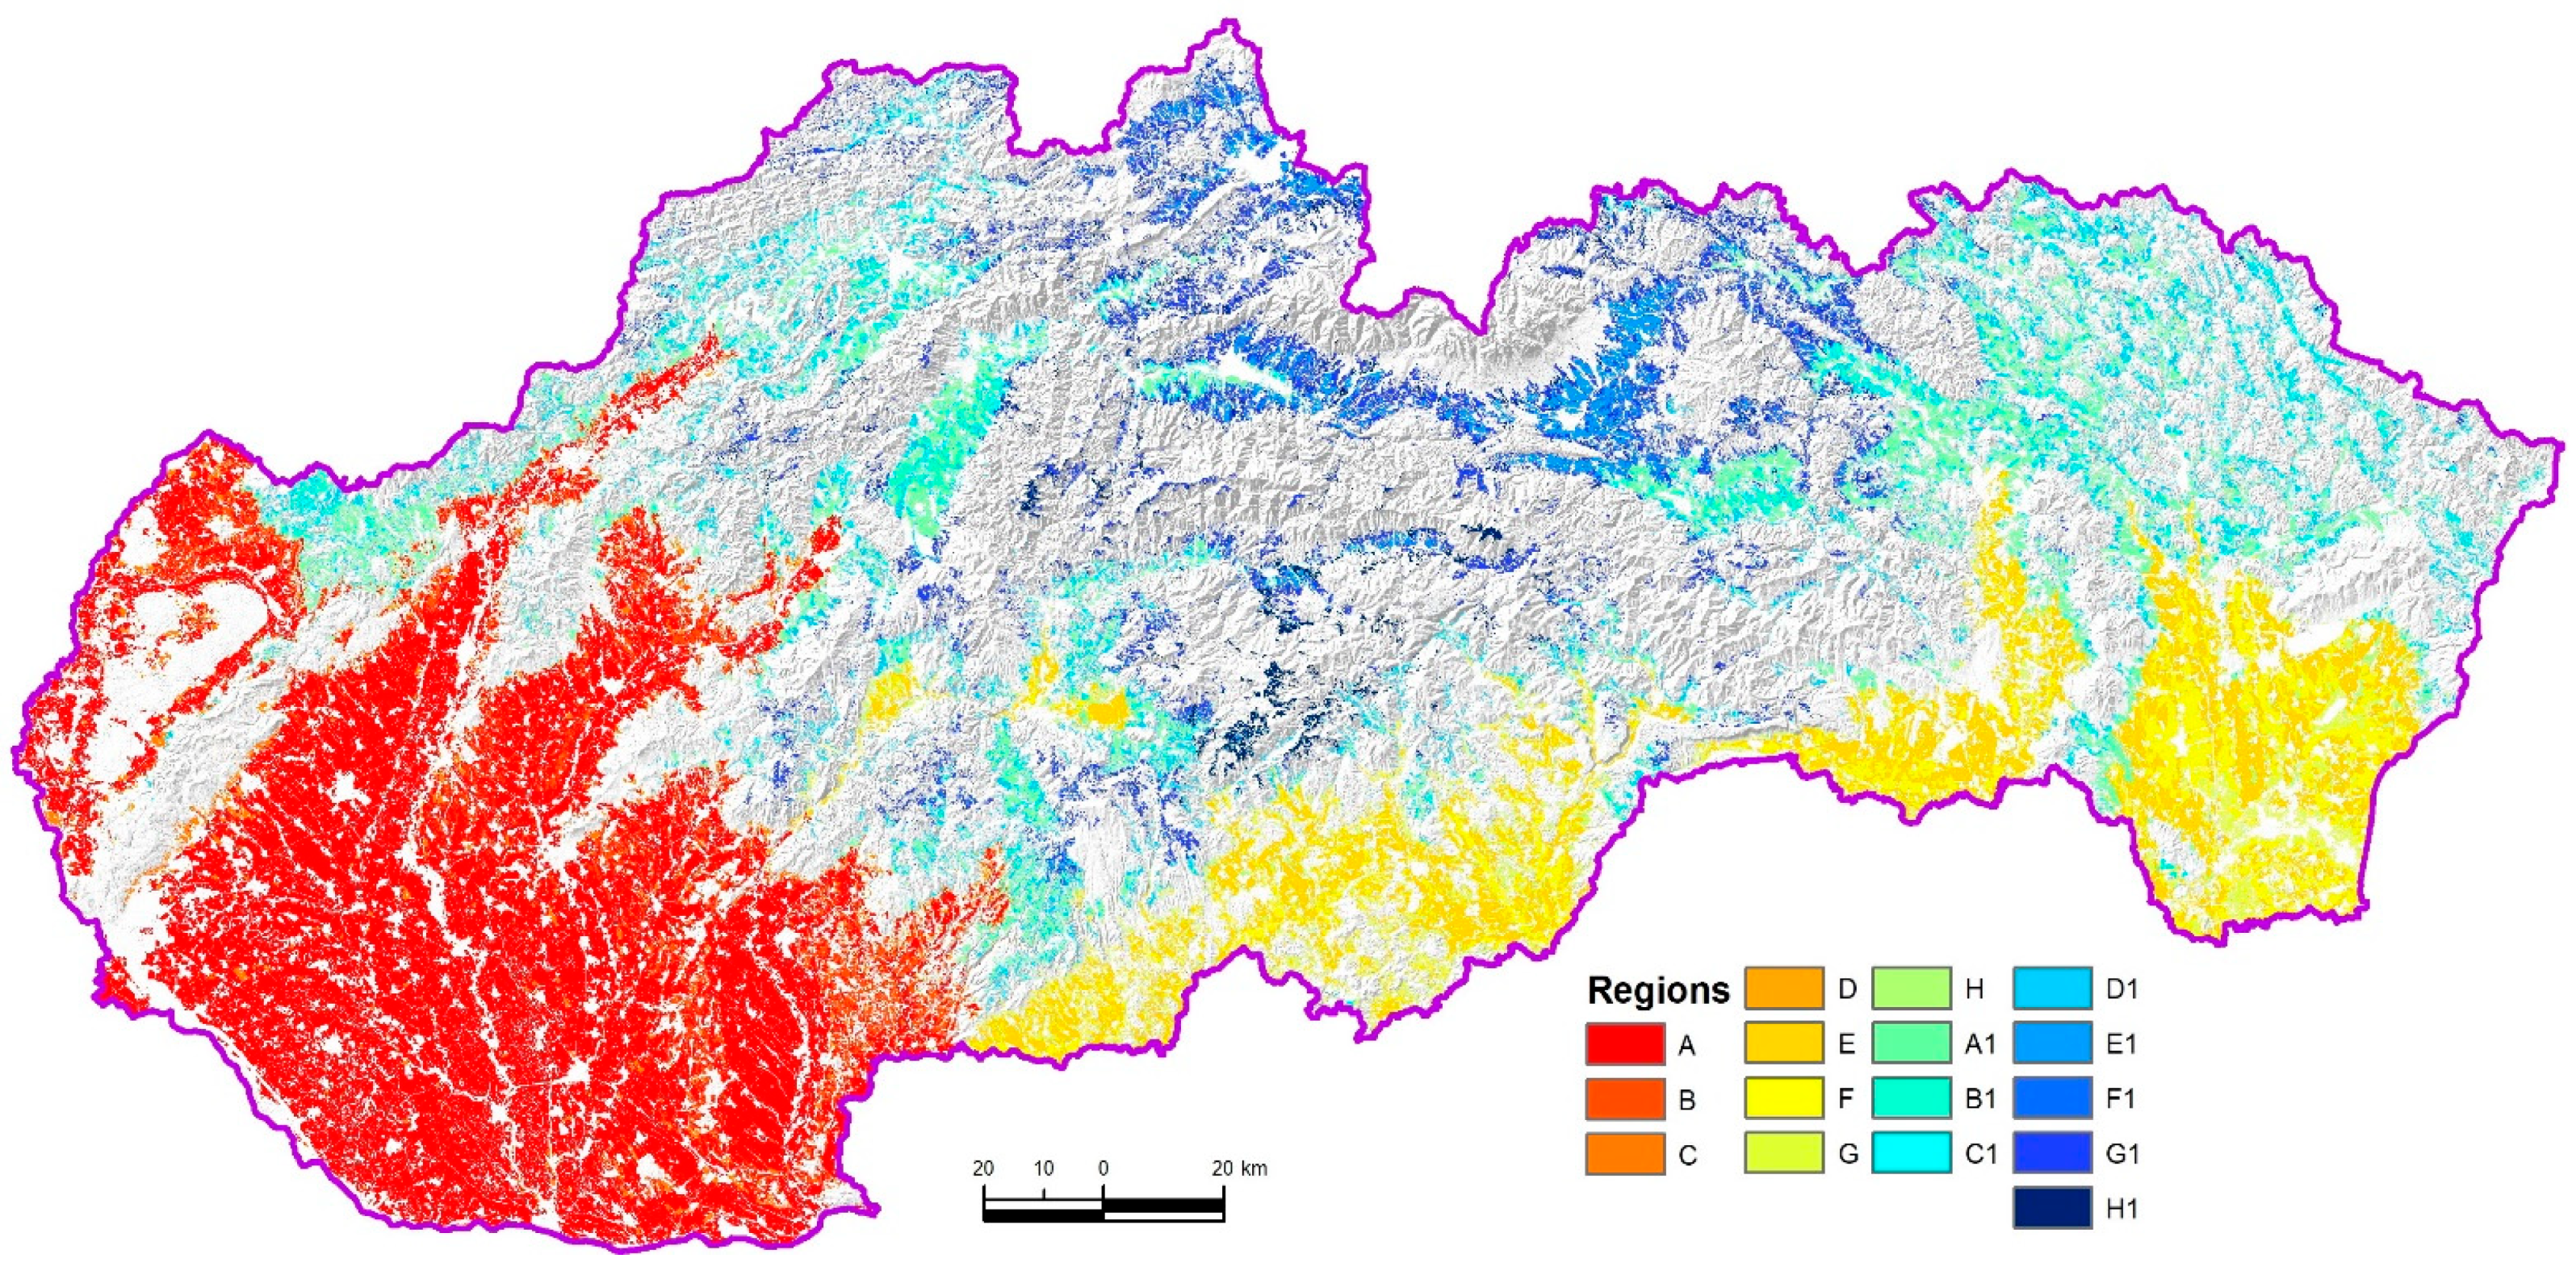
2.2. Study Area
2.3. Methods of Assessment of the Potential of Agro-Ecosystem Services
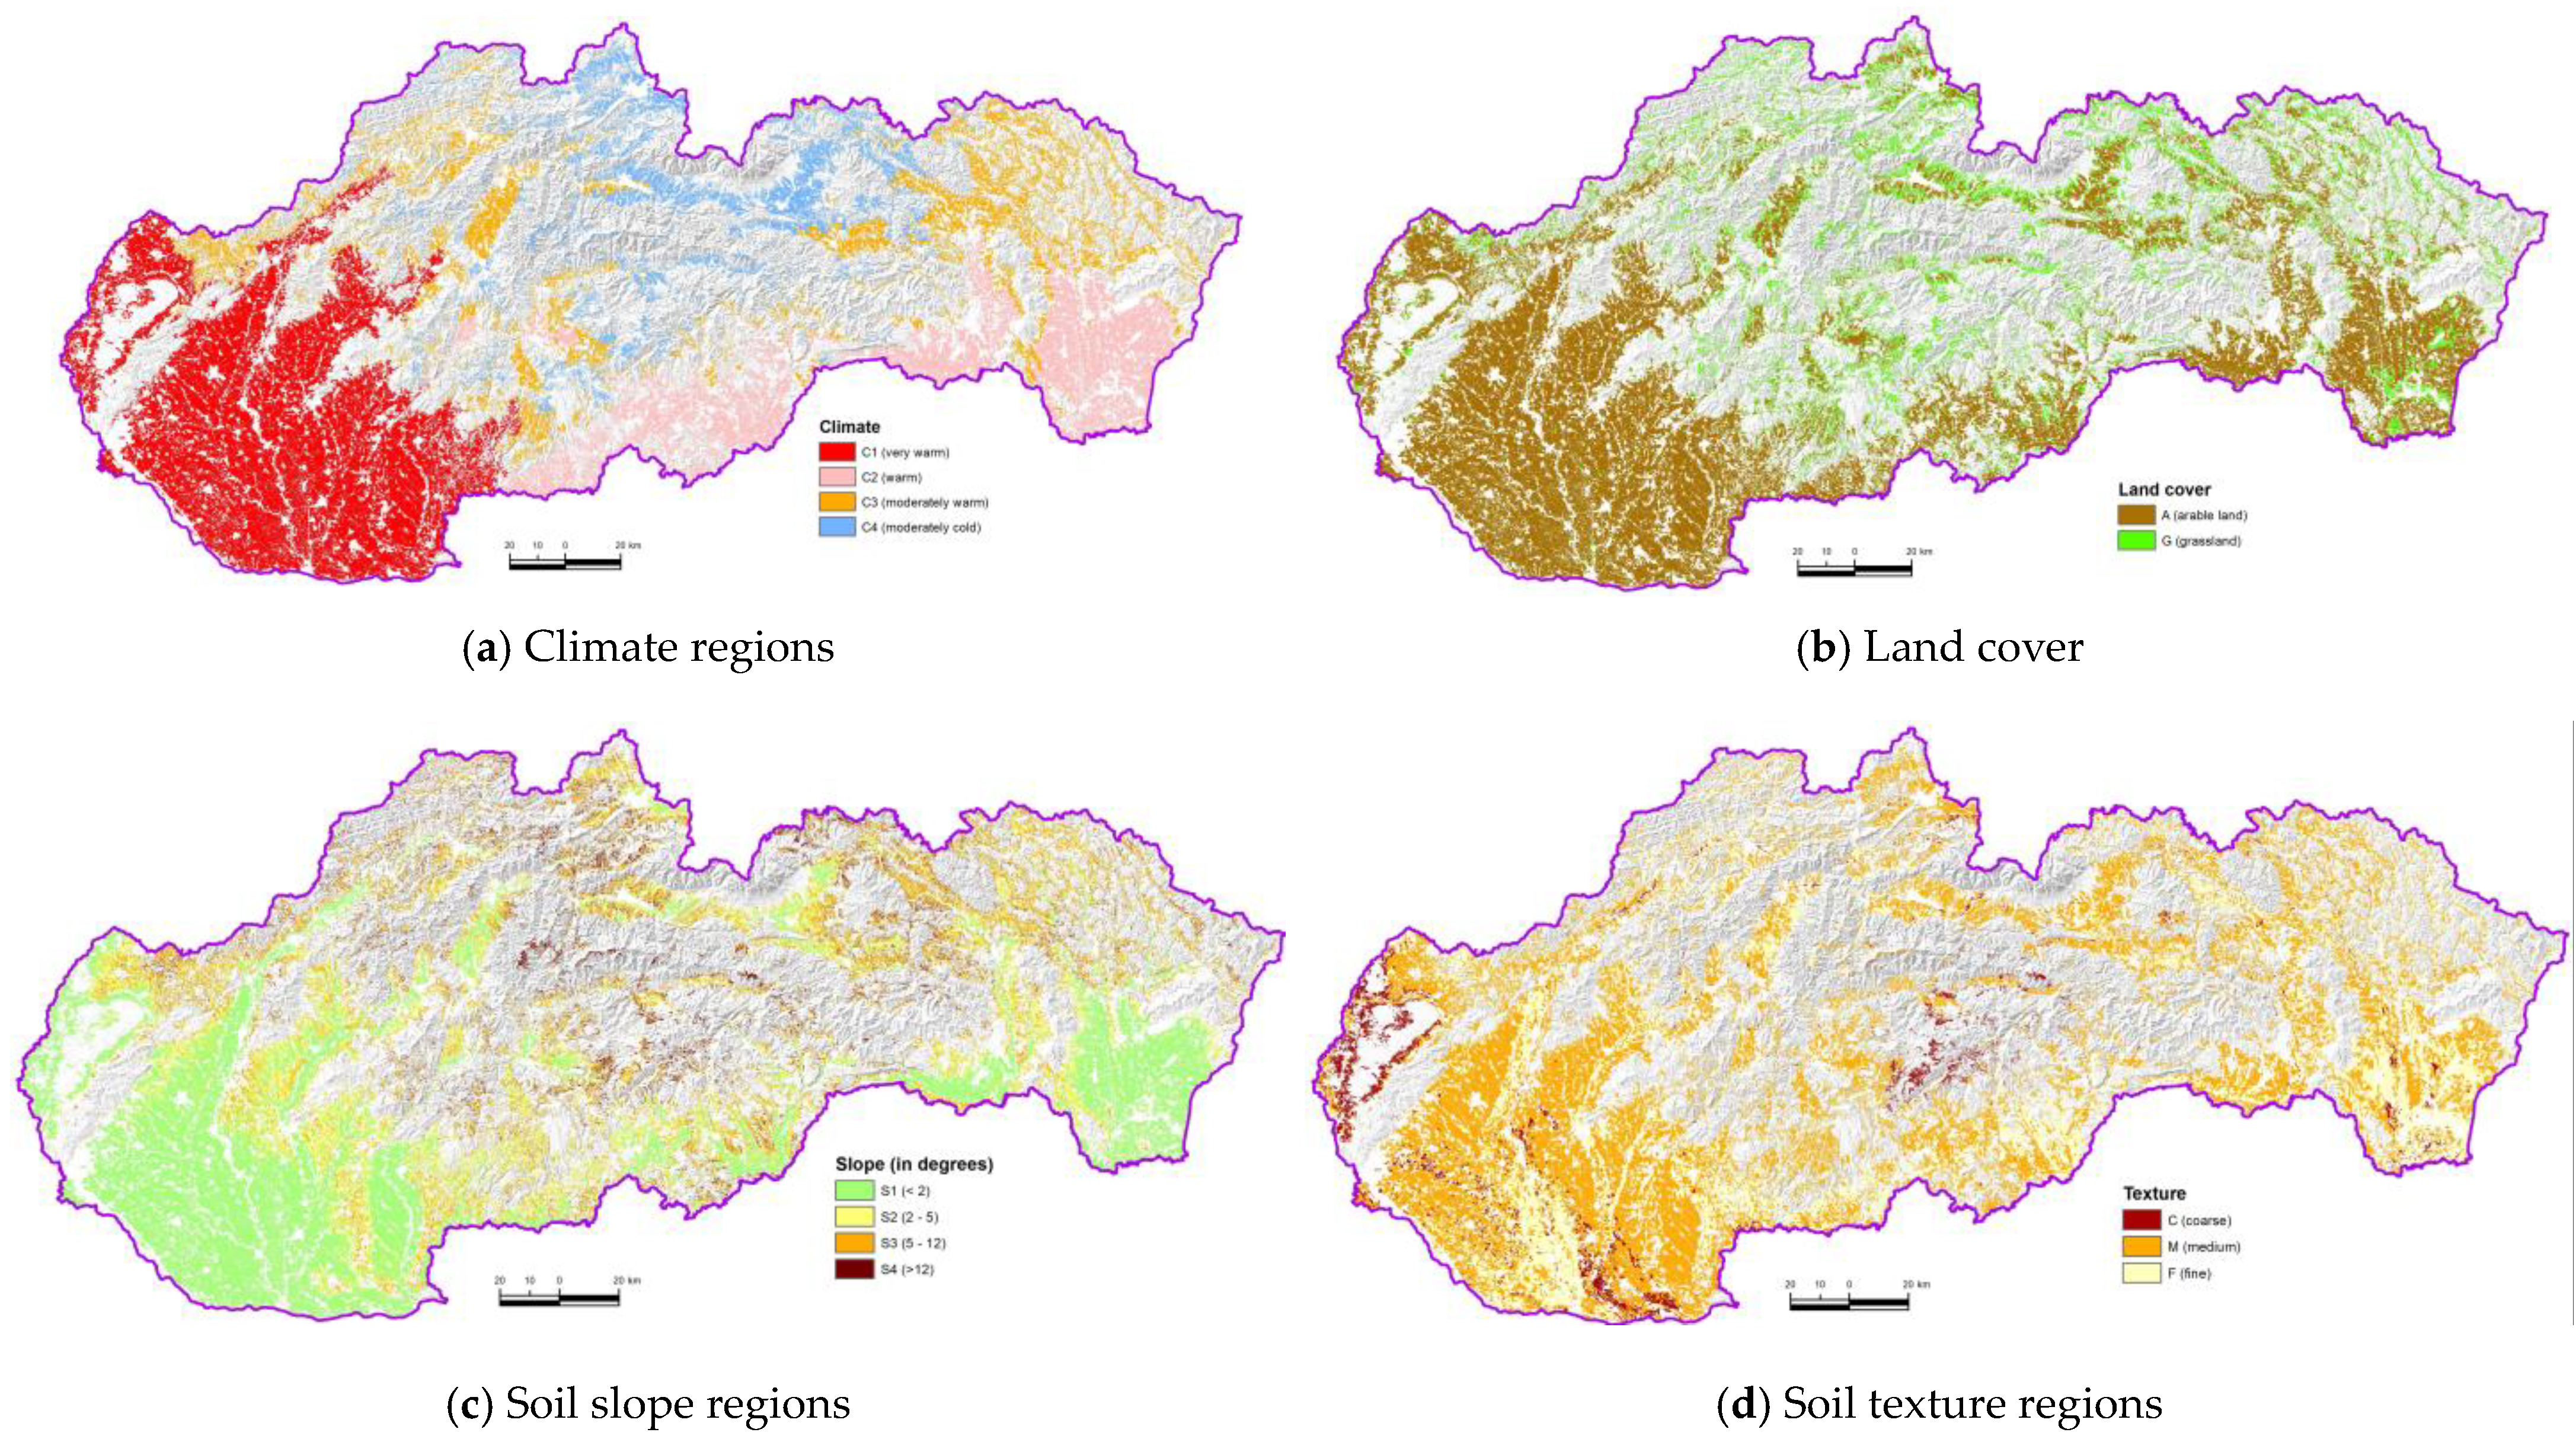
- Climatic region (categories: moderately cold, moderately warm, warm, and very warm; according to Kizeková et al. [71]),
- Slope topography (categories: 0–2°, 2.1°–5°,5.1°–12° and more than 12°),
- Soil texture (categories: soil particles < 0.01 mm less than 20%, 20–45%, more than 45%) and
- Land use (arable land, grassland).
2.4. Geospatial Datasets Used for Specifying the Area Distribution of Individual Agro-Ecosystems
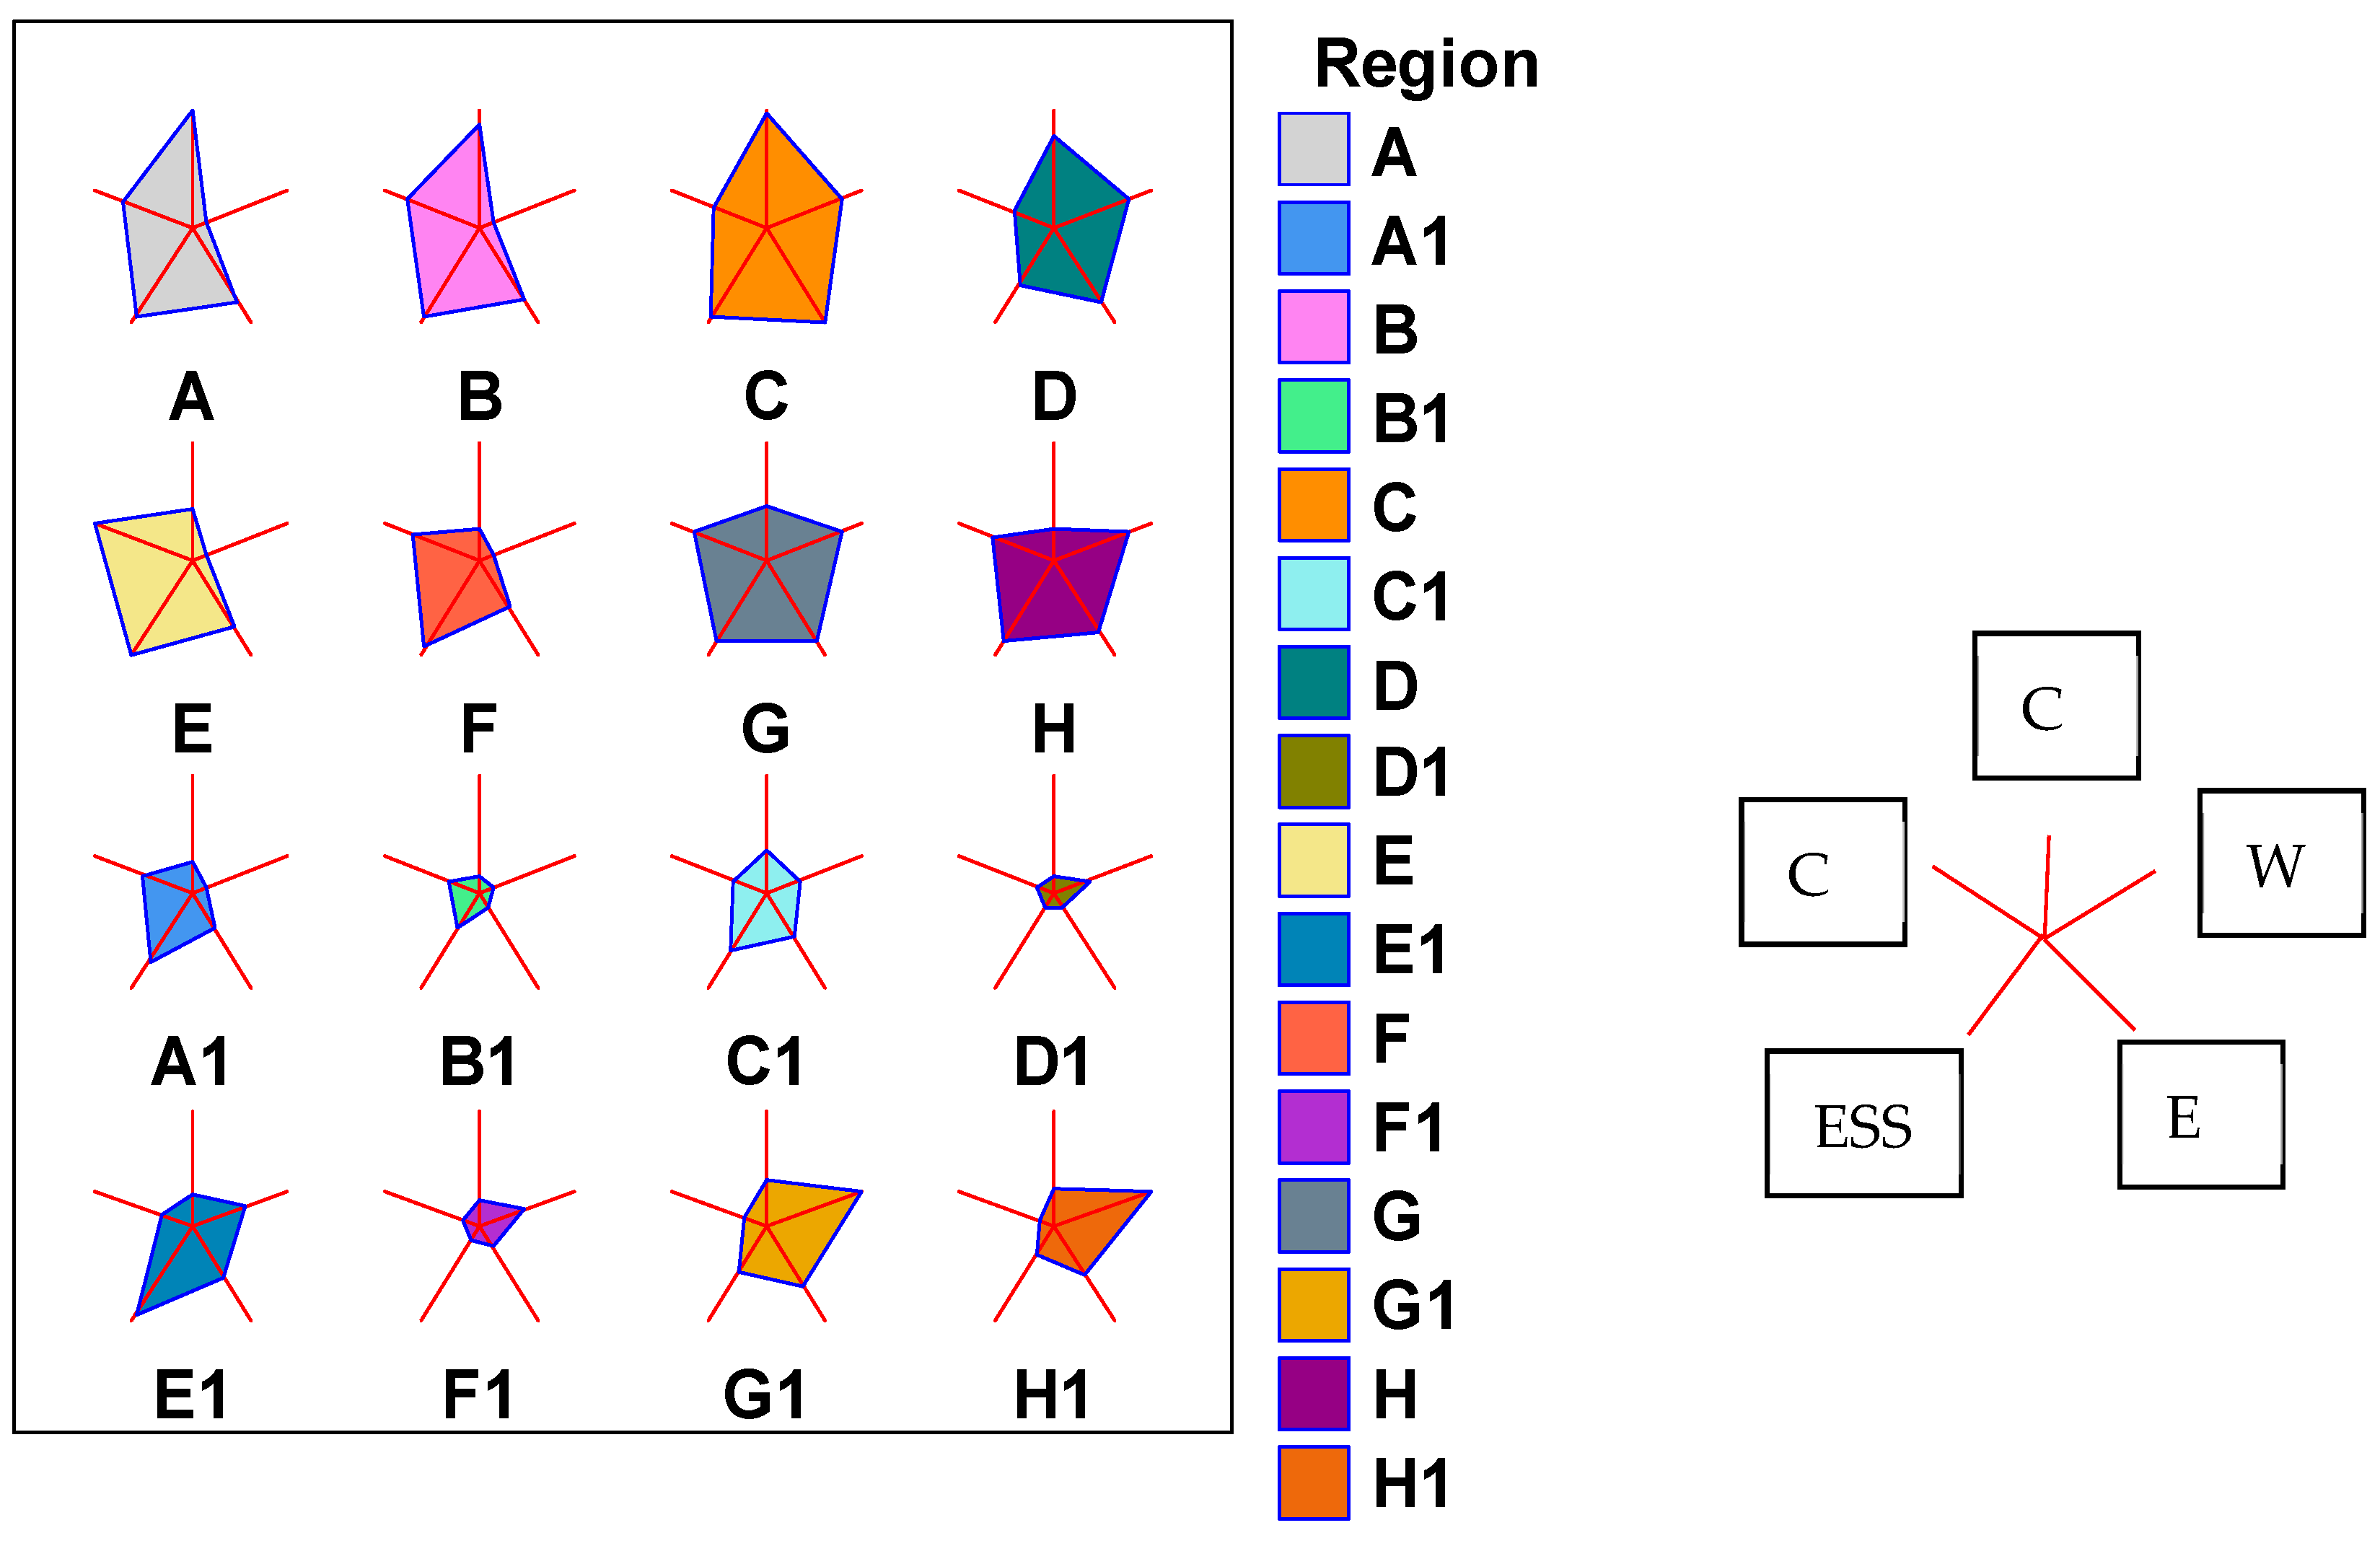
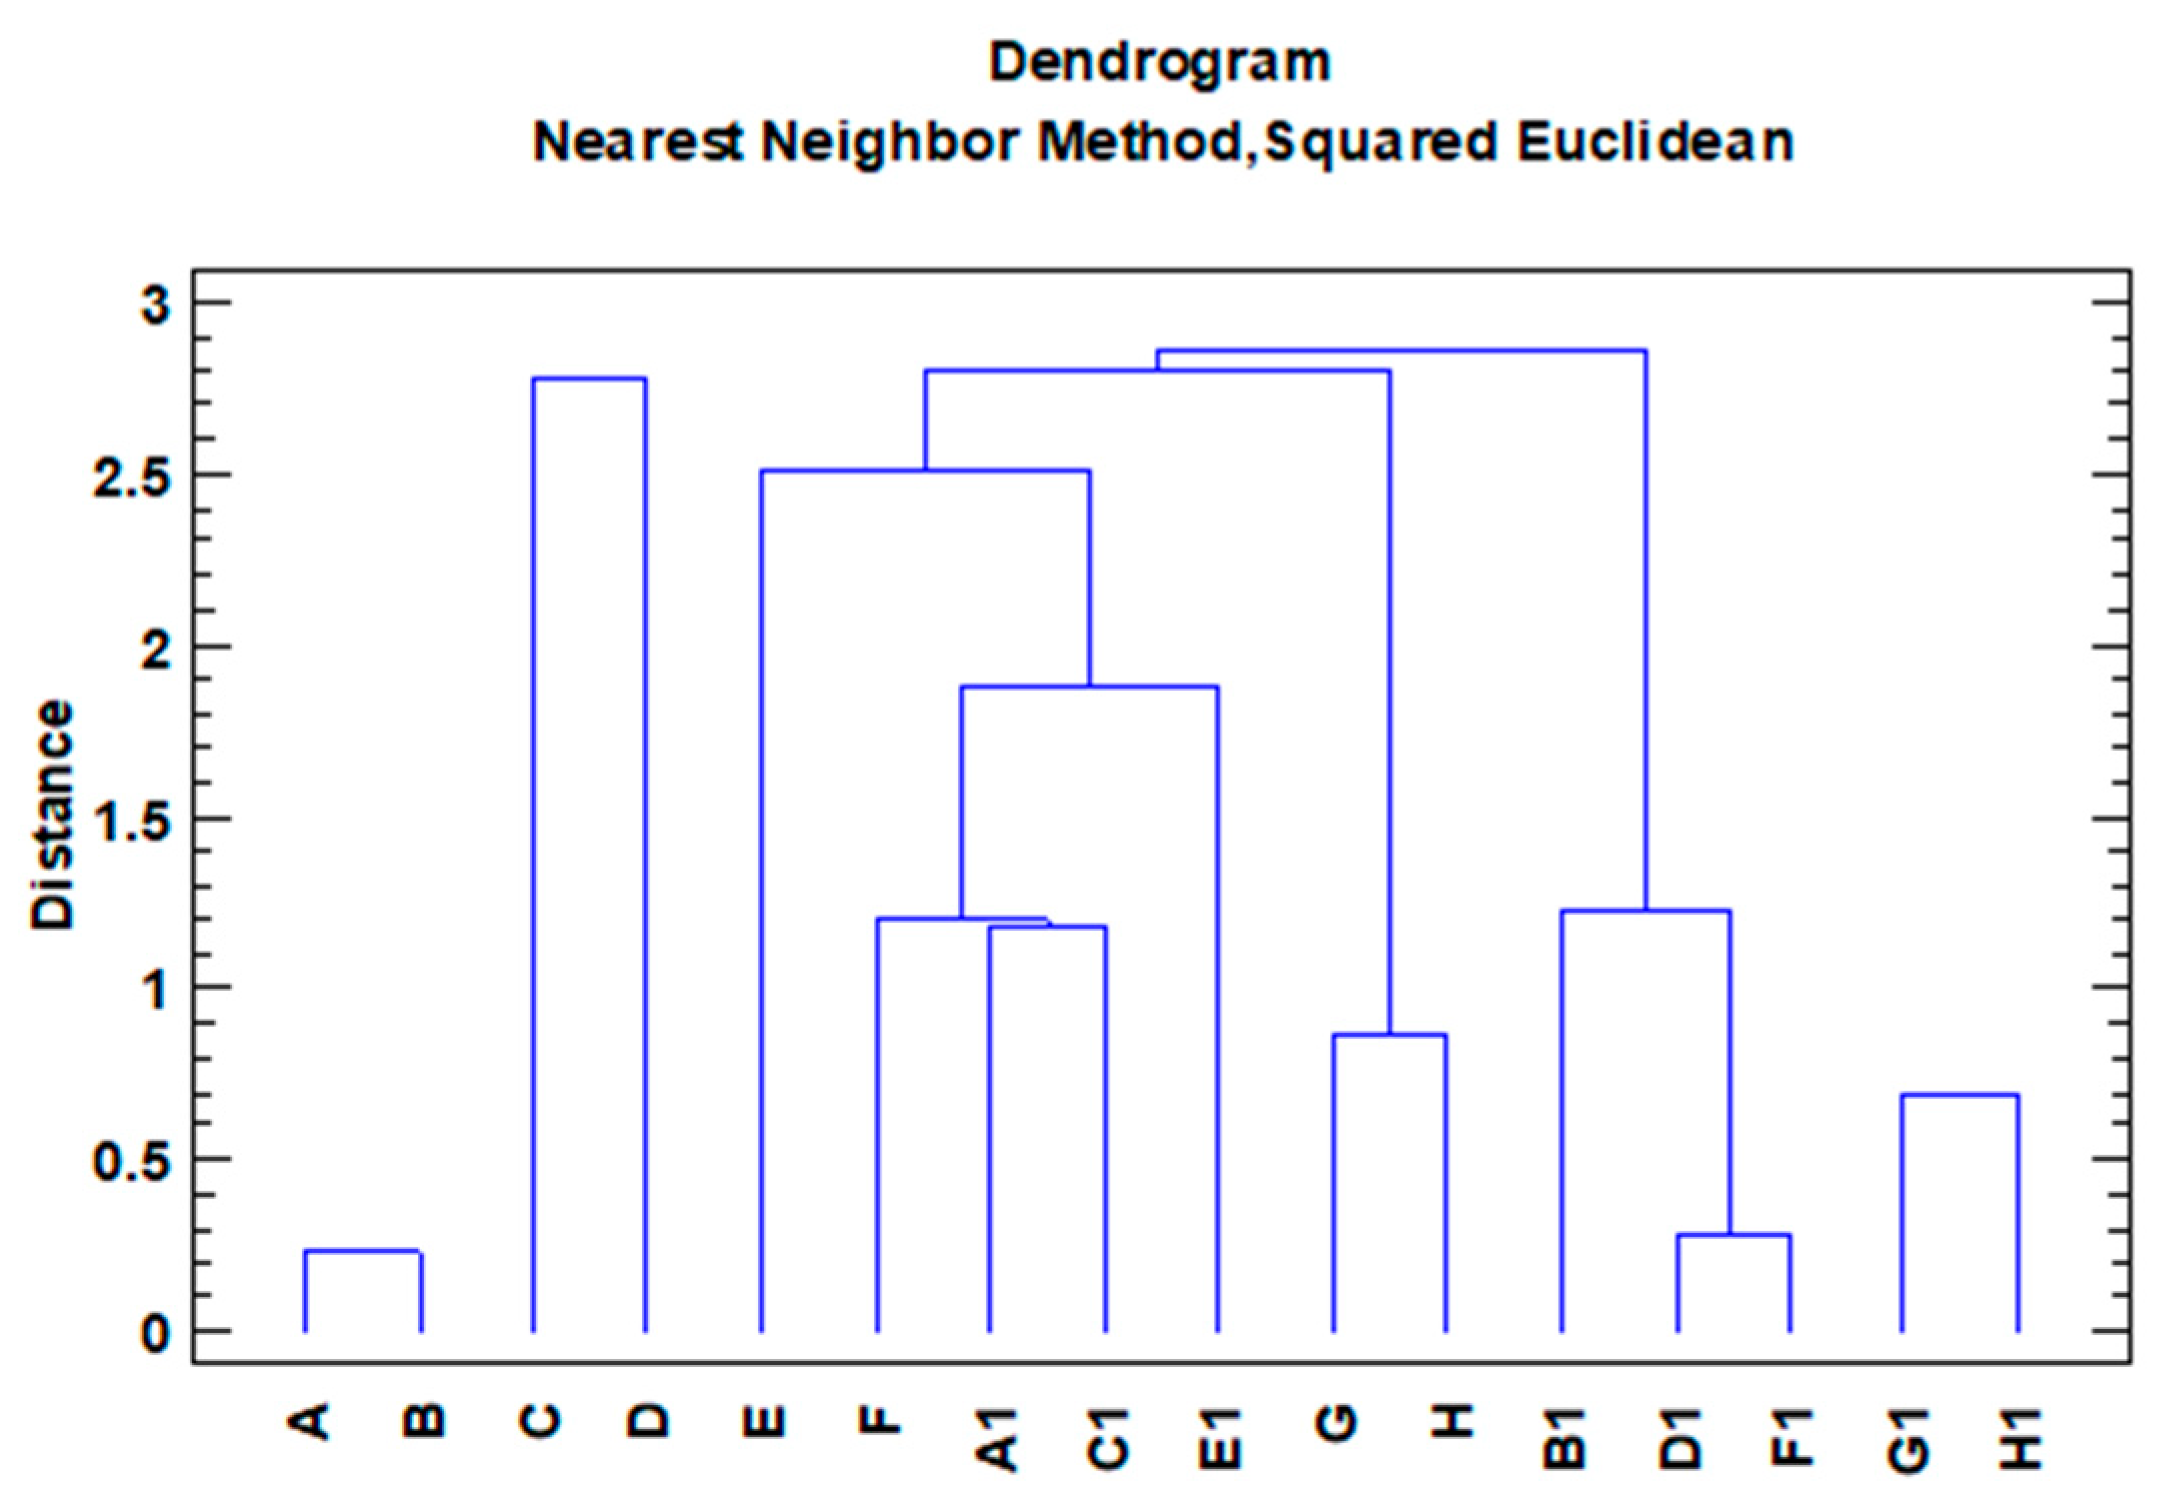
2.5. Statistical Model Regions Comparison
3. Results and Discussion
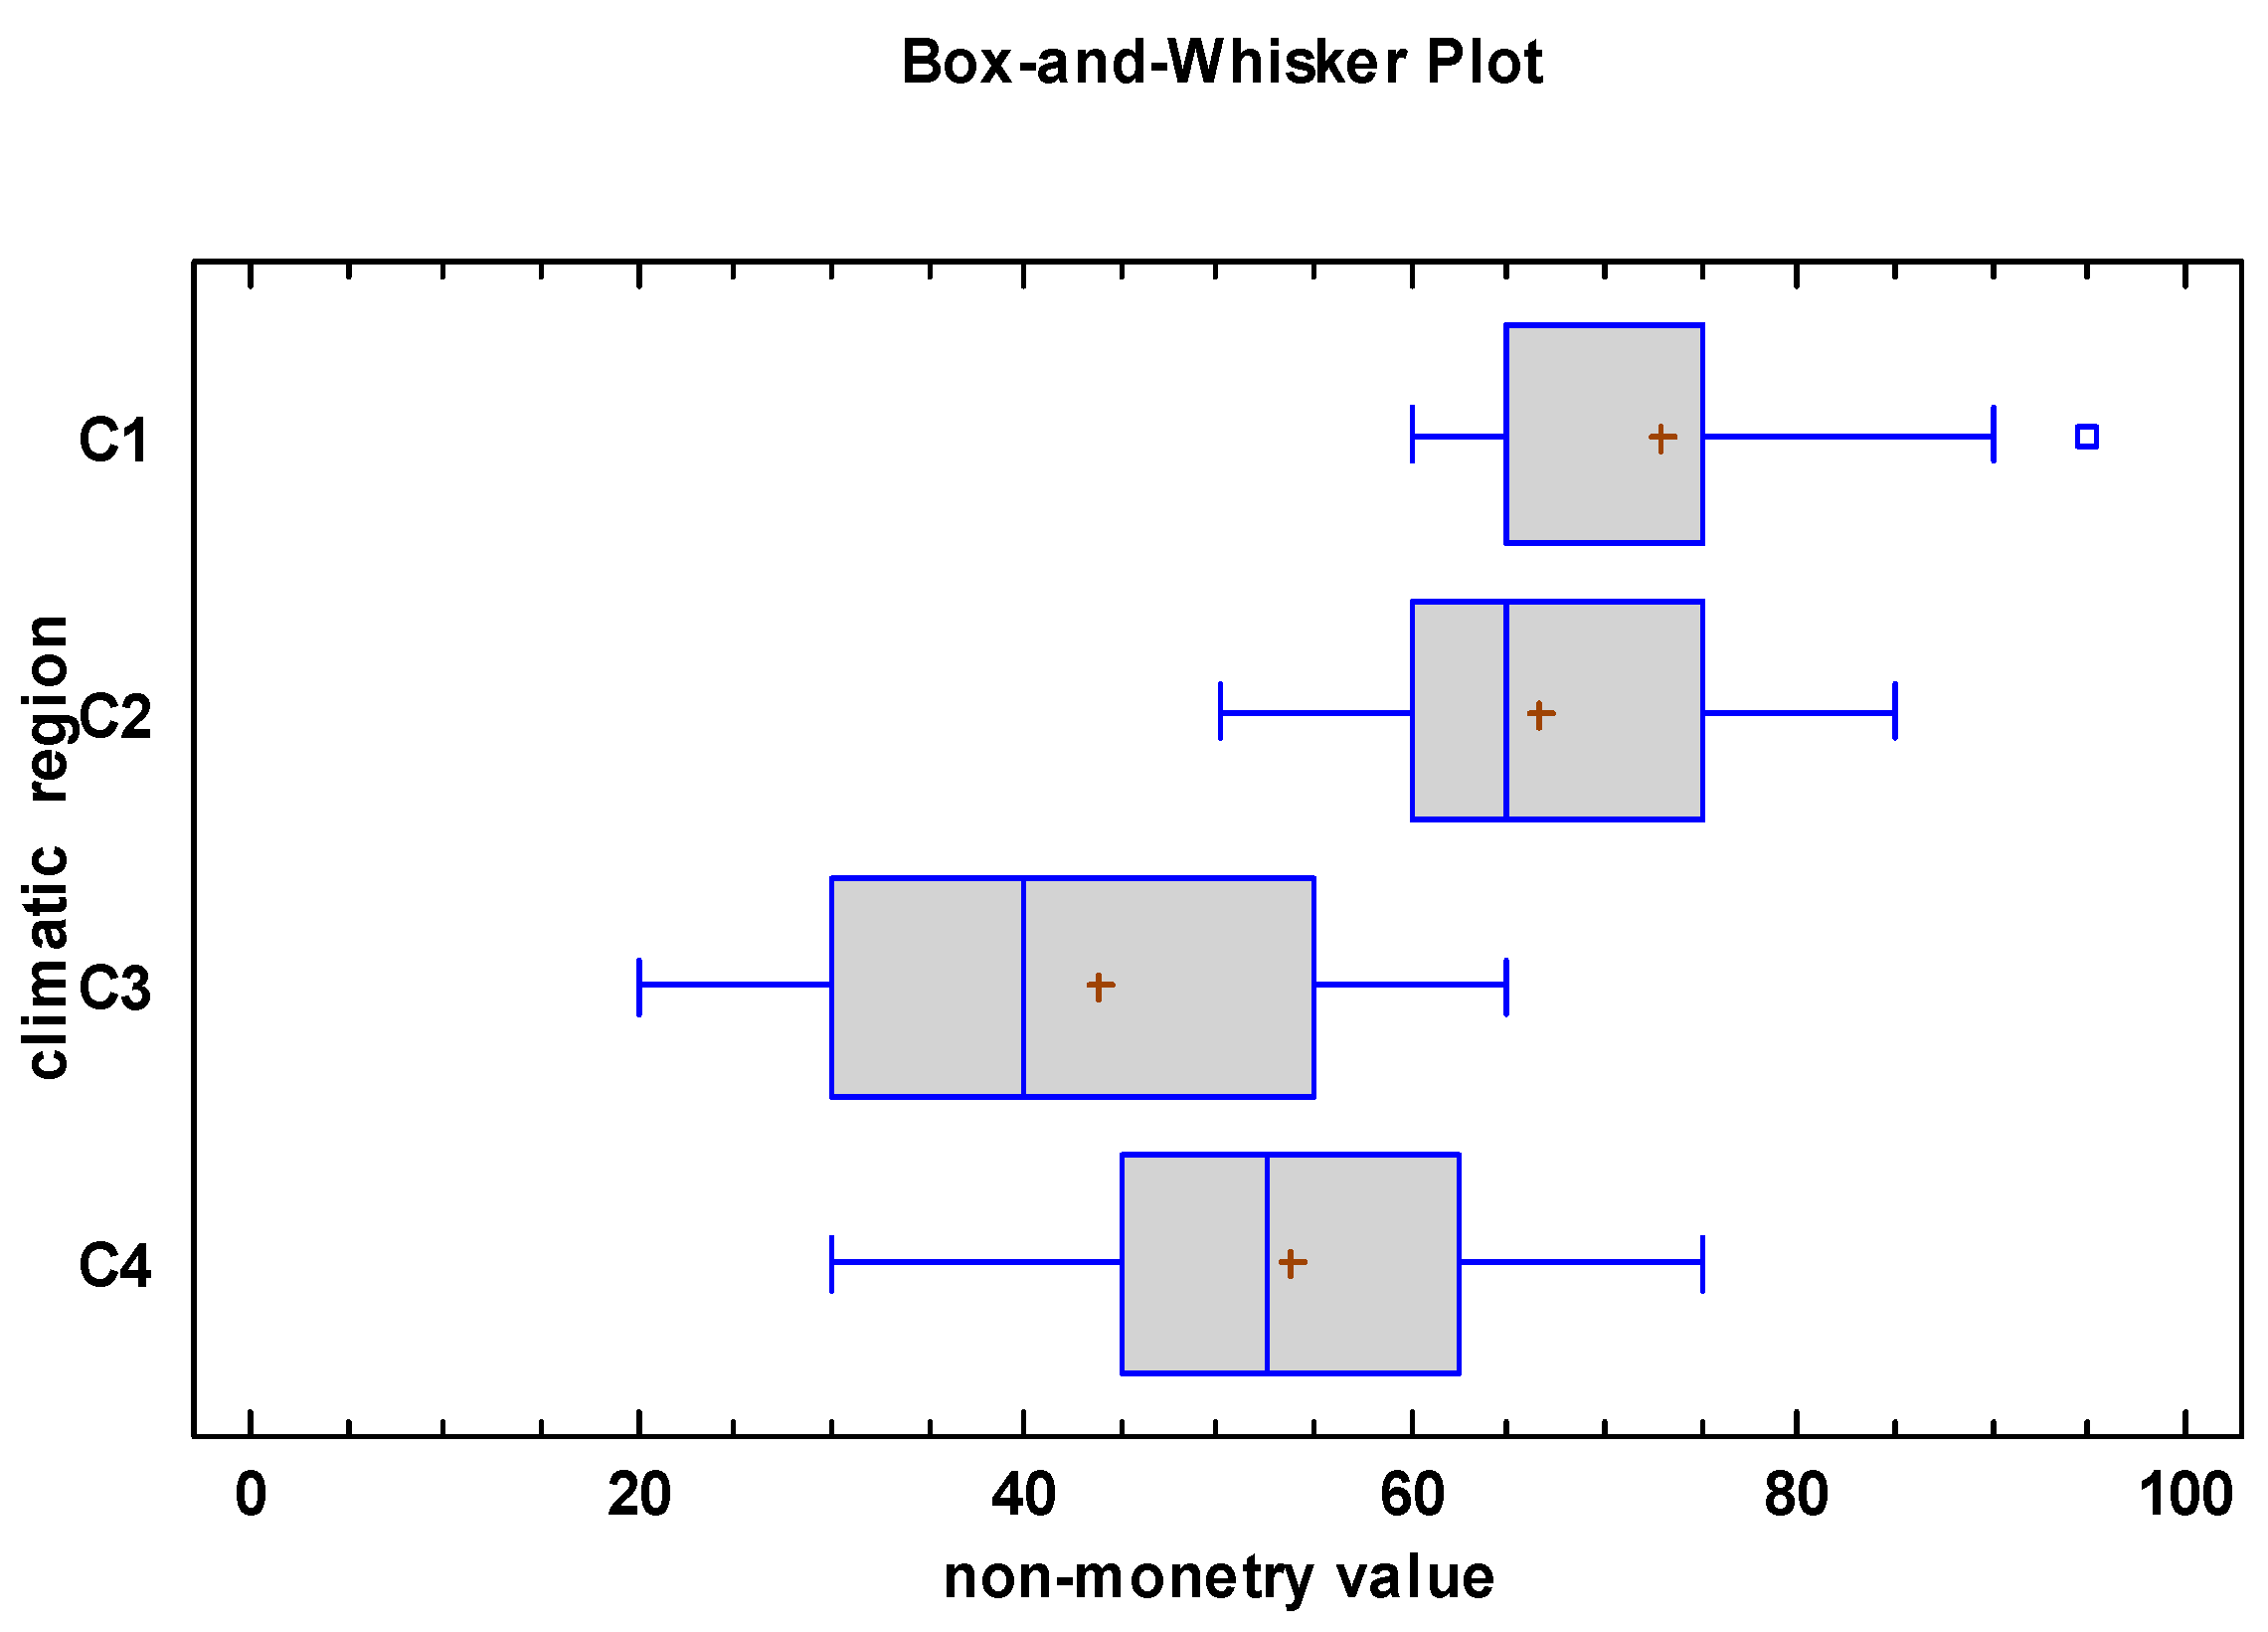
3.1. Climate Regions
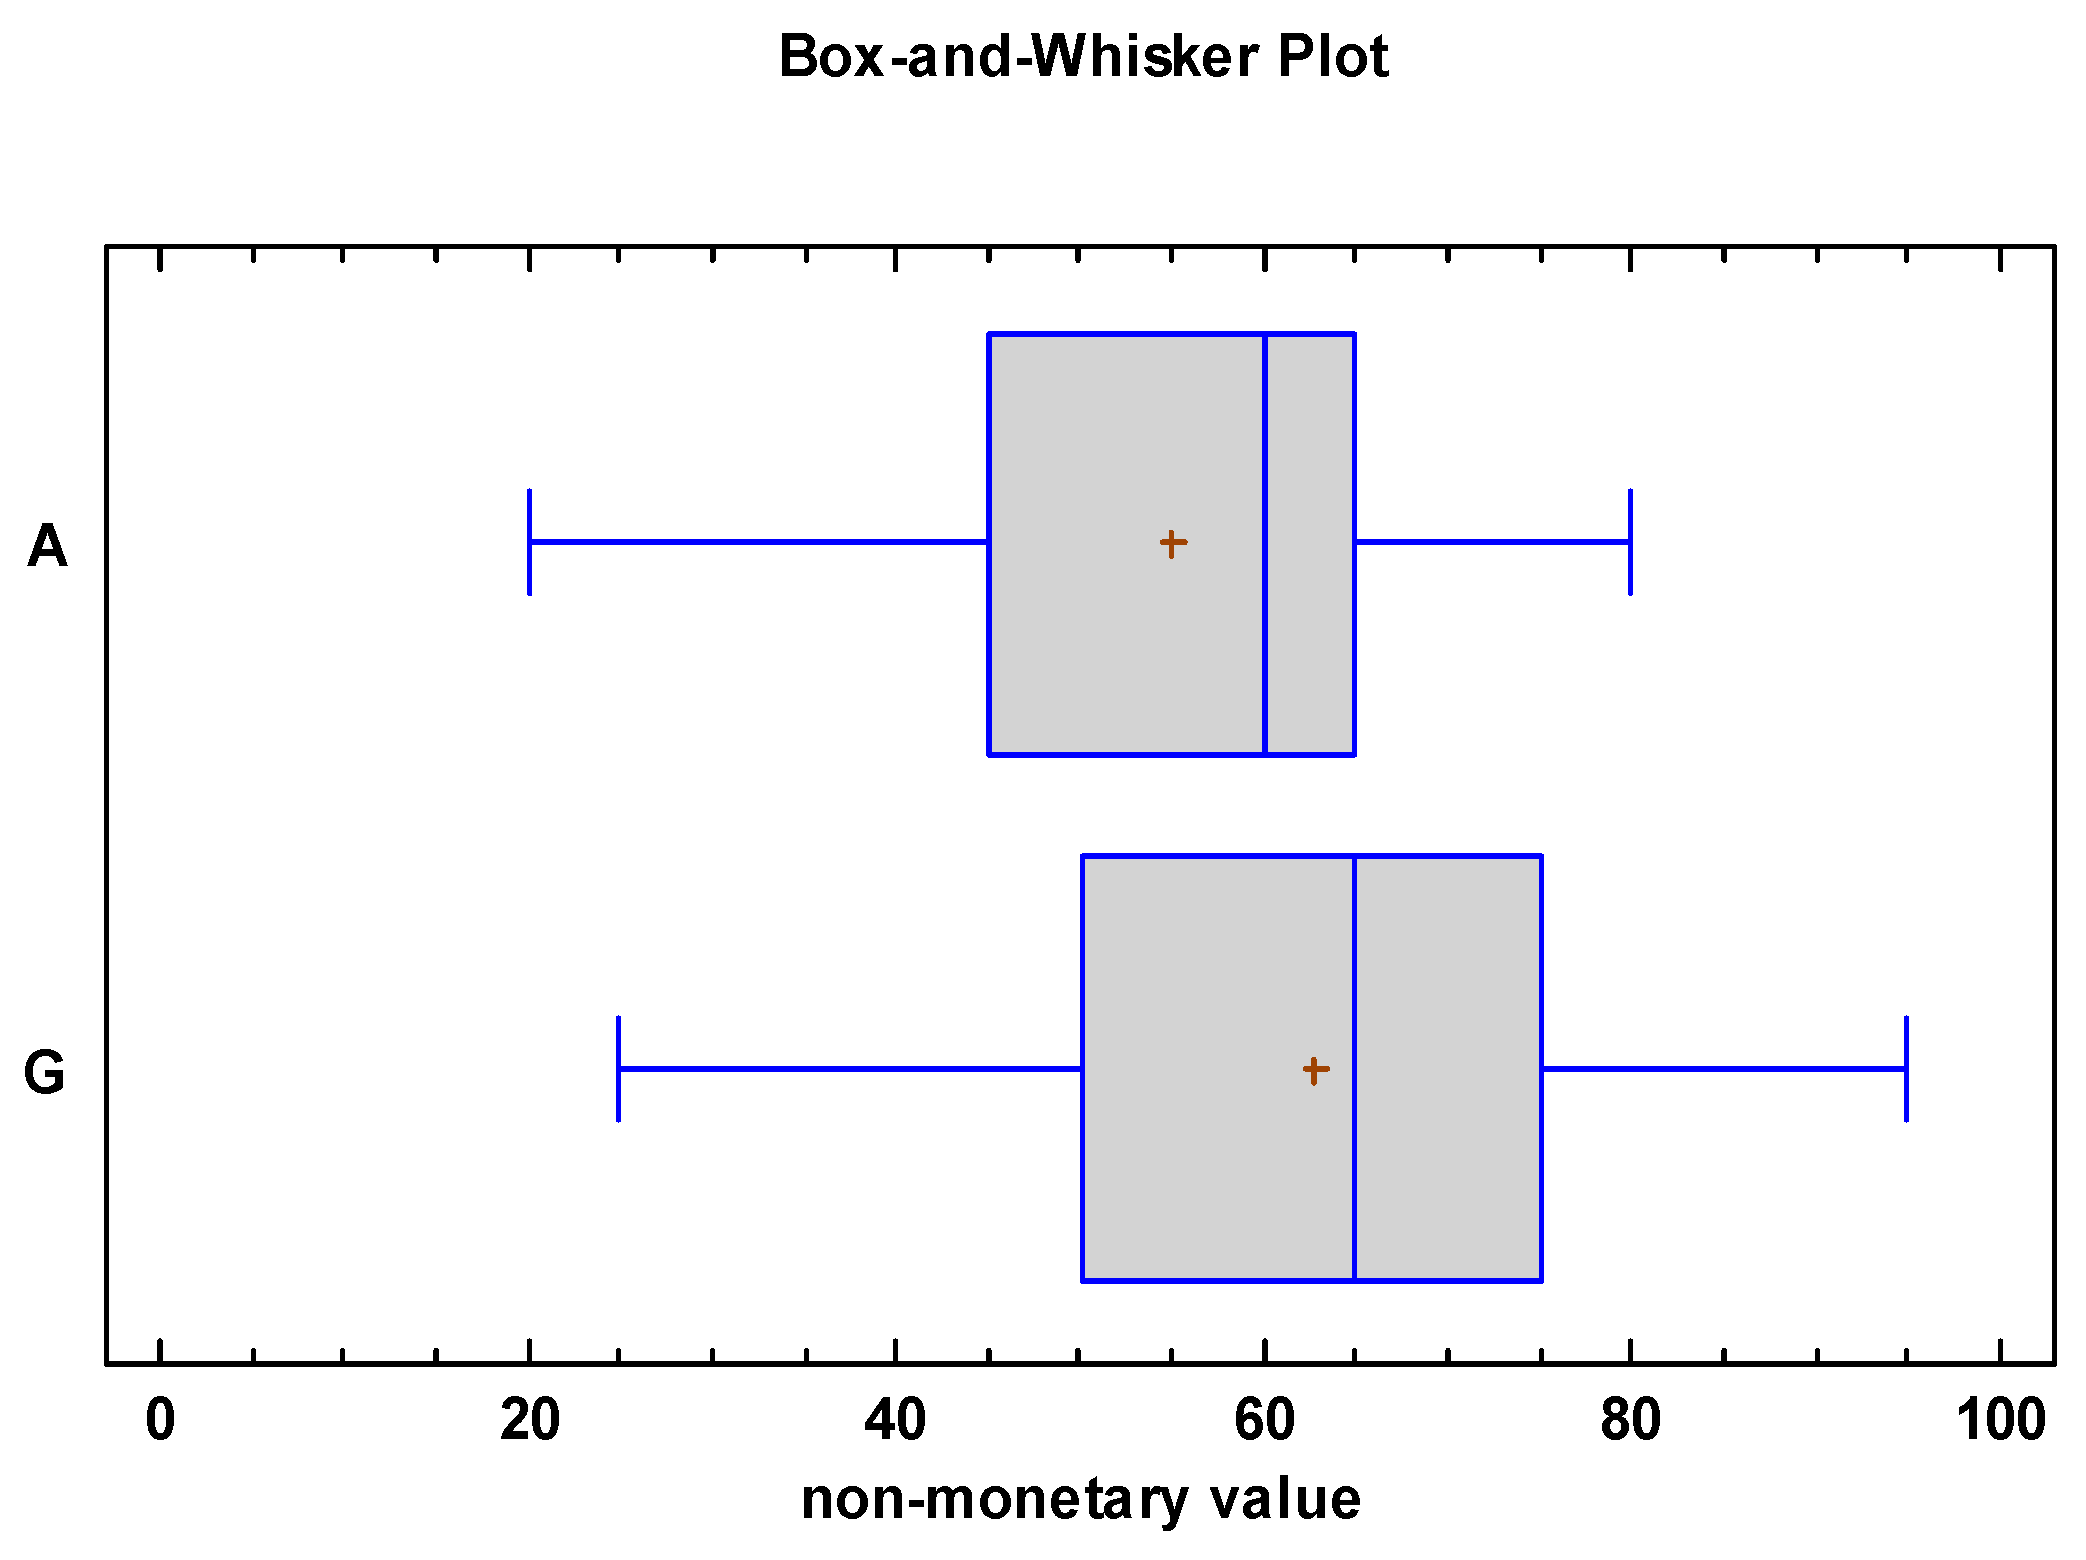
3.2. Land Cover
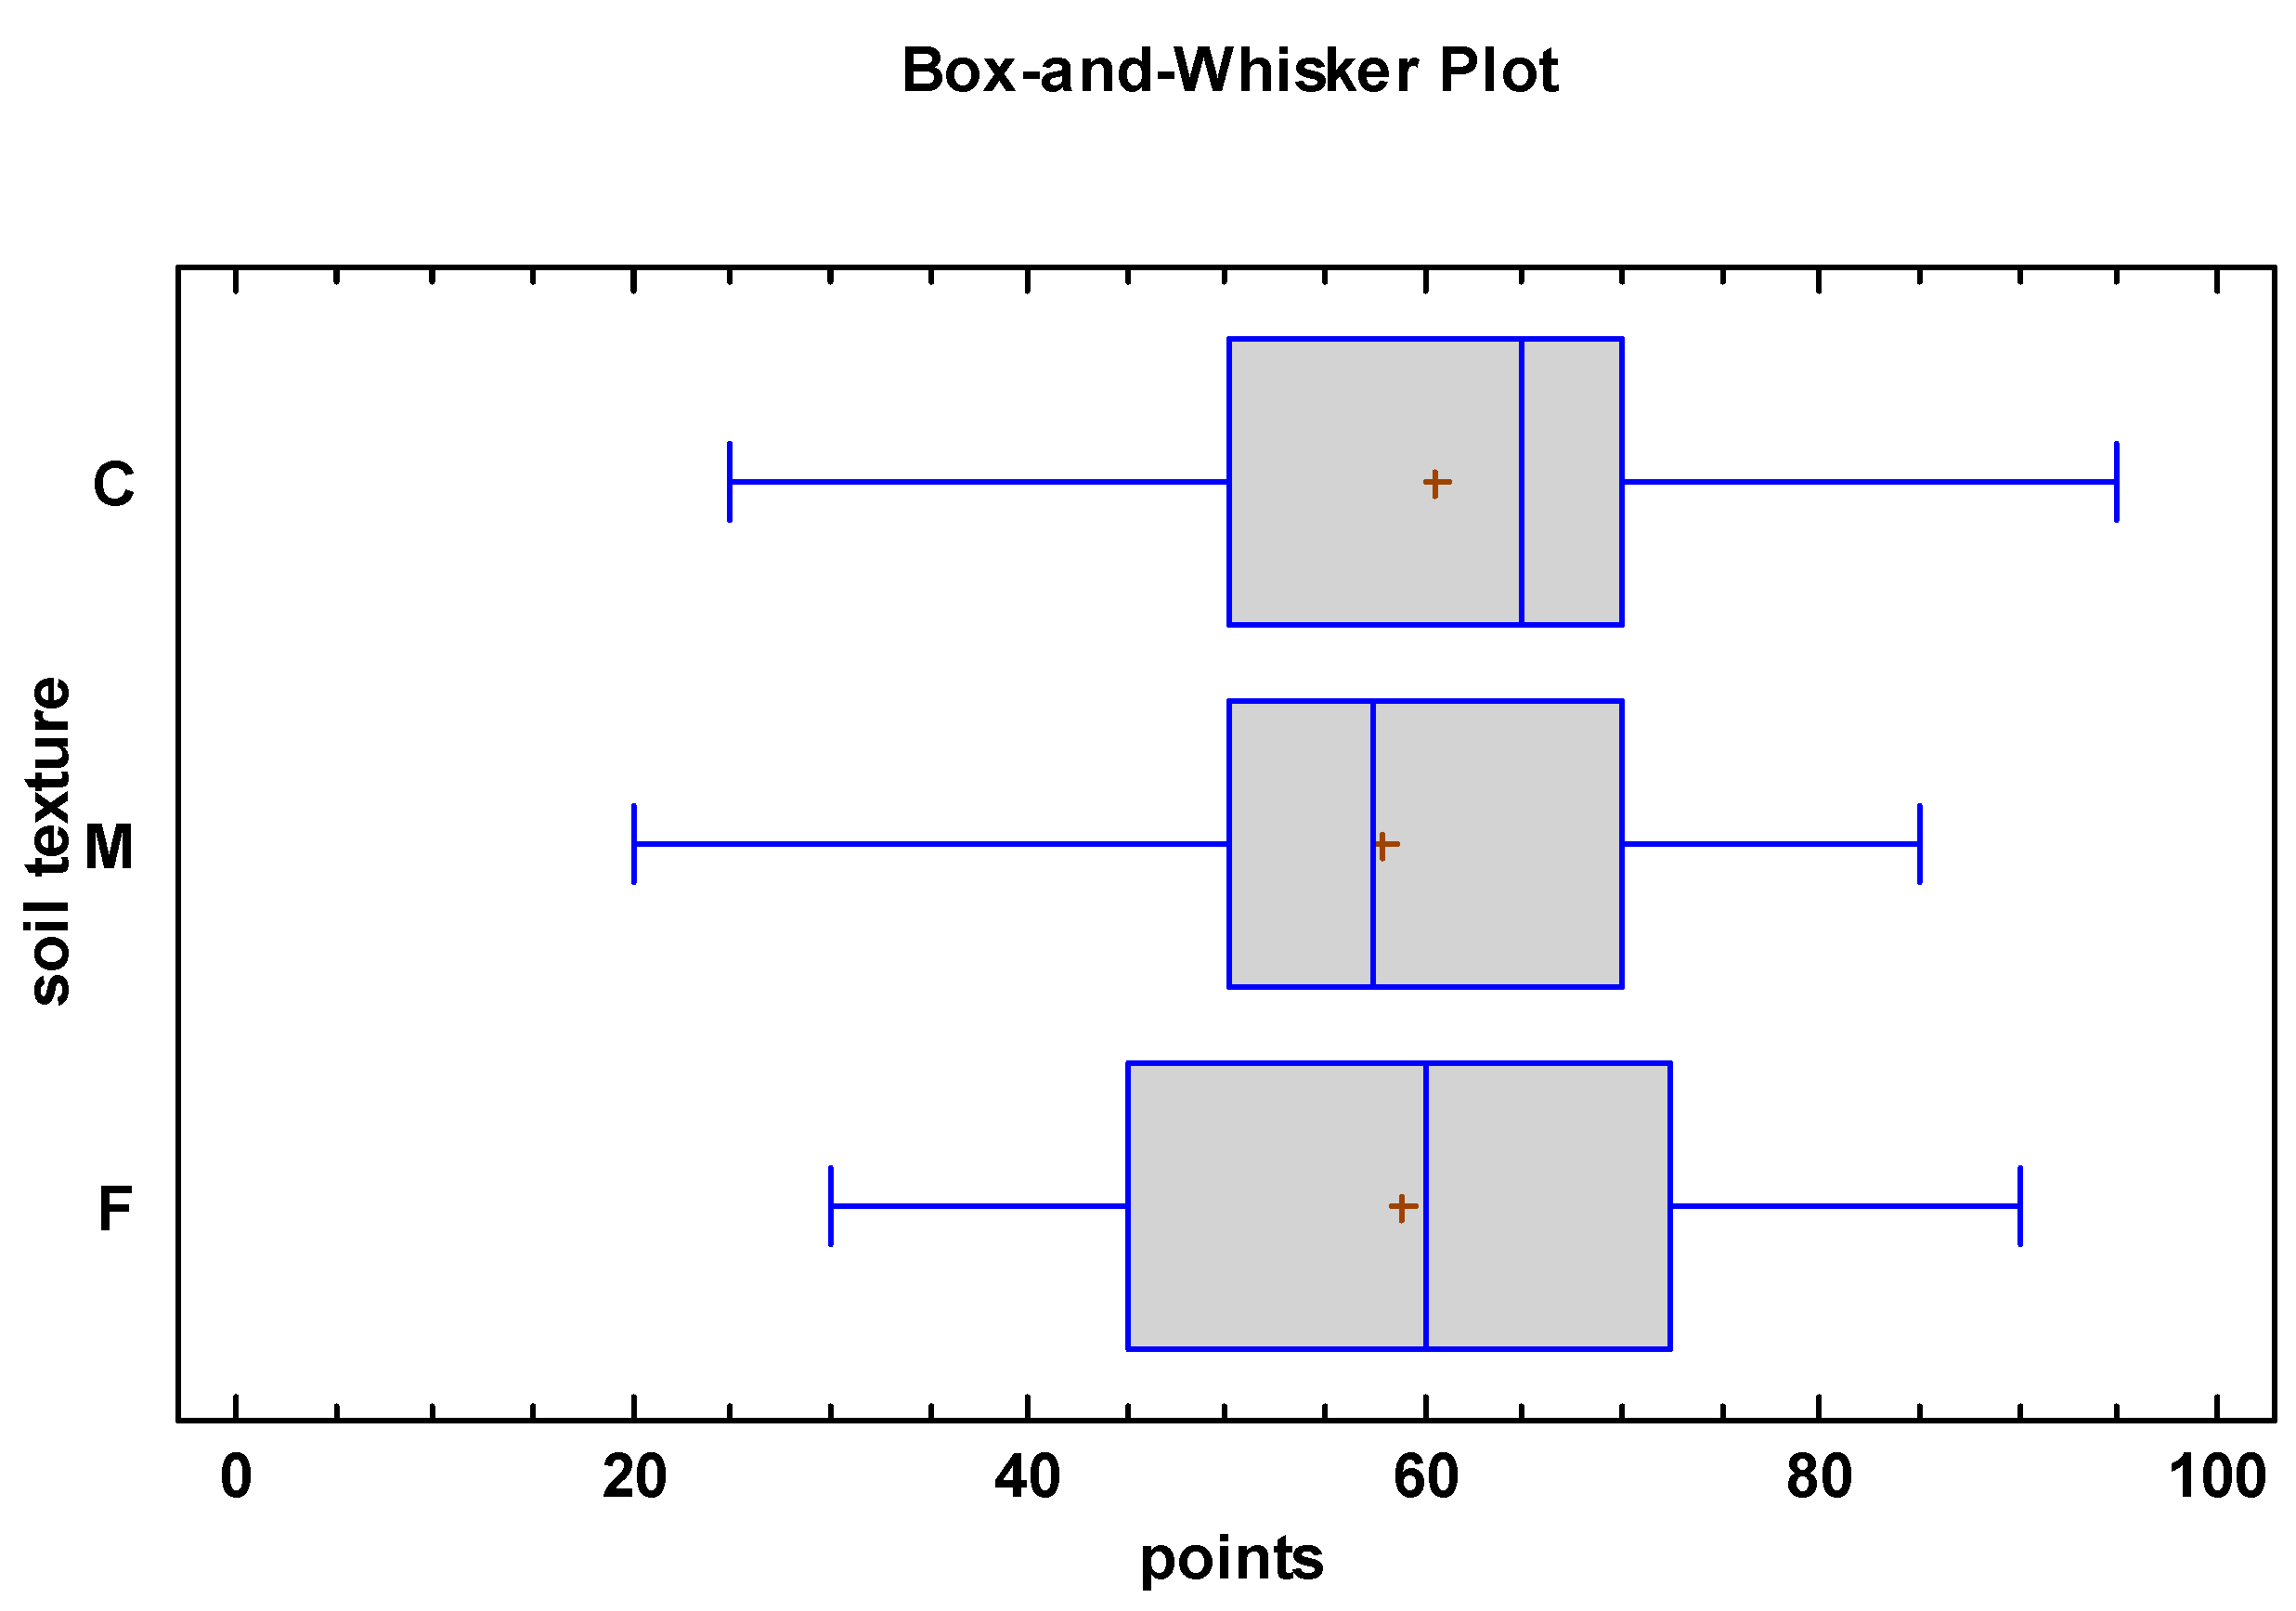
3.3. Soil Texture
3.4. Soil Slope
4. Conclusions
Supplementary Materials
Author Contributions
Funding
Institutional Review Board Statement
Data Availability Statement
Acknowledgments
Conflicts of Interest
References
- Constanza, R.; Daly, H.E. Natural Capital and Sustainable Development. Conserv. Biol. 1992, 6, 37–46. [Google Scholar] [CrossRef]
- Birkhofer, K.; Diehl, E.; Andersson, J.; Ekroos, J.; Früh-Müller, A.; Machnikowski, F.; Mader, V.L.; Nilsson, L.; Sasaki, K.; Rundlöf, M.; et al. Ecosystem services-current challenges and opportunities for Ecological Research. Front. Ecol. Evol. 2015, 2, 87. [Google Scholar] [CrossRef]
- European Commission, Directorate-General for Environment. EU Biodiversity Strategy for 2030: Bringing Nature back into Our Lives; Publications Office of the European Union: Luxembourg, 2021. [CrossRef]
- Burkhard, B.; Kandziora, M.; Hou, Y.; Müller, F. Ecosystem Service Potentials, Flows and Demands-Concepts for Spatial Localisation, Indication and Quantification. Landsc. Online 2014, 34, 1–32. [Google Scholar] [CrossRef]
- Millennium Ecosystem Assessment (MEA). Ecosystems and Human Well-Being: Our Human Planet; Summary for Decision Makers, The Millennium Ecosystem Assessment Series; Island Press: Washington, DC, USA, 2005; Volume 5. [Google Scholar]
- Dominati, E.; Patterson, M.; Mackay, A. A framework for classifying and quantifying the natural capital and ecosystem services of Soils. Ecol. Econ. 2010, 69, 1858–1868. [Google Scholar] [CrossRef]
- Burkhard, B.; Kroll, F.; Nedkov, S.; Müller, F. Mapping Ecosystem Service Supply, Demand and Budgets. Ecol. Indic. 2012, 21, 17–29. [Google Scholar] [CrossRef]
- Daniel, T.C.; Muhar, A.; Arnberger, A.; Aznar, O.; Boyd, J.W.; Chan, K.M.; Costanza, R.; Elmqvist, T.; Flint, C.G.; Gobster, P.H.; et al. Contributions of cultural services to the Ecosystem Services Agenda. Proc. Natl. Acad. Sci. USA 2012, 109, 8812–8819. [Google Scholar] [CrossRef]
- Lescourret, F.; Magda, D.; Richard, G.; Adam-Blondon, A.-F.; Bardy, M.; Baudry, J.; Doussan, I.; Dumont, B.; Lefèvre, F.; Litrico, I.; et al. A social–ecological approach to managing multiple agro-ecosystem services. Curr. Opin. Environ. Sustain. 2015, 14, 68–75. [Google Scholar] [CrossRef]
- Yaalon, D.H.; Arnold, R.W. Attitudes toward soils and their societal relevance: Then and now. Soil Sci. 2000, 165, 5–12. [Google Scholar] [CrossRef]
- Vilček, J.; Koco, Š. Integrated index of Agricultural Soil Quality in Slovakia. J. Maps 2018, 14, 68–76. [Google Scholar] [CrossRef]
- Greiner, L.; Keller, A.; Grêt-Regamey, A.; Papritz, A. Soil Function Assessment: Review of methods for quantifying the contributions of soils to ecosystem services. Land Use Policy 2017, 69, 224–237. [Google Scholar] [CrossRef]
- Kopittke, P.M.; Menzies, N.W.; Wang, P.; McKenna, B.A.; Lombi, E. Soil and the intensification of Agriculture for Global Food Security. Environ. Int. 2019, 132, 105078. [Google Scholar] [CrossRef]
- Marinari, S.; Radicetti, E.; Petroselli, V.; Allam, M.; Mancinelli, R. Microbial indices to assess soil health under different tillage and fertilization in potato (Solanum tuberosum L.) crop. Agriculture 2022, 12, 415. [Google Scholar] [CrossRef]
- Forouzangohar, M.; Crossman, N.D.; MacEwan, R.J.; Wallace, D.D.; Bennett, L.T. Ecosystem Services in agricultural landscapes: A spatially explicit approach to support sustainable soil management. Sci. World J. 2014, 2014, 483298. [Google Scholar] [CrossRef]
- Dominati, E.J.; Mackay, A.; Lynch, B.; Heath, N.; Millner, I. An ecosystem services approach to the quantification of shallow mass movement erosion and the value of Soil Conservation Practices. Ecosyst. Serv. 2014, 9, 204–215. [Google Scholar] [CrossRef]
- Haines-Young, R.; Potschin, M.; Kienast, F. Indicators of ecosystem service potential at European scales: Mapping marginal changes and trade-offs. Ecol. Indic. 2012, 21, 39–53. [Google Scholar] [CrossRef]
- Zhang, W.; Ricketts, T.H.; Kremen, C.; Carney, K.; Swinton, S.M. Ecosystem Services and dis-Services to agriculture. Ecol. Econ. 2007, 64, 253–260. [Google Scholar] [CrossRef]
- Eliáš, P. From Vegetation Functions to Ecosystem Services. Životn. Prostr. 2010, 44, 59–64. [Google Scholar]
- Smith, P.; Cotrufo, M.F.; Rumpel, C.; Paustian, K.; Kuikman, P.J.; Elliott, J.A.; McDowell, R.; Griffiths, R.I.; Asakawa, S.; Bustamante, M.; et al. Biogeochemical cycles and biodiversity as key drivers of ecosystem services provided by soils. Soil 2015, 1, 665–685. [Google Scholar] [CrossRef]
- Schwartz, C.; Shaaban, M.; Bellingrath-Kimura, S.D.; Piorr, A. Participatory mapping of demand for ecosystem services in Agricultural Landscapes. Agriculture 2021, 11, 1193. [Google Scholar] [CrossRef]
- Costanza, R. Ecosystem Services: Multiple classification systems are needed. Biol. Conserv. 2008, 141, 350–352. [Google Scholar] [CrossRef]
- Carpenter, S.R.; Mooney, H.A.; Agard, J.; Capistrano, D.; DeFries, R.S.; Díaz, S.; Dietz, T.; Duraiappah, A.K.; Oteng-Yeboah, A.; Pereira, H.M.; et al. Science for Managing Ecosystem Services: Beyond the Millennium Ecosystem Assessment. Proc. Natl. Acad. Sci. USA 2009, 106, 1305–1312. [Google Scholar] [CrossRef] [PubMed]
- Feld, C.K.; Martins da Silva, P.; Paulo Sousa, J.Ã.; de Bello, F.; Bugter, R.; Grandin, U.; Hering, D.; Lavorel, S.; Mountford, O.; Pardo, I.; et al. Indicators of biodiversity and ecosystem services: A synthesis across ecosystems and spatial scales. Oikos 2009, 118, 1862–1871. [Google Scholar] [CrossRef]
- Hou, Y.; Burkhard, B.; Müller, F. Uncertainties in Landscape Analysis and Ecosystem Service Assessment. J. Environ. Manag. 2013, 127, 117–131. [Google Scholar] [CrossRef] [PubMed]
- Tixier, P.; Peyrard, N.; Aubertot, J.N.; Gaba, S.; Radoszycki, J.; Caron-Lormier, G.; Vinatier, F.; Mollot, G.; Sabbadin, R. Modelling Interaction Networks for enhanced ecosystem services in Agroecosystems. Adv. Ecol. Res. 2013, 49, 437–480. [Google Scholar] [CrossRef]
- Desta, M.A.; Zeleke, G.; Payne, W.A.; Abebe, W.B. Impact of rice expansion on traditional wetland management in the tropical highlands of Ethiopia. Agriculture 2022, 12, 1055. [Google Scholar] [CrossRef]
- Xie, H.; Zhang, Y.; Choi, Y.; Li, F. A scientometrics review on Land Ecosystem Service Research. Sustainability 2020, 12, 2959. [Google Scholar] [CrossRef]
- Adhikari, K.; Hartemink, A.E. Linking soils to Ecosystem Services—A global review. Geoderma 2016, 262, 101–111. [Google Scholar] [CrossRef]
- Vrebos, D.; Staes, J.; Vandenbroucke, T.; D’Haeyer, T.; Johnston, R.; Muhumuza, M.; Kasabeke, C.; Meire, P. Mapping Ecosystem Service flows with land cover scoring maps for data-scarce regions. Ecosyst. Serv. 2015, 13, 28–40. [Google Scholar] [CrossRef]
- Maes, J.; Braat, L.; Jax, K.; Hutchins, M.; Furman, E.; Termansen, M.; Luque, S.; Paracchini, M.; Chauvin, C.; Williams, R.; et al. A Spatial Assessment of Ecosystem Services in Europe: Methods, Case Studies and Policy Analysis—Phase 1; PEER Report no. 3.; Partnership for European Environmental Research: Ispra, Italy, 2011. [Google Scholar]
- Braat, L.C.; de Groot, R. The Ecosystem Services Agenda: Bridging the worlds of natural science and economics, conservation and development, and public and private policy. Ecosyst. Serv. 2012, 1, 4–15. [Google Scholar] [CrossRef]
- Crossman, N.D.; Burkhard, B.; Nedkov, S.; Willemen, L.; Petz, K.; Palomo, I.; Drakou, E.G.; Martín-Lopez, B.; McPhearson, T.; Boyanova, K.; et al. A blueprint for mapping and Modelling Ecosystem Services. Ecosyst. Serv. 2013, 4, 4–14. [Google Scholar] [CrossRef]
- Nieto-Romero, M.; Oteros-Rozas, E.; González, J.A.; Martín-López, B. Exploring the knowledge landscape of ecosystem services assessments in Mediterranean Agroecosystems: Insights for Future Research. Environ. Sci. Policy 2014, 37, 121–133. [Google Scholar] [CrossRef]
- Alam, M.; Dupras, J.; Messier, C. A framework towards a composite indicator for urban ecosystem services. Ecol. Indic. 2016, 60, 38–44. [Google Scholar] [CrossRef]
- Seják, J.; Dejmal, I.; Petříček, V.; Cudlín, P.; Míchal, I.; Černý, K.; Kučera, T.; Vyskot, I.; Strejček, J.; Cudlínová, E.; et al. Assessment and Evaluation of Biotopes in the Czech Republic; AOPK: Praha, Czech Republic, 2003. (In Czech) [Google Scholar]
- Grêt-Regamey, A.; Bishop, I.D.; Bebi, P. Predicting the scenic beauty value of mapped landscape changes in a mountainous region through the use of GIS. Environ. Plan. B Plan. Des. 2007, 34, 50–67. [Google Scholar] [CrossRef]
- Kandziora, M.; Burkhard, B.; Müller, F. Interactions of ecosystem properties, ecosystem integrity and Ecosystem Service Indicators—A theoretical matrix exercise. Ecol. Indic. 2013, 28, 54–78. [Google Scholar] [CrossRef]
- Nahuelhual, L.; Carmona, A.; Lozada, P.; Jaramillo, A.; Aguayo, M. Mapping recreation and ecotourism as a cultural ecosystem service: An application at the local level in southern Chile. Appl. Geogr. 2013, 40, 71–82. [Google Scholar] [CrossRef]
- Nelson, E.; Mendoza, G.; Regetz, J.; Polasky, S.; Tallis, H.; Cameron, D.R.; Chan, K.M.A.; Daily, G.C.; Goldstein, J.; Kareiva, P.M.; et al. Modeling multiple ecosystem services, biodiversity conservation, commodity production, and tradeoffs at Landscape Scales. Front. Ecol. Environ. 2009, 7, 4–11. [Google Scholar] [CrossRef]
- Burkhard, B.; Crossman, N.; Nedkov, S.; Petz, K.; Alkemade, R. Mapping and modelling ecosystem services for science, policy and practice. Ecosyst. Serv. 2013, 4, 1–3. [Google Scholar] [CrossRef]
- Funes, I.; Savé, R.; Rovira, P.; Molowny-Horas, R.; Alcañiz, J.M.; Ascaso, E.; Herms, I.; Herrero, C.; Boixadera, J.; Vayreda, J. Agricultural Soil Organic Carbon Stocks in the north-eastern Iberian Peninsula: Drivers and spatial variability. Sci. Total Environ. 2019, 668, 283–294. [Google Scholar] [CrossRef]
- Jobbagy, E.G.; Jackson, R.B. The vertical distribution of soil organic carbon and its relation to climate and vegetation. Ecol. Appl. 2000, 10, 423–436. [Google Scholar] [CrossRef]
- Krkoška Lorencová, E.; Harmáčková, Z.V.; Landová, L.; Pártl, A.; Vačkář, D. Assessing impact of land use and climate change on regulating ecosystem services in the Czech Republic. Ecosyst. Health Sustain. 2016, 2, e01210. [Google Scholar] [CrossRef]
- Kanianska, R.; Jaďuďová, J.; Makovníková, J.; Kizeková, M.; Tomaškin, J. Ecosystem Services (Ekosystémové Služby); Belianum: Banská Bystrica, Slovakia, 2016. (In Slovak) [Google Scholar]
- Egoh, B.; Reyers, B.; Rouget, M.; Richardson, D.M.; Le Maitre, D.C.; van Jaarsveld, A.S. Mapping Ecosystem Services for Planning and Management. Agric. Ecosyst. Environ. 2008, 127, 135–140. [Google Scholar] [CrossRef]
- McBratney, A.; Field, D.J.; Koch, A. The dimensions of Soil Security. Geoderma 2014, 213, 203–213. [Google Scholar] [CrossRef]
- Yang, Y.; Tilman, D.; Furey, G.; Lehman, C. Soil carbon sequestration accelerated by restoration of grassland biodiversity. Nat. Commun. 2019, 10, 718. [Google Scholar] [CrossRef] [PubMed]
- Montoya, J.M.; Raffaelli, D. Climate change, biotic interactions and ecosystem services. Philos. Trans. R. Soc. B Biol. Sci. 2010, 365, 2013–2018. [Google Scholar] [CrossRef]
- Birkhofer, K.; Wolters, V. The global relationship between climate, net primary production and the Diet of spiders. Glob. Ecol. Biogeogr. 2011, 21, 100–108. [Google Scholar] [CrossRef]
- Diehl, E.; Sereda, E.; Wolters, V.; Birkhofer, K. Effects of predator specialization, host plant and climate on biological control of aphids by natural enemies: A meta-analysis. J. Appl. Ecol. 2013, 50, 262–270. [Google Scholar] [CrossRef]
- Balzan, M.V.; Sadula, R.; Scalvenzi, L. Assessing ecosystem services supplied by Agroecosystems in Mediterranean Europe: A literature review. Land 2020, 9, 245. [Google Scholar] [CrossRef]
- Ellili-Bargaoui, Y.; Malone, B.P.; Michot, D.; Minasny, B.; Vincent, S.; Walter, C.; Lemercier, B. Comparing three approaches of spatial disaggregation of legacy soil maps based on the disaggregation and harmonisation of soil map units through Resampled classification trees (DSMART) algorithm. Soil 2020, 6, 371–388. [Google Scholar] [CrossRef]
- Robinson, D.A.; Emmett, B.A.; Reynolds, B.; Rowe, E.C.; Spurgeon, D.; Keith, A.M.; Lebron, I.; Hockley, N. Soil Natural Capital and Ecosystem Service Delivery in a world of Global Soil Change. Soils Food Secur. 2012, 35, 41–68. [Google Scholar] [CrossRef]
- Makovníková, J.; Pálka, B.; Širáň, M.; Kanianska, R.; Kizeková, M.; Jaďuďová, J. Modeling and Evaluation Agroecosystem Services; Belianum: Banská Bystrica, Slovakia, 2017; pp. 15–16. (In Slovak) [Google Scholar]
- Makovníková, J.; Pálka, B.; Širáň, M.; Houšková, B.; Kanianska, R.; Kizeková, M. Ecosystem services in differently used agroecosystems along a climatic gradient in Slovakia. Open J. Ecol. 2018, 8, 623–645. [Google Scholar] [CrossRef]
- De Groot, R.S.; Fisher, B.; Christie, M.; Aronson, J.; Braat, L.; Haines-Young, R.; Gowdy, J.; Maltby, E.; Neuville, A.; Polasky, S.; et al. Integrating the Ecological and Economic Dimensions in Biodiversity and Ecosystem Services Valuation. In The Economics of Ecosystems and Biodiversity: Ecological and Economic Foundations; Kumar, P., Ed.; Earthscan: London, UK, 2010. [Google Scholar]
- Gómez-Sal, A.; Belmontes, J.A.; Nicolau, J.M. Assessing landscape values: A proposal for a multidimensional conceptual model. Ecol. Model. 2003, 168, 319–341. [Google Scholar] [CrossRef]
- Chan, K.M.; Guerry, A.D.; Balvanera, P.; Klain, S.; Satterfield, T.; Basurto, X.; Bostrom, A.; Chuenpagdee, R.; Gould, R.; Halpern, B.S.; et al. Where are cultural and social in ecosystem services? A framework for constructive engagement. BioScience 2012, 62, 744–756. [Google Scholar] [CrossRef]
- Jacobs, S.; Burkhard, B.; Van Daele, T.; Staes, J.; Schneiders, A. ‘The Matrix Reloaded’: A Review of Expert Knowledge Use for Mapping Ecosystem Services. Ecol. Model. 2015, 295, 21–30. [Google Scholar] [CrossRef]
- Girardin, P.; Bockstaller, C.; Werf, H.V. Indicators: Tools to evaluate the environmental impacts of farming systems. J. Sustain. Agric. 1999, 13, 5–21. [Google Scholar] [CrossRef]
- Seják, J.; Cudlín, P.; Pokorný, J.; Zapletal, M.; Petŕíček, V.; Guth, J.; Chuman, T.; Romportl, D.; Skořepová, I.; Vacek, V.; et al. Evaluation of Functions and Services of the Ecosystem of the Czech Republic; FŽP UJEP: Ústí nad Labem, Czech Republic, 2010. (In Czech) [Google Scholar]
- Makovníková, J.; Pálka, B.; Kološta, S.; Flaška, F.; Orságová, K.; Spišiaková, M. Non-monetary assessment and mapping of the potential of agroecosystem services in rural Slovakia. Eur. Countrys. 2020, 12, 257–276. [Google Scholar] [CrossRef]
- Lovell, S.T.; DeSantis, S.; Nathan, C.A.; Olson, M.B.; Ernesto Méndez, V.; Kominami, H.C.; Erickson, D.L.; Morris, K.S.; Morris, W.B. Integrating agroecology and landscape multifunctionality in Vermont: An evolving framework to evaluate the design of Agroecosystems. Agric. Syst. 2010, 103, 327–341. [Google Scholar] [CrossRef]
- Frélichová, J.; Fanta, J. Ecosystem Service Availability in View of Long-Term Land-Use Changes: A Regional Case Study in the Czech Republic. Ecosyst. Health Sustain. 2015, 1, 1–15. [Google Scholar] [CrossRef]
- Bujnovský, R.; Balkovič, J.; Barančíková, G.; Makovníková, J.; Vilček, J. Assessment and Valuation of Ecological Functions of Agricultural Land in Slovakia; Soil Science and Conservation Research Institute: Bratislava, Slovakia, 2009. (In Slovak) [Google Scholar]
- Wischmeier, W.H.; Smith, D.D. Predicting Rainfall Erosion Losses. A Guide to Conservation Planning; The USDA Agricultural Handbook No. 537; Department of Agriculture, Science and Education Administration: Annapolis, MD, USA, 1978.
- Styk, J.; Pálka, B. The Potential Threat of Agricultural Soils of the Slovak Republic to Water Erosion Evaluated Using the USLE Empirical Model. VII. Congress of the Slovak Society for Agricultural, Forestry, Food and Veterinary Sciences; Research Institute of Soil Science and Soil Protection: Bratislava, Slovakia, 2005; pp. 73–77. (In Slovak) [Google Scholar]
- Makovníková, J.; Barančíková, G.; Pálka, B. Approach to the assessment of transport risk of inorganic pollutants based on the immobilisation capability of Soil. Plant Soil Environ. 2007, 53, 365–373. [Google Scholar] [CrossRef]
- Makovníková, J.; Pálka, B.; Širáň, M.; Houšková, B.; Kanianska, R.; Kizeková, M. An approach to the assessment of regulating agroecosystem services. Pol. J. Soil Sci. 2019, 52, 95. [Google Scholar] [CrossRef]
- Kizeková, M.; Hopkins, A.; Kanianska, R.; Makovníková, J.; Pollák, Š.; Pálka, B. Changes in the area of permanent grassland and its implications for the provision of bioenergy: Slovakia as a case study. Grass Forage Sci. 2017, 73, 218–232. [Google Scholar] [CrossRef]
- Džatko., M.; Mašáť., K.; Cambel, B. Agro-Climatic Regions of Slovakia; Final Report; Soil Fertility Research Centre—Soil Science and Plant Nutrition Research Institute: Bratislava, Slovakia, 1989. [Google Scholar]
- Bommarco, R.; Vico, G.; Hallin, S. Exploiting ecosystem services in agriculture for increased food security. Glob. Food Secur. 2018, 17, 57–63. [Google Scholar] [CrossRef]
- Barančíková, G.; Tobiašová, E.; Gömöryová, E.; Makovníková, J.; Halas, J.; Koco, Š.; Skalský, R. Influence of soil type and land use on soil organic matter in climate conditions of West Carpathian Mts. and Pannonian basin. Silva Balc. 2019, 20, 63–70. [Google Scholar]
- Koven, C.D.; Hugelius, G.; Lawrence, D.M.; Wieder, W.R. Higher climatological temperature sensitivity of soil carbon in cold than warm climates. Nat. Clim. Chang. 2017, 7, 817–822. [Google Scholar] [CrossRef]
- Smith, P. How long before a change in soil organic carbon can be detected? Glob. Chang. Biol. 2004, 10, 1878–1883. [Google Scholar] [CrossRef]
- Hobley, E.; Wilson, B.; Wilkie, A.; Gray, J.; Koen, T. Drivers of soil organic carbon storage and vertical distribution in eastern Australia. Plant Soil 2015, 390, 111–127. [Google Scholar] [CrossRef]
- Allen, D.E.; Pringle, M.J.; Bray, S.; Hall, T.J.; O’Reagain, P.O.; Phelps, D.; Cobon, D.H.; Bloesch, P.M.; Dalal, R.C. What determines soil organic carbon stocks in the grazing lands of North-eastern Australia? Soil Res. 2013, 51, 695. [Google Scholar] [CrossRef]
- Wiesmeier, M.; Urbanski, L.; Hobley, E.; Lang, B.; von Lützow, M.; Marin-Spiotta, E.; van Wesemael, B.; Rabot, E.; Ließ, M.; Garcia-Franco, N.; et al. Soil Organic Carbon Storage as a key function of soils—A review of drivers and indicators at various scales. Geoderma 2019, 333, 149–162. [Google Scholar] [CrossRef]
- Vilček, J. Mapping and evaluation of the environmental functions of agricultural soils in Slovakia (In Slovak). Institute of Geography SAS. Geogr. J. 2014, 66, 287–304. [Google Scholar]
- Mederly, P.; Černecký, J.; Špulerová, J.; Izakovičová, Z.; Ďuricová, V.; Považan, R.; Švajda, J.; Močko, M.; Jančovič, M.; Gusejnov, S.; et al. National Ecosystem Services Assessment in Slovakia—Meeting old liabilities and introducing new methods. One Ecosyst. 2020, 5, e53677. [Google Scholar] [CrossRef]
- Sutri, M.; Shanskiy, M.; Ivask, M.; Reintam, E. The assessment of soil quality in contrasting land-use and tillage systems on farm fields with STAGNIC Luvisol soil in Estonia. Agriculture 2022, 12, 2149. [Google Scholar] [CrossRef]
- Guo, L.B.; Gifford, R.M. Soil Carbon Stocks and land use change: A meta analysis. Glob. Change Biol. 2002, 8, 345–360. [Google Scholar] [CrossRef]
- Poeplau, C.; Don, A.; Vesterdal, L.; Leifeld, J.; Van Wesemael, B.; Schumacher, J.; Gensior, A. Temporal Dynamics of soil organic carbon after land-use change in the temperate zone-carbon response functions as a model approach. Glob. Change Biol. 2011, 17, 2415–2427. [Google Scholar] [CrossRef]
- Poeplau, C.; Don, A. Carbon sequestration in agricultural soils via cultivation of cover crops—A meta-analysis. Agric. Ecosyst. Environ. 2015, 200, 33–41. [Google Scholar] [CrossRef]
- Wei, X.; Shao, M.; Gale, W.; Li, L. Global pattern of soil carbon losses due to the conversion of forests to agricultural land. Sci. Rep. 2014, 4, 4062. [Google Scholar] [CrossRef]
- Maillard, É.; Angers, D.A. Animal manure application and Soil Organic Carbon Stocks: A meta-analysis. Glob. Change Biol. 2013, 20, 666–679. [Google Scholar] [CrossRef]
- Schils, R.; Kuikman, P.; Liski, J.; Van Oijen, M.; Smith, P.; Webb, J.; Alm, J.; Somogyi, Z.; Van den Akker, J.; Billett, M.; et al. Review of Existing Information on the Interrelations between Soil and Climate Change. (ClimSoil). Final Report. Available online: https://nora.nerc.ac.uk/id/eprint/6452 (accessed on 5 March 2023).
- Šarapatka, B.; Alvarado-Solano, D.P.; Čižmár, D. Can glomalin content be used as an indicator for erosion damage to soil and related changes in organic matter characteristics and nutrients? Catena 2019, 181, 104078. [Google Scholar] [CrossRef]
- Balková, M.; Kubalíková, L.; Prokopová, M.; Sedlák, P.; Bajer, A. Ecosystem services of vegetation features as the multifunction anti-erosion measures in the Czech Republic in 2019 and its 30-year prediction. Agriculture 2021, 11, 105. [Google Scholar] [CrossRef]
- Hamzehpour, N.; Shafizadeh-Moghadam, H.; Valavi, R. Exploring the driving forces and digital mapping of soil organic carbon using remote sensing and soil texture. Catena 2019, 182, 104141. [Google Scholar] [CrossRef]
- Tayebi, M.; Fim Rosas, J.T.; de Mendes, W.; Poppiel, R.R.; Ostovari, Y.; Ruiz, L.F.; dos Santos, N.V.; Cerri, C.E.; Silva, S.H.; Curi, N.; et al. Drivers of organic carbon stocks in different LULC history and along soil depth for a 30 years image time series. Remote Sens. 2021, 13, 2223. [Google Scholar] [CrossRef]
- Arrouays, D.; Saby, N.; Walter, C.; Lemercier, B.; Schvartz, C. Relationships between particle-size distribution and organic carbon in French arable topsoils. Soil Use Manag. 2006, 22, 48–51. [Google Scholar] [CrossRef]
- Zinn, Y.L.; Lal, R.; Bigham, J.M.; Resck, D.V. Edaphic controls on soil organic carbon retention in the Brazilian cerrado: Texture and mineralogy. Soil Sci. Soc. Am. J. 2007, 71, 1204–1214. [Google Scholar] [CrossRef]
- Campbell, C.A.; Souster, W. Loss of Organic Matter and Potentially Mineralizable Nitrogen from Saskatchewan Soils Due to Cropping. Can. J. Soil Sci. 1982, 62, 651–656. [Google Scholar] [CrossRef]
- Schnitzer, M.; McArthur, D.F.E.; Schulten, H.R.; Kozak, L.M.; Huang, P.M. Long-term cultivation effects on the quantity and quality of organic matter in selected Canadian prairie soils. Geoderma 2006, 130, 141–156. [Google Scholar] [CrossRef]
- Burkhard, B.; Kroll, F.; Müller, F.; Windhorst, W. Landscapes’ capacities to provide ecosystem services—A concept for land-cover based assessments. Landsc. Online 2009, 15, 1–22. [Google Scholar] [CrossRef]
- Vačkář, D.; Grammatikopoulou, I.; Daněk, J.; Lorencová, E. Methodological aspects of ecosystem service valuation at the national level. One Ecosyst. 2018, 3, e25508. [Google Scholar] [CrossRef]
- Jäppinen, J.P.; Heliölä, J. Towards a Sustainable and Genuinely Green Economy. The Value and Social Significance of Ecosystem Services in Finland (TEEB for Finland); The Finnish Ministry of Environment: Helsinki, Finland, 2015.
- NEPA. Assessment of Ecosystems and Ecosystem Services in Romania; National Environmental Protection Agency: Baia Mare, Romania, 2017.
- Rabe, S.-E.; Koellner, T.; Marzelli, S.; Schumacher, P.; Grêt-Regamey, A. National Ecosystem Services mapping at multiple scales the German exemplar. Ecol. Indic. 2016, 70, 357–372. [Google Scholar] [CrossRef]
- Garnett, T.; Godfray, C. Sustainable Intensification in Agriculture. Navigating a Course through Competing Food System Priorities; Food Climate Research Network; The Oxford Martin Programme on the Future of Food; University of Oxford: Oxford, UK, 2012; 51p. [Google Scholar]


| Type of Regulation Ecosystem Service | Characteristics | Categorization |
|---|---|---|
| Potential of regulation of water regime (soil water storage) | Its values are given in mm and are based on the value of retention water capacity recalculated to soil water storage in context with the soil depth. Obtained from maps and databases from a comprehensive soil survey of the Slovak Republic [66]. | Values were categorized into five groups:
|
| Potential of regulation of soil erosion, regulation of water erosion | Values were derived from maps and databases based on empirical model of the universal soil loss equation–USLE [67,68]. The relative ratio of the calculated values of soil loss and acceptable erosion expresses the degree of soil erosion endangerment (SEOP value). | Values were categorized into five groups:
|
| Cleaning potential of agricultural land ecosystem | Cleaning potential of agricultural land ecosystem depends on the actual soil contamination and potential of soil sorbents, and was calculated as accumulative function: Cleaning potential = Sorption potential of soil + Potential of total content of inorganic contaminants (evaluated according to risk elements limits defined in Slovak Law 220/2004 Coll.; [69]. Point evaluation of Sorption potential (SP) of soil was calculated as a sum of quality factors (pH (0–4 points), Q46 (0–1 points) and quantity factors (Cox (0–1 points), H- depth of humus horizon (0–2 points)) according to the function: PS = F(pH) + F(Q46) + F(Cox) × F(H). The overall rating (expert scoring system based on factor analysis of individual indicators) is determined as a sum of the soil contamination and Sorption potential of soil. The high soil contamination was evaluated by the high point value and present high risk (0–5 points). High soil Sorption potential results in low point value and decreases possible risk transport of harmful elements into the soil. | Sum of values was categorized into five groups:
|
| Climate regulation | Within agroecosystems of agricultural land, soil organic matter represents the largest share of total organic carbon found in the soil. Agroecosystems contribute to climate regulation by sequestration of organic carbon in the soil. Soil organic carbon stock (SOCS) was calculated as a function: SOCS (depth 0–30 cm) in t. ha-1 = 10 × (BD (0–10 cm) × SOC (0–10 cm) + BD (10–20 cm) × SOC (10–20 cm) + BD (20–30 cm) × SOC (20–30 cm) BD–soil bulk density in g.cm-3, SOC–soil organic matter content in % [55,56]. | Sum of values was categorized into five groups:
|
| Stratification Level | Classification Element | Class | Classification Criteria |
|---|---|---|---|
| Climate | Climate region | C1 | very warm |
| C2 | warm | ||
| C3 | moderately warm | ||
| C4 | moderately cold | ||
| Land cover | Land cover class | A | Arable land |
| G | Grassland: permanent pastures, meadows, hope gardens, orchards, vineyards other agricultural land other agricultural land | ||
| Soil Texture | Content (%) of particle size fraction < 0.01 mm, a sum of physical clay (fr. < 0.001 mm) and fine silt (fr. 0.001–0.01 mm) | C | Coarse: <30% |
| M | Medium: 30–45% | ||
| F | Fine: >45% | ||
| Slope | Slope (°) | S1 | <2.0° |
| S2 | 2.0–5.0° | ||
| S3 | 5.1–12.0° | ||
| S4 | >12.0° |
| Climatic Region | Potential of Regulation (Point Value) | ||||
|---|---|---|---|---|---|
| Water | Erosion | Cleaning Potential | Climate | ||
| C1 | Average | 15.40 | 22.20 | 22.40 | 12.80 |
| Minimum | 5.00 | 5.00 | 20.00 | 5.00 | |
| Maximum | 25.00 | 25.00 | 25.00 | 25.00 | |
| C2 | Average | 18.91 | 22.82 | 11.95 | 12.82 |
| Minimum | 10.00 | 15.00 | 5.00 | 5.00 | |
| Maximum | 25.00 | 25.00 | 15.00 | 25.00 | |
| C3 | Average | 9.80 | 16.40 | 9.40 | 8.20 |
| Minimum | 5.00 | 5.00 | 5.00 | 5.00 | |
| Maximum | 20.00 | 25.00 | 15.00 | 25.00 | |
| C4 | Average | 7.29 | 16.45 | 10.62 | 19.37 |
| Minimum | 5.00 | 5.00 | 5.00 | 10.00 | |
| Maximum | 15.00 | 25.00 | 15.00 | 25.00 | |
| Land Cover | Potential of Regulation (Point Value) | ||||
|---|---|---|---|---|---|
| Water | Erosion | Cleaning Potential | Climate | ||
| A | Average | 14.25 | 20.42 | 13.29 | 7.23 |
| Minimum | 5.00 | 5.00 | 5.00 | 5.00 | |
| Maximum | 25.00 | 25.00 | 25.00 | 15.00 | |
| G | Average | 11.40 | 18.50 | 14.00 | 18.90 |
| Minimum | 5.00 | 5.00 | 5.00 | 10.00 | |
| Maximum | 25.00 | 25.00 | 25.00 | 25.00 | |
| Soil Texture | Potential of Regulation (Point Value) | ||||
|---|---|---|---|---|---|
| Water | Erosion | Cleaning Potential | Climate | ||
| C | Average | 13.03 | 19.39 | 13.93 | 14.09 |
| Minimum | 5.00 | 5.00 | 5.00 | 5.00 | |
| Maximum | 25.00 | 25.00 | 25.00 | 25.00 | |
| M | Average | 11.87 | 20.00 | 13.43 | 12.65 |
| Minimum | 5.00 | 5.00 | 5.00 | 5.00 | |
| Maximum | 25.00 | 25.00 | 25.00 | 25.00 | |
| F | Average | 13.43 | 18.09 | 13.59 | 12.96 |
| Minimum | 5.00 | 5.00 | 5.00 | 5.00 | |
| Maximum | 25.00 | 25.00 | 25.00 | 25.00 | |
| Soil Slope | Potential of Regulation (Point Value) | ||||
|---|---|---|---|---|---|
| Water | Erosion | Cleaning Potential | Climate | ||
| S12 | Average | 14.21 | 21.47 | 15.00 | 13.26 |
| Minimum | 5.00 | 5.00 | 10.00 | 5.00 | |
| Maximum | 25.00 | 25.00 | 25.00 | 25.00 | |
| S34 | Average | 11.20 | 17.17 | 12.17 | 12.82 |
| Minimum | 5.00 | 5.00 | 5.00 | 5.00 | |
| Maximum | 25.00 | 25.00 | 25.00 | 25.00 | |
| Measure | Stratification Level | Kruskal-Wallis Test |
|---|---|---|
| Regulation of water | Climate region | 1 |
| Land cover | 0 | |
| Soil texture | 1 | |
| Slope | 1 | |
| Regulation of soil erosion | Climate region | 1 |
| Land cover | 0 | |
| Soil texture | 1 | |
| Slope | 1 | |
| Cleaning potential | Climate region | 1 |
| Land cover | 0 | |
| Soil texture | 1 | |
| Slope | 1 | |
| Climate regulation | Climate region | 1 |
| Land cover | 1 | |
| Soil texture | 0 | |
| Slope | 0 | |
| Complete regulating ESS | Climate region | 1 |
| Land cover | 1 | |
| Soil texture | 0 | |
| Slope | 1 |
| Region | Climate Land Cover Slope | Water | Erosion | Cleaning Potential | Climate | Ecosystem Services | ||
|---|---|---|---|---|---|---|---|---|
| A | C1 | A | S12 | 17.50 | 23.33 | 24.16 | 5.00 | 70.00 |
| B | C1 | A | S34 | 18.33 | 23.33 | 21.67 | 5.00 | 68.33 |
| C | C1 | G | S12 | 14.29 | 23.57 | 23.57 | 20.00 | 81.43 |
| D | C1 | G | S34 | 11.67 | 18.33 | 20.00 | 20.00 | 70.00 |
| E | C2 | A | S12 | 23.33 | 24.17 | 13.33 | 5.00 | 65.83 |
| F | C2 | A | S34 | 17.00 | 23.00 | 10.00 | 5.00 | 55.00 |
| G | C2 | G | S12 | 18.57 | 22.14 | 13.57 | 20.00 | 74.29 |
| H | C2 | G | S34 | 16.00 | 22.00 | 10.00 | 20.00 | 68.00 |
| A1 | C3 | A | S12 | 13.33 | 20.00 | 10.00 | 5.00 | 48.33 |
| B1 | C3 | A | S34 | 9.17 | 15.00 | 7.50 | 5.00 | 36.67 |
| C1 | C3 | G | S12 | 10.00 | 18.57 | 12.14 | 10.00 | 52.86 |
| D1 | C3 | G | S34 | 6.67 | 11.67 | 7.50 | 10.00 | 35.83 |
| E1 | C4 | A | S12 | 9.17 | 23.33 | 10.00 | 15.00 | 57.50 |
| F1 | C4 | A | S34 | 6.67 | 11.67 | 9.17 | 12.50 | 40.00 |
| G1 | C4 | G | S12 | 7.50 | 16.67 | 12.50 | 25.00 | 61.67 |
| H1 | C4 | G | S34 | 5.83 | 14.17 | 10.83 | 25.00 | 55.83 |
Disclaimer/Publisher’s Note: The statements, opinions and data contained in all publications are solely those of the individual author(s) and contributor(s) and not of MDPI and/or the editor(s). MDPI and/or the editor(s) disclaim responsibility for any injury to people or property resulting from any ideas, methods, instructions or products referred to in the content. |
© 2023 by the authors. Licensee MDPI, Basel, Switzerland. This article is an open access article distributed under the terms and conditions of the Creative Commons Attribution (CC BY) license (https://creativecommons.org/licenses/by/4.0/).
Share and Cite
Makovníková, J.; Kološta, S.; Flaška, F.; Pálka, B. Factors Influencing the Spatial Distribution of Regulating Agro-Ecosystem Services in Agriculture Soils: A Case Study of Slovakia. Agriculture 2023, 13, 970. https://doi.org/10.3390/agriculture13050970
Makovníková J, Kološta S, Flaška F, Pálka B. Factors Influencing the Spatial Distribution of Regulating Agro-Ecosystem Services in Agriculture Soils: A Case Study of Slovakia. Agriculture. 2023; 13(5):970. https://doi.org/10.3390/agriculture13050970
Chicago/Turabian StyleMakovníková, Jarmila, Stanislav Kološta, Filip Flaška, and Boris Pálka. 2023. "Factors Influencing the Spatial Distribution of Regulating Agro-Ecosystem Services in Agriculture Soils: A Case Study of Slovakia" Agriculture 13, no. 5: 970. https://doi.org/10.3390/agriculture13050970