Article

Design and Motion Process of Air-Sieve Castor Cleaning Device Based on Discrete Element Method

College of Engineering, Shenyang Agricultural University, 120 Dongling Road, Shenhe District, Shenyang 110866, China
*
Author to whom correspondence should be addressed.
Agriculture 2023, 13(6), 1130; https://doi.org/10.3390/agriculture13061130
Submission received: 14 April 2023 / Revised: 23 May 2023 / Accepted: 24 May 2023 / Published: 27 May 2023
(This article belongs to the Section Agricultural Technology)

Abstract

:
In order to improve the cleaning effect of the castor shelling mixture, an air-sieve castor cleaning device was developed. The structure of the cleaning device was optimized by experiment and simulation based on the discrete element method. The results show that the sieving efficiency of the square distribution is 98.23% and the loss rate is 2.39%, both of which are better than the triangular distribution. The sieving efficiency in the condition of a 14 mm sieve hole diameter is 98.23%. For the conditions of 15 mm and 16 mm sieve hole diameters, the sieving efficiencies are 96.64% and 96.69%, respectively. Therefore, a sieve hole diameter of 14 mm is more beneficial for the sieving of castor capsules. The sieving efficiency is 94.0–99.5%, and the loss rate is 0.5–3.0% under 5–9° sieve inclination. The cleaning effect is better through comprehensive analysis when the sieve surface inclination is 8°. The parameters of maximum sieving efficiency combination, minimum loss rate combination, and optimal cleaning effect were obtained by optimizing the operating parameters of the cleaning device. The operating parameters were adjusted, and then the three combinations of parameters were tested. It is found that the impurity content of castor seeds is within 1%, which meets the requirements of the device design. This study can provide a reference for developing high-efficiency castor cleaning devices.

1. Introduction

Castor has a high oil content, which exhibits a low freezing point, severe cold resistance, and high-temperature resistance. Its oil is one of the leading industrial oils. The demand for industrial oil is increasing with the rapid development of modern industry, which has led to the rapid growth of the castor industry [1]. Despite the potential benefits of castor harvesting, the mechanization level remains low due to inadequate studies on castor shelling mixture and cleaning devices. Existing cleaning devices have shown poor applicability and cleaning effect, which hinders the development of the castor industry [2]. Therefore, it is critical to urgently improve the level of mechanization of castor cleaning devices.
The cleaning device’s performance directly affects the machine’s working performance [3]. Gebrehiwot et al. [4] divided one air outlet into two air outlets to design the air-sieve separation cleaning device. It can increase the outlet amplitude at the outlet impeller position. The number of air inlets in the cleaning device will significantly affect the uniformity of the airflow after verification. Yang et al. [5] designed a biaxial flow corn threshing device with a spiral sieve. The optimal operating parameters of the machine showed that the forward speed was 0.61 m/s, the speed of the threshing drum was 500 r/min, and the threshing gap was 40 mm. The minimum breakage and non-threshing rates in the field validation test were 1.47% and 0.89%, respectively. Wang et al. [6] designed a novel staggered wave bionic sieve based on an earthworm profile. The bionic vibrating sieve shortened the sieving time and increased the sieving efficiency compared with the planar reciprocating vibrating sieve. Gao et al. [7] studied the movement of corn on a three-dimensional vibrating sieve. In the analysis process, there was no accumulation of material on the sieve, which can improve work efficiency. Xiao et al. [8] proposed a new vibration machine based on the manual sieving principle. The motion of the sieve leads to the material being sieved widely while penetrating along the sieve length, thus augmenting both sieving efficiency and processing capability. Li et al. [9] applied the particle swarm optimization algorithm to optimize the parameters of the double-layer vibrating sieve. The optimization parameters of sieving were obtained as a sieve inclination angle of 6.3°, an amplitude of 2.6 mm, a vibration frequency of 22.2 Hz, and a vibration direction angle of 35°. The feasibility of the parameters is verified by the experimental prototype.
Ma et al. [10,11] developed a pendulum rod-type variable amplitude device to analyze the material movement process on the variable amplitude sieve. It can make the material move back faster than the ordinary sieve, which solves the problem that the material is easy to block. Zhou et al. [12] designed a conical fan to improve the situation of material accumulation. The mass of the material at the accumulation part of the conical fan was reduced by 27.66% when compared with the cylindrical fan. The application of a harvester in conjunction with a conical fan can increase the loss rate, impurity content, and crushing rate. Xu et al. [13] optimized the ball frame of the installed cleaning sieve to increase the sorting efficiency of wheat, rice, and corn seeds by 5.6%, 10%, and 3.2%, respectively. Shen et al. [14] optimized the shape of the vibrating sieve surface. The sieving performance of the new curved sieve was significantly better than that of the commonly applied vibrating sieve. The sieving efficiency per unit of time was improved by 8–10% compared to that of the ordinary vibrating sieve. Li et al. [15] designed an integrated vertical axial flow threshing and separating device. The problem of the complex structure and easy blockage of the conveying device was solved. It allowed the rape to be transported evenly. It can make the rape uniform in transport and threshing separation. Aldoshin et al. [16] proposed the design of a louver with the shape S, which has lower resistance to airflow and can effectively reduce the loss rate of materials. Wang et al. [17] designed a driving device that could realize three movements and two rotations of the cleaning sieve. The sieve penetration rate of corn seeds on the sieve surface of the device was 5.75% higher than that on the plane reciprocating vibrating sieve. Some researchers analyzed the sieving efficiency of different sieves for different crops. The results are shown in Table 1.
There are a few studies on the cleaning device for the castor shelling mixture. However, for similar crops such as rice, rape, and corn, the primary method is to improve the cleaning effect of materials by optimizing the overall design structure. The castor cleaning devices suffer from issues such as a high seed loss rate, an elevated impurity rate, and low sieving efficiency. Therefore, the double-layer synchronous reciprocating vibrating sieve was improved for the cleaning of the castor shelling mixture. The upper and lower decks of the sieve have been improved with different sieve hole diameters to prevent material clogging and enhance cleaning efficiency.
The study on airflow distribution in the cleaning device helps study the movement state of the material. The factors that affect the sieving efficiency can be obtained, which has a significant effect on the improvement of the material sieving effect. Tabatabaifar et al. [24] photographed the movement of seed-extruded objects during the cleaning process through a high-speed camera. It was found that particles passed through the sieve at a specific airflow rate of 1.6–2.2 m/s. Li et al. [25] applied a simulation method to study the velocity of the airflow field in the sieve hole. The collision motion model of the material and the simple harmonic vibrating sieve surface are established. The non-linear movement law of the material was analyzed. The conclusion that the sieving rate can be improved in a state of chaotic movement was drawn. Wang et al. [26] designed a countersunk sieve to improve the penetration efficiency of corn seeds. The sieving efficiency of the cleaning device was highest when the air velocity was 11.2 m/s. Li et al. [27] studied the influence of the new sieve’s trapezoidal angle on the airflow. It was found that the airflow velocity increases gradually with an increase in the trapezoidal angle. Du et al. [28] carried out a numerical analysis of the gas flow field in the cleaning mechanism of rape harvesters. It was found that the influence of inlet angle was small and the influence of inlet wind speed was large. The results reflected the distribution of the airflow field in a more realistic way. Some researchers analyzed the airflow field in the fan or cleaning room based on the computational fluid dynamics (CFD) method. The main conclusions are shown in Table 2.
Many studies have demonstrated that the distribution of the airflow field within a cleaning device significantly impacts its cleaning efficiency. However, the position of the airflow and the size of the airflow speed have a considerable influence on the effectiveness of material cleaning. The motion law and force of the main components of the castor shelling mixture are analyzed in this study. The relationship between the material’s acceleration and the sieve surface’s motion parameters is investigated. The results provide the theoretical basis for designing the castor desiccant cleaning device and its key components.
Li et al. [34] obtained through discrete element method (DEM) analysis that the motility of relatively large particles enhanced the flowability of the particle assembly on the sieve, thereby improving the probability of undersized particles passing through the apertures. Davoodi et al. [35] simulated the sieving process with DEM. The effect of the aperture shape on sieving efficiency is not significant, but different sections on the sieve deck have different passage rates based on the aperture shape. Zhao et al. [36] established a virtual sieving experimental simulation system. The factors affecting the average velocity and height of the material were amplitude and vibration angle. Jiang et al. [37] concluded that the sieving efficiency was above 82% under different experimental conditions by simulating the material motion on a vibrating sieve. Feng et al. [38] studied the movement of materials in different sieving stages. The dispersion degree of particles is affected by the airflow velocity above the sieve. The maximum velocity of the airflow appears in the middle of the sieve. The dispersion degree of particles first decreases, then increases, and finally decreases with time. Chen et al. [39] optimized the sieving performance of the vibrating sieve through the vibration frequency, inclination angle, and motion direction of the sieve plate. It provided a basis for the performance improvement of the vibrating sieve. Xia et al. [40] optimized the configuration of linear sieving process parameters based on the co-optimization method. The parameter combination scheme can increase the sieving efficiency by 3.28%. Some researchers analyzed factors affecting sieving efficiency and methods to improve sieving efficiency for different vibrating sieves. The details are shown in Table 3.
The researchers developed several vibrating sieves based on the material characteristics of crops and analyzed their cleaning effects, including single-layer, double-layer, and cylinder sieves. The cleaning effect of a vibrating sieve varies depending on the crop. Therefore, the design of a particular cleaning device for the crop under study can significantly enhance the cleaning performance of the material. This paper presents an improvement to the double-layer synchronous vibrating sieve based on the material characteristics of the castor. It employs a combination of airflow and vibration to clean the castor shelling mixture. The sieve hole arrangement, sieve hole diameter, and inclination angle of the vibrating sieve are optimized in this study. The experiment is designed with the factors of amplitude, vibration frequency, and airflow transverse angle in mind, and physical verification is conducted. The results can serve as a reference for designing castor cleaning devices.

2. Materials and Methods

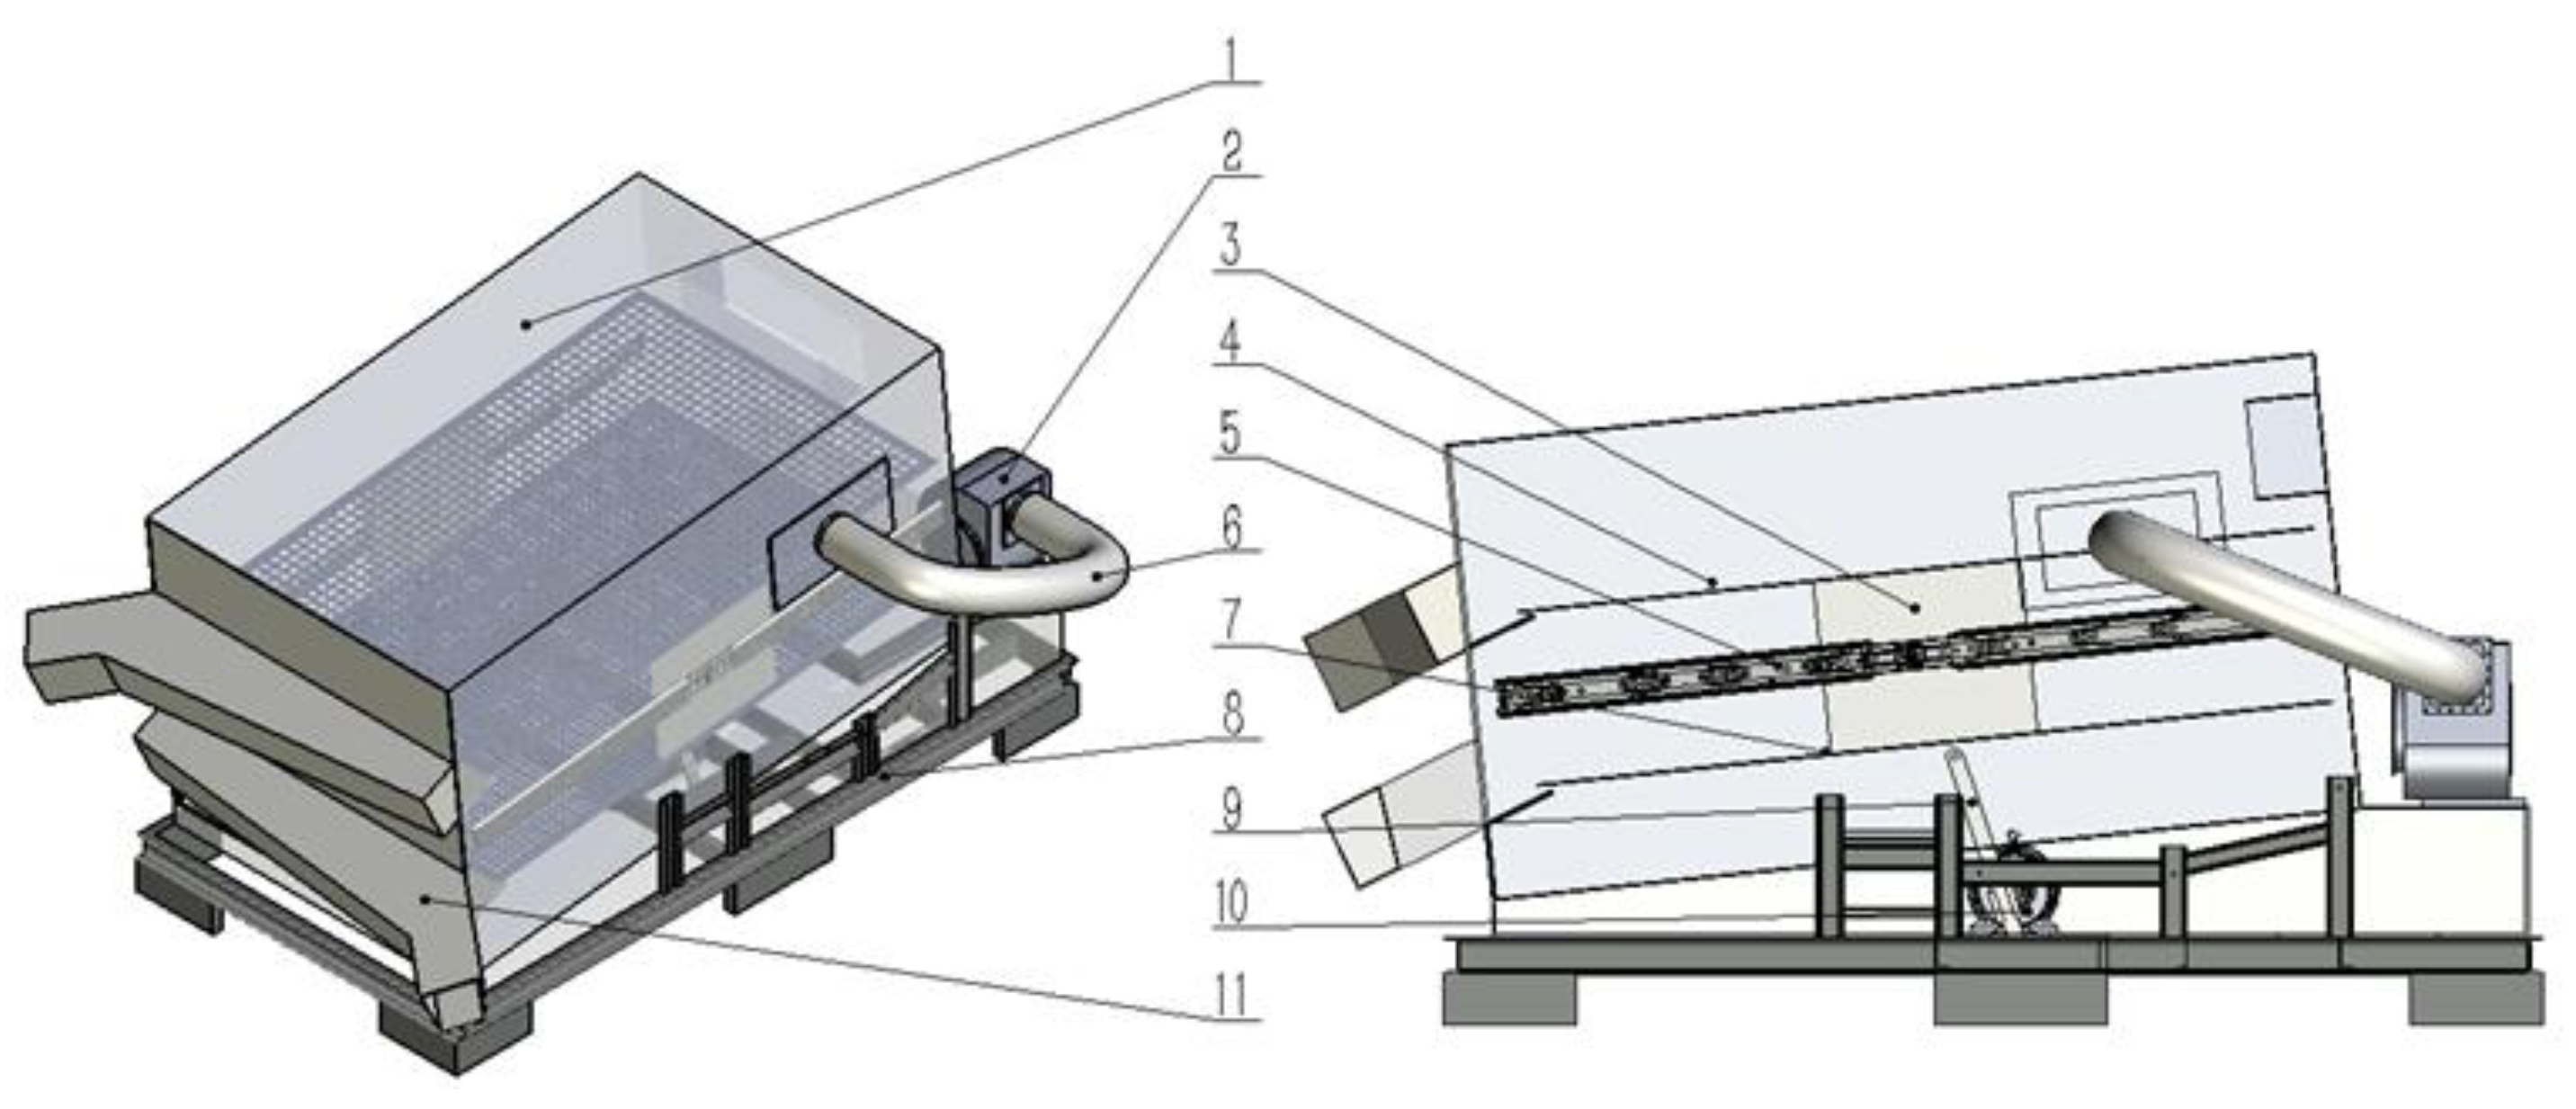
2.1. Cleaning Device and Working Principle

Various cleaning methods are commonly used, such as airflow cleaning, vibrating sieve cleaning, and a combination of airflow and vibration cleaning methods. This study focuses on improving the cleaning device for castor shelling mixture by utilizing a combination of airflow and vibration. The structure is shown in Figure 1. It is mainly composed of a cleaning room, vibrating sieve, discharge port, fan, crank rocker mechanism, motor, and rack. The outlet is arranged on the side wall of the cleaning room. The upper and lower vibrating sieves are connected by vertical plates fixed to the slide.
The cleaning device for separating the castor shelling mixture is powered by a motor. The motor drives the crank-rocker mechanism in a circular motion. The crank rocker drives the upper and lower vibrating sieves in a reciprocating motion, which is applied to separate the castor shelling mixture. Additionally, a fan is positioned near the inlet to enhance separation efficiency. The castor shelling mixture enters the cleaning room through the inlet. The mixture starts to separate under the action of the vibrating sieve and airflow. The vibrating sieve is provided with a certain angle, which can separate the mixture and ensure the sieving efficiency. After the materials are sieved, the larger castor capsules flow out from the upper discharge port. The castor seeds flow out of the middle discharge port. The shells fall to the bottom of the cleaning room and flow out from the lower discharge port.

2.2. Design of Cleaning Device Parameters

2.2.1. Determination of Castor Parameters

  • Content determination of castor shelling mixture
The castor shelling mixture mainly consists of seeds, shells, and unpeeled capsules. The unpeeled castor capsule can be simplified into the two-chambered castor capsule for simulation. The content of castor seeds in the mixture was 89.52%. The content of castor shells was 4.91%, and the content of the two-chambered castor capsule was 5.57% after the determination. The extrinsic geometrical dimensions of each component were measured. The vernier caliper was applied to calculate each component’s length, width, and height. The results are shown in Table 4.
2.
Determination of characteristic parameters of materials
This study collected data on the quality of 100 materials through random sampling. The suspension velocity of castor seeds, castor shells, and two-chambered castor capsules was measured using the material suspension test bench. The mechanical properties of each component in the castor shelling mixture were obtained by consulting existing data presented in Table 5.
3.
Determination of friction coefficient and recovery coefficient
There will be friction and collision between the two-chambered castor capsule, castor seeds, castor shells, and vibrating sieve in the cleaning device. The friction and collision recovery coefficients between materials are essential parameters in the discrete element simulation test. Therefore, measuring the static friction coefficient, dynamic friction coefficient, and collision recovery coefficient between different materials is necessary.
The two-chambered castor capsule, castor seeds, and castor shells are placed on a slope by the slope mechanics principle. The slope angle is gradually increased so that the material has a tendency to slide or slide for a distance on the slope. It takes many measurements to average and then calculates the static and dynamic friction coefficients. A drop test of the material was carried out. The high-speed camera was used to record the rebound height, lateral displacement, and movement time of the material to the highest point. It takes many trials to reach the average. The collision recovery coefficient was calculated. The results are shown in Table 6.

2.2.2. Design of Vibrating Sieve

The ratio of the length and width of the sieve surface is 2–3. In this study, the fan is mounted on the side wall of the cleaning room. The distance at which the material moves in the transverse direction increases considerably, so the aspect ratio should be lower than the normal value. The aspect ratio is set to 1.6. The inclination angle of the sieve was taken as 8° because the airflow acts slightly lower in the direction along the sieve surface. The vibration direction angle was 45°. The distance between the upper and lower vibrating sieves was 200 mm. According to the size of each component of the castor shelling mixture, it was determined that the sieve hole diameter of the upper sieve was 14 mm and the sieve hole diameter of the lower sieve was 8 mm. The sieve holes are arranged in a straight line, as shown in Figure 2.

2.2.3. Design of Cleaning Room

The main dimension parameters of the cleaning room are shown in Figure 3. The width of the cleaning room was set to 640 mm, depending on the size of the cleaning sieve. The length of the cleaning room was set to 1050 mm according to the required movement space of the vibrating sieve. The size of the side air inlet was 190 mm × 100 mm. The rocker space left below was 150 mm × 80 mm.

2.2.4. Design of Discharge Port

The structure of the discharge port is shown in Figure 4. The inclination angle of the discharge port must ensure that the material slides smoothly and does not build up.
The flow at the outlet can be determined according to the size of the discharge port. It is shown as Equation (1).
Q c = 3600 Fv
where F is the cross-sectional area at the exit, in m2; v is the airflow velocity at the outlet, in m/s.

2.3. Material Movement Process of Cleaning

2.3.1. Movement Analysis of Materials without Airflow

The movement of the vibrating sieve causes the material to move on the sieve surface. The vibrating sieve of the cleaning device is driven by a crank-connected rod mechanism. The analysis diagram is shown in Figure 5.
The leftmost end of the crank is set as the starting phase. The acceleration is positive to the right when the crank is located in the I and IV quadrants. The force analysis of the material is shown in Figure 5. Let η AB be the displacement of the material relative to the sieve surface. The acceleration of material sliding upward along the vibrating sieve AB is d 2 η AB d t 2 . Let δ = cos ( α + β + φ ) cos φ , Equation (2) can be obtained.
1 δ d 2 η AB d t 2 = r ω 2 cos ω t g sin α + φ cos α + β + φ
where m is the material quality, in kg; η AB   is the distance of material sliding upward along the AB sieve face, in m/s; I is the inertial force, in N; α is the inclination angle between the sieve plane and the horizontal plane, in °; β is the vibration direction angle, in °; g is the acceleration of gravity, in m/s2; F is the force of friction, in N; φ is the friction angle between the material and the sieve, in °.
After simplifying the equation, set ω 2 r g = K , sin α + φ cos α + β + φ = K 1 , the material will slide upward when K > K1.
In the same way, the motion index K2 of the sieve body moving downward along the sieve surface can be obtained when the crank is located in quadrants II and III, as shown in Equation (3). The material slides down when K > K2.
ω 2 r g = K 2 = sin φ α cos α + β φ

2.3.2. Movement Analysis of Materials under the Action of Airflow

The sieve movement is shown in Figure 6 when there is airflow on the sieve surface.
The leftmost end of the crank is set as the starting phase. The force analysis is shown in Figure 7. When the crank is located in the I and IV quadrants, the material has a tendency to move from A to B relative to the sieve surface under the action of the above external force. Assuming that η AB is the displacement of the material moving forward relative to the sieve, then d 2 η AB d t 2 is the acceleration of material movement relative to the sieve surface.
d 2 η AB d t 2 = r ω 2 cos ω t cos α + β + φ cos φ g sin α + φ cos φ k ρ V 2 cos α + γ + φ cos φ
where k ρ   is the floating coefficient of the sieved material ( k ρ = k ρ A m ).
The material has different motion tendencies when the crank is in different phases. Set d 2 η AB d t 2 = 0 in Equation (4). Equation (5) can be obtained.
ω 2 r g cos ω t = sin α + φ cos α + β + φ + V V P 2 cos α + γ + φ cos α + β + φ
where V P is the suspension velocity of the sieved material, in m/s ( V P = g k ρ ).
The ratio of sieve acceleration should satisfy Equation (6) when the sieved material moves along the front of the sieve.
ω 2 r g cos α + β + φ sin α + φ V V P 2 cos α + γ + φ sin α + φ >   1
Similarly, the ratio of sieve acceleration should satisfy Equation (7) when the material moves backward along the sieve surface.
ω 2 r g cos α + β φ sin φ α + V V P 2 cos α + γ φ sin φ α >   1

2.4. Optimization of Structural Parameters of the Cleaning Device

2.4.1. Modeling Castor Shelling Mixture

The granular model of the castor shelling mixture was created by SolidWorks 2020 software. The EDEM 2020 software was applied to the filled particle model. The thickness of the castor shell was set to a maximum thickness of 0.8 mm. The particle modeling of the castor shelling mixture by the EDEM software is shown in Figure 8.

2.4.2. Cleaning Device Area Division

The upper vibrating sieve is divided into A, B, and C areas to analyze the materials’ distribution on the sieve surface. The discharge port is defined as the D area. The lower vibrating sieve adopts the same definition, which is Ⅰ, Ⅱ, Ⅲ, and Ⅳ areas. The division results are shown in Figure 9, where the red particles represent the two-chambered castor capsule, the green particles represent the castor seeds, and the blue particles represent the castor shell.

2.4.3. Setting before Simulation

The sieve hole diameter of the upper vibrating sieve was formulated as 14 mm according to the average size of the two-chambered castor capsule. Three sieve hole distribution patterns for the vibrating sieve were established, as shown in Figure 10. The distance between the two sieve holes was 20 mm.
The Hertz–Mindlin non-slip model was selected for the interparticle model. The vibration frequency and amplitude of the sieve were set at 7 Hz and 7 mm, respectively. The simulation time was set to 10 s. The three types of vibrating sieves were simulated separately to analyze the distribution of materials.

2.4.4. Determination of Test Indicators

The sieving efficiency and loss rate are established as the indexes of single-factor test analysis. There is no national standard for the indicators of castor shelling mixture cleaning devices. Therefore, the sieving efficiency is above 90% and the loss rate is below 10%, which are set as qualified standards.
The calculation formula for sieving efficiency (Q) is shown in Equation (8).
Q = 100 × ( 0.9 α ) ( β 0.9 ) 0.09 × ( β α ) × 100 %
where α is the mass ratio of seeds in the mixture at the outlet of the upper sieve. β is the mass ratio of seeds in the mixture at the outlet of the lower sieve.
The calculation formula for loss rate S is shown in Equation (9).
S = a b a × 100 %
where a is the total seed weight, in kg, and b is the total mass of the seeds at the outlet of the lower sieve, in kg.

2.5. Optimization and Test of Operation Parameters in the Cleaning Process

2.5.1. Airflow Parameter Setting

The castor shelling mixture is cleaned under the combined action of the vibrating sieve and airflow. The DEM can be used to simulate material movement in the cleaning process. The CFD method can realize the numerical simulation of the flow field inside the cleaning device. Therefore, a solid–gas particle flow model was established by coupling EDEM software with the fluent module in ANSYS 2020 software. The SolidWorks software and the ANSYS software were respectively used to build solid models and mesh partitioning. The model is shown in Figure 11. The model was then imported into the Fluent module. In order to speed up the simulation, the steady-state calculation of the flow field model was carried out, and the steady-state flow field was taken as the initial flow condition for coupling calculation. Set the flow rate and direction of airflow according to your needs. The absolute coordinate system was used to define the airflow direction. The airflow parameter setting is shown in Table 7.
The fluent module in ANSYS mainly provides airflow parameters for the cleaning process in the coupling calculation. The coupling files of the EDEM software and fluent module are imported and connected with the EDEM software. The total simulation time was set to 10 s. The time step of the solver was set to 0.001 s, and the number of time steps was set to 10,000. The number of iteration steps per time step was set to 20. Then, the coupling calculation can be started.
The single-factor experiments of amplitude, vibration frequency, and flow field distribution were performed by the coupling simulation of the EDEM software and fluent module. The single-factor experiment’s most significant factors were amplitude, vibration frequency, and airflow transverse angle. The optimal parameter range of the vibrating sieve was determined as follows: the amplitude is 7–9 mm, the vibration frequency is 6–8 Hz, and the transverse angle of the flow is 40–60°.

2.5.2. Multi-Factor Experimental Design

The parameters of the vibrating sieve were set as follows: the amplitude was 7–9 mm, the frequency was 6–8 Hz, and the transverse angle of the airflow was 40–60°. The Box–Behnken experiment was designed for 17 groups. The sieving efficiency and loss rate of castor seeds were numerically simulated.
  • Test-level coding table
Table 8 shows the level coding changes in the simulation test of castor shelling mixture cleaning.
2.
Test scheme design
The test scheme was designed according to Table 8. A regression proxy model between test factors and test indicators was established. The indexes for the test of the castor shelling mixture are sieving efficiency and loss rate of castor seeds. The test scheme is shown in Table 9.

2.5.3. Single Objective Parameter Optimization

The castor capsule will have a better cleaning effect when the castor shelling mixture has higher sieving efficiency and a lower loss rate. The sieving efficiency and loss rate were optimized by taking the amplitude, frequency, and airflow transverse angle as parameters. The single-objective parameter optimization was carried out with Design–Expert V13 software. The optimized parameters are shown in Formulas (10) and (11).
max Y 1 ( A , C , B ) 7 A 9 6 B 8 40 C 60
min Y 2 ( A , C , B ) 7 A 9 6 B 8 40 C 60

2.5.4. Multi-Objective Parameter Optimization

The amplitude, vibration frequency, and airflow transverse angle were taken as optimization variables. The maximum sieving efficiency and minimum castor seed loss rate were taken as targets for the hybrid optimization. The multi-objective parameter optimization was carried out with Design–Expert V13 software. The optimized parameters are shown in Formula (12).
m a x Y 1 ( A , C , B ) 7 A 9 6 B 8 m i n Y 2 ( A , C , B ) 40 C 60

2.5.5. Preparation of the Cleaning Test

The test bench was designed according to the parameter optimization results. The optimized parameter combination was tested by changing the vibrating sieve’s frequency, amplitude, and transverse angle. The combination with an amplitude of 8.43 mm, a frequency of 6 Hz, and a transverse angle of airflow of 40° is named Test 1. The combination with an amplitude of 7 mm, a frequency of 7.76 Hz, and an airflow transverse angle of 40.81° is named Test 2. The combination with an amplitude of 9 mm, a frequency of 6.16 Hz, and a transverse angle of airflow of 40° is named Test 3. The distribution and movement of materials in the cleaning process are analyzed.
The sieving efficiency and loss rate are calculated according to Equations (8) and (9). The impurity rate in the cleaning of materials is also an essential indicator to evaluate the cleaning effect. The impurity rate (Z) is calculated as Equation (13).
Z   = c 2 c 1 c 2 × 100 %
where c1 is the mass of castor seeds at the seed outlet, in kg, and c2 is the mass of the mixture at the seed outlet, in kg.

3. Results and Discussion

3.1. The Results of Multivariate Experiments

3.1.1. Significance Analysis of Sieving Efficiency

The significance of the sieving efficiency was analyzed to investigate the relationship between the sieving efficiency and the factors. The results of the analysis are shown in Table 10.
The analysis of variance on the sieving efficiency shows that the correlation coefficient R2 = 0.9303, which indicates that the fitting accuracy is high. The analysis of the regression proxy model shows a p < 0.01, which indicates that the proxy model is highly significant. The p-values of the amplitude, vibration frequency, and transverse angle are all smaller than 0.01, so the effects of these three factors on the sieving efficiency of the castor shelling mixture are extremely significant.
The regression equation proxy model for the sieving efficiency of the castor shelling mixture can be established based on the test scheme in Table 10. The experimental data were obtained. The model is shown in Equation (14).
Y ^ 1 = 7.07 + 20.03 A + 4.87 B + 0.57 C 0.72 A B 0.07 A C + 0.08 B C 0.77 A 2 0.28 B 2 6.46 × 1 0 3 C 2
The variance analysis of the sieving efficiency of the castor shelling mixture shows that the three factors have a very significant impact on the sieving efficiency.

3.1.2. Significance Analysis of Loss Rate

The significance of the loss rate of castor seeds was analyzed to investigate the relationship between the loss rate and other factors. The results of the analysis are shown in Table 11.
The analysis of variance on the castor seed loss rate shows that the correlation coefficient R2 = 0.9080, which indicates that the fitting accuracy is high. The analysis of the regression proxy model shows s p < 0.01, which indicates that the proxy model is highly significant. The p-values of amplitude, vibration frequency, and transverse angle are all smaller than 0.01, so the effects of these three factors on the castor seed loss rate are extremely significant.
The regression equation proxy model of the castor seed loss rate can be established according to the test scheme and data obtained in Table 11. The model is shown as Equation (15).
Y ^ 2 = 85.85 + 1.40 A 23.79 B 0.27 C + 0.98 A B + 0.07 A C 0.02 B C 0.69 A 2 + 1.14 B 2 1.03 × 1 0 3 C 2
The variance analysis of the castor seed loss rate shows that the three factors have a very significant impact on the castor seed loss rate.

3.2. Optimization Results of the Cleaning Device Structural Parameters

3.2.1. Influence of Different Sieve Hole Arrangements on Cleaning Efficiency

  • Analysis of cleaning effect
The cleaning results obtained from the simulation tests are shown in Table 12. It can be concluded that the sieve distribution pattern of Type-1 has a better cleaning effect.
2.
Distribution of the two-chambered castor capsule
The distribution of extract on vibrating sieves with different arrangement types during the cleaning process was analyzed. The particle distributions were compared at three simultaneous points: 3.0 s, 6.0 s, and 10.0 s. The results of the comparison are shown in Figure 12. It can be concluded that the distribution of the two-chambered castor capsule is more concentrated on the Type-2 vibrating sieve. The vibrating sieve has a worse effect on the material than the other two sieve types.
The cleaning process of the castor shelling mixture of Type-1 is shown in Figure 13.
The distribution data statistics of the two-chambered castor capsule on the upper sieve surface under different sieve distribution patterns are shown in Figure 14. It can be seen that in area A at 3.0 s, the two-chambered castor capsule of Type-1 and Type-3 are similar in content (89.56% and 87.74%). However, the two-chambered castor capsule content on the Type-2 vibrating sieve is significantly higher than the other two sieve types, which is 100%.
The content of the two-chambered castor capsule of Type-2 is 72.51% at 6.0 s within area A, which is greatly higher than the other two sieve types. The content of Type-1 is 41.02%, and Type-3 is 38.45%. The two-chambered castor capsule content of Type-1 is 5.13% in area C, and that of Type-3 is 2.56%.
The two-chambered castor capsule under Type-1 has a higher content in the second half of the sieve surface at 10 s. It can be seen that the two-chambered castor capsule of Type-1 and Type-3 are similar in each region of the cleaning process. Type-2 has the worst effect on material pushing.
3.
Analysis of average velocity in the Z-axis direction
The coordinate axes are set up with the center point at the feed inlet of the particle factory as the origin. The coordinate axes are shown in Figure 15.
The direction of the Z-axis of the particle flow along the vibrating sieve. The average velocity of the two-chambered castor capsule along the Z-axis is analyzed as shown in Figure 16. The fitting curve equation is shown in Equation (16). The average velocity of the material on types 1 and 3 shows an upward trend from 0 to 1.1 s. The average velocity of particles in Type-2 is slightly higher. The average velocity trend of the two-chambered castor capsule on the Type-1 vibrating sieve is moderate, ranging from 1.1 s to 10.0 s. The average velocity of particles in types 2 and 3 shows a trend of decreasing, then increasing, and then decreasing. However, the average velocity of particles in Type-2 is lower than that in Type-3. It can be found that Type-1 vibrating sieves are more favorable for improving the speed of cleaning the material.
y 1 = 3.82312 × 1 0 5 x 4 + 8.4462 × 1 0 4 x 3 0.00665 x 2 + 0.02262 x + 0.02654 y 2 = 4.57356 × 1 0 5 x 4 + 7.98173 × 1 0 4 x 3 0.00386 x 2 + 0.00298 x + 0.03777 y 3 = 6.63569 × 1 0 5 x 4 + 0.0013 x 3 0.00847 x 2 + 0.02216 x + 0.02818
Among them, y 1 is the average velocity of the two-chambered castor capsule on Type-1, in m/s. y 2 is the average velocity of the two-chambered castor capsule on Type-2, in m/s. y 3 is the average velocity of the two-chambered castor capsule on Type-3, in m/s.
4.
Analysis of average displacement
The average displacement of the two-chambered castor capsule in the cleaning room is shown in Figure 17. The fitting curve equation is shown in Equation (17). The average displacement fitting curves of the materials at 0 to 1.1 s for all sieve types are coincident. This partial displacement is generated when the material falls from the inlet to the upper sieve surface. The average displacement of the two-chambered castor capsule on Type-1 is larger at 1.1 s to 10 s compared to the other two types.
y 4 = 0.16448 x 3 1.23266 x 2 + 43.70648 x + 95.59954 y 5 = 0.50962 x 3 7.68558 x 2 + 55.65732 x + 88.07704 y 6 = 0.30634 x 3 3.34319 x 2 + 49.03904 x + 92.76224
Among them, y 4 is the average displacement of the two-chambered castor capsule on Type-1, in mm. y 5 is the average displacement of the two-chambered castor capsule on Type-2, in mm. y 6 is the average displacement of the two-chambered castor capsule on Type-3, in mm.

3.2.2. Influence of Different Sieve Hole Diameters on Cleaning Efficiency

  • Analysis of cleaning effect
The influence of sieve hole size on the material cleaning effect was analyzed based on Type-1 sieve distribution. Two sizes of 15 mm sieve hole diameter and 16 mm sieve hole diameter were added. The vibration frequency and amplitude of the sieve were set at 7 Hz and 7 mm, respectively. The test cleaning results are shown in Table 13. It can be seen that the cleaning effect is better when the diameter of the sieve hole is 14 mm.
2.
Distribution of the two-chambered castor capsule
The distribution of extract on vibrating sieves with different sieve hole sizes was analyzed during the cleaning process. The results show that the vibrating sieve with a diameter of 14 mm has a better effect on the material.
The statistics of the distribution data for the two-chambered castor capsule at different sieve hole diameters at different times are shown in Figure 18. It can be seen that in area A at 3.0 s, the contents of the two-chambered castor capsule on vibrating sieves with 14 mm and 15 mm sieve hole diameters are similar, which are 90% and 89.96%, respectively. However, the content of the two-chambered castor capsule with a 16 mm sieve hole diameter was higher than the other two sieve hole diameters, which is 100%.
The content of the two-chambered castor capsule with a 14 mm sieve hole diameter in area A at 6.0 s is 41.02%. The content of the two-chambered castor capsule with a 15 mm sieve hole diameter is 56.10%. The content of the two-chambered castor capsule with a 16 mm sieve hole diameter is 97.50%. The content of the two-chambered castor capsule with a 14 mm sieve hole diameter in area B is 53.85%. The content of the castor capsule with a 15 mm sieve hole diameter is 36.59%.
The two-chambered castor capsule with a 14 mm sieve hole diameter is concentrated in regions B and C at 10 s. The content of the 14 mm sieve hole diameter in area B is the same as that of the 15 mm sieve hole diameter, both being 57.50%. There was no change in the content of the two-chambered castor capsule with a 16 mm sieve hole diameter. The results show that the vibrating sieve with a 14 mm sieve hole diameter is more favorable for the movement of the two-chambered castor capsule.
3.
Analysis of average velocity
The average velocity of the two-chambered castor capsule along the Z-axis is analyzed as shown in Figure 19. The fitting curve equation is shown in Equation (18). The average velocity fitting curve of the two-chambered castor capsule with a 14 mm sieve hole diameter vibrating sieve shows a gradual upward trend in 0–1.1 s. The trend of the curve is gradually stable from 1.1 s to 10.0 s. The average velocity fitting curves of the two-chambered castor capsule on vibrating sieves with 15 mm and 16 mm sieve hole diameters show an overall downward trend. The vibrating sieve with a sieve diameter of 14 mm is more favorable for improving the cleaning speed of materials under comprehensive analysis.
y 7 = 7.99819 × 1 0 5 x 3 0.00173 x 2 + 0.01171 x + 0.03197 y 8 = 1.81934 × 1 0 4 x 3 + 0.00307 x 2 0.01534 x + 0.0576 y 9 = 9.06708 × 1 0 5 x 3 + 0.00201 x 2 0.01472 x + 0.03474
Among them, y 7 is the average velocity of the two-chambered castor capsule when the sieve hole diameter is 14 mm, in m/s. y 8 is the average velocity of the two-chambered castor capsule when the sieve hole diameter is 15 mm, in m/s. y 9 is the average velocity of the two-chambered castor capsule when the sieve hole diameter is 16 mm, in m/s.
4.
Analysis of average displacement
The fitting curve of average displacement is shown in Figure 20. The fitting curve equation is shown in Equation (19). It can be seen that the average displacement of the two-chambered castor capsule in 1.1 s–10 s is relatively large when the diameter of the sieve hole is 14 mm.
y 10 = 0.16448 x 3 1.23266 x 2 + 43.70648 x + 95.59954 y 11 = 0.29993 x 3 4.36985 x 2 + 45.72758 x + 100.74109 y 12 = 0.49266 x 3 8.8504 x 2 + 48.05047 x + 99.64319
Among them, y 10 is the average displacement of the two-chambered castor capsule when the sieve diameter is 14 mm, in mm. y 11 is the average displacement of the two-chambered castor capsule when the sieve diameter is 15 mm, in mm. y 12 is the average displacement of the two-chambered castor capsule when the sieve diameter is 16 mm, in mm.

3.2.3. Influence of Different Inclination Angles on Cleaning Efficiency

  • Analysis of cleaning effect
The influence of different sieve inclination angles on the material cleaning effect was analyzed by changing the inclination angle of the vibrating sieve. It was determined that the sieve surface inclination was 5–9°. The cleaning results obtained by the simulation test are shown in Figure 21. The loss rate decreases gradually with the increase in the inclination angle. The sieving efficiency is between 94.0% and 99.5%. The loss rate is between 0.5% and 3.0%.
2.
Distribution of the two-chambered castor capsule
The distribution of the castor shelling mixture was analyzed on a vibrating sieve with different inclinations of the sieve surface during the cleaning process. The results show that the effect of the vibrating sieve on moving materials is better when the sieve surface inclination is 8°.
The statistics of the distribution data for the two-chambered castor capsule at different sieve surface angles are shown in Figure 22. It can be seen that in area A at 3.0 s, the content of the two-chambered castor capsule is the highest when the sieve surface inclination is 5°, which is 97.49%. The content of the two-chambered castor capsule is lowest when the sieve surface inclination is 8°, which is 67.43%.
The contents of the two-chambered castor capsule are higher in zone A at 6.0 s when the inclination of the sieve surface is 5° and 6°, which are 47.50% and 41.03%, respectively. The highest content of the two-chambered castor capsule under a sieve inclination of 7° is 89.74% in area B. The castor capsule content in area C is 2.50% higher at 8° sieve plane inclination than at 9° sieve plane inclination.
As the sieving surface inclination increases, the two-chambered castor capsule content in area A gradually decreases at 10 s. The highest is 79.49% when the sieve surface inclination is 5°. The content of the two-chambered castor capsule in area D increases gradually with the increasing inclination of the sieving surface. The highest is 35.04% when the inclination angle of the sieve surface is 9°.
3.
Analysis of average velocity
The average velocity of the two-chambered castor capsule along the Z-axis is analyzed as shown in Figure 23. The fitting curve equation is shown in Equation (20). The average velocity of the two-chambered castor capsule increased first and then gently when the sieve surface inclination was 5–7°. The average velocity increases first and then decreases when the inclination of the sieve surface is between 8° and 9°, which indicates that most of the two-chambered castor capsule has been cleaned.
y 13 = 3.17068 × 10 5 x 3 7.6897 × 10 4 x 2 + 0.00685 x + 0.02865 y 14 = 7.99819 × 10 5 x 3 0.00173 x 2 + 0.0117 x + 0.03197 y 15 = 2.00307 × 10 6 x 3 3.61096 × 10 4 x 2 + 0.00584 x + 0.05364 y 16 = 6.53469 × 10 5 x 3 + 7.14708 × 10 4 x 2 5.54988 x + 0.06851 y 17 = 7.33443 × 10 5 x 3 2.91924 × 10 4 x 2 + 0.0127 x + 0.04481
Among them, y 13 is the average velocity of the two-chambered castor capsule when the sieve surface inclination is 5°, in m/s. y 14 is the average velocity of the two-chambered castor capsule when the sieve surface inclination is 6°, in m/s. y 15 is the average velocity of the two-chambered castor capsule when the sieve surface inclination is 7°, in m/s. y 16 is the average velocity of the two-chambered castor capsule when the sieve surface inclination is 8°, in m/s. y 17 is the average velocity of the two-chambered castor capsule when the sieve surface inclination is 9°, in m/s.
4.
Analysis of average displacement
The average displacement of the two-chambered castor capsule in the cleaning room is shown in Figure 24. The fitting curve equation is shown in Equation (21). It can be seen that the average displacement of the two-chambered castor capsule in 1.1 s–10 s is relatively large when the sieve surface inclination is 9°.
y 18 = 0.32956 x 3 3.74638 x 2 + 45.9782 x + 99.08395 y 19 = 0.16448 x 3 1.23266 x 2 + 43.70648 x + 95.59954 y 20 = 0.21395 x 3 1.23108 x 2 + 54.88828 x + 98.09234 y 21 = 0.07141 x 3 + 0.53268 x 2 + 54.40625 x + 80.87312 y 22 = 0.0974 x 3 + 4.58693 x 2 + 37.81974 x + 101.84321
Among them, y 18 is the average displacement of the two-chambered castor capsule when the sieve surface inclination is 5°, in mm. y 19 is the average displacement of the two-chambered castor capsule when the sieve surface inclination is 6°, in mm. y 20 is the average displacement of the two-chambered castor capsule when the sieve surface inclination is 7°, in mm. y 21 is the average displacement of the two-chambered castor capsule when the sieve surface inclination is 8°, in mm. y 22 is the average displacement of the two-chambered castor capsule when the sieve surface inclination is 9°, in mm.

3.3. Optimization of Operating Parameters and Analysis of Test Results

The single objective parameter was optimized. The maximum sieving efficiency combination was obtained for the castor husking mixture with an amplitude of 8.43 mm, a vibrating sieve frequency of 6 Hz, and an airflow transverse angle of 40°. The sieving efficiency of the castor shelling mixture was 98.20%. The minimum castor seed loss rate was obtained with an amplitude of 7 mm, a vibrating sieve frequency of 7.76 Hz, and an airflow transverse angle of 40.81°. The loss rate for castor seeds was 2.02%.
The optimal parameter combination for the cleaning effect of the castor shelling mixture was obtained as follows: The amplitude of the vibrating sieve was 9 mm, the vibration frequency of the vibrating sieve was 6.16 Hz, and the transverse angle of the airflow was 40°. The sieving efficiency of the castor shelling mixture was 97.66%. The loss rate for castor seeds was 2.32%.
The variety of Zhebi No. 4 was selected as the test material. The test device is shown in Figure 25.
Test 1, Test 2, and Test 3 were tested, respectively. Figure 26 shows the partial cleaning diagram for materials. Materials before and after cleaning are shown in Figure 27.
The results of sieving efficiency, loss rate, and impurity rate are shown in Table 14.
The qualified standard for material sieving is determined by a sieving efficiency of more than 90% and a loss rate of less than 10%. The results show that the sieving efficiency of the three bench tests is 94.68%, 95.21%, and 93.15%, respectively. Comparing the test results with the optimized theoretical results, the difference in sieving efficiency is within 5%, and the difference in loss rate is within 4%. The loss rates were 7.13%, 6.09%, and 6.94%, respectively. The impurity rates of the three experiments were 0.68%, 0.52%, and 0.83%, respectively. The impurity rate of castor seeds was less than 1%.

4. Conclusions

In this study, the motion law of the castor shelling mixture in the cleaning process was analyzed. The structural parameters of the cleaning device are optimized by simulation tests. The operating parameters of the cleaning device are optimized by a multi-factor test and verified by a test bench.
(1)
The air-sieve-type cleaning device for castor shelling mixture is designed. The width of the cleaning sieve is determined to be 600 mm, and the length is determined to be 960 mm. The distance between the upper and lower vibrating sieves is 200 mm; the diameter of the upper sieve hole is 14 mm; and the diameter of the lower sieve hole is 8 mm.
(2)
The results of the single-factor simulations show that the sieving efficiency and the loss rate are 98.23% and 2.39%, respectively, for the square sieve hole arrangement. The sieving efficiencies for the triangular sieve hole arrangement are 96.70% and 96.71%, respectively. The sieving efficiency and the loss rate of the 14 mm sieve hole diameter are obtained, which are 98.23% and 2.39%, respectively. The sieving efficiency of 15 mm and 16 mm is 96.64% and 96.69%, respectively. The analysis of each sieve surface inclination shows that the sieving efficiency is between 94.0–99.5%, and the loss rate is between 0.5–3.0%. The optimal combination of structural parameters can be obtained as a square distribution of sieve holes, a 14 mm sieve hole diameter, and an 8° sieve surface inclination angle.
(3)
The parameter combinations of the maximum sieving efficiency, the minimum loss rate, and the optimal cleaning effect of the castor shelling mixture are obtained by parameter optimization, respectively. The three-parameter combinations are tested. The results show that the sieving efficiency of the first combination is 94.68%, with a loss rate of 7.13%. The sieving efficiency of the second combination is 95.21%, with a loss rate of 6.09%. The sieving efficiency of the third combination is 93.15%, with a loss rate of 6.94%. The impurity rate of the castor seed is less than 1%, which can meet the design requirements.
The future research direction can be to investigate the influence of different castor varieties on the cleaning effect by varying the parameter characteristics of the material. It is also possible to study the influence of the airflow inlet position and the airflow speed on the material cleaning effect. In addition, the application of new sieves in cleaning devices is also a good trend.

Author Contributions

Conceptualization, J.H., X.L. and Z.M.; Methodology, J.H., X.L. and Z.M.; Software, H.Z.; Formal analysis, H.Z.; Resources, Wei Wang; Writing—original draft, J.H., X.L., H.Z. and Z.M.; Writing—review & editing, Z.T., Y.Y., J.J. and W.W. All authors have read and agreed to the published version of the manuscript.

Funding

This research was funded by National Nature Science Foundation of China, grant number 51475312.

Institutional Review Board Statement

Not applicable.

Data Availability Statement

The data is not suitable for publication because the experiment was not completed.

Conflicts of Interest

The authors declare no conflict of interest.

References

  1. Pari, L.; Suardi, A.; Stefanoni, W.; Latterini, F.; Palmieri, N. Environmental and Economic Assessment of Castor Oil Supply Chain: A Case Study. Sustainability 2020, 12, 6339. [Google Scholar] [CrossRef]
  2. Yao, L.; Cao, Y.; Li, C.; Fang, Z. Dynamics Property of Air-and-Screen Cleaning Mechanism of Castor Hulling. J. Agric. Mech. Res. 2014, 36, 70–73. [Google Scholar] [CrossRef]
  3. Xu, L.; Li, Y.; Li, Y.; Chai, X.; Qiu, J. Research Progress on Cleaning Technology and Device of Grain Combine Harvester. Trans. Chin. Soc. Agric. Mach. 2019, 50, 1–16. [Google Scholar] [CrossRef]
  4. Gebrehiwot, M.G.; De Baerdemaeker, J.; Baelmans, M. Effect of a cross-flow opening on the performance of a centrifugal fan in a combine harvester: Computational and experimental study. Biosyst. Eng. 2010, 105, 247–256. [Google Scholar] [CrossRef]
  5. Yang, R.; Chen, D.; Zha, X.; Pan, Z.; Shang, S. Optimization Design and Experiment of Ear-Picking and Threshing Devices of Corn Plot Kernel Harvester. Agriculture 2021, 11, 904. [Google Scholar] [CrossRef]
  6. Wang, L.; Yu, Y.; Zhang, S.; Feng, X.; Song, L. Bionic design and performance test of maize grain cleaning screen through earthworm motion characteristics. Int. J. Agric. Biol. Eng. 2021, 14, 12–21. [Google Scholar] [CrossRef]
  7. Gao, Y.; Song, L.; Wang, L.; Wang, H.; Li, Y. Behavior of maize grains on the three-dimensional translational vibrating sieve. Powder Technol. 2022, 412, 117999. [Google Scholar] [CrossRef]
  8. Xiao, J.; Tong, X. Characteristics and efficiency of a new vibrating screen with a swing trace. Particuology 2013, 11, 601–606. [Google Scholar] [CrossRef]
  9. Li, Z.; Liang, J.; Jia, P.; Tong, X. Parameter optimization and mechanism research of double-layer variable screen surface vibrating screen. Part. Sci. Technol. 2022, in press. [Google Scholar] [CrossRef]
  10. Ma, Z.; Han, M.; Li, Y.; Gao, H.; Lu, E.; Chandio, F.A.; Ma, K. Motion of cereal particles on variable-amplitude sieve as determined by high-speed image analysis. Comput. Electron. Agric. 2020, 174, 105465. [Google Scholar] [CrossRef]
  11. Ma, Z.; Li, Y.; Xu, L. Discrete-element method simulation of agricultural particles’ motion in variable-amplitude screen box. Comput. Electron. Agric. 2015, 118, 92–99. [Google Scholar] [CrossRef]
  12. Zhou, X.; Wang, Z.; Chen, N.; Chen, D. Numerical Simulation and Experiment of Airflow Field of Cleaning Room under Action of Conical Fan. Trans. Chin. Soc. Agric. Mach. 2019, 50, 91–100. [Google Scholar] [CrossRef]
  13. Xu, Z.; Li, Y.; Wan, L.; Ma, X.; Song, J.; Huang, J. Optimising the design of ball racks to improve the sorting efficiency of vibrating screen seed cleaners using discrete element method modeling and experiment. Biosyst. Eng. 2023, 225, 99–117. [Google Scholar] [CrossRef]
  14. Shen, G.; Chen, Z.; Wu, X.; Li, Z.; Tong, X. Stepwise shape optimization of the surface of a vibrating screen. Particuology 2021, 58, 26–34. [Google Scholar] [CrossRef]
  15. Li, H.; Wan, X.; Wang, H.; Jiang, Y.; Liao, Q. Design and Experiment on Integrated Longitudinal Axial Flow Threshing and Separating Device of Rape Combine Harvester. Trans. Chin. Soc. Agric. Mach. 2017, 48, 108–116. [Google Scholar] [CrossRef]
  16. Aldoshin, N.; Lylin, N. Improving the design of the grain combine harvester cleaner. Russ. Agric. Sci. 2018, 44, 108–111. [Google Scholar] [CrossRef]
  17. Wang, L.; Duan, L.; Zheng, Z.; Cui, Y.; Li, Y.; Zhao, H. Optimization and Experiment on Driving Mechanism of Vibrating Screen with Three Translations and Two Rotations. Trans. Chin. Soc. Agric. Mach. 2018, 49, 138–145. [Google Scholar] [CrossRef]
  18. Wan, X.; Liao, Q.; Xu, Y.; Yuan, J.; Li, H. Design and Evaluation of Cyclone Separation Cleaning Devices Using a Conical Sieve for Rape Combine Harvesters. Appl. Eng. Agric. 2018, 34, 677–686. [Google Scholar] [CrossRef]
  19. Wan, X.; Shu, C.; Xu, Y.; Yuan, J.; Li, H.; Liao, Q. Design and experiment on cylinder sieve with different rotational speed in cleaning system for rape combine harvesters. Trans. Chin. Soc. Agric. Eng. 2018, 34, 27–35. [Google Scholar] [CrossRef]
  20. Gao, L.; Zhao, X.; Yang, D.; Jiao, W.; Zhang, X.; Liu, D. Development and performance test on pneumatic cleaning-circulatory device of soybean thresher. Trans. Chin. Soc. Agric. Eng. 2013, 28, 22–27. [Google Scholar] [CrossRef]
  21. Fan, C.; Cui, T.; Zhang, D.; Yang, L.; Tian, C.; Zhong, X. Design and Experiment of Double-layered Reverse Cleaning Device for Axial Flow Combine Harvester. Trans. Chin. Soc. Agric. Mach. 2018, 49, 239–248. [Google Scholar] [CrossRef]
  22. Wang, Z.; Lü, P.; Chen, N.; Li, H.; Liu, Z.; Chen, D. Design and Experiment on Axial-flow Differential-speed Threshing-Separating-Cleaning Unit. Trans. Chin. Soc. Agric. Mach. 2016, 47, 53–61. [Google Scholar] [CrossRef]
  23. Liao, Q.; Xu, Y.; Yuan, J.; Wan, X.; Jiang, Y. Design and Experiment on Combined Cutting and Throwing Longitudinal Axial Flow Threshing and Separating Device of Rape Combine Harvester. Trans. Chin. Soc. Agric. Mach. 2019, 50, 140–150. [Google Scholar] [CrossRef]
  24. Tabatabaifar, A.; Persson, S. Layer Breakup and Particle Movement on a Chaffer Sieve. Trans. ASAE 1995, 38, 1305–1313. [Google Scholar] [CrossRef]
  25. Li, Y.; Zhao, Z.; Chen, J.; Xu, L. Nonlinear motion law of material on air-and-screen cleaning mechanism. Trans. Chin. Soc. Agric. Eng. 2007, 23, 142–147. [Google Scholar] [CrossRef]
  26. Wang, L.; Chai, J.; Wang, H.; Wang, Y. Design and performance of a countersunk screen in a maize cleaning device. Biosyst. Eng. 2021, 209, 300–314. [Google Scholar] [CrossRef]
  27. Li, Y.; Fan, H.; Xu, Y.; Cui, T.; Su, Y.; Qiao, M.; Han, S.; Qian, J.; Zheng, Z. CFD-DEM investigation of particle dispersion degree on a novel vibrating screen. Powder Technol. 2022, 404, 117497. [Google Scholar] [CrossRef]
  28. Du, W.; Huang, H.; Fan, Q. Application of ANSYS in the Flow Field in the Cleaning Device of a Rape’s Combine Harvester. J. Agric. Mech. Res. 2007, 10, 174–175. [Google Scholar] [CrossRef]
  29. Chu, K.; Wang, B.; Xu, D.; Chen, Y.; Yu, A. CFD–DEM simulation of the gas–solid flow in a cyclone separator. Chem. Eng. Sci. 2011, 66, 834–847. [Google Scholar] [CrossRef]
  30. Li, Y.; Xu, L.; Liang, Z. Simulation and Experiment of Airflow Field in Cleaning Device with Double Outlets and Four Ducts. J. Agric. Mech. Res. 2018, 40, 7–12. [Google Scholar] [CrossRef]
  31. Xu, L.; Yu, L.; Li, Y.; Ma, Z.; Wang, C. Numerical Simulation of Internal Flow Field in Centrifugal Fan with Double Outlet and Multi-duct. Trans. Chin. Soc. Agric. Mach. 2014, 45, 78–86. [Google Scholar] [CrossRef]
  32. Li, H.; Li, Y.; Tang, Z.; Xu, L. Numerical Simulation of Material Motion on Vibrating Screen of Air-and-screen Cleaning Device Based on CFD-DEM. Trans. Chin. Soc. Agric. Mach. 2012, 43, 79–84. [Google Scholar] [CrossRef]
  33. Jiang, E.; Sun, Z.; Pan, Z.; Wang, L. Numerical Simulation Based on CFD-DEM and Experiment of Grain Moving Laws in Inertia Separation Chamber. Trans. Chin. Soc. Agric. Mach. 2014, 45, 117–122. [Google Scholar] [CrossRef]
  34. Li, J.; Webb, C.; Pandiella, S.S.; Campbell, G.M. Discrete particle motion on sieves—A numerical study using the DEM simulation. Powder Technol. 2003, 133, 190–202. [Google Scholar] [CrossRef]
  35. Davoodi, A.; Bengtsson, M.; Hulthén, E.; Evertsson, C. Effects of screen decks’ aperture shapes and materials on screening efficiency. Miner. Eng. 2019, 139, 105699. [Google Scholar] [CrossRef]
  36. Zhao, L.; Liu, C.; Yan, J. A virtual experiment showing single particle motion on a linearly vibrating screen-deck. Min. Sci. Technol. 2010, 20, 276–280. [Google Scholar] [CrossRef]
  37. Jiang, H.; Duan, C.; Wu, J.; Zhao, Y.; Liu, C.; Luo, Z.; Dong, L.; Zhang, B.; Wang, Z.; Zhang, C. Kinematics characteristics of the vibrating screen with rigid-flexible screen rod and the behavior of moist coal particles during the dry deep screening process. Powder Technol. 2017, 319, 92–101. [Google Scholar] [CrossRef]
  38. Feng, X.; Gong, Z.; Wang, L.; Yu, Y.; Liu, T.; Song, L. Behavior of maize particle penetrating a sieve hole based on the particle centroid in an air-screen cleaning unit. Powder Technol. 2021, 385, 501–516. [Google Scholar] [CrossRef]
  39. Chen, Z.; Li, Z.; Xia, H.; Tong, X. Performance optimization of the elliptically vibrating screen with a hybrid MACO-GBDT algorithm. Particuology 2021, 56, 193–206. [Google Scholar] [CrossRef]
  40. Xia, X.; Gou, L.; Zhang, Z.; Wang, L.; Guo, Y.; Jing, W. Collaborative optimization of linear vibrating screen screening efficiency and dynamic response stability based on coupled DEM-MBK simulation. Particuology 2023, 78, 49–61. [Google Scholar] [CrossRef]
  41. Zhao, L.; Zhao, Y.; Liu, C.; Li, J.; Dong, H. Simulation of the screening process on a circularly vibrating screen using 3D-DEM. Min. Sci. Technol. 2011, 21, 677–680. [Google Scholar] [CrossRef]
  42. Zhao, L.; Zhao, Y.; Bao, C.; Hou, Q.; Yu, A. Optimisation of a circularly vibrating screen based on DEM simulation and Taguchi orthogonal experimental design. Powder Technol. 2017, 310, 307–317. [Google Scholar] [CrossRef]
  43. Qiao, J.; Duan, C.; Jiang, H.; Zhao, Y.; Chen, J.; Huang, L.; Wen, P.; Wu, J. Research on screening mechanism and parameters optimization of equal thickness screen with variable amplitude based on DEM simulation. Powder Technol. 2018, 331, 296–309. [Google Scholar] [CrossRef]
  44. Dong, K.; Esfandiary, A.H.; Yu, A. Discrete particle simulation of particle flow and separation on a vibrating screen: Effect of aperture shape. Powder Technol. 2017, 314, 195–202. [Google Scholar] [CrossRef]
  45. Dong, K.; Yu, A.; Brake, I. DEM simulation of particle flow on a multi-deck banana screen. Miner. Eng. 2009, 22, 910–920. [Google Scholar] [CrossRef]
  46. Dong, H.; Liu, C.; Zhao, Y.; Zhao, L. Influence of vibration mode on the screening process. Int. J. Min. Sci. Technol. 2013, 23, 95–98. [Google Scholar] [CrossRef]
Figure 1. Overall structure of the cleaning device. 1. Cleaning room 2. Fan 3. Vertical plates 4. Upper vibrating sieve 5. Slide 6. Duct 7. Lower vibrating sieve 8. Rack 9. Crank rocker mechanism 10. Motor 11. Discharge port.
Agriculture 13 01130 g001
Figure 2. Hole distribution of the cleaning sieve. Note: S is the distance between the sieve; a is the diameter of the sieve hole; and n is the number of sieve holes.
Agriculture 13 01130 g002
Figure 3. Schematic diagram of cleaning room.
Agriculture 13 01130 g003
Figure 4. Cleaning room outlet.
Agriculture 13 01130 g004
Figure 5. Moving mechanism of the sieve.
Agriculture 13 01130 g005
Figure 6. Diagram of sieve movement.
Agriculture 13 01130 g006
Figure 7. The force analysis of the material moving from A to B along the sieve surface.
Agriculture 13 01130 g007
Figure 8. Effluent modeling. (a) Castor seeds; (b) castor shells; (c) two-chambered castor capsule.
Agriculture 13 01130 g008
Figure 9. Area division of cleaning device.
Agriculture 13 01130 g009
Figure 10. Three kinds of mesh arrangement. (a) Type-1; (b) Type-2; (c) Type-3.
Agriculture 13 01130 g010
Figure 11. Model and mesh division. (a) Model of gas flow fields. (b) Meshing of the airflow field model.
Agriculture 13 01130 g011
Figure 12. Distribution of the two-chambered castor capsule on the upper sieve surface. (a) Distribution of the two-chambered castor capsule of Type-1 at 3.0 s, 6.0 s, and 10.0 s; (b) Distribution of the two-chambered castor capsule of Type-2 at 3.0 s, 6.0 s, and 10.0 s; (c) Distribution of the two-chambered castor capsule of Type-3 at 3.0 s, 6.0 s, and 10.0 s.
Agriculture 13 01130 g012aAgriculture 13 01130 g012b
Figure 13. Cleaning process of castor shelling mixture. (a) 3.0 s; (b) 6.0 s; (c)10.0 s.
Agriculture 13 01130 g013
Figure 14. Distribution data of the two-chambered castor capsule in different sieve hole arrangements. (a) 3.0 s; (b) 6.0 s; (c) 10.0 s.
Agriculture 13 01130 g014
Figure 15. Pellet plant inlet.
Agriculture 13 01130 g015
Figure 16. Average velocity of the two-chambered castor capsule in different sieve hole arrangements.
Agriculture 13 01130 g016
Figure 17. Average displacement of the two-chambered castor capsule in different sieve hole arrangements.
Agriculture 13 01130 g017
Figure 18. Distribution data of the two-chambered castor capsule in different sieve hole diameters. (a) 3.0 s; (b) 6.0 s; (c) 10.0 s.
Agriculture 13 01130 g018
Figure 19. Average velocity of the two-chambered castor capsule in different sieve hole diameters.
Agriculture 13 01130 g019
Figure 20. Average displacement of the two-chambered castor capsule in different sieve hole diameters.
Agriculture 13 01130 g020
Figure 21. Cleaning effect under different sieve surface inclinations.
Agriculture 13 01130 g021
Figure 22. Distribution data of the two-chambered castor capsule in different inclination angles. (a) 3.0 s; (b) 6.0 s; (c) 10.0 s.
Agriculture 13 01130 g022
Figure 23. Average velocity of the two-chambered castor capsule in different inclination angles.
Agriculture 13 01130 g023
Figure 24. Average displacement of the two-chambered castor capsule in different inclination angles.
Agriculture 13 01130 g024
Figure 25. Cleaning device for castor effluent. 1. The feed inlet 2. The observation port 3. The light source 4. The seed outlet 5. Two-chambered castor capsule outlet 6. The camera 7. The host 8. The fan.
Agriculture 13 01130 g025
Figure 26. Material part cleaning drawing. (a) Cleaning process diagram of the castor shelling mixture. (b) Material drawing at the discharge port.
Agriculture 13 01130 g026
Figure 27. The material composition of castor seed explants before and after cleaning. (a) Shell and capsule mixture after cleaning; (b) Castor shelling mixture before cleaning; (c) Castor seeds after cleaning.
Agriculture 13 01130 g027
Table 1. Analysis of the sieving effect of different vibrating sieves.
MaterialSieve TypeCleaning ModeImpurity Content/%Cleaning Efficiency/%Loss Rate/%Reference
Rapeconical sieveAirflow-Sieve rotation 88.99%4.86%[18]
RapeCylinder sieveAirflow-Sieve rotation 84.4%5.9%[19]
SoybeanSingle-layer vibrating sieveAirflow-Sieve vibration0.70% 0.30–0.32%[20]
CornDouble-layer vibrating sieveAirflow-Sieve vibration0.73% 0.45%[21]
RiceDouble-layer vibrating sieveAirflow-Sieve vibration0.38% 1.57%[22]
RapeConcave sieveAirflow 91.97%6.13%[23]
Table 2. Analysis of the airflow field in the fan and cleaning room.
MethodStudy TargetMain ConclusionReferences
EDEM
Fluent
Cyclone separatorThe strength of particle-wall interaction increases with the increase in the solid load ratio in the cyclone separator.[29]
FluentFish scale sieveIt is beneficial to improve the cleaning efficiency when the front and middle airflow velocity of the sieve reaches the maximum.[30]
FluentCentrifugal fanThe airflow velocity of the upper outlet and the edge of the impeller is larger, and the pressure of the impeller channel increases gradually along the radial direction.[31]
ANSYSAir-sieve cleaning deviceIt is helpful to improve the cleaning effect of the material when the wind speed at the outlet of the fan increases within a certain range.[32]
EDEM
Fluent
The cleaning room of the seed harvesterThe increase in gas velocity at the entrance of the cleaning room is helpful in improving the cleaning performance, but it will aggravate the gas turbulence at the rear of the cleaning room.[33]
Table 3. Study on the sieving effect of different vibrating sieves.
Study TargetMain ConclusionReferences
Circular vibrating sieve plateThe sieving efficiency was highest when the vibration amplitude, throw index, and sieve angle were 3–3.5 mm, 2.7, and 15°, respectively.[41,42]
Single-layer equal-thickness sieveThe factors affecting the sieving efficiency were ejection angle, inclination, amplitude, and center amplitude.[43]
Single-layer vibrating sieveThe elongation of the sieve hole increases the percentage of material passing through the sieve.[44]
Banana sieveThe sieving performance can be improved by reducing the vibration frequency and tilt angle.[45]
Single-layer vibrating sieveThe sieving efficiency of circular vibration is the highest among linear, circular, and elliptical vibration modes.[46]
Table 4. The geometric dimensions of the castor shelling mixture.
ComponentLength/mmWidth/mmHeight/mm
Castor seeds8.116.2711.89
Castor shells7.515.0715.89
Two-chambered castor capsule15.629.0516.04
Table 5. The characteristic parameters of the castor shelling mixture.
ComponentQuality/gSuspension Velocity/m·s−1Poisson’s RatioElastic Modulus
/MPa
Density
/kg·m−3
Castor seeds0.317.460.2542.561094.75
Castor shells0.042.480.2550.62674.73
Two-chambered castor capsule0.8413.690.25441021.32
Table 6. Material contact parameters.
CategoryStatic Friction CoefficientDynamic Friction CoefficientCollision Recovery Coefficient
Two-chambered castor capsule—Two-chambered castor capsule 0.600.030.30
Two-chambered castor capsule—Castor seeds0.600.030.20
Two-chambered castor capsule—Castor shells 0.670.040.17
Two-chambered castor capsule—Q235 steel0.400.020.43
Castor seeds—Castor seeds0.350.020.19
Castor seeds—Castor shells0.630.030.24
Castor seeds—Q235 steel0.310.010.52
Castor shells—Castor shells0.740.050.25
Castor shells—Q235 steel0.530.030.24
Table 7. Airflow parameter setting.
ParametersNumerical Value
Velocity Magnitude(m/s)14
X-Component of Flow Direction (m)0.60403
Y-Component of Flow Direction (m)0.22106
Z-Component of Flow Direction (m)−0.77026
Turbulent Intensity (%)5
Turbulent Viscosity Ratio10
Table 8. Test-level coding table.
FactorA: Amplitude/mmB: Vibration Frequency/HzC: Transverse Angle/°
Level−17640
08750
19860
Table 9. Test scheme.
Test NumberA: Amplitude/mmB: Vibration Frequency/HzC: Transverse Angle/°Y1: Sieving Efficiency/%Y2: Loss Rate/%
1875096.964.22
2886094.535.48
3884094.874.11
4785096.482.03
5765096.115.84
6776096.213.05
7866094.986.92
8985093.655.67
9875097.114.87
10864098.514.94
11774095.932.51
12976093.145.98
13875096.464.16
14974095.652.59
15875095.825.13
16875096.873.24
17965096.175.57
Table 10. Variance analysis of sieving efficiency.
SourceSum of SquaresDegree of FreedomMean SquareF Valuep ValueSignificance
Model25.7792.8610.390.0027**
A-amplitude4.6814.6816.980.0045**
B-vibration frequency4.8714.8717.660.004**
C-transverse angle4.6514.6516.870.0045**
AB2.0912.097.570.0284*
AC1.9511.957.060.0326*
BC2.5412.549.230.0189*
A22.4712.478.960.0201*
B20.3210.321.160.3169
C21.7611.766.370.0396*
Residual1.9370.28
Lack of fit0.8530.281.050.4632
Error1.0840.27
Total27.716
Note: R2 = 0.9303, Calibration R2 = 0.8407; ** Extremely significant level (p < 0.01), * Significant level (p < 0.05). Not significant (p > 0.05).
Table 11. Variance analysis of castor seeds loss rate.
SourceSum of SquaresDegree of FreedomMean SquareF Valuep ValueSignificance
Model29.3193.269.20.004**
A-amplitude5.0915.0914.370.0068**
B-vibration frequency4.4714.4712.630.0093**
C-transverse angle6.6216.6218.710.0035**
AB3.8213.8210.80.0134*
AC2.0312.035.740.0478*
BC0.09310.0930.260.624
A21.9911.995.630.0493*
B25.4915.4915.510.0056**
C20.04510.0450.130.7323
Residual2.4870.35
Lack of fit0.3230.110.20.8942
Error2.1640.54
Total31.7916
Note: R2 = 0.9080, Calibration R2 = 0.7898; ** Extremely significant level (p < 0.01); * Significant level (p < 0.05); Not significant (p > 0.05).
Table 12. Cleaning results.
IndicatorType-1Type-2Type-3
Sieving efficiency (%)98.2396.7096.71
Loss rate (%)2.392.962.50
Table 13. Cleaning results.
Indicator14 mm Sieve Hole Diameter15 mm Sieve Hole Diameter16 mm Sieve Hole Diameter
Sieving efficiency (%)98.2396.6496.69
Loss rate (%)2.394.323.41
Table 14. Experimental results.
Parameter CombinationA: Amplitude/mmB: Vibration Frequency/HzC: Transverse Angle/°Y1: Sieving Efficiency/%Y2: Loss Rate/%Y3: Impurity Rate/%
18.4364094.687.130.68
277.7640.8195.216.090.52
396.164093.156.940.83
Disclaimer/Publisher’s Note: The statements, opinions and data contained in all publications are solely those of the individual author(s) and contributor(s) and not of MDPI and/or the editor(s). MDPI and/or the editor(s) disclaim responsibility for any injury to people or property resulting from any ideas, methods, instructions or products referred to in the content.

