Abstract
Controlled fermentation processes have high potential for improving coffee quality. The effect of fermentation temperature on beverage quality was investigated with coffee cultivated at elevations between 1166 and 1928 m. A completely randomized design was carried out at five elevation ranges at 200 m intervals in five farms per elevation range, and two temperatures (15 °C and 30 °C), which were maintained in a temperature-controlled bioreactor. Each temperature-controlled fermentation batch had a spontaneous fermentation batch (control treatment). Microbial identification of LAB and yeast was performed using a Biolog™ MicroStation™ ID System, and cup quality tests were performed following the SCA protocol. Tests conducted at 15 °C showed higher microbial community activity on the substrates used, indicating greater transformation potential than those conducted at 30 °C or those of spontaneous fermentation. According to Wilcoxon and Kruskal–Wallis tests, temperature-controlled fermentation resulted in high-quality coffee for all elevation ranges, with coffee from higher elevations and processed at controlled temperatures of 15 °C receiving the highest cup scores compared to coffee that was subjected to 30 °C. These results suggest that controlled temperature can be used to design standardized fermentation processes in order to enhance coffee quality through differentiated sensory profiles.
1. Introduction
Coffea arabica L. is the coffee species with the highest production and consumption in the world [1], mainly due to its high cup quality. The varieties of this species are produced in the intertropical zone that includes latitudes between 30° N and 33° S and elevations between 700 and 2000 m above sea level [2]. In addition to species varieties, the quality of coffee is influenced by the conditions of each stage of production ranging from cultivation to beverage, including geographical location, agronomic practices, and the postharvest process [3,4,5,6]. Recently, the effect of variations in climate on quality caused by the elevation at which crops are grown has been one of the most studied aspects of cultivation in different coffee-producing countries of the world. Previous research has identified a relationship between elevation and the chemical and microbiological compositions of coffee [3,4,6,7,8,9,10,11,12]. On the other hand, the processing method used has an important role in determining quality [5,7,13,14,15], especially with the use of the wet process, which is capable of generating a coffee beverage with balanced attributes and better acidity levels [6,16,17]. In the wet process, the elimination of mesocarp or mucilage through fermentation has great potential to positively impact the quality of coffee due to the formation of compounds that enhance the aroma and flavor of the drink; these compounds are formed from the biochemical transformations of mucilage substrates produced by the microorganisms present [6,18]. The chemical composition of green coffee beans is represented mainly by chlorogenic acids, carbohydrates, lipids, proteins, and alkaloids such as trigonelline and caffeine [19]. These compounds are the precursors of the compounds that are formed in the roast and are finally perceived in the drink [20]. However, modifications of the matrix of compounds of green coffee beans lead to the production of alcohols, esters, and ketones, among others, during fermentation [13,14,21]. Gas chromatography coupled with mass spectrometry (GC-MS) is the most commonly used technique for the analysis of volatile organic compounds in green, roasted, and beverage coffee. Headspace solid-phase microextraction (HS-SPME) in conjunction with GC-MS has identified changes in the chemical composition of green coffee due to the modification of fermentation parameters, time, and type of process [13,22,23], or due to the identification of defects [24]. The compounds identified by these and other techniques such as Near-infrared spectroscopy (NIR-HSI) or Fourier-transform infrared spectroscopy (FITR) [25,26] have been related to beverage attributes such as aroma and flavor.
Fermentation of coffee based on the wet method has traditionally been carried out spontaneously, in which a great variety of reactions occur depending on the conditions of the process; therefore, the results also vary [27]. One of the main challenges of research is to generate information that can improve the quality of coffee by changing from spontaneous fermentation to controlled fermentation to reduce variability, while improving the consistency of the quality of the coffee for the market [16,27]. During fermentation, temperature tends to increase as the process continues due to the activity of microorganisms which participate in the transformation reactions of mucilage substrates [27,28,29]. Therefore, temperature is one of the parameters that can be controlled during fermentation to modify microbial activity and produce the desired positive effects on the quality of the coffee. Some studies have shown that subjecting the fermentation process to temperatures lower than those of the environment has an influence on the behavior of the participating microbial communities, with possible effects on the quality of coffee [30,31]. The usage pattern of different carbon sources is an indicator of the change in microbial populations, and the behavior and interaction among microorganisms are modified depending on the environment that is provided during fermentation [22]. However, there is little information about the most suitable temperatures for the fermentation process or the optimal conditions of associated variables under these conditions, such as changes in the temperature and pH of the coffee mass, the need for agitation, or the process timing. Additionally, the influence of the origin-determined intrinsic characteristics of coffee on the fermentation process with controlled temperature is unknown. It has been argued that coffee produced at higher elevations has better quality characteristics [10,12,32]. Therefore, it is necessary to understand the effects of elevation at which crops are grown and the maintenance of a controlled temperature during the fermentation process on coffee quality.
In Colombia, the region that produces coffee varieties of the Arabica species is located in the Andes Mountains and the Sierra Nevada de Santa Marta between 1° and 11.5° N and 72° and 78° E, which allows coffee production at a wide range of elevations, from 800 to 2000 m [33]. The coffee zone of the department of Quindío is representative of the climate conditions and coffee production in Colombia [34]. In addition, it is characterized by having plantations with geographical proximity and at different elevations [35]. Considering these characteristics, the objective of this study was to evaluate the effect of controlled fermentation temperature, which was maintained in a stirred bioreactor tank, on the quality of coffee produced at different elevations in the department of Quindío. This study identified the effects of the variables associated with the fermentation process, depending on the control temperature and the physiological behaviors of microbial communities, on coffee quality. The results contribute to existing knowledge on the performance of controlled fermentations, and the discussion suggests future research that will contribute to the development of processes to reduce variability in the fermentation process and improve the quality of coffee.
2. Materials and Methods
2.1. Coffee Sampling and Experimental Design
Coffee fruits (Coffea arabica L. variety Castillo®) were harvested on 25 coffee-producing farms in the department of Quindío, Colombia, located at elevations between 1166 and 1928 m (Table S1). The work unit was 120 kg of coffee fruits harvested in each batch. The fruits were selected manually and classified according to their ripeness as determined by color, which ranged from 4 to 7 on the Cromacafé® scale [36]. This scale ranges from 1 (immature fruits) to 8 (dried fruits). After harvesting, the coffee fruits were taken to the El Agrado Farm, which was located 1291 m above sea level, with an average annual temperature of 21.9 °C and an annual relative humidity of 77% [34], to carry out the fermentation process and to homogenize the experimental environment. After hydraulic sorting, healthy fruits [37] were pulped using a Jotagallo Ref. 2 ¾ pulper. The pulped coffee obtained was divided into 2 equal parts of 20 kg each to conduct fermentation with temperature control (treatment) and spontaneous fermentation (control). No water was added during the process.
A one-way completely randomized design was used, with 10 treatments (Table 1) consisting of two fermentation temperature conditions (15 °C and 30 °C) and five elevation ranges. In each elevation range, the samples were collected from five farms (Figure 1).

Table 1.
Fermentation treatments, temperatures (°C), and elevation ranges (m) of coffee cultivation.
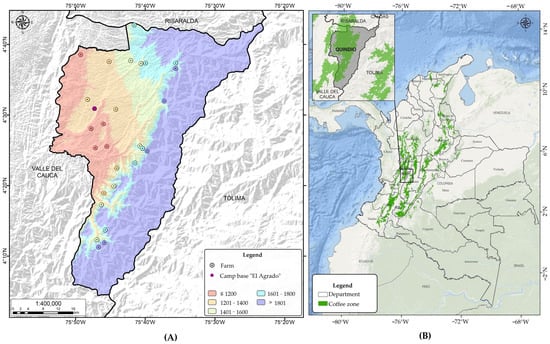
Figure 1.
Geographical location of the study area including elevation range (A) in the coffee-growing zone of Colombia (B).
2.2. Coffee Fermentation Processes
To control the temperature of the fermentation process, a bioreactor was used. The bioreactor consisted of a vertical cylindrical tank jacketed in 316 stainless steel with a volume of 30 L and an effective capacity of 20 L, a mechanical stirring system composed of a gear motor and a flat paddle stirrer, and a water recirculation system that moved water from a cooler through the jacket to vary the fermentation temperature. The equipment featured pH and temperature sensors (PT-100) and a digital control panel that was used to monitor the variables and select the speed, time, and period of agitation, which were 3 rpm, 2 min, and 6 h, respectively. For spontaneous fermentation (control), the coffee was placed in an open plastic container with a capacity of 30 L.
At the beginning and during the fermentation process, the pH and temperature of the coffee mass were determined via the direct immersion of a wireless pH meter electrode with automatic temperature compensation (HI 10532/Halo®) into the coffee mass. The equipment was calibrated before each use with buffer solutions (pH of 7.0 and pH of 4.0) (HI 7004 L/C; HI 7007 L/C; and HANNA®).
The fermentation time was determined by establishing a mucilage removal rate greater than 95%. To achieve this rate in the process without temperature control (control), the Fermaestro® method was used [38]. In the fermentation conditions with temperature control, the removal of mucilage was determined based on its degradation through the reaction with a commercial depolymerizing pectin lyase, endopolymethylgalacturonate lyase (EC 4.2.2.1.0.). The samples of coffee with mucilage (100 g, mt) were taken in triplicate, to which 1 mL of pure pectinase was added; the mixture was homogenized and allowed to rest for one hour. After this time, enzymatically degraded mucilage was removed with clean water, excess water was removed, and the mass (mf) was recorded. At the beginning of fermentation, the relationship between the coffee masses with and without mucilage (R0) was estimated. This procedure was carried out several times toward the end of the fermentation process to estimate the mass (mft) at time t, the mucilage content (CMt) which is the ratio mf/mt, and its removal rate. The final mucilage removal (Rm) was estimated according to Equation (1):
In each of the fermentation conditions with controlled temperature, the temperature at which there was a difference of less than 1 °C between the temperature of the coffee mass and the control temperature was called the equilibrium temperature. From this point on, the temperature of the coffee mass remained close to the working temperature selected in the bioreactor until the end of the fermentation process.
Once the fermentation process concluded, the coffee masses were washed with clean water and dried with forced air at 40 °C until the coffee beans reached a moisture content between 10 and 12% w.b. The samples of dry parchment coffee (dpc) weighing 1 kg were labeled and stored at 16 ± 1 °C and 65 ± 5% relative humidity until analysis.
2.3. Microorganism Identification and Physiological Profiles of Microbial Communities
At the end of the fermentation process, 50 g samples of coffee with mucilage were collected in sterile bags Whirl-Pak™, Illinois, USA (B00992 WA). The samples were refrigerated and transported to the Cenicafé Postharvest laboratory for analysis. Culture-dependent techniques were used to count the groups of microorganisms; isolate, purify, and identify the strains of interest; and identify the physiological profiles of the microbial communities present.
Serial dilutions were prepared up to 10−6, with direct sowing of 100 µL of the 10−3-to-10−6 dilutions in plate count agar (PCA), yeast glucose chloramphenicol extract (YGC), Man–Rogosa–Sharpe (MRS) agar supplemented with 0.1% sorbic acid (w/v), and Acetobacter agar supplemented with absolute ethanol, glacial acetic acid, and 10 mg/L of cycloheximide for the enumeration of aerobic mesophilic bacteria (AMB), yeasts, lactic acid bacteria (LAB), and acetic acid bacteria (AAB), respectively. Isolates from yeast colonies and LAB with distinctive morphology were selected. The isolates were purified via reseeding on the MRS and YGC media. The morphological characterization of the isolates (color, shape, surface, and elevation) was carried out; microscopic characterization was also performed using Gram stain. A total of 11 yeast isolates and 7 bacterial isolates were obtained for their subsequent identification.
By means of the Biolog™ identification and classification system (MicroStation™ ID System) and optical density readings at 590 nm (OD590) on 95 carbon sources, the genus and species of LAB and yeasts, the primary organisms in this type of fermentation, were identified following the procedures established for the use of AN MicroplateTM [39] and YT Microplate™ [40] (Biolog Inc., Hayward, CA, USA), respectively. From the pure microorganism suspension, 100 µL was taken and dispensed onto each of the wells containing 95 carbon sources with a redox indicator (tetrazolium) that changes from colorless to violet when the substrate is consumed. Absorbance readings at an optical density of 590 nm (OD590) were performed using the Biolog™ MicroStation™ ID System at 24 h for BAL and at 24, 48, and 72 h for yeasts. The color development pattern of the inoculated microplate, known as a metabolic fingerprint, was recorded and compared with the panel included in the database to determine the species or genus.
The functional diversity of the microbial communities and the community-level physiological profiles were evaluated in the samples based on the consumption of the substrates using EcoPlate™ microplates, which contain three series of 31 different carbon sources grouped into carbohydrates, carboxylic acids, polymers, amino acids, and amines. Serial dilutions were prepared up to 10−3 in sterile distilled water, and 150 µL of the samples was sown in each of the 96 wells of the EcoPlate™ microplates after calibration of the community growth. The plates were incubated at 28 °C in the dark, and color development was detected by absorbance readings at 590 nm (OD590) every 24 h until completing 192 h. The growth of the communities and the consumption of carbon sources were evaluated through the standardization and normalization of the OD590 nm values [22]. For the information analysis and the estimation of the metabolic diversity indices, the data were normalized. Only absorbance values lower than 2.0 were selected to reduce measurement errors. Higher values were outside the linear absorbance range.
2.4. Sensory Analysis of Coffee Beverage
The parchment was removed from the dpc samples through the threshing process, and healthy beans in the samples were roasted, ground, and used for the preparation of coffee beverage for sensory analysis according to the Specialty Coffee Association (SCA) protocol [41]. In this protocol, the main attributes of coffee are evaluated on a scale from 6 to 10: fragrance/aroma, flavor, aftertaste, acidity, body, balance, overall impression, uniformity, sweetness, and clean cup. The final quality of the samples was determined by summing the individual scores of these attributes (SCA points). The samples were evaluated by the Cenicafé panel composed of five certified Q-Grader tasters [42], who are qualified in coffee quality control and certified in coffee sensory analysis [43]. Each of the five tasters evaluated five cups of each coffee sample.
2.5. Statistical Analysis
The analyses were performed using the SAS/STAT software version 9.4 [44]. The average, deviation, median, minimum, and maximum of the sensory scores were obtained for the attributes (Fragance/aroma, Flavor, Aftertaste, acidity, body, balance), and a total score was produced for each combination of height and temperature. Based on the total score for all variables, for each elevation and temperature, the Wilcoxon test was performed [45] to evaluate the differences between the samples from the treatment with temperature-controlled fermentation and their respective controls (spontaneous fermentation). An analysis of variance was performed to evaluate the effect of temperature on cup quality. Since the residuals did not present a normal distribution but the variances were homogeneous, the analysis was performed using the nonparametric Kruskal–Wallis test [45].
With the set of complementary variables corresponding to the fermentation process, including elevation (masl), temperature during fermentation, mucilage content, final process time, initial and final pH, initial and final temperature, and percentage of fruits in a state of maturity and immaturity, decision-tree classification was used to identify the conditions that favored obtaining a clean cup. This procedure was carried out using the WEKA tool, applying the algorithm or statistical classifier J48 for the decision tree [46].
The analysis of physiological profiles of microbial communities was performed using a 5% LSD test on the carbon source groups to determine the differences between the control treatments (spontaneous fermentations) and the treatment samples with controlled temperature. A principal component analysis (PCA) was carried out to reduce the dimensionality of the variable space and identify the relationship between the variables based on the components. This association was illustrated using a biplot. Additionally, a hierarchical grouping analysis of the variables and treatments was performed, the results of which are represented by a heatmap. The results were obtained using the R software version 4.1.1 [47] with the gplots package version 3.1.3 [48].
3. Results
3.1. Description of Coffee Fermentation Processes
The initial conditions of the fermentation process yielded a mucilage content between 27 and 31% and an initial temperature between 20.9 and 22.8 °C. These values presented an upward and downward trend, respectively, with an increase in the elevation of the crop related to the average climatic conditions for each farm (Figure S1). The initial pH in all the samples from different elevation ranges remained in a narrow range of variation close to 5.25. The pH and temperature at the end of fermentation varied according to the processes (Figure 2). The controlled fermentation conditions presented a final pH value close to 4.0, while the value for spontaneous fermentation was close to 3.70. The final temperature of the coffee mass depended on the control temperature, and spontaneous fermentation, dependent on the ambient temperature, had an increase of approximately 4 °C.
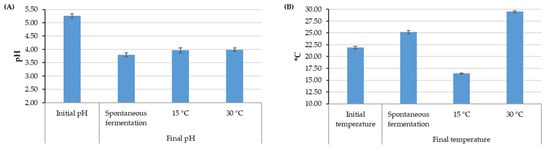
Figure 2.
Averages and 95% confidence intervals for pH values (A) and temperature values (B) for fermentation with and without temperature control.
The final fermentation time, as determined by the mucilage removal criterion (equal to or greater than 95% removal), differed significantly depending on the fermentation temperature. The spontaneous fermentation process presented an average of 15.7 h, with a range between 12 and 19 h, while in the controlled processes, a longer fermentation time was needed, which was approximately between 36 and 48 h for 15 °C and between 16 and 22 h for 30 °C. Likewise, the time analysis of the balance between the control temperature and the fermenting coffee mass showed that in the controlled processes, the coffee mass was under the selected temperature for more than 20 and 5 h for 15 °C and 30 °C, respectively (Figure 3A). During this time, a decrease in pH was recorded, indicating that fermentation continued from the moment that the equilibrium temperature was reached, and the pH of the process ranged between 4.13 and 4.43 (Figure 3B).
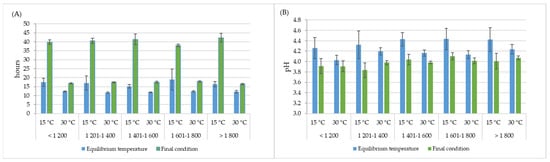
Figure 3.
Averages and 95% confidence intervals of time (A) and pH values (B) at equilibrium temperature (blue bars) for different fermentation processes, and final conditions (green bars) for fermentation with temperature control at all elevations (m).
3.2. Microorganism Identification and Physiological Profiles of Microbial Communities
The AAB population count was the lowest among the groups of microorganisms, with an average of 5.4 log CFU/mL, while the counts of AMB and LAB were close to 8 log CFU/mL. At the same time, the yeast count had an average of 7.7 log CFU/mL, and this value did not differ by treatment (Table S2). Of these microorganisms, 44 strains were isolated, purified, and then identified using the culture-dependent methods based on identification plates with 95 substrates specific for LAB and yeasts, mainly the genera Lactobacillus, Hanseniaspora, and Pichia (Table 2). Table 2 also shows the similarity index (SIM) value, which indicates the correct identification of a sample; a value of one indicates a perfect match, a value of zero means that there is no match, and a value close to one indicates a good match. For the YT plates used for yeast identification, the SIM value is >0.75 at 24 h of incubation and >0.5 at 48 or 72 h of incubation. For the AN plate used in the identification of LAB, the SIM value is >0.5 between 20 and 24 h of incubation. Likewise, the DIS value indicates the approximate number of discrepancies between the results of the microplates and the patterns identified from a database for these species, and a lower value indicates a better match. For the strains identified as Lactobacillus (reported in Table 2), the SIM value is lower than the value required by the system for identification at the species level, so identification was performed at the genus level.
Table 2.
Identification of lactic acid bacteria (LAB) and yeasts isolated from the wet fermentation of coffee beans using the BiologTM System.
Of the 31 carbon sources supplied to the microbial communities to determine the physiological profiles, differences in adaptation were observed colorimetrically (Figure S2). Once the data were standardized, the consumption of substrates in each sample was determined based on the average value of the activity on each compound (OD590). The data matrix was subjected to PCA for exploration and visualization of the information based on the variances in the samples (Figure 4). The first component explains 84.59% of the variability, and most of the substrates used by the microbial communities were associated with this component. In the analysis of the information based on elevation, no differences were identified between the established ranges. Therefore, the projection of the variables was carried out using the variable temperature. The compounds that contributed the most to variability were carbohydrates and carboxylic acids. Most of the substrates were associated with the first component, while the second component was mainly associated with two compounds, i-erythritol and 2-hydroxy benzoic acid. Likewise, the groupings are shown in the figure based on the fermentation temperature: 30 °C in the lower right quadrant, 15 °C in the left quadrant, and spontaneous fermentation in the upper right quadrant.
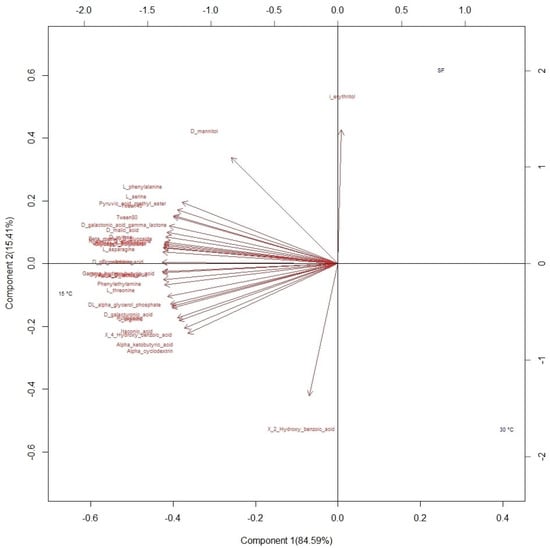
Figure 4.
Biplot of substrate consumption by microbial communities during fermentation projected on three fermentation conditions: spontaneous fermentation (SF) and temperature-controlled fermentation at 15 °C and 30 °C.
The analysis of the least significant difference (LSD at 5%) carried out on a group of substrates showed that the microbial communities in the controls did not differ in their behavior before the application to different compounds; however, a significantly greater change was observed (p < 0.05) in the communities isolated from the fermentation conditions with controlled temperature, mainly for those carried out at 15 °C for the consumption of carbohydrates, carboxylic acids, and amino acids (Table S3).
Additionally, the heatmap shows the change in substrate consumption values between spontaneous fermentation and fermentation with temperature control (Figure 5). The hierarchical grouping indicates three groups of compounds based on the activity of the microbial communities on them: the first group is composed of two polyalcohols, i-erythritol and D-mannitol. The second group consists mostly of aromatic carboxylic acids, amines, polysaccharides, and most amino acids, and the third group consists of carbohydrates such as monosaccharides, acid sugars, disaccharides, and short-chain acids. The hierarchical grouping separates the behavior of the community isolated from the fermentation process carried out at 15 °C, since the activity on these substrates tends to be higher for most compounds, especially the carbohydrates of the third group.
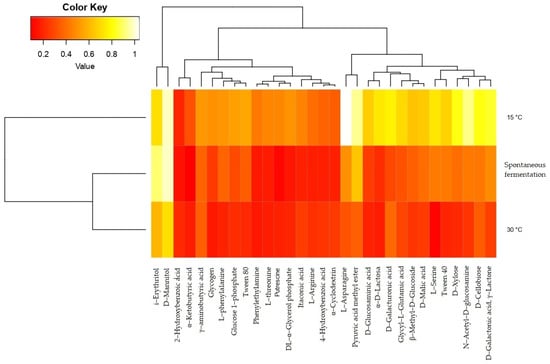
Figure 5.
Heatmap of the analysis of groups of substrates consumed by microbial communities from fermentation with temperature control (15 °C and 30 °C) and without temperature control (spontaneous fermentation).
3.3. Coffee Beverage Quality
The coffee obtained from different fermentation processes was ranked as “specialty coffees” and categorized “very good” and “excellent”, according to the classification scheme of the SCA [41]. The fermentation performed at a temperature of 15 °C and the coffee from above 1800 masl obtained the highest percentage of samples with clean cups, at 91.3% and 100%, respectively. These results agree with the grouping by temperature according to the consumption of substrates of the microbial communities from fermentation at 15 °C, which presented higher activity, growth, and transformation capacity of the compounds. The quality of coffee obtained by spontaneous fermentation used as the control did not show significant differences (p > 0.05, based on the Wilcoxon test), which enabled the comparison of the quality among the treatments. In general, higher scores were observed for fermentation carried out with temperature control than for spontaneous fermentation, and significantly higher quality was found (p < 0.05, based on the Kruskal–Wallis test) only when fermentation was performed at 30 °C with coffee coming from plantations between 1201 and 1400 masl.
On the other hand, considering only fermentation temperature, the average, minimum, and maximum values for the total score of the sensory evaluation were higher for fermentation performed at 15 °C (Table 3). Moreover, considering the elevation range of the crop, the coffee quality scores did not follow a defined pattern, although the highest average SCA score values were obtained for coffee produced at elevations higher than 1800 m, which was also the elevation range with the least variability independent of the fermentation temperature. However, no significant differences were observed in cup quality, regardless of temperature and elevation range (p > 0.05, according to the Kruskal–Wallis test).
Table 3.
Descriptive statistics for coffee quality (SCA points) obtained via the fermentation of coffee cultivated at different elevations with and without temperature control.
The scores for the attributes of the samples that presented clean cups ranged between 7.0 and 8.0. The graphs of the averages are shown in Figure 6. Fragrance/aroma was the attribute that stood out the most for fermentation at 15 °C with coffee grown above 1800 m and between 1401 and 1600 m, as well as for fermentation at 30 °C with coffee produced between 1401 and 1800 m. Acidity was also highlighted, especially when coffee produced between 1401 and 1600 m was fermented at a controlled temperature of 15 °C. Body and aftertaste were highlighted in the coffee produced between 1401 and 1600 m when the fermentation process was controlled at 30 °C.
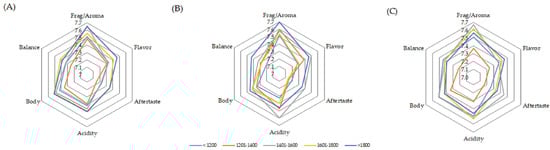
Figure 6.
Averages of the main attributes of coffee beverage quality obtained for spontaneous fermentation (A) and temperature-controlled fermentation at 15 °C (B) and 30 °C (C).
Finally, using a decision-tree classification method based on the data for all the variables measured in this study, two main variables were obtained: elevation of the crop and fermentation temperature (Figure 7). Using this method, an adequate classification of 84.4% is achieved, indicating that for coffee produced at an elevation above 1600 m, there is a high probability of obtaining a clean cup, regardless of the fermentation temperature. For coffee grown below this elevation, a higher probability of a clean cup is obtained when the fermentation temperature is below 30 °C.
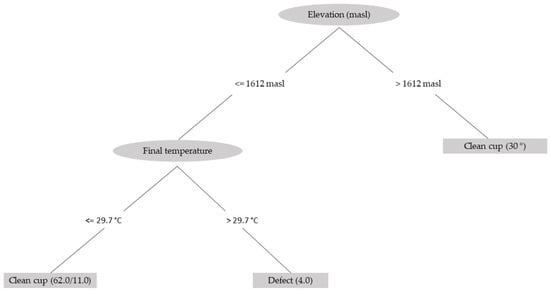
Figure 7.
Schematic of the decision tree used to determine the characteristics of coffee with a clean cup from the variables associated with the fermentation process measured in this study.
4. Discussion
Fermentation is an important stage in the postharvest process to obtain high-quality coffee. This study proposed an approach for the application of temperature-controlled fermentation based on the knowledge of variables that influence the fermentation process for coffee grown on different coffee farms located at a wide range of elevations. The starting point was information about the initial characteristics of the fruits, which change depending on the origin; the higher the elevation is, the higher the relative humidity and precipitation, and the lower the ambient temperature (Table S1) [34]. These factors, together with the rheological characteristics of mucilage, such as its strong water retention capacity [49], cause the proportion of mucilage in the fruits to vary according to the climatic condition that is present at the time of harvest, with the proportion being higher at higher elevations (Figure S1). The temperature conditions of the camp base, where the fermentation process was carried out, kept the time needed for spontaneous fermentation within a narrow range of variation. Regardless of the origin of the coffee, cultivation elevation can modify some factors at the bean level, such as size [15] or apparent density (Table S4), but it does not affect the fermentation process. Moreover, the initial temperature was influenced by the heat at the growing site, given its inverse relationship with the elevation of the crop, which imposed a challenge to obtaining a control temperature during fermentation, especially for the treatment at 15 °C and beans from a low elevation. However, the time needed to reach an equilibrium temperature depended on the control temperature: between 15 and 19 h for fermentation at 15 °C and between 11 and 12 h for fermentation at 30 °C to achieve values that remained stable at 16.4 ± 0.1 °C and 29.5 ± 0.2 °C, respectively, until the end of the fermentation process. These values corresponded to the point at which the temperature of the coffee mass was similar to the control temperature. Other studies that considered modifications to the ambient temperature indicated that an increase in this variable was typical of spontaneous fermentation under the conditions applied, since they presented an increase of between 3 and 5 °C [29,50].
On the other hand, it is evident that the duration of fermentation depends on the temperature at which the process is carried out; therefore, it is important to establish reference parameters to identify the conclusion of the process, such as the removal of mucilage, to guarantee that the fermentation process has been performed well. It is known that incomplete fermentation and overfermentation have a high probability of affecting sensory quality [6,9,16,51]. Some proposed methods to improve coffee quality have included fixing the fermentation time [14,21,52] and establishing the temperature change as criteria for defining the duration of the process [10,11]. However, the duration of fermentation can be one of the most variable aspects, depending on external conditions, and short times at low temperatures could limit the desired development of fermentation and influence the final result. This is the case for fermentation carried out at 11 °C for 24 h, in which only a greater abundance of genes related to microbial activity was observed in the final sample [30]. In contrast, prolonged fermentation times without temperature control could generate overfermentation, which also affects quality [16,53]. Our results suggest that temperature control prolongs fermentation even when this control is carried out at temperatures greater than the ambient temperature. In addition, temperature control affects the behaviors of other parameters such as pH, such that the controlled fermentation conditions presented a value close to 4.00 in contrast to the value of 3.70 in spontaneous fermentation. Although a direct association has not been found between the final pH value during fermentation and the quality of the resulting coffee [54], some authors suggested that it is advisable to allow fermentation to continue until the pH values fall below 4.0 to improve quality [16,55,56].
The high microbial diversity, which is characteristic of coffee fermentation, allows us to intuit that a great variety of microorganisms are active on the mucilage, although the conditions of the process are varied. The indices of diversity, uniformity, and richness of the microbial communities determined based on the consumption of substrates at the end of the fermentation process account for this result in an indirect way, since they demonstrate the ability of microorganisms to grow in different carbon sources, such as lactic acid and malic acid (BAL) [57], and different types of carbohydrates (yeasts) [52,57,58,59,60]. The results are related to the high metabolic activity of the microorganisms that participated in the fermentation process, especially when fermentation was carried out at 15 °C (Table S3). Fermentation of coffee is dominated mainly by mesophilic microorganisms, whose populations are the most abundant [59,61]. In general, the counts of all the microbial groups were higher for fermentation carried out at 15 °C. Microorganisms of the LAB and yeast groups are considered to play an important role in the development of desired metabolites during coffee fermentation [10,52,57,59,62]. In this work, the populations of these microbial groups had the highest proportions (Table S2). The microorganisms identified at the end of the fermentation process in this study, i.e., the genera Lactobacillus, Leuconostoc, Hanseniaspora, Pichia, and Candida, have been frequently reported in coffee fermentation, with a tendency to increase in population size during the course of the fermentation process [23,60,63]. Other genera of yeasts and LAB identified in this work in the treatments with temperature control are less abundant but are present in coffee fermentation. Cryptococcus has been observed and is likely related to pectinolytic activity [27]. Weisella [56,59] has been strongly related to the production of acetoin, a desired metabolite for the quality of coffee in crops grown at an elevation of 1000 m in Brazil [64]. For Schizosaccharomyces pombe, reports are scarce, and its presence seems to be more frequently related to the fermentation of cocoa than coffee [65]. However, in this research, it was detected in the temperature-controlled fermentation of coffee grown at elevations between 1200 and 1600 m.
Although it has been argued that the climatic conditions at higher elevations are a determining factor in coffee quality [10,11,12], this study showed that it is possible to produce high-quality coffee from crops grown at a wide range of elevations and processes through both spontaneous fermentation and temperature-controlled fermentation. Even though significant differences in sensory scores are absent, the behaviors observed are more closely related to the modifications made to the fermentation process than to the origin of the coffee. This result is similar to that obtained in other producing countries, with different particularities at each site [21,23]. Fermentation processes, different from the spontaneous process, have resulted in changes in the chemical composition of green coffee beans, which are perceived later in the drink as having fruity, floral, and caramel notes [22,31]. The tendency to obtain lower scores for flavor/aroma with the treatments carried out at 15 °C could be related to the formation of compounds, such as organic acids, aldehydes, esters, and ketones, that are formed during fermentation and highlight the sensory profiles of coffee [30,31]. This is related to the greater activity of the microbial communities on the substrates used from fermentation with controlled temperature at this temperature (Figure 5).
Our results indicate that the main differences in quality as determined by elevation could be summarized into two conditions: cultivation above and below 1600 masl. This finding should be considered in future research. Likewise, controlled fermentation at 30 °C had a negative effect on coffee produced at elevations below 1400 m, which is probably related to the increase in the activity of bacteria that produce organic acids and alcohols, such as ethanol and mannitol. These organic acids are oxidized to acetic acid by AAB, such as Gluconobacter and Acetobacter [59], whose greater abundance is related to the fermentation of low-elevation coffee and the lowest pH values [54].
Controlling the fermentation temperature is necessary not only for the process development, but also to satisfy the demands of consumers regarding the improvement in coffee sensory profiles. In this sense, the main efforts with promising results have focused on achieving control of fermentation through the establishment of microbial starter cultures, the activity of which produces compounds that modify the chemistry of the coffee beans and highlight the attributes of the drink [11,16,27,61,66,67,68]. Based on the results obtained in this research, temperature control is another mechanism by which the same effect can be achieved to determine the optimal conditions that can support the desired behaviors among native microbiota. In addition, the use of starter cultures can lead to contamination in open tanks [27], and this approach is associated with a high cost, although it can be compensated by the value of specialty coffee, especially when it exceeds 85 points in the SCA scale [68]. Finally, fermentation is a stochastic process in which it is difficult to control the large number of factors that influence the ability to achieve high-quality coffee and the desired consistency. However, temperature control is one of the simplest methods by which to reduce this variability. Given the exothermic characteristics of fermentation, the results of this research suggest the need for further innovations in the evolution of this process, the developments of machinery and equipment that take into account the need for agitation, and the use of cylindrical tanks and/or materials that allow the transfer of heat at the desired levels.
5. Conclusions
This study showed that performing fermentation at a controlled temperature generated changes in the process conditions, such as the time needed for the degradation of mucilage, as well as the temperature and the activity of the microbial communities present, which indicated the potential to alter the fermentation process to improve the quality of the drink. The potential of obtaining high-quality coffee from crops cultivated at all the elevation ranges evaluated was also confirmed. However, the number of samples with a clean cup was higher when fermentation was carried out at 15 °C. Compared to spontaneous fermentation, fermentation at 15 ° C resulted in a 5.9% improvement in clean cups, while fermentation at 30 ° C resulted in a 15.3% improvement. The lowest cup scores were obtained when fermentation was carried out at 30 °C with coffee produced at elevations below 1200 m; these scores were significantly different from those for coffee processed at 15 °C and cultivated at 1200 m. The highest cup quality score was 85 SCA points and corresponded to temperature-controlled fermentation of coffee cultivated at the highest elevation. Our findings are relevant for the development and design of controlled fermentation processes, with temperature serving as an initial parameter for improving the sensory experience of coffee.
Supplementary Materials
The following are available online at https://www.mdpi.com/article/10.3390/agriculture13061132/s1. Figure S1: Averages and 95% confidence intervals for mucilage content (%) (A) and initial temperature of coffee mass (B) at the beginning of fermentation. Figure S2: Color development (AWCD) in samples obtained at the end of fermentation with and without controlled temperature. Table S1: Information on the geographical locations and average environmental conditions of the coffee farms sampled in the department of Quindío, Colombia. Table S2: Microbial populations in the coffee samples at the end of the fermentation period with and without temperature control for coffee grown at each elevation range (log CFU/mL). Table S3: Averages and standard deviations of diversity (H), richness (S), and evenness (E) for fermentation with and without temperature control for coffee grown at each elevation range. Table S4: Averages and standard deviations of the bulk density of green coffee beans (kg/m3).
Author Contributions
Conceptualization, A.E.P.-M.; methodology, A.E.P.-M. and R.M.-R.; formal analysis, S.M.-R. and R.M.-R.; investigation, S.M.-R.; data curation, A.E.P.-M. and S.M.-R.; writing—original draft preparation, A.E.P.-M.; writing—review and editing, S.M.-R. and R.M.-R.; supervision, A.E.P.-M.; project administration, A.E.P.-M. All authors have read and agreed to the published version of the manuscript.
Funding
This research was developed under the project: “Experimental Development for the Competitiveness of the Coffee Sector of the Department of Quindío”, code 2017000100099, financed by the General System of Royalties, Gobernación de Quindío in agreements signed with the National Colombian Coffee Growers Federation (Cenicafé–Crossref Funder ID 100019597). No. 002-of-2020.
Institutional Review Board Statement
Not applicable.
Data Availability Statement
Not applicable.
Acknowledgments
The authors are grateful to the Department of Quindío Committee of the Colombian Coffee Growers Federation (FNC) and the National Coffee Research Center—Cenicafé; the farmers that supported and allowed sample collection for wet processing; Ingrid Hower and Juan Manuel Rendón for their support in sample collection and fieldwork; and Alvaro Gaitán, for their support and advice.
Conflicts of Interest
The authors declare no conflict of interest.
References
- International Coffee Organization. Coffee Market Report—Diciembre 2022. Available online: https://www.ico.org/documents/cy2022-23/cmr-1222-e.pdf (accessed on 21 March 2023).
- Bunn, C.; Läderach, P.; Pérez Jimenez, J.G.; Montagnon, C.; Schilling, T. Multiclass Classification of Agro-Ecological Zones for Arabica Coffee: An Improved Understanding of the Impacts of Climate Change. PLoS ONE 2015, 10, e0140490. [Google Scholar] [CrossRef] [PubMed]
- Girma, B.; Gure, A.; Wedajo, F. Influence of Altitude on Caffeine, 5-Caffeoylquinic Acid, and Nicotinic Acid Contents of Arabica Coffee Varieties. J. Chem. 2020, 2020, 3904761. [Google Scholar] [CrossRef]
- Joët, T.; Laffargue, A.; Descroix, F.; Doulbeau, S.; Bertrand, B.; de Kochko, A.; Dussert, S. Influence of Environmental Factors, Wet Processing and Their Interactions on the Biochemical Composition of Green Arabica Coffee Beans. Food Chem. 2010, 118, 693–701. [Google Scholar] [CrossRef]
- Kassaye, T.; Desalegn, A.; Derbew, B.; Pascal, B. Biochemical Composition of Ethiopian Coffees (Coffea Arabica L.) as Influenced by Variety and Postharvest Processing Methods. Afr. J. Food Sci. 2019, 13, 48–56. [Google Scholar] [CrossRef]
- Bastian, F.; Hutabarat, O.S.; Dirpan, A.; Nainu, F.; Harapan, H.; Emran, T.B.; Simal-Gandara, J. From Plantation to Cup: Changes in Bioactive Compounds during Coffee Processing. Foods 2021, 10, 2827. [Google Scholar] [CrossRef]
- Amalia, F.; Aditiawati, P.; Yusianto; Putri, S.P.; Fukusaki, E. Gas Chromatography/Mass Spectrometry-Based Metabolite Profiling of Coffee Beans Obtained from Different Altitudes and Origins with Various Postharvest Processing. Metabolomics 2021, 17, 69. [Google Scholar] [CrossRef]
- Bodner, M.; Morozova, K.; Kruathongsri, P.; Thakeow, P.; Scampicchio, M. Effect of Harvesting Altitude, Fermentation Time and Roasting Degree on the Aroma Released by Coffee Powder Monitored by Proton Transfer Reaction Mass Spectrometry. Eur. Food Res. Technol. 2019, 245, 1499–1506. [Google Scholar] [CrossRef]
- da Silva Oliveira, E.C.; da Luz, J.M.R.; de Castro, M.G.; Filgueiras, P.R.; Guarçoni, R.C.; de Castro, E.V.R.; da Silva, M.d.C.S.; Pereira, L.L. Chemical and Sensory Discrimination of Coffee: Impacts of the Planting Altitude and Fermentation. Eur. Food Res. Technol. 2022, 248, 659–669. [Google Scholar] [CrossRef]
- Martins, P.M.M.; Batista, N.N.; Miguel, M.G.d.C.P.; Simão, J.B.P.; Soares, J.R.; Schwan, R.F. Coffee Growing Altitude Influences the Microbiota, Chemical Compounds and the Quality of Fermented Coffees. Food Res. Int. 2020, 129, 108872. [Google Scholar] [CrossRef]
- Bressani, A.P.P.; Martinez, S.J.; Batista, N.N.; Simão, J.B.P.; Dias, D.R.; Schwan, R.F. Co-Inoculation of Yeasts Starters: A Strategy to Improve Quality of Low Altitude Arabica Coffee. Food Chem. 2021, 361, 130133. [Google Scholar] [CrossRef]
- Soares Ferreira, D.; Eduardo da Silva Oliveira, M.; Rodrigues Ribeiro, W.; Altoé Filete, C.; Toledo Castanheira, D.; Cesar Pereira Rocha, B.; Polonini Moreli, A.; Catarina da Silva Oliveira, E.; Carvalho Guarçoni, R.; Partelli, F.L.; et al. Association of Altitude and Solar Radiation to Understand Coffee Quality. Agronomy 2022, 12, 1885. [Google Scholar] [CrossRef]
- Zhang, S.J.; De Bruyn, F.; Pothakos, V.; Contreras, G.F.; Cai, Z.; Moccand, C.; Weckx, S.; De Vuyst, L. Influence of Various Processing Parameters on the Microbial Community Dynamics, Metabolomic Profiles, and Cup Quality During Wet Coffee Processing. Front. Microbiol. 2019, 10, 2621. [Google Scholar] [CrossRef] [PubMed]
- Cortés-Macías, E.T.; López, C.F.; Gentile, P.; Girón-Hernández, J.; López, A.F. Impact of Post-Harvest Treatments on Physicochemical and Sensory Characteristics of Coffee Beans in Huila, Colombia. Postharvest Biol. Technol. 2022, 187, 111852. [Google Scholar] [CrossRef]
- Louzada Pereira, L.; Carvalho Guarçoni, R.; Soares Cardoso, W.; Côrrea Taques, R.; Rizzo Moreira, T.; da Silva, S.F.; Schwengber ten Caten, C. Influence of Solar Radiation and Wet Processing on the Final Quality of Arabica Coffee. J. Food Qual. 2018, 2018, 6408571. [Google Scholar] [CrossRef]
- Elhalis, H.; Cox, J.; Zhao, J. Coffee Fermentation: Expedition from Traditional to Controlled Process and Perspectives for Industrialization. Appl. Food Res. 2023, 3, 100253. [Google Scholar] [CrossRef]
- Girma, B.; Sualeh, A. A Review of Coffee Processing Methods and Their Influence on Aroma. Int. J. Food Eng. Technol. 2022, 6, 7. [Google Scholar] [CrossRef]
- Haile, M.; Kang, W.H. The Role of Microbes in Coffee Fermentation and Their Impact on Coffee Quality. J. Food Qual. 2019, 2019, 4836709. [Google Scholar] [CrossRef]
- Pinheiro, P.F.; Pinheiro, C.A.; Osório, V.M.; Pereira, L.L. Chemical Constituents of Coffee. In Quality Determinants in Coffee Production; Louzada Pereira, L., Rizzo Moreira, T., Eds.; Springer International Publishing: Cham, Switzerland, 2021; pp. 209–254. ISBN 978-3-030-54437-9. [Google Scholar]
- Barbosa, M.d.S.G.; Scholz, M.B.d.S.; Kitzberger, C.S.G.; Benassi, M.d.T. Correlation between the Composition of Green Arabica Coffee Beans and the Sensory Quality of Coffee Brews. Food Chem. 2019, 292, 275–280. [Google Scholar] [CrossRef]
- Barbosa, I.d.P.; de Oliveira, A.C.B.; Rosado, R.D.S.; Sakiyama, N.S.; Cruz, C.D.; Pereira, A.A. Sensory Quality of Coffea Arabica L. Genotypes Influenced by Postharvest Processing. Crop Breed. Appl. Biotechnol. 2019, 19, 428–435. [Google Scholar] [CrossRef]
- Peñuela Martínez, A.E.; Romero-Tabarez, M.; Zapata-Zapata, A.D. Functional Diversity of Microbial Communities Associated with Fermentation Processes in Coffee (Coffea Arabica L.). Coffee Sci. 2021, 16, e161825. [Google Scholar] [CrossRef]
- De Bruyn, F.; Zhang, S.J.; Pothakos, V.; Torres, J.; Lambot, C.; Moroni, A.V.; Callanan, M.; Sybesma, W.; Weckx, S.; De Vuyst, L. Exploring the Impacts of Postharvest Processing on the Microbiota and Metabolite Profiles during Green Coffee Bean Production. Appl. Environ. Microbiol. 2017, 83, e02398-16. [Google Scholar] [CrossRef] [PubMed]
- Toci, A.T.; Farah, A. Volatile Fingerprint of Brazilian Defective Coffee Seeds: Corroboration of Potential Marker Compounds and Identification of New Low Quality Indicators. Food Chem. 2014, 153, 298–314. [Google Scholar] [CrossRef] [PubMed]
- Craig, A.P.; Franca, A.S.; Oliveira, L.S.; Irudayaraj, J.; Ileleji, K. Fourier Transform Infrared Spectroscopy and near Infrared Spectroscopy for the Quantification of Defects in Roasted Coffees. Talanta 2015, 134, 379–386. [Google Scholar] [CrossRef] [PubMed]
- Tolessa, K.; Rademaker, M.; Baets, B.D.; Boeckx, P. Prediction of Specialty Coffee Cup Quality Based on near Infrared Spectra of Green Coffee Beans. Talanta 2016, 150, 367–374. [Google Scholar] [CrossRef] [PubMed]
- Poltronieri, P.; Rossi, F. Challenges in Specialty Coffee Processing and Quality Assurance. Challenges 2016, 7, 19. [Google Scholar] [CrossRef]
- Velmourougane, K. Impact of Natural Fermentation on Physicochemical, Microbiological and Cup Quality Characteristics of Arabica and Robusta Coffee. Proc. Natl. Acad. Sci. India Sect. B Biol. Sci. 2013, 83, 233–239. [Google Scholar] [CrossRef]
- Correa, E.C.; Jiménez-Ariza, T.; Díaz-Barcos, V.; Barreiro, P.; Diezma, B.; Oteros, R.; Echeverri, C.; Arranz, F.J.; Ruiz-Altisent, M. Advanced Characterisation of a Coffee Fermenting Tank by Multi-Distributed Wireless Sensors: Spatial Interpolation and Phase Space Graphs. Food Bioprocess Technol. 2014, 7, 3166–3174. [Google Scholar] [CrossRef]
- Vera Pacheco, K.; Valdivieso Quintero, W.; Mantilla-Paredes, A.J.; Jaimes, W.; Torrado, J.; Zafra, G. Functional Metagenomic Analysis of the Coffee (Coffea Arabica) Fermentation. Chem. Eng. Trans. 2018, 64, 355–360. [Google Scholar] [CrossRef]
- Peñuela-Martínez, A.E.; Zapata-Zapata, A.D.; Durango-Restrepo, D.L. Performance of Different Fermentation Methods and the Effect on Coffee Quality (Coffea arabica L.). Coffee Sci. 2018, 13, 465–476. [Google Scholar] [CrossRef]
- Silveira, A.d.S.; Pinheiro, A.C.T.; Ferreira, W.P.M.; da Silva, L.J.; Rufino, J.L.d.S.; Sakiyama, N.S. Sensory Analysis of Specialty Coffee from Different Environmental Conditions in the Region of Matas de Minas, Minas Gerais, Brazil. Rev. Ceres 2016, 63, 436–443. [Google Scholar] [CrossRef]
- Juan Carlos García, L.; Posada-Suárez, H.; Läderach, P. Recommendations for the Regionalizing of Coffee Cultivation in Colombia: A Methodological Proposal Based on Agro-Climatic Indices. PLoS ONE 2014, 9, e113510. [Google Scholar] [CrossRef]
- Plataforma Agroclimática Cafetera—Agroclima. Available online: https://agroclima.cenicafe.org/caracterizacion-agroclimatica (accessed on 29 March 2023).
- Paisaje Cultural Cafetero de Colombia (PCC). Available online: https://paisajeculturalcafetero.org.co/departamento-del-quindio/ (accessed on 29 March 2023).
- Peñuela-Martínez, A.E.; Guerrero, A.; Sanz-Uribe, J.R. Cromacafé® Herramienta Para Identificar Los Estados de Madurez de Las Variedades de Café de Fruto Rojo. Avances Técnicos Cenicafé 2022, 535, 1–8. [Google Scholar] [CrossRef]
- Oliveros-Tascón, C.-E.; Rodriguez-Valencia, N.; Ramírez, C.A.; Velásquez-Henao, J. Método de Las Dos Canecas: Para Separar Flotes En Pequeños Lotes de Frutos de Café. Av. Técnicos Cenicafé 2020, 519, 1–8. [Google Scholar] [CrossRef]
- Peñuela-Martínez, A.E.; Pabón, J.; Sanz-Uribe, J.R. Método Fermaestro: Para Determinar La Finalización de La Fermentación Del Mucílago de Café. Av. Técnicos Cenicafé 2013, 431, 1–8. [Google Scholar] [CrossRef]
- Biolog, Inc. Anaerobe Identification Test Panel. Available online: https://www.biolog.com/wp-content/uploads/2020/04/00A-006rB-AN-Sell-Sheet-Jul07.pdf (accessed on 10 January 2023).
- Biolog, Inc. Yeast Identification Test Panel. Available online: https://www.biolog.com/wp-content/uploads/2020/05/00A-009-YT_sell-sheet.pdf (accessed on 15 January 2023).
- Specialty Coffee Association (SCA). Available online: https://www.scaa.org/PDF/resources/cupping-protocols.pdf (accessed on 30 March 2023).
- Seninde, D.R.; Chambers, E. Coffee Flavor: A Review. Beverages 2020, 6, 44. [Google Scholar] [CrossRef]
- Coffee Quality Institute. Available online: https://www.coffeeinstitute.org/ (accessed on 15 March 2023).
- SAS Institute Inc SAS/STAT 2016. Available online: https://support.sas.com/documentation/onlinedoc/91pdf/sasdoc_91/stat_ug_7313.pdf (accessed on 25 March 2023).
- Kruskal, W.H.; Wallis, W.A. Use of Ranks in One-Criterion Variance Analysis. J. Am. Stat. Assoc. 1952, 47, 583–621. [Google Scholar] [CrossRef]
- Frank, E.; Hall, M.; Witten, I. The Weka Workbench. In Data Mining: Practical Machine Learning Tools and Techniques; Morgan Kaufmann: Burlington, MA, USA, 2016; p. 128. ISBN 0-12-804291-5. [Google Scholar]
- R Core Team R: A Language and Environment for Statistical Computing. Available online: https://www.r-project.org/ (accessed on 27 March 2023).
- Warnes, G.R.; Bolker, B.M.; Bonebakker, L.; Gentleman, R.; Huber, W.; Liaw, A.; Lumley, T.; Maechler, M.; Magnusson, A.; Moeller, S.; et al. Various R Programming Tools for Plotting Data [R Package Gplots Version 3.1.1.]; R Foundation for Statistical Computing: Viena, Austria, 2021. [Google Scholar]
- Oliveros, C.E.; Gunasekaran, S. Rheological Characterization of Coffee Mucilage. J. Food Process Eng. 1996, 19, 331–342. [Google Scholar] [CrossRef]
- Osorio Pérez, V.; Álvarez-Barreto, C.I.; Matallana, L.G.; Acuña, J.R.; Echeverri, L.F.; Imbachí, L.C. Effect of Prolonged Fermentations of Coffee Mucilage with Different Stages of Maturity on the Quality and Chemical Composition of the Bean. Fermentation 2022, 8, 519. [Google Scholar] [CrossRef]
- Sanz-Uribe, J.R.; Velásquez-Henao, J. Producción de Café Con Fermentaciones Incompletas y Fermentaciones Prolongadas Utilizando El Fermaestro®. Rev. Cenicafé 2022, 73, e73105. [Google Scholar] [CrossRef]
- Martinez, S.J.; Bressani, A.P.P.; Simão, J.B.P.; Pylro, V.S.; Dias, D.R.; Schwan, R.F. Dominant Microbial Communities and Biochemical Profile of Pulped Natural Fermented Coffees Growing in Different Altitudes. Food Res. Int. 2022, 159, 111605. [Google Scholar] [CrossRef]
- Lee, L.W.; Cheong, M.W.; Curran, P.; Yu, B.; Liu, S.Q. Coffee Fermentation and Flavor—An Intricate and Delicate Relationship. Food Chem. 2015, 185, 182–191. [Google Scholar] [CrossRef] [PubMed]
- Peñuela-Martínez, A.E.; Velasquez-Emiliani, A.V.; Angel, C.A. Microbial Diversity Using a Metataxonomic Approach, Associated with Coffee Fermentation Processes in the Department of Quindío, Colombia. Fermentation 2023, 9, 343. [Google Scholar] [CrossRef]
- Jackels, S.C.; Jackels, C.F. Characterization of the Coffee Mucilage Fermentation Process Using Chemical Indicators: A Field Study in Nicaragua. J. Food Sci. 2005, 70, C321–C325. [Google Scholar] [CrossRef]
- de Oliveira Junqueira, A.C.; de Melo Pereira, G.V.; Coral Medina, J.D.; Alvear, M.C.R.; Rosero, R.; de Carvalho Neto, D.P.; Enríquez, H.G.; Soccol, C.R. First Description of Bacterial and Fungal Communities in Colombian Coffee Beans Fermentation Analysed Using Illumina-Based Amplicon Sequencing. Sci. Rep. 2019, 9, 8794. [Google Scholar] [CrossRef]
- Pothakos, V.; De Vuyst, L.; Zhang, S.J.; De Bruyn, F.; Verce, M.; Torres, J.; Callanan, M.; Moccand, C.; Weckx, S. Temporal Shotgun Metagenomics of an Ecuadorian Coffee Fermentation Process Highlights the Predominance of Lactic Acid Bacteria. Curr. Res. Biotechnol. 2020, 2, 1–15. [Google Scholar] [CrossRef]
- De Carvalho Neto, D.; de Melo Pereira, G.; Tanobe, V.; Thomaz Soccol, V.; da Silva, B.G.; Rodrigues, C.; Soccol, C. Yeast Diversity and Physicochemical Characteristics Associated with Coffee Bean Fermentation from the Brazilian Cerrado Mineiro Region. Fermentation 2017, 3, 11. [Google Scholar] [CrossRef]
- Elhalis, H.; Cox, J.; Zhao, J. Ecological Diversity, Evolution and Metabolism of Microbial Communities in the Wet Fermentation of Australian Coffee Beans. Int. J. Food Microbiol. 2020, 321, 108544. [Google Scholar] [CrossRef] [PubMed]
- Elhalis, H.; Cox, J.; Frank, D.; Zhao, J. The Crucial Role of Yeasts in the Wet Fermentation of Coffee Beans and Quality. Int. J. Food Microbiol. 2020, 333, 108796. [Google Scholar] [CrossRef]
- Martinez, S.J.; Rabelo, M.H.S.; Bressani, A.P.P.; Da Mota, M.C.B.; Borém, F.M.; Schwan, R.F. Novel Stainless Steel Tanks Enhances Coffee Fermentation Quality. Food Res. Int. 2021, 139, 109921. [Google Scholar] [CrossRef]
- Cruz-O’Byrne, R.; Piraneque-Gambasica, N.; Aguirre-Forero, S. Microbial Diversity Associated with Spontaneous Coffee Bean Fermentation Process and Specialty Coffee Production in Northern Colombia. Int. J. Food Microbiol. 2021, 354, 109282. [Google Scholar] [CrossRef]
- Pereira, T.S.; Batista, N.N.; Pimenta, L.P.S.; Martinez, S.J.; Ribeiro, L.S.; Naves, J.A.O.; Schwan, R.F. Self-Induced Anaerobiosis Coffee Fermentation: Impact on Microbial Communities, Chemical Composition and Sensory Quality of Coffee. Food Microbiol. 2022, 103, 103962. [Google Scholar] [CrossRef] [PubMed]
- Martinez, S.J.; Simão, J.B.P.; Pylro, V.S.; Schwan, R.F. The Altitude of Coffee Cultivation Causes Shifts in the Microbial Community Assembly and Biochemical Compounds in Natural Induced Anaerobic Fermentations. Front. Microbiol. 2021, 12, 671395. [Google Scholar] [CrossRef] [PubMed]
- Brysch-Herzberg, M.; Jia, G.-S.; Seidel, M.; Assali, I.; Du, L.-L. Insights into the Ecology of Schizosaccharomyces Species in Natural and Artificial Habitats. Antonie Van Leeuwenhoek 2022, 115, 661–695. [Google Scholar] [CrossRef] [PubMed]
- Mariyam, S.; Kistanti, A.; Karyadi, J.N.W.; Widiyastuti, R.J. Improving Coffee Quality through Yeast Addition in the Fermentation Process to Support Sustainable Coffee Production. IOP Conf. Ser. Earth Environ. Sci. 2022, 1005, 012012. [Google Scholar] [CrossRef]
- Cassimiro, D.M.D.J.; Batista, N.N.; Fonseca, H.C.; Naves, J.A.O.; Dias, D.R.; Schwan, R.F. Coinoculation of Lactic Acid Bacteria and Yeasts Increases the Quality of Wet Fermented Arabica Coffee. Int. J. Food Microbiol. 2022, 369, 109627. [Google Scholar] [CrossRef]
- Magalhães Júnior, A.I.; de Carvalho Neto, D.P.; de Melo Pereira, G.V.; da Silva Vale, A.; Medina, J.D.C.; de Carvalho, J.C.; Soccol, C.R. A Critical Techno-Economic Analysis of Coffee Processing Utilizing a Modern Fermentation System: Implications for Specialty Coffee Production. Food Bioprod. Process. 2021, 125, 14–21. [Google Scholar] [CrossRef]


Disclaimer/Publisher’s Note: The statements, opinions and data contained in all publications are solely those of the individual author(s) and contributor(s) and not of MDPI and/or the editor(s). MDPI and/or the editor(s) disclaim responsibility for any injury to people or property resulting from any ideas, methods, instructions or products referred to in the content. |
© 2023 by the authors. Licensee MDPI, Basel, Switzerland. This article is an open access article distributed under the terms and conditions of the Creative Commons Attribution (CC BY) license (https://creativecommons.org/licenses/by/4.0/).