Article

Comparative Study of Isoflavone Synthesis Genes in Two Wild Soybean Varieties Using Transcriptomic Analysis

1
Heilongjiang Academy of Agricultural Sciences, Soybean Research Institute, Harbin 150086, China
2
Plant Production Department, Faculty of Agriculture Saba Basha, Alexandria University, Alexandria 21531, Egypt
*
Author to whom correspondence should be addressed.
These authors contributed equally to this work.
Agriculture 2023, 13(6), 1164; https://doi.org/10.3390/agriculture13061164
Submission received: 6 April 2023 / Revised: 20 May 2023 / Accepted: 27 May 2023 / Published: 30 May 2023
(This article belongs to the Section Crop Genetics, Genomics and Breeding)

Abstract

:
Soybean is an important food crop that contains high amounts of isoflavones. However, due to the expression of multiple genes, different soybean seeds have different isoflavone compositions. The underlying mechanisms for this complexity remain unknown. In this study, we identified potential differentially expressed genes (DEGs) in two wild soybean cultivars, ZYD7068 (high isoflavone) and ZYD7194 (low isoflavone), at different seed developmental stages using RNA-seq technology and compared their differences in isoflavone content. A total of 1067 and 6479 differentially metabolized genes were identified at R6 and R8 stages, respectively. Subsequent analysis of the KEGG pathway revealed that three of these differential metabolized genes were involved in the Isoflavonoid biosynthesis and Flavone and flavonol biosynthesis at the R6 stage. A total of 80 TF genes encoding differential expression of MYB, bZIP, and WRKY were identified in A1 vs. B1 and A3 vs. B3. Eight differentially expressed genes were identified in duplicates at both stages, and three genes showed the same expression trend at both stages. To confirm the results of RNA-seq, qRT-PCR was performed to analyze the expression of the six identified differentially expressed genes (DEGs). The results of qRT-PCR were consistent with the results of RNA-seq. We found that four genes (Glyma.13G173300, Glyma.13G173600, Glyma.14G103100, and Glyma.17G158900) may be involved in the positive regulation of isoflavone synthesis, while two genes (Glyma.04G036700 and Glyma.19G030500) may be involved in the negative regulation of isoflavone synthesis. These findings suggest that the observed difference in isoflavone levels between the two cultivars may be attributable to the differential expression of these six genes at later stages of seed development.

1. Introduction

Soybean, as a grain-feed crop, is rich in oil and protein and contains some beneficial nutrients such as isoflavones. Isoflavones are known as phytohormones with hypotensive, menopausal, and cholesterol-lowering effects, and are bioactive substances beneficial to humans [1]. Isoflavones also play an important role in plant resilience, resisting pests and disease infestation and improving resistance to abiotic stress.
During the long domestication process, wild soybean (Glycine soja) was transformed into cultivated soybean according to people’s wishes, and many genes controlling superior traits were gradually lost [2]. Glycine soja has a high genetic diversity and the ability to thrive in challenging environments and has great potential to improve traits in its cultivated parents beyond what is currently known [3,4,5,6]. Although research on soybean has focused on understanding the domestication history of soybean, little effort has been devoted to its use as a gene pool for soybean improvement [5,7,8]. In China, cultivated soybean varieties have a higher average total isoflavone, genistein, and daidzein contents than wild soybeans, but cultivated soybean has lower total daidzein content [9]. Therefore, the identification of superior genes in wild soybean can help to compensate for the deficiencies of cultivated soybean.
During seed development, gene expression plays a key role in determining the composition and content of metabolites in seeds. Advances in genomics, transcriptomics, proteomics, and metabonomics have facilitated the systematic study of genes and major metabolites involved in seed development in various plant species [10]. Through the analysis of gene expression during seed development, researchers have gained valuable insights into the factors that influence the final seed composition in different species, including Arabidopsis thaliana [11,12], rice [13,14], and soybean [15,16].
Soybean growth is usually divided into three categories: indeterminate, semi-determinate, and determinate, including various asexual stages (VE, VC, V1-V3, Vn, and V6) and reproductive stages (R1–R8) [17]. Among them, the beginning of full seed (R6), the beginning of maturation (R7), and full maturation (R8) are considered critical periods for seed growth and isoflavone synthesis [18,19]. Therefore, transcriptome analysis of soybean seeds at different periods can help us understand the mechanism of isoflavone synthesis. A comparative analysis of the genes responsible for isoflavone biosynthesis in two soybean cultivars, RCAT Angora (high seed isoflavone content) and Harovinton (low seed isoflavone content), revealed that the expression levels of CHS7 and CHS8 were significantly higher in RCAT Angora than in Harovinton [20].
In this study, we used RNA-Seq technology to study seed growth and developmental stages R6 and R8 in two wild soybean varieties, one with high isoflavone content (ZYD7068) and the other with low isoflavone content (ZYD7194). We aimed to observe gene expression changes during seed development through comparative transcriptome analysis between the two periods. Our investigation led to the identification of differentially expressed genes (DEGs) affecting isoflavone synthesis and key genes regulating isoflavone synthesis in wild soybeans. This work fills a gap in our knowledge of important genes involved in isoflavone synthesis in cultivated soybeans.

2. Materials and Methods

2.1. Plant Materials

High isoflavone wild soybean resource ZYD7068 and low isoflavone wild soybean resource ZYD7194 were provided by Heilongjiang Agricultural Variety Resource Conservation and Utilization Center. ZYD7068 and ZYD7194 were collected in Mudanjiang and Suihua City, Heilongjiang Province, respectively. Wild soybeans ZYD7068 and ZYD7194 were grown by the Institute of Tillage and Cultivation, Heilongjiang Academy of Agricultural Sciences, in the pot farm of Heilongjiang Academy of Agricultural Sciences, and RNA was sampled and extracted from the seeds at R5 to R8 stages [21]. During each stage, three separate RNA extractions were carried out, and the seeds of the R6 and R8 stages were used for RNA sequencing (RNA-seq), and the seeds of the R5 to R8 stages were used for quantitative real-time polymerase chain reaction (qRT-PCR) experiments.

2.2. Experimental Design

In this study, high isoflavone wild soybean resource ZDY7068 and low isoflavone wild soybean resource ZDY7194 were used as experimental materials. Their seeds at R6 and R8 stages were used as samples for RNA-seq analysis. The genes with differential expression at both R6 and R8 phases and related to isoflavone synthesis were selected as candidate genes, and the TFs related to isoflavone synthesis and up-regulated or down-regulated at R6 and R8 stages were selected. They were subjected to qRT-PCR to identify genes that might be involved in isoflavone synthesis.

2.3. Determination of Isoflavones Contents of Seeds

For isoflavone content analysis, the harvested wild soybean seeds were fully ground using a mortar and pestle, sieved through a 2.0 mm sample, weighed 0.1 g in a 250 mL triangular flask, added 90 mL of 90% methanol solution, extracted by ultrasonication at 60 °C for 30 min, centrifuged at 10,000× r/min for 10 min, and the supernatant was transferred to a 250 mL concentration flask and concentrated by rotation at 60 °C to about 40 mL. Transfer the concentrated solution to a 50 mL volumetric flask, and fix the volume with 10% methanol solution to the scale. 1 mL of the extract was passed through a 0.22 µm filter membrane in a reagent bottle and determined by high-performance liquid chromatography with the following chromatographic conditions: the column was an Agilent Poroshell 120 Hillic (equipment from the United States Agilent Technologies Ltd., Santa Clara, CA, USA) (4.6 mm × 250 mm, 5 µm); the mobile phase was eluted with a gradient of chromatographic grade 0.1% acetic acid aqueous solution and 0.1% acetic acid acetonitrile aqueous solution; the flow rate was 1.00 mL/min; the column temperature was 40 °C. The detection wavelength of the UV detector was 260 nm; the injection volume was 20 µL, and the final calibration was performed using standard samples.

2.4. Total RNA Extraction, Library Construction, and Sequencing

The RNA was extracted using the RNApure Plant Kit (Cowin Bio, Cambridge, MA, USA), and its quality was evaluated using an Agilent 2100 Bioanalyzer (Agilent Technologies, Santa Clara, CA, USA). Only samples with a RIN score of at least 7 were included in further analysis. The cDNA library was constructed by pooling moderate amounts of RNA from soybean seed samples collected during the R6 and R8 stages. This library was subsequently sequenced using the Illumina HiseqTM platform by Sangon Biotech in Shanghai, China.

2.5. Transcriptomic Data Analysis

The quality of the sequenced raw data was evaluated by FastQC 0.11.2. Trimmomaticv 0.36 (http://www.usadellab.org/cms/index.php?page=trimmomatic accessed on 15 January 2023) software is used to cut the quality, so as to obtain relatively accurate and effective data [22]. Use HISAT2 2.1.0 to compare the valid data of the sample to the reference genome, and count the Mapping information [23], and the reference genome sequences were downloaded from NCBI (https://www.ncbi.nlm.nih.gov/assembly/GCF_000004515.4/ accessed on 19 January 2023). The DEGseq package in R software is used for gene expression difference analysis (https://bioconductor.org/packages/release/bioc/html/DESeq2.html accessed on 19 January 2023) [24,25], and the results of expression difference analysis are visualized. To determine the variation of the RNA-seq samples, we performed principal component analysis (PCA) using the plotPCA function in the DESeq2 R package. In order to obtain genes with significant differences, we set the screening conditions as follows: p-value < 0.05 and |log2FoldChange| > 2.

2.6. Principal Component Analysis

Principal component analysis was performed with the vegan package in R software to visualize the distance between samples (https://cran.r-project.org/web/packages/vegan/index.html accessed on 19 December 2022).

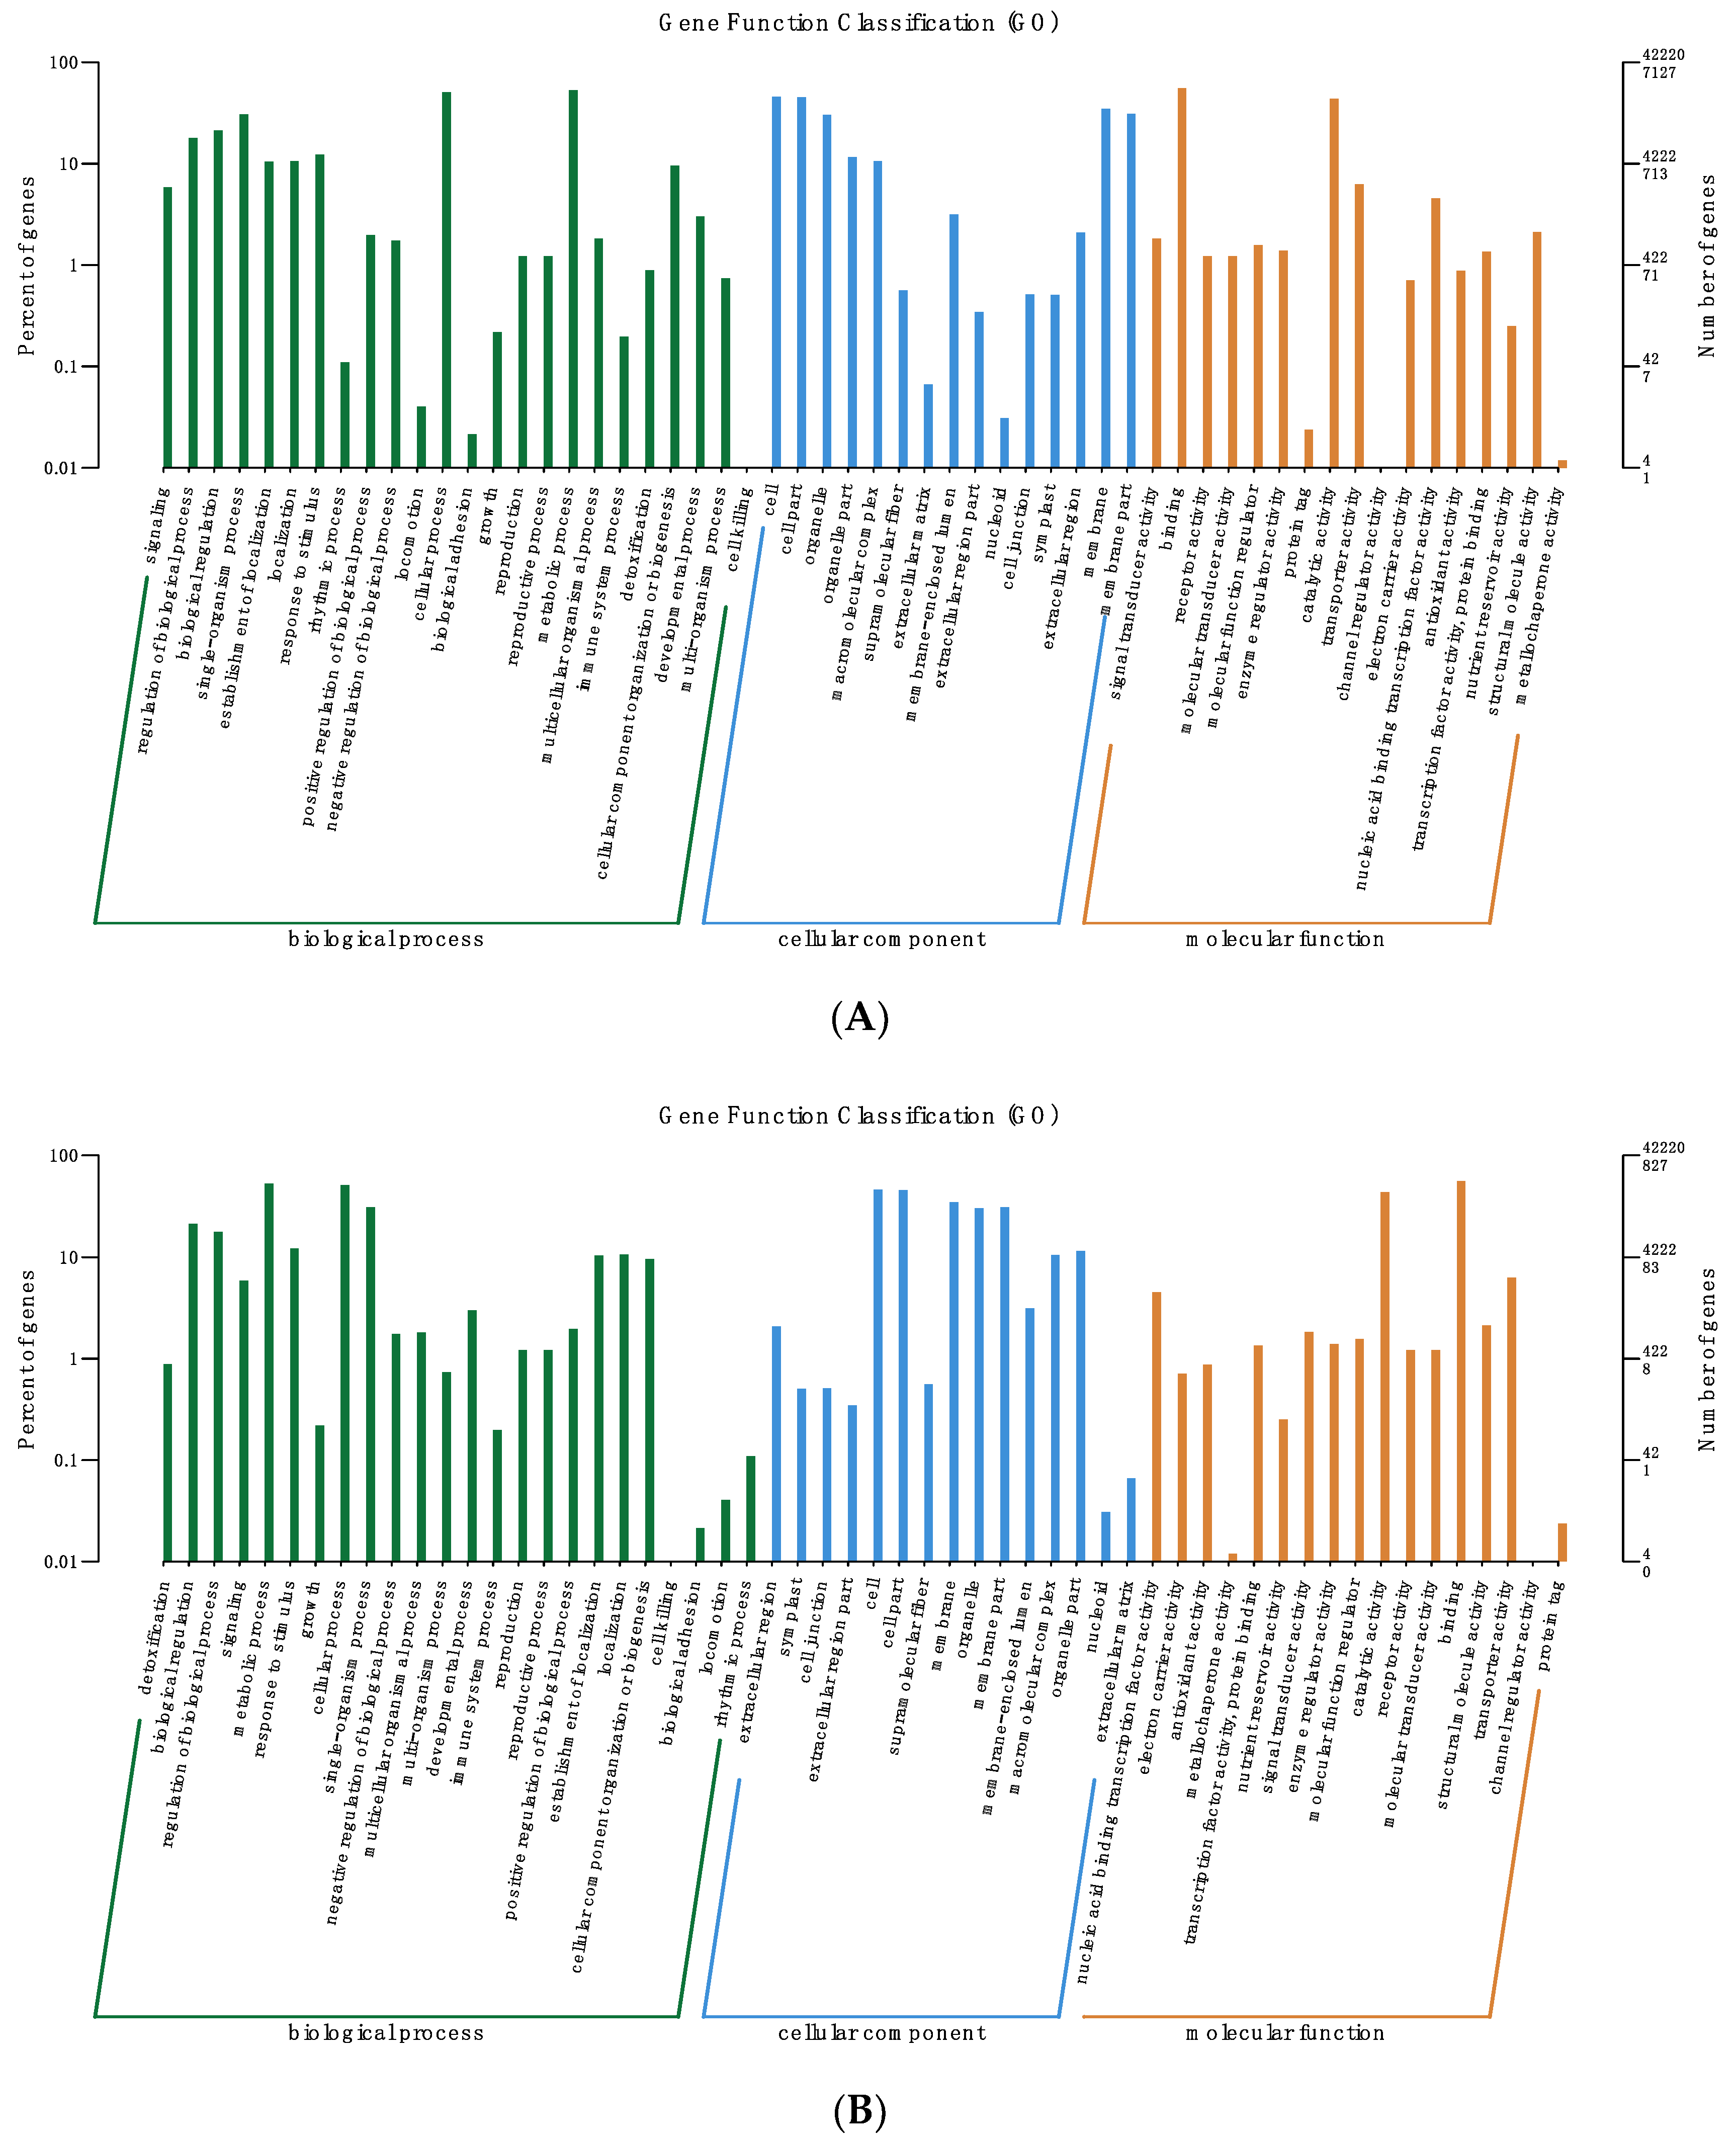
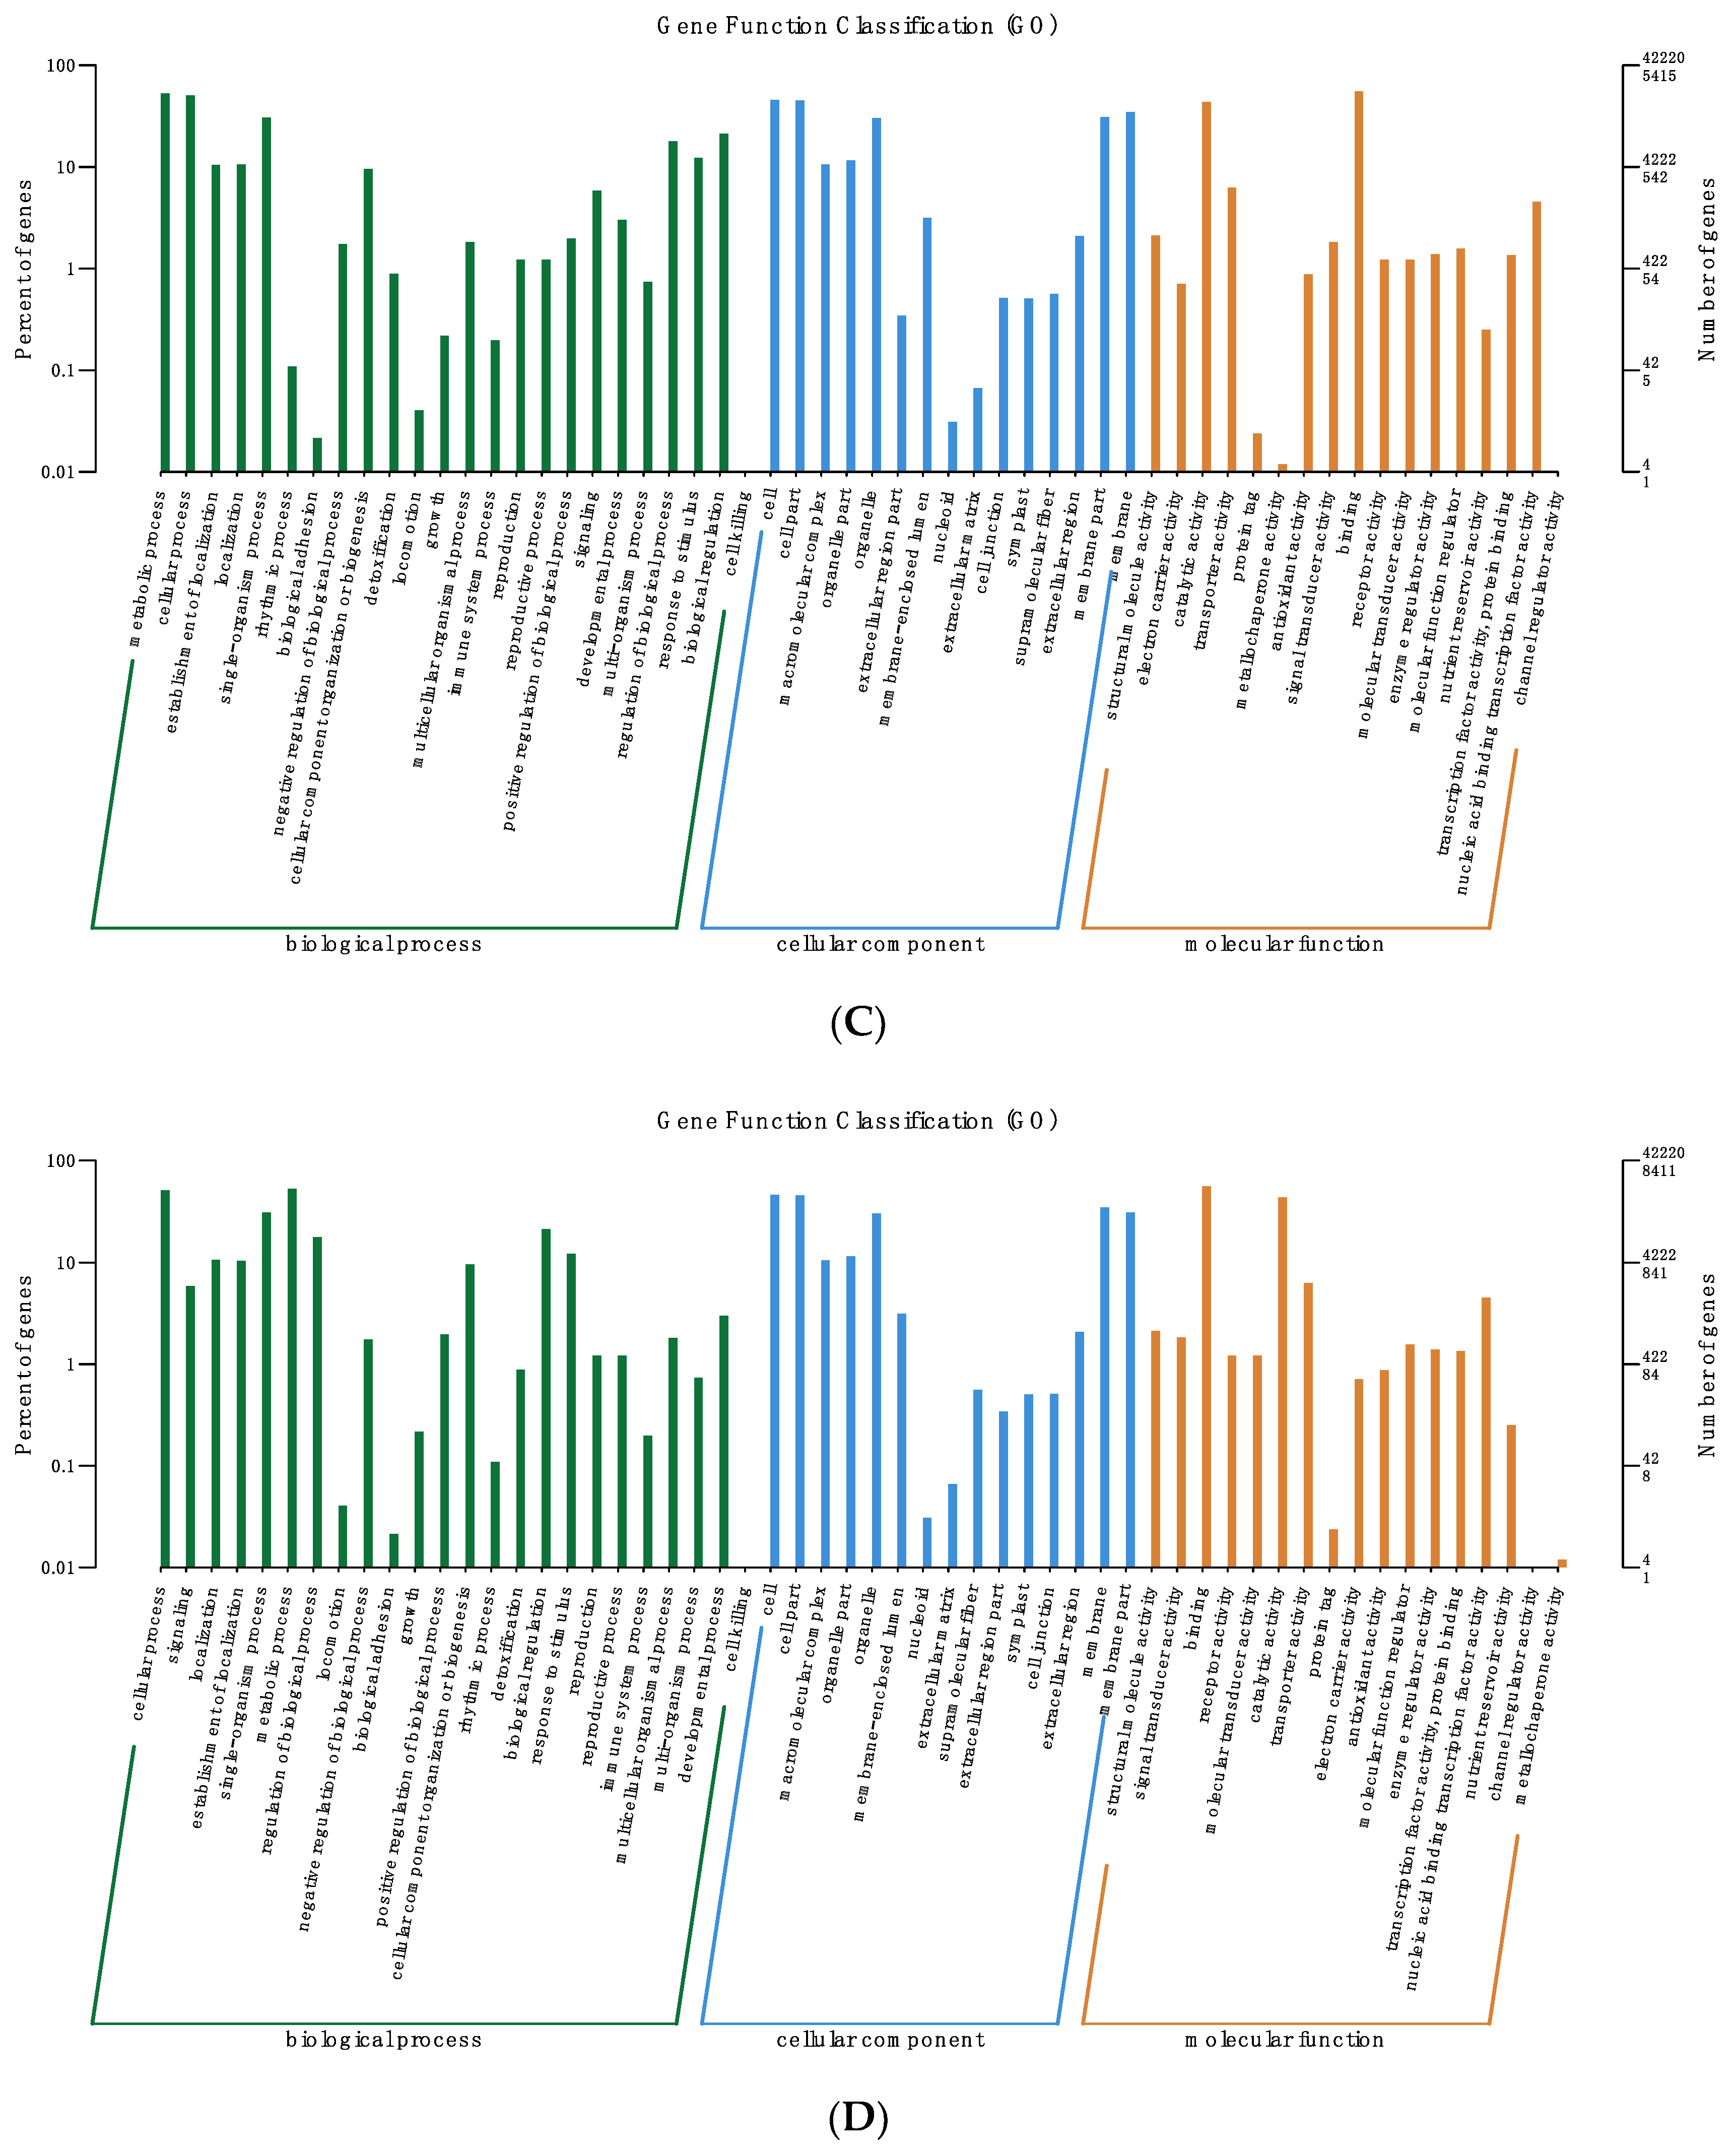
2.7. Functional Classification of DEGs

The topGO package in R software is used for GO enrichment analysis (https://www.bioconductor.org/packages/release/bioc/html/topGO.html accessed on 2 February 2022), and the significant GO-directed acyclic graph is drawn. The ClusterProfiler package is used for the KEGG pathway and KOG classification enrichment analysis (https://bioconductor.org/packages/release/bioc/html/clusterProfiler.html accessed on 5 February 2023).

2.8. Transcription Factor Analysis

Based on the TF sequence derived from the Peking University transcription factor database (http://planttfdb.cbi.pku.edu.cn/ accessed on 19 January 2023), we analyzed and classified DEGs using the gplots package of R software [26].

2.9. Quantitative Real-Time PCR (qRT–PCR) Verification

The qRT-PCR was performed using a miRNA qPCR Assay Kit (Cowin Bio.) kit and a QuantStudio 3 (Thermo Fisher Scientific, Waltham, MA, USA) instrument. Three biological replicates of each sample. The calculation of gene expression level followed the 2−ΔCT method described by Livak & Schmittgen [27]. GmActin11(Glyma.19G14790000) and Gm60S(Glyma.13G318800) were used as internal reference genes [28]. The specific primers are shown in Table S1. Three independent biological replicates were performed for each sample to ensure statistical credibility.

3. Results

3.1. Isoflavone Content in Seeds of ZYD7068 and ZYD7194

Two wild soybean varieties from China, ZYD7068 (A) and ZYD7194 (B) were selected for transcriptome analysis due to their significantly different isoflavone content in mature seeds. The isoflavone contents of wild soybean resources ZYD7068 and ZYD7194 were determined by high-performance liquid chromatography, and the total isoflavone contents were 7149.5 µg/g and 646.4 µg/g, Daidzin contents were 988.60 µg/g and 102.85 µg/g, Glycitin contents were 453.87 µg/g and 79.79 µg/g, respectively; 79.79 µg/g, Genistin 4368.64 µg/g and 332.09 µg/g, Daidzein 855.81 µg/g and 89.69 µg/g, Glycitein 35.03 µg/g and 2.64 µg/g, and Genistein. The isoflavone content of ZYD7068 was significantly higher than that of ZYD7194 (Figure 1). We aimed to use these two wild soybean species to investigate the mechanism of soybean isoflavone synthesis and to identify genes involved in isoflavone synthesis.

3.2. Transcriptome Profiles of ZYD7068 and ZYD7194 at R6 and R8 Stages

To reveal the molecular mechanisms regulating isoflavone synthesis during soybean seed development, soybean seeds of two varieties were collected and analyzed by transcriptional sequencing at R6 and R8 stages, and the following samples were obtained: A1, A3, B1, and B3. All sequencing data are shown in Table 1. A total of 117 and 122 million raw reads and a total of 111 and 117 million clean reads were acquired in A and B, respectively. The base percentage of Q30 in each sample was not less than 92.55%, the GC content was 46.66%~47.83%, and the sequencing quality was normal, which could be used for subsequent analysis. The transcriptomes’ saturation and evenness were analyzed to determine the sequencing depth and uniformity, which revealed high sequencing quality and expression saturation for most genes (Figure S1). The expression evenness was also found to be relatively high (Figure S2). The samples showed a high correlation between each other (Figure S3), and principal component analysis (PCA) showed that the seed development stage and genotype were the major contributors to data variations (Figure S4). Overall, this study provides a comprehensive transcriptomic analysis of soybean seeds and identifies the key factors regulating isoflavone synthesis during seed development.

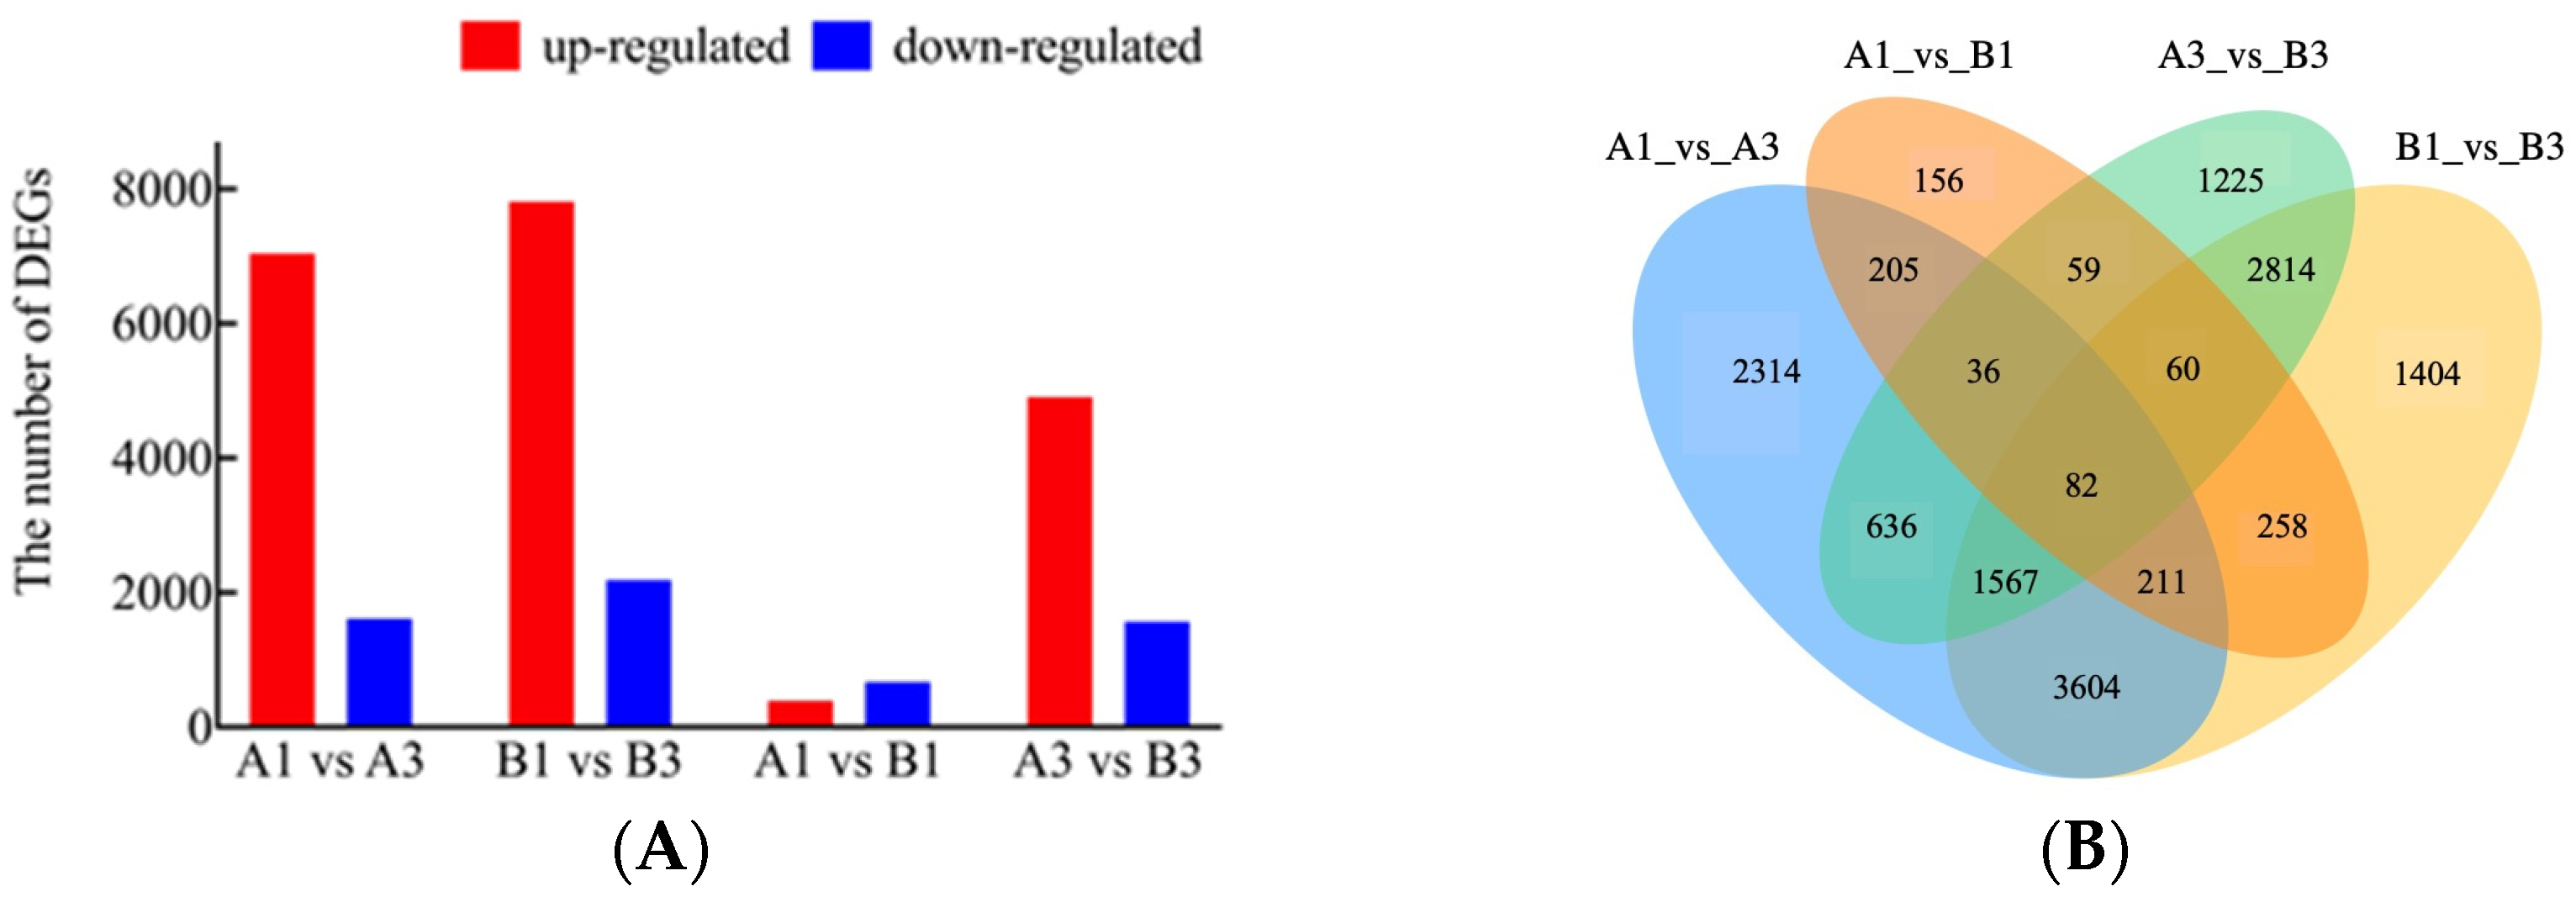
3.3. Identification of DEGs of ZYD7068 and ZYD7194 at Different Stages

The Volcano plots of DEGs are shown in Figure S5 (|log2FoldChange| > 2, p < 0.05). A systematic comparison and evaluation of differentially expressed genes (DEGs) in soybean cultivars at different developmental stages (Supplementary Data S1–S4). Comparing the different periods of cultivar A (R6 and R8 periods), 8655 DEGs were identified in A1 vs. A3, of which, 7044 genes were up-regulated and 1611 genes were down-regulated (Figure 2A). Similarly, in variety B, the number of DEGs in B1 vs. B3 was 10,000, of which, 7816 genes were up-regulated and 2184 genes were down-regulated. The DEGs in A and B were mainly found in A3 and B3 pairs, and more genes were up-regulated than down-regulated (Figure 2A). Representation of these comparison groups of DEGs with Venn diagrams revealed both unique and shared DEGs among pairs (Figure 2B). Venn analysis showed that many DEGs identified were isoflavone synthesis-specific and/or genotype-specific.

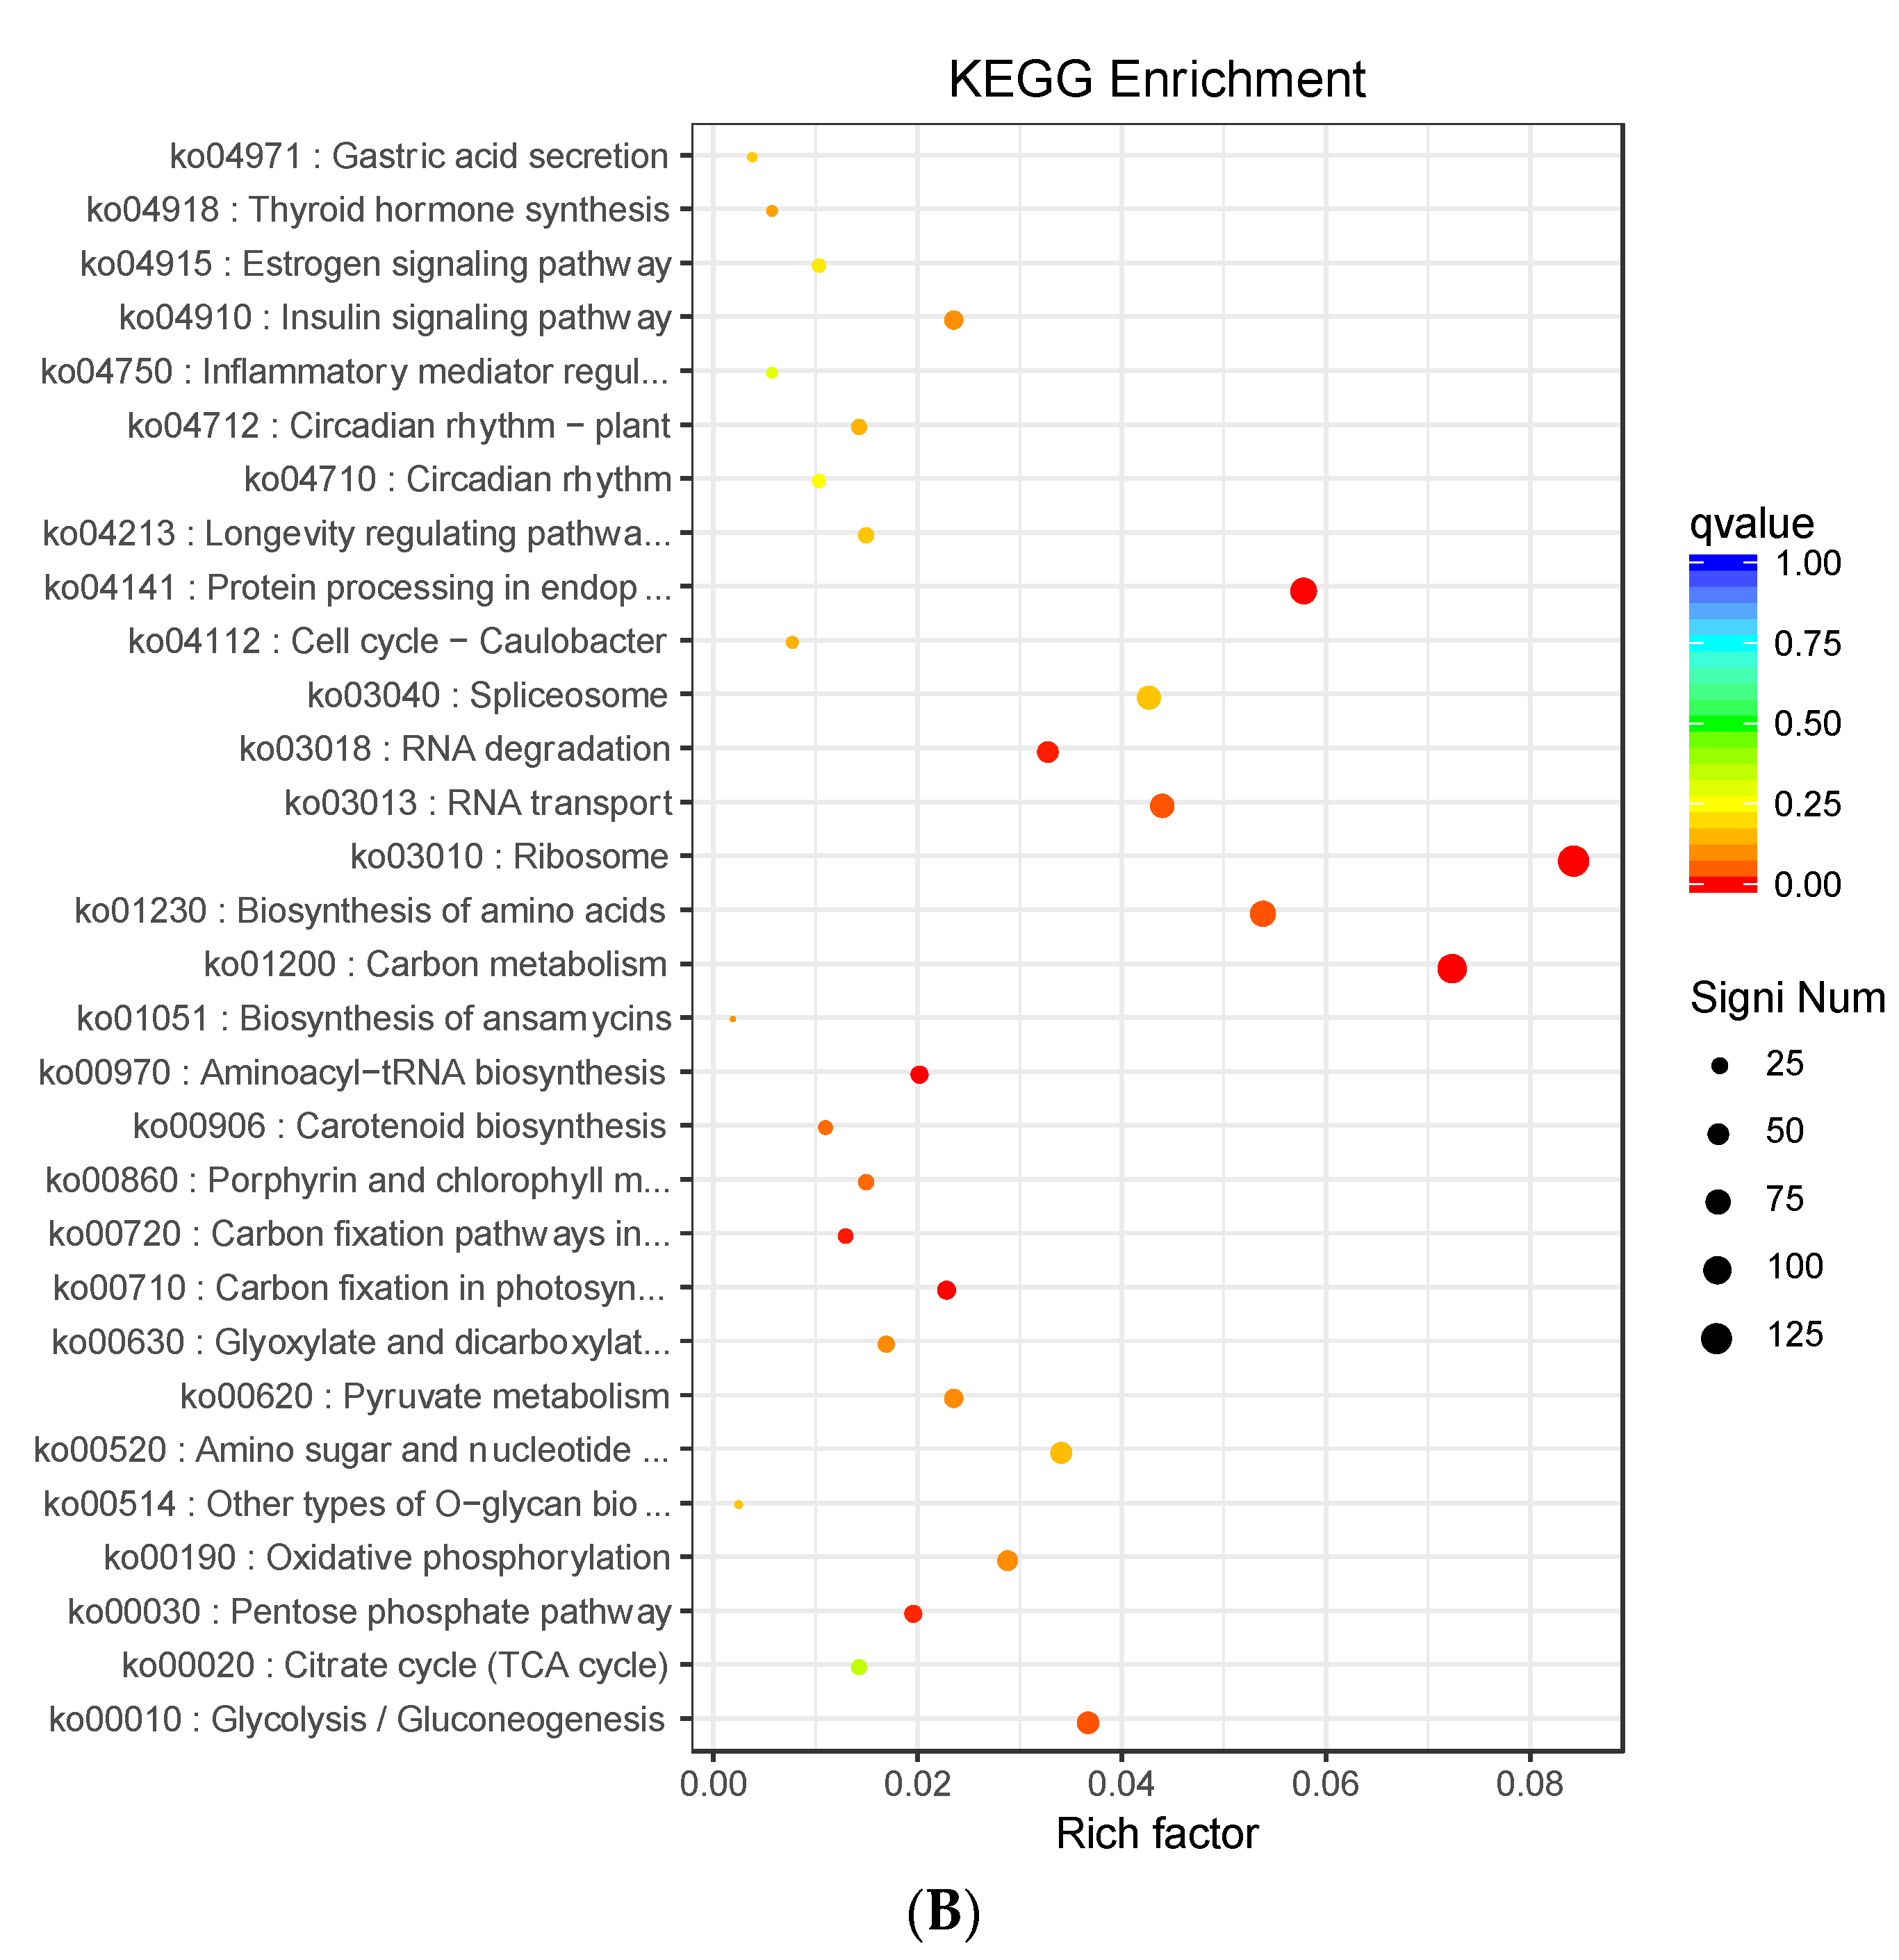
3.4. Analysis of DEGs Clustering and Pathway Enrichment

To further understand the regulation of differentially expressed genes (DEGs) during seed development, hierarchical clustering was conducted and visualized as a boxplot dendrogram in Figure S6. Additionally, to investigate the molecular response of ZYD7068 and ZYD7194, the DEGs were functionally annotated and classified into three categories: biological process (BP), cellular component (CC), and molecular function (MF), as shown in Figure 3. A KEGG pathway analysis was performed to identify the specific pathways associated with the DEGs. The results revealed that 163 and 2218 DEGs were enriched in 152 and 259 pathways for A1 vs. B1 and A3 vs. B3, respectively, and 149 pathways were enriched in both sets of samples (Table S2, Supplementary Data S5 and S6).
At the R6 and R8 stages, the KEGG pathways of the top 30 enrichment levels are shown in Figure 4 (Supplementary Data S7 and S8). Among them, In the two groups, Ko00906 (Carotenoid biosynthesis), Ko00630 (glyoxylate and dicarboxylate metabolism), Ko04910 (insulin signaling pathway), and Ko00520 (amino sugar and nucleotide sugar metabolism) were all expressed in the top 30 enrichment levels. Among them, ko00943 (Isoflavonoid biosynthesis) and ko00944 (Flavone and flavonol biosynthesis) enriched by A1 vs. B1 were associated with isoflavone biosynthesis. Glyma.13G173300, Glyma.13G173600, and Glyma.19G030500 were enriched to the ko00943 pathway. Glyma.19G030500 was enriched to the ko00944 pathway (Table S3).
Glyma.13G173300 and Glyma.13G173600 are 2,7,4′-trihydroxyisoflavanone 4′-O-methyltransferase/isoflavone 4′-O-methyltransferase [EC:2.1.1.212/2.1.1.46], catalyzing the synthesis of daidzein to formononetin, which is a key reaction in the biosynthesis of isoflavones, and the analysis revealed that Glyma.13G173300 and Glyma.13G173600 are positively regulated and the up-regulated expression of the genes may lead to the accumulation of soybean isoflavone content. Glyma.19G030500 is an isoflavone 7-O-glucoside-6″-O-propanolyltransferase [EC:2.3.1.115], which catalyzes the first targeted reaction of phytoalexin biosynthesis [PMID: 9426598]. This enzyme family comprises various transferase enzymes, such as anthranilate N-hydroxycinnamoyl/benzoyl transferase, which initiates the first committed reaction of phytoalexin biosynthesis [PMID:9426598]. Another member of this family is deacetylvindoline 4-O-acetyltransferase EC:2.3.1.107, which catalyzes the final step in vindoline biosynthesis [PMID:9681034]. The active site of these enzymes likely contains the HXXXD motif. Additionally, trichothecene 3-O-acetyltransferase is also part of this enzyme family. Furthermore, we identified a negative regulatory role for Glyma.19G030500, and its down-regulation may lead to a decrease in soybean isoflavone content.

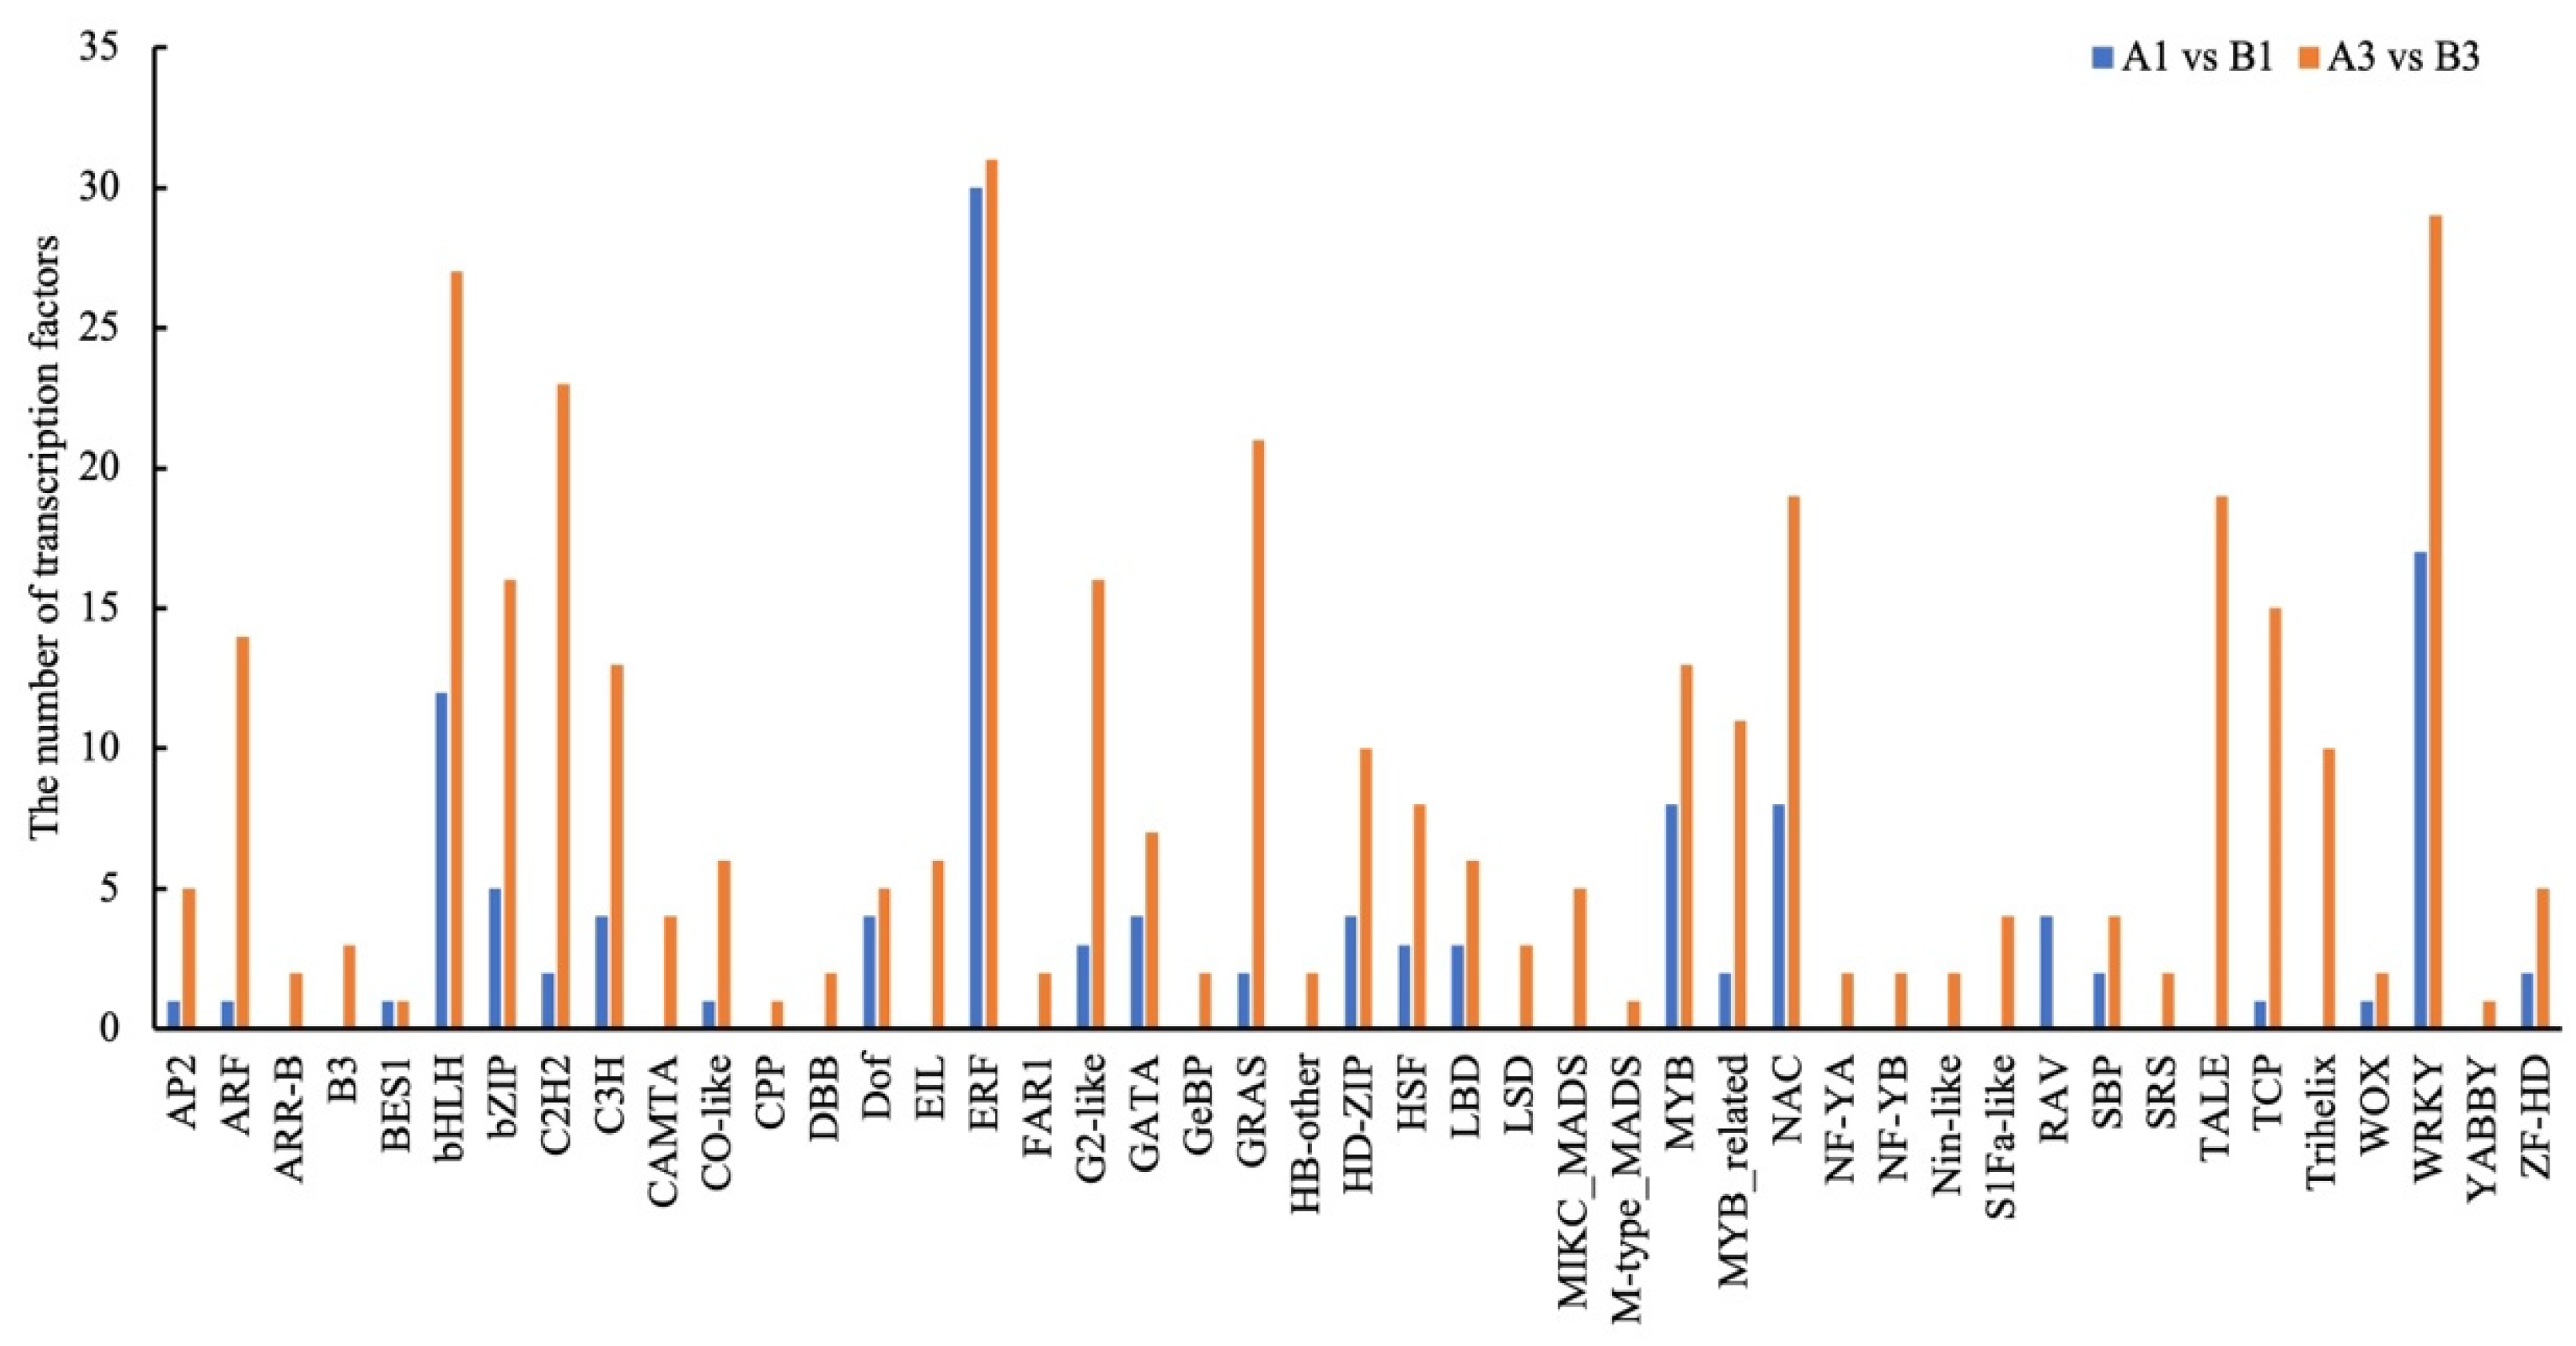
3.5. Different Expression Patterns of Transcription Factors in Two Genotypes at Different Stages

To further reveal the differences in isoflavones between genotypes, we searched for differentially expressed TF genes at both R6 and R8 stages (Supplementary Data S9 and S10). The number of DEGs involved in transcription factor (TFs) was 125 at the R6 stage and was 383 at the R8 stage. The differentially expressed TF genes encoding MYB, bZIP, and WRKY were found in A1 vs. B1 and A3 vs. B3 with a total of 90 (Figure 5). We also found that the number of differentially expressed MYB, bZIP, and WRKY in A3 vs. B3 was greater than that in A1 vs. B1 (Figure 5). These findings further indicated that a large number of TFs might participate in the process of isoflavone synthesis, which could enhance the isoflavone content of soybean seeds.
Out of the differential genes identified in A vs. B, six belonged to the WRKY family, while one each belonged to the MYB and bHLH families. Cluster analysis of these eight genes revealed that Glyma.04G036700 was down-regulated in both sets of samples, and the differential genes Glyma.14G103100 and Glyma.17G158900 were up-regulated (Figure 6), indicating that all these genes may be involved in the regulation of isoflavone synthesis.

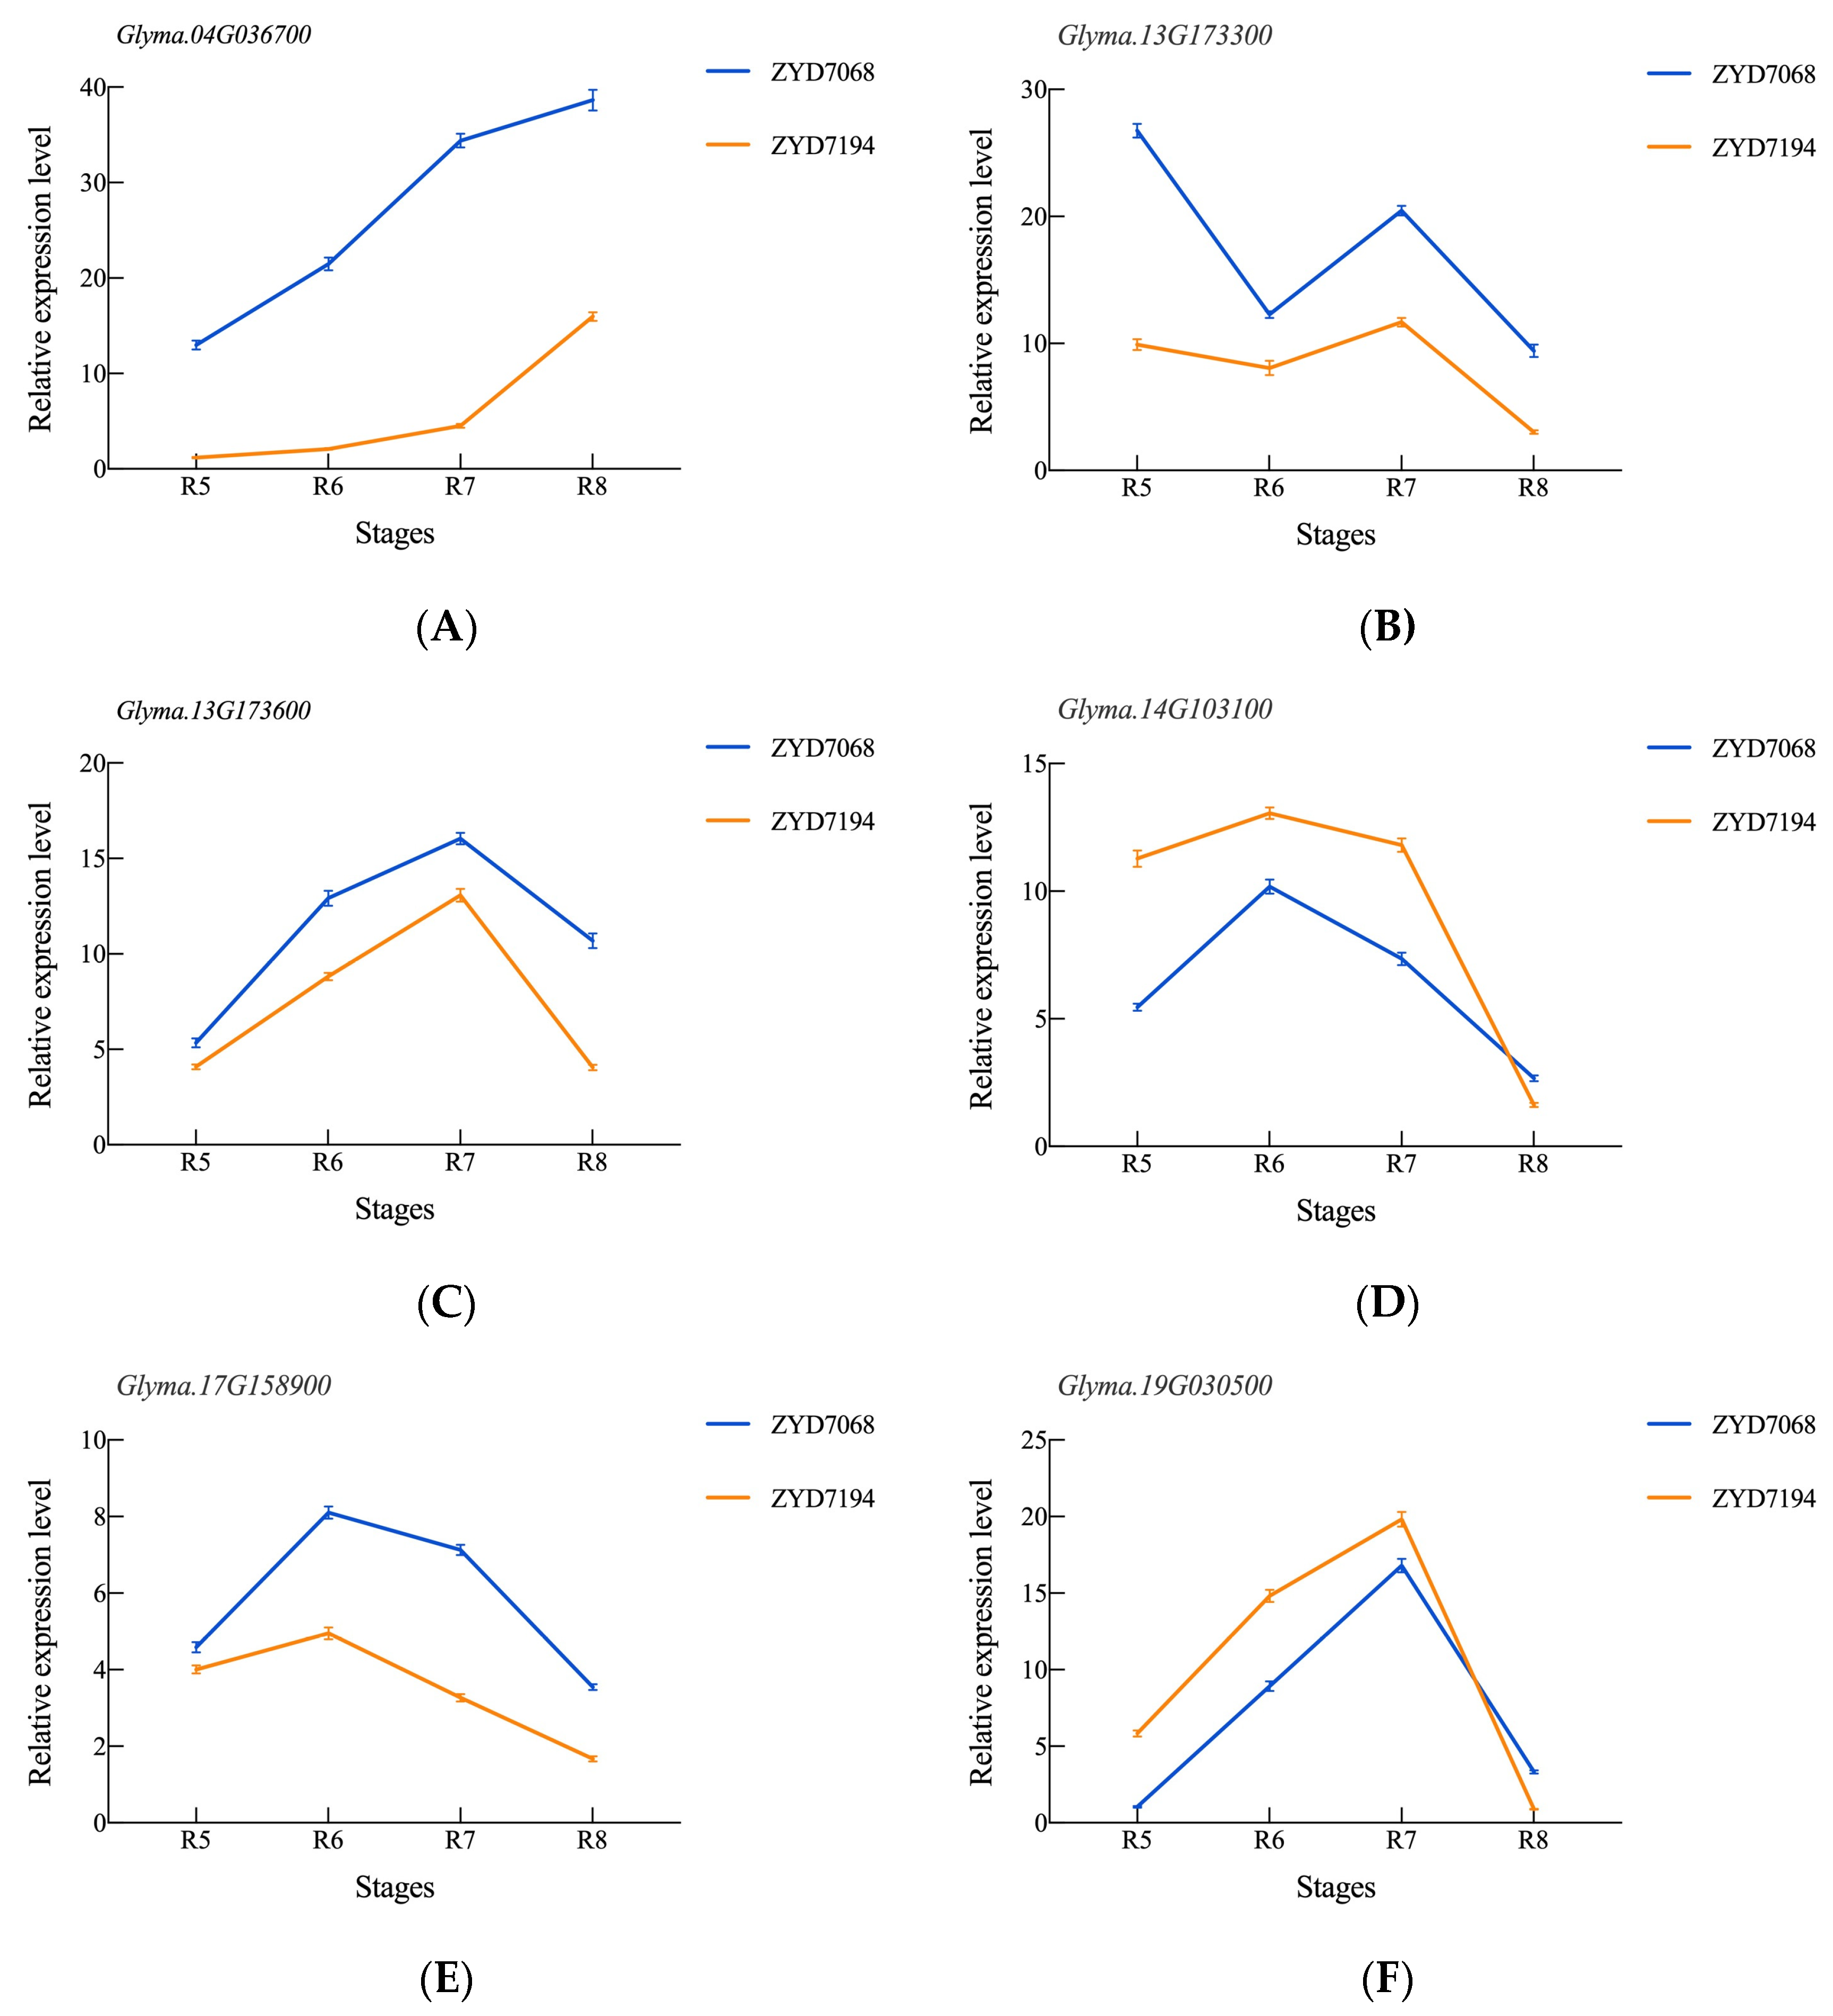
3.6. Validation of RNA-Seq Expression Levels by qRT-PCR

To validate the RNA-seq results of our study, we chose three genes that were differentially expressed and associated with isoflavone synthesis, and three transcription factors related to isoflavone regulation, for qRT-PCR analysis (Figure 7). The expression results of qRT-PCR of six genes were consistent with those of RNA-seq. Among them, the expression of Glyma.04G036700 increased significantly during seed development, while Glyma.13G173300 decreased, then increased, and finally decreased to the lowest level. In contrast, the expression trends of Glyma.13G173600, Glyma.14G103100, Glyma.17G158900, and Glyma.19G030500 were showed bell-shaped. the highest expression levels of Glyma.13G173600 and Glyma.19G030500 were at the R7 stage, while Glyma.14G103100 and Glyma.17G158900 had the highest expression levels at the R6 stage. Furthermore, the expression level of Glyma.14G10310 and Glyma.19G030500 showed a negative correlation with isoflavone content, while the other four genes showed a positive correlation. These results confirmed that our RNA-seq data were reliable.

4. Discussion

One of the main goals of soybean breeders is to increase the concentration of isoflavones; however, the limited genetic diversity of soybean germplasm can hinder the enhancement of these compounds [29]. In addition, glycosides and malonyl glycosides exhibit a positive correlation because they are produced by glucosyltransferase and malonyl transferase, which are key enzymes in isoflavone biosynthesis and are synthesized through a common branch in the phenylpropanoid pathway [30,31]. Differences in phenotypic and TIF contents of individual soybean varieties were observed in different growing environments and years, suggesting that both genetic and environmental factors contribute to isoflavone accumulation in soybean seeds, as shown in studies by [32,33]. To further identify key genes affecting differences between high and low isoflavone varieties, two wild soybean varieties ZYD7068 (high isoflavone) and ZYD7194 (low isoflavone) were analyzed for differential genes at the same developmental stage. A total of 1067 and 6479 differentially expressed genes were identified between the R6 and R8 stages, respectively, followed by the identification of isoflavone synthesis pathways and potential key genes using KEGG and GO analyses. Enrichment analysis of differential genes showed that they fall into three broad categories comprising biological process (BP), cellular component (CC), and molecular function (MF). KEGG analysis of differential genes showed that among the metabolic pathways significantly enriched at both R6 and R8 stages, three differential genes were classified into Isoflavonoid biosynthesis, and one of them was also classified into Flavone and flavonol biosynthesis. Similarly, we also investigated the common TFs that have been identified to be associated with isoflavone synthesis and found that three TF genes have the same expression trend at R6 and R8 stages.
In soybean, isoflavones are synthesized mainly through the phenylalanine metabolic pathway, forming Cinnamate by the action of Phenylalanine ammonia-lyase (PAL, EC 4.3.1.5); Cinnamate is then synthesized by Cinnamic acid 4-hydroxylase (C4H, EC1. 14.13.11) to form p-Coumarate [34,35,36], which is converted to p-Coumarate-CoA by 4-Coumaryl: CoA ligase (4CL, EC 6.2.1.12); next, p-Coumarate-CoA is catalyzed by the condensation of Chalcone synthase (CHS, EC 2.3.1.74) and Chalcone reductase (CHR, EC 2.3.1.170) to produce naringenin chalcone or isoliquiritigenin [35,36], naringenin chalcone or is glycyrrhizin is catalyzed by chalcone isomerase (CHI; EC 5.5.1.6) to form naringenin or liquiritigenin. Finally, naringenin is used as a substrate to form flavonol (dihydro flavonol) catalyzed by flavonoid 3′-hydroxylase (F3H; EC 1.14.11.9) and flavone (flavone) catalyzed by flavonoid synthase (FNS, EC: 1.14.11.2) [37,38,39]. Liquiritigenin or naringenin is catalyzed by isoflavone synthase (IFS, EC 1.14.13.136) to produce soy isoflavone-free glycosides: genistein, daidzein, and e, which are catalyzed by UGT (7-O-glucosyltransferase (IF7GT/UGT; EC 2.4.1.170), and MAT (7-O-glucoside-6″-O-malonyltransferase; EC 2.3.1.115) respectively) to produce glycosides, acetyl glycosides, malonylglycosides isoflavones [40]. There are four pathways associated with isoflavone synthesis in the Kegg database, namely Phenylpropanoid biosynthesis, Flavonoid biosynthesis, Isoflavonoid biosynthesis, and Flavone and flavonol biosynthesis. we identified three genes in two of these pathways, and we hypothesized that these three genes play important roles in isoflavone synthesis. In our study, it was found that three DEGs were located in the pathway related to isoflavone synthesis, and the relative expression levels of Glyma.13G173300, Glyma.13G173600, and Glyma.19G030500 also showed the same trend as RNA-seq, indicating that these three genes may be related to the isoflavone differences of the studied varieties.
Many transcription factors also affect the synthesis of soybean isoflavones. The expression levels of structural genes involved in isoflavone biosynthesis can be regulated by certain MYB transcription factors, potentially affecting isoflavone content [41,42]. Therefore, these MYB-like genes could be a potential candidate for isoflavone accumulation in soybean seeds. Several MYB transcription factors involved in the regulation of the isoflavone biosynthetic pathway have been identified in soybean. In plants, the interaction between MYB and bHLH transcription factors is also prevalent, and there is a joint regulation of both proteins in the phenylpropane metabolic pathway. In addition to the direct combination of MYB and bHLH, they will also combine with the third protein WD40 to form MYB-bHLH-WD40 (MBW). In various plant species, including A. thaliana, Camellia sinensis, Fragaria × ananassa, and Vitis vinifera, complexes of MYB-bHLH-WD40 (MBW) have been proposed as a means of finely regulating flavonoid levels [43,44,45,46,47]. The WRKY transcription factor binds to the promoter element of the key enzyme gene for isoflavone synthesis to regulate isoflavone biosynthesis. In our study, we also analyzed the expression of Glyma.04G036700, Glyma.14G103100, and Glyma.17G158900 genes, and the results showed that these three TFs were associated with isoflavone content.

5. Conclusions

In this study, we performed a comparative transcriptome analysis of dynamic gene expression in ZYD7068 (high isoflavone) and ZYD7194 (low isoflavone) wild soybean seeds at R6 and R8 stages. Six DEGs were screened for association with isoflavone content, three of which were associated with pathways located in the isoflavone biosynthesis pathway and flavone and flavonol biosynthesis pathway, and three were associated with TFs. Our results provide valuable insights into the molecular basis of isoflavone synthesis and accumulation in soybean seeds and may facilitate the breeding of high isoflavone soybeans.

Supplementary Materials

The following supporting information can be downloaded at: https://www.mdpi.com/article/10.3390/agriculture13061164/s1, Figure S1: The saturation curves of all of the samples in A and B; Figure S2: Homogenized distribution curves of samples A and B; Figure S3: The correlation analysis of samples in A and B; Figure S4: Principal Component Analysis (PCA) of the similarities and differences between the twelve samples used for RNA-Sequencing in ZYD7068 (A) and ZYD7094 (B) at R6 and R8 stages; Figure S5: Volcano plots of DEGs. The up-regulated and down-regulated DEGs were shown in red and green, respectively. The x-axis represented the fold change of DEGs in different samples. The y-axis represented the statistical significance of gene expression differences; Figure S6: Clustering analysis of the DEGs. The tree was constructed with log2(TMP+1). Red, black, and green indicate high, intermediate, and expression, respectively. Each sample has three repetitions labeled 1, 2, and 3; Figure S7: The isoflavone metabolism pathway in the KEGG database. (A) Isoflavonoid biosynthesis: ko00943. (B) Flavone and flavonol biosynthesis: ko00944; Table S1: Primers used for quantitative real-time PCR; Table S2: Different stages of DEGs annotated to different databases; Table S3: Function of candidate genes; Data S1: A1_vs_A3.gene_DE.signi; Data S2: A1_vs_B1.gene_DE.signi; Data S3: A3_vs_B3.gene_DE.signi; Data S4: B1_vs_B3.gene_DE.signi; Data S5: A1_vs_B1.sign_KEGG_enrichment; Data S6: A3_vs_B3.sign_KEGG_enrichment; Data S7: A1_vs_B1.sign_KEGG_enrichment top; Data S8: A3_vs_B3.sign_KEGG_enrichment top; Data S9: A1 vs. B1 TF; Data S10: A3 vs. B3 TF.

Author Contributions

Conceptualization and writing—review and editing, B.Z.; Conceptualization and writing, K.Z.; Software and editing, H.R.; Methodology, S.F.L.; Software, X.L.; Validation, X.W. and F.Z.; Review and editing R.Y. and J.W. All authors contributed to the article and approved the submitted version. All authors have read and agreed to the published version of the manuscript.

Funding

Project of Natural Science Foundation of Heilongjiang Province (Grant No. ZD2020C009). Heilongjiang Academy of Agricultural Sciences Young Scientist Training Program (2021QNKXJ12). Heilongjiang Postdoctoral Science Foundation (Grant No. LBH-Q19053).

Institutional Review Board Statement

Not applicable.

Data Availability Statement

All data are contained within the article or Supplementary Materials.

Conflicts of Interest

The authors declare no conflict of interest. The funders had no roles in the design of the study; in the collection, analyses, or interpretation of data; in the writing of the manuscript, or in the decision to publish the results.

References

  1. Bennett, J.O.; Yu, O.; Heatherly, L.G.; Krishnan, H.B. Accumulation of Genistein and Daidzein, Soybean Isoflavones Implicated in Promoting Human Health, Is Significantly Elevated by Irrigation. J. Agric. Food Chem. 2004, 52, 7574–7579. [Google Scholar] [CrossRef]
  2. Hyten, D.L.; Song, Q.; Zhu, Y.; Choi, I.-Y.; Nelson, R.L.; Costa, J.M.; Specht, J.E.; Shoemaker, R.C.; Cregan, P.B. Impacts of genetic bottlenecks on soybean genome diversity. Proc. Natl. Acad. Sci. USA 2006, 103, 16666–16671. [Google Scholar] [CrossRef] [PubMed]
  3. Stupar, R.M. Into the wild: The soybean genome meets its undomesticated relative. Proc. Natl. Acad. Sci. USA 2010, 107, 21947–21948. [Google Scholar] [CrossRef] [PubMed]
  4. Qiu, L.-J.; Xing, L.-L.; Guo, Y.; Wang, J.; Jackson, S.A.; Chang, R.-Z. A platform for soybean molecular breeding: The utilization of core collections for food security. Plant Mol. Biol. 2013, 83, 41–50. [Google Scholar] [CrossRef] [PubMed]
  5. Qi, X.; Li, M.-W.; Xie, M.; Liu, X.; Ni, M.; Shao, G.; Song, C.; Kay-Yuen Yim, A.; Tao, Y.; Wong, F.-L.; et al. Identification of a novel salt tolerance gene in wild soybean by whole-genome sequencing. Nat. Commun. 2014, 5, 4340. [Google Scholar] [CrossRef] [PubMed]
  6. Zhang, H.; Song, Q.; Griffin, J.D.; Song, B.-H. Genetic architecture of wild soybean (Glycine soja) response to soybean cyst nematode (Heterodera glycines). Mol. Genet. Genom. MGG 2017, 292, 1257–1265. [Google Scholar] [CrossRef] [PubMed]
  7. Kim, M.; Hyten, D.L.; Niblack, T.L.; Diers, B.W. Stacking Resistance Alleles from Wild and Domestic Soybean Sources Improves Soybean Cyst Nematode Resistance. Crop Sci. 2011, 51, 934–943. [Google Scholar] [CrossRef]
  8. Zhang, H.; Li, C.; Davis, E.L.; Wang, J.; Griffin, J.D.; Kofsky, J.; Song, B.-H. Genome-Wide Association Study of Resistance to Soybean Cyst Nematode (Heterodera glycines) HG Type 2.5.7 in Wild Soybean (Glycine soja). Front. Plant Sci. 2016, 7, 1214. [Google Scholar] [CrossRef]
  9. Wang, C.; Zhao, T.; Gai, J. Genetic Variability and Evolutionary Peculiarity of Isoflavone Content and Its Components in Soybean Germplasm from China. Sci. Agric. Sin. 2010, 44, 3919–3929. [Google Scholar]
  10. Li, L.; Hur, M.; Lee, J.-Y.; Zhou, W.; Song, Z.; Ransom, N.; Demirkale, C.Y.; Nettleton, D.; Westgate, M.; Arendsee, Z.; et al. A systems biology approach toward understanding seed composition in soybean. BMC Genom. 2015, 16, S9. [Google Scholar] [CrossRef]
  11. Ruuska, S.A.; Girke, T.; Benning, C.; Ohlrogge, J.B. Contrapuntal Networks of Gene Expression during Arabidopsis Seed Filling [W]. Plant Cell 2002, 14, 1191–1206. [Google Scholar] [CrossRef] [PubMed]
  12. Fait, A.; Angelovici, R.; Less, H.; Ohad, I.; Urbanczyk-Wochniak, E.; Fernie, A.R.; Galili, G. Arabidopsis Seed Development and Germination Is Associated with Temporally Distinct Metabolic Switches. Plant Physiol. 2006, 142, 839–854. [Google Scholar] [CrossRef] [PubMed]
  13. Furutani, I.; Sukegawa, S.; Kyozuka, J. Genome-wide analysis of spatial and temporal gene expression in rice panicle development. Plant J. 2006, 46, 503–511. [Google Scholar] [CrossRef] [PubMed]
  14. Xue, L.-J.; Zhang, J.-J.; Xue, H.-W. Genome-Wide Analysis of the Complex Transcriptional Networks of Rice Developing Seeds. PLoS ONE 2012, 7, e31081. [Google Scholar] [CrossRef]
  15. Chen, H.; Wang, F.-W.; Dong, Y.-Y.; Wang, N.; Sun, Y.-P.; Li, X.-Y.; Liu, L.; Fan, X.-D.; Yin, H.-L.; Jing, Y.-Y.; et al. Sequence mining and transcript profiling to explore differentially expressed genes associated with lipid biosynthesis during soybean seed development. BMC Plant Biol. 2012, 12, 122. [Google Scholar] [CrossRef]
  16. Collakova, E.; Aghamirzaie, D.; Fang, Y.; Klumas, C.; Tabataba, F.; Kakumanu, A.; Myers, E.; Heath, L.S.; Grene, R. Metabolic and Transcriptional Reprogramming in Developing Soybean (Glycine max) Embryos. Metabolites 2013, 3, 347–372. [Google Scholar] [CrossRef]
  17. Han, T.; Wu, C.; Tong, Z.; Mentreddy, R.S.; Tan, K.; Gai, J. Postflowering photoperiod regulates vegetative growth and reproductive development of soybean. Environ. Exp. Bot. 2006, 55, 120–129. [Google Scholar] [CrossRef]
  18. Kim, J.-A.; Chung, I.-M. Change in isoflavone concentration of soybean (Glycine max L.) seeds at different growth stages. J. Sci. Food Agric. 2007, 87, 496–503. [Google Scholar] [CrossRef]
  19. Kumar, V.; Rani, A.; Dixit, A.K.; Bhatnagar, D.; Chauhan, G.S. Relative Changes in Tocopherols, Isoflavones, Total Phenolic Content, and Antioxidative Activity in Soybean Seeds at Different Reproductive Stages. J. Agric. Food Chem. 2009, 57, 2705–2710. [Google Scholar] [CrossRef]
  20. Dhaubhadel, S.; Gijzen, M.; Moy, P.; Farhangkhoee, M. Transcriptome Analysis Reveals a Critical Role of CHS7 and CHS8 Genes for Isoflavonoid Synthesis in Soybean Seeds. Plant Physiol. 2007, 143, 326–338. [Google Scholar] [CrossRef]
  21. Fehr, W.; Caviness, C.E. Stages of Soybean Development. Spec. Rep. 1977, 17, 929–931. [Google Scholar]
  22. Bolger, A.M.; Lohse, M.; Usadel, B. Trimmomatic: A flexible trimmer for Illumina sequence data. Bioinformatics 2014, 30, 2114–2120. [Google Scholar] [CrossRef] [PubMed]
  23. Kim, D.; Langmead, B.; Salzberg, S.L. HISAT: A fast spliced aligner with low memory requirements. Nat. Methods 2015, 12, 357–360. [Google Scholar] [CrossRef]
  24. Anders, S.; Huber, W. Differential expression analysis for sequence count data. Genome Biol. 2010, 11, R106. [Google Scholar] [CrossRef]
  25. Anders, S.; Huber, W. Differential expression of RNA-Seq data at the gene level—The DESeq package. EMBL Eur. Mol. Biol. Lab. 2013, 24, 413–426. [Google Scholar]
  26. Jin, J.; Tian, F.; Yang, D.-C.; Meng, Y.-Q.; Kong, L.; Luo, J.; Gao, G. PlantTFDB 4.0: Toward a central hub for transcription factors and regulatory interactions in plants. Nucleic Acids Res. 2017, 45, D1040–D1045. [Google Scholar] [CrossRef] [PubMed]
  27. Livak, K.J.; Schmittgen, T.D. Analysis of Relative Gene Expression Data Using Real-Time Quantitative PCR and the 2-△△Ct Method. Methods San. Diego. Calif. 2001, 25, 402–408. [Google Scholar] [CrossRef] [PubMed]
  28. Hu, R.; Fan, C.; Li, H.; Zhang, Q.; Fu, Y.-F. Evaluation of putative reference genes for gene expression normalization in soybean by quantitative real-time RT-PCR. BMC Mol. Biol. 2009, 10, 93. [Google Scholar] [CrossRef]
  29. Qiu, L.; Li, Y.; Guan, R.-X.; Liu, Z.-X.; Wang, L.-X.; Chang, R.-Z. Establishment, Representative Testing and Research Progress of Soybean Core Collection and Mini Core Collection: Establishment, Representative Testing and Research Progress of Soybean Core Collection and Mini Core Collection. Acta Agron. Sin. 2009, 35, 571–579. [Google Scholar] [CrossRef]
  30. Pei, R.; Zhang, J.; Tian, L.; Zhang, S.; Han, F.; Yan, S.; Wang, L.; Li, B.; Sun, J. Identification of novel QTL associated with soybean isoflavone content. Crop J. 2018, 6, 244–252. [Google Scholar] [CrossRef]
  31. Zhang, J.; Ge, Y.; Han, F.; Li, B.; Yan, S.; Sun, J.; Wang, L. Isoflavone Content of Soybean Cultivars from Maturity Group 0 to VI Grown in Northern and Southern China. J. Am. Oil Chem. Soc. 2014, 91, 1019–1028. [Google Scholar] [CrossRef]
  32. Azam, M.; Zhang, S.; Huai, Y.; Abdelghany, A.M.; Shaibu, A.S.; Qi, J.; Feng, Y.; Liu, Y.; Li, J.; Qiu, L.; et al. Identification of genes for seed isoflavones based on bulk segregant analysis sequencing in soybean natural population. Theor. Appl. Genet. 2023, 136, 13. [Google Scholar] [CrossRef] [PubMed]
  33. Tsai, H.-S.; Huang, L.-J.; Lai, Y.-H.; Chang, J.-C.; Lee, R.-S.; Chiou, R.Y.-Y. Solvent effects on extraction and HPLC analysis of soybean isoflavones and variations of isoflavone compositions as affected by crop season. J. Agric. Food Chem. 2007, 55, 7712–7715. [Google Scholar] [CrossRef] [PubMed]
  34. Hahlbrock, K.; Scheel, D. Physiology and Molecular Biology of Phenylpropanoid Metabolism. Annu. Rev. Plant Physiol. Plant Mol. Biol. 1989, 40, 347–369. [Google Scholar] [CrossRef]
  35. Dastmalchi, M.; Dhaubhadel, S. Soybean chalcone isomerase: Evolution of the fold, and the differential expression and localization of the gene family. Planta 2015, 241, 507–523. [Google Scholar] [CrossRef]
  36. Mameda, R.; Waki, T.; Kawai, Y.; Takahashi, S.; Nakayama, T. Involvement of chalcone reductase in the soybean isoflavone metabolon: Identification of GmCHR5, which interacts with 2-hydroxyisoflavanone synthase. Plant J. 2018, 96, 56–74. [Google Scholar] [CrossRef]
  37. Jiang, Y.N.; Wang, B.; Li, H.; Yao, L.M.; Wu, T.L. Flavonoid Production Is Effectively Regulated by RNAi Interference of Two Flavone Synthase Genes from Glycine max. J. Plant Biol. 2010, 53, 425–432. [Google Scholar] [CrossRef]
  38. Cheng, H.; Wang, J.; Chu, S.; Yan, H.-L.; Yu, D. Diversifying Selection on Flavanone 3-Hydroxylase and Isoflavone Synthase Genes in Cultivated Soybean and Its Wild Progenitors. PLoS ONE 2013, 8, e54154. [Google Scholar] [CrossRef]
  39. Yan, F.; Di, S.; Rojas Rodas, F.; Rodriguez Torrico, T.; Murai, Y.; Iwashina, T.; Anai, T.; Takahashi, R. Allelic variation of soybean flower color gene W4 encoding dihydroflavonol 4-reductase 2. BMC Plant Biol. 2014, 14, 58. [Google Scholar] [CrossRef]
  40. Szeja, W.; Grynkiewicz, G.; Rusin, A. Isoflavones, their Glycosides and Glycoconjugates. Synthesis and Biological Activity. Curr. Org. Chem. 2016, 21, 218–235. [Google Scholar] [CrossRef]
  41. Yi, J.; Derynck, M.R.; Li, X.; Telmer, P.; Marsolais, F.; Dhaubhadel, S. A single-repeat MYB transcription factor, GmMYB176, regulates CHS8 gene expression and affects isoflavonoid biosynthesis in soybean: GmMYB176 and isoflavonoid biosynthesis. Plant J. 2010, 62, 1019–1034. [Google Scholar] [CrossRef] [PubMed]
  42. Chu, S.; Wang, J.; Zhu, Y.; Liu, S.; Zhou, X.; Zhang, H.; Wang, C.; Yang, W.; Tian, Z.; Cheng, H.; et al. An R2R3-type MYB transcription factor, GmMYB29, regulates isoflavone biosynthesis in soybean. PLoS Genet. 2017, 13, e1006770. [Google Scholar] [CrossRef]
  43. Matus, J.T.; Poupin, M.J.; Cañón, P.; Bordeu, E.; Alcalde, J.A.; Arce-Johnson, P. Isolation of WDR and bHLH genes related to flavonoid synthesis in grapevine (Vitis vinifera L.). Plant Mol. Biol. 2010, 72, 607–620. [Google Scholar] [CrossRef] [PubMed]
  44. Appelhagen, I.; Lu, G.-H.; Huep, G.; Schmelzer, E.; Weisshaar, B.; Sagasser, M. TRANSPARENT TESTA1 interacts with R2R3-MYB factors and affects early and late steps of flavonoid biosynthesis in the endothelium of Arabidopsis thaliana seeds. Plant J. 2011, 67, 406–419. [Google Scholar] [CrossRef]
  45. Schaart, J.G.; Dubos, C.; Romero De La Fuente, I.; van Houwelingen, A.M.M.L.; de Vos, R.C.H.; Jonker, H.H.; Xu, W.; Routaboul, J.-M.; Lepiniec, L.; Bovy, A.G. Identification and characterization of MYB-bHLH-WD40 regulatory complexes controlling proanthocyanidin biosynthesis in strawberry (Fragaria × ananassa) fruits. New Phytol. 2013, 197, 454–467. [Google Scholar] [CrossRef]
  46. Liu, Y.; Hou, H.; Jiang, X.; Wang, P.; Dai, X.; Chen, W.; Gao, L.; Xia, T. A WD40 Repeat Protein from Camellia sinensis Regulates Anthocyanin and Proanthocyanidin Accumulation through the Formation of MYB–bHLH–WD40 Ternary Complexes. Int. J. Mol. Sci. 2018, 19, 1686. [Google Scholar] [CrossRef] [PubMed]
  47. Wu, L.-Y.; Fang, Z.-T.; Lin, J.-K.; Sun, Y.; Du, Z.-Z.; Guo, Y.-L.; Liu, J.-H.; Liang, Y.-R.; Ye, J.-H. Complementary iTRAQ Proteomic and Transcriptomic Analyses of Leaves in Tea Plant (Camellia sinensis L.) with Different Maturity and Regulatory Network of Flavonoid Biosynthesis. J. Proteome Res. 2019, 18, 252–264. [Google Scholar] [CrossRef] [PubMed]
Figure 1. Seed phenotypes, and the total isoflavone content in ZYD7068 and ZYD7194. (A) Phenotypes of ZYD7068 and ZYD7194 seeds.at R5 to R8 stages. (B) The isoflavone content in the mature seeds (at R8 stage) of ZYD7068 and ZYD7194. Error bars represent the standard deviations of data.
Agriculture 13 01164 g001
Figure 2. Differentially expressed genes (DEGs) between tested samples. (A) The numbers of DEGs compared between the two samples DEGs are shown in Red (up-regulated) and Blue (down-regulated). (B) Venn diagram of DEGs in two soybean genotypes during R6 and R8 stages. A1 indicates ZYD7068 seeds at the R6 stage; A3 indicates ZYD7068 seeds at the R8 stage; B1 indicates ZYD7194 seeds at the R6 stage; and B3 indicates ZYD7194 seeds at the R8 stage.
Agriculture 13 01164 g002
Figure 3. Gene Ontology (GO) function enrichment analysis of DEGs identified. (A) GO analysis of DEGs between A1 vs. A3. (B) GO analysis of DEGs between A1 vs. B1. (C) GO analysis of DEGs between A3 vs. B3. (D) GO analysis of DEGs between B1 vs. B3. The DEGs numbers are in different comparative pairs. The functions related to molecular function, cellular components, and biological processes were shown in orange, blue, and green, respectively.
Agriculture 13 01164 g003aAgriculture 13 01164 g003b
Figure 4. KEGG pathway analysis of DEGs of R6 stage (A) and R8 stage (B), respectively. The x-axis indicates the rich factor, while the y-axis indicates the pathway name. The size of the dot represents the number of DEGs. The different colors of dots represent different q-values.
Agriculture 13 01164 g004aAgriculture 13 01164 g004b
Figure 5. Classification and quantitative statistics of differentially expressed transcription factors (blue for A1 vs. B1; orange for A3 vs. B3). The x-axis indicates the categories of differentially expressed transcription factors. The y-axis indicates the number of differentially expressed transcription factors. A1: ZYD7068 at R6 stage. B1: ZYD7194 at R6 stage. A3: ZYD7068 at R8 stage. B3: ZYD7194 at R8 stage.
Agriculture 13 01164 g005
Figure 6. Differential clustering analysis of 8 transcription factors. Red means upward adjustment, and green means downward adjustment. A1: ZYD7068 at R6 stage. B1: ZYD7194 at R6 stage. A3: ZYD7068 at R8 stage. B3: ZYD7194 at R8 stage.
Agriculture 13 01164 g006
Figure 7. The qRT-PCR analysis of DEGs. The y-axis represents the relative expression level for (A) Glyma.04G036700, (B) Glyma.13G17330, (C) Glyma.13G173600, (D) Glyma.14G103100, (E) Glyma.17G158900, and (F) Glyma.19G030500 in 4 seed developmental stages (R5, R6, R7, and R8). Error bars represent the standard deviations of data.
Agriculture 13 01164 g007
Table 1. Summary of soybeans seeds transcriptome data sequenced by the Illumina platform.
SampleA1B1A3B3
Raw reads61,567,63550,030,57655,995,01571,934,601
Raw bases9,235,145,3007,504,586,4008,399,252,30010,790,190,200
Raw reads Q30 (%)92.1792.0492.4893.54
Clean reads58,030,86147,092,57953,356,49969,751,187
Clean bases8,564,826,3686,949,538,1897,867,510,06910,141,929,545
Clean reads Q30 (%)94.6094.5594.6096.65
GC Bases Count (bp)3,995,773,8913,264,362,0613,748,642,3054,851,047,168
GC Bases Ratio (%)46.6646.9847.6447.83
A1: ZYD7068 seeds at R6 stage. B1: ZYD7194 seeds at R6 stage. A3: ZYD7068 seeds at R8 stage. B3: ZYD7194 seeds at R8 stage. Q30: The base mass value is 30.
Disclaimer/Publisher’s Note: The statements, opinions and data contained in all publications are solely those of the individual author(s) and contributor(s) and not of MDPI and/or the editor(s). MDPI and/or the editor(s) disclaim responsibility for any injury to people or property resulting from any ideas, methods, instructions or products referred to in the content.

