Article

Developing a Portable Spectrometer to Detect Chemical Contaminants in Irrigation Water

by
Siti Nadhirah Zainurin
1,
Wan Zakiah Wan Ismail
1,*,
Wan Aina Nadhirah Wan Azlan
1,2,
Khairul Nabilah Zainul Ariffin
1 and
Wan Maryam Wan Ahmad Kamil
3
1
Advanced Devices and System, Faculty of Engineering and Built Environment, Universiti Sains Islam Malaysia, Nilai 71800, Negeri Sembilan, Malaysia
2
MECIP Global Engineers Sdn Bhd, Persiaran Guntong, Kerteh 24300, Terengganu, Malaysia
3
School of Physics, Universiti Sains Malaysia, Minden 11800, Pulau Pinang, Malaysia
*
Author to whom correspondence should be addressed.
Agriculture 2023, 13(6), 1202; https://doi.org/10.3390/agriculture13061202
Submission received: 16 March 2023 / Revised: 14 April 2023 / Accepted: 21 April 2023 / Published: 6 June 2023
(This article belongs to the Special Issue Agricultural Environmental Pollution, Risk Assessment, and Control)

Abstract

:
Water pollution is a critical issue since it can severely affect health and the environment. The purpose of the study is to develop a portable spectrometer (ESP32-based spectrometer) to detect chemical contaminants in irrigation water by observing the light absorbance of contaminants. ESP32 and a light sensor (photodiode) were respectively, used as the main controller and detector of the portable spectrometer. It was developed based on optical dispersion and Beer–Lambert law theory. The light absorbance of different types of contaminants was displayed in a Blynk application for real-time monitoring. The samples were also tested using a lab-based spectroscopy method, ultraviolet-visible (UV-Vis) spectrometer. The spectral range of the measurement is from 350 nm to 700 nm and the standard error of the ESP32-based spectrometer is from 0.01 to 0.05. Five water samples were tested, consisting of ammonium nitrate, organic pesticide, zinc oxide and two different reservoirs used for irrigation. The absorption peaks of the ammonium nitrate and organic pesticide are 363 nm and 361 nm, respectively. Zinc oxide shows the absorbance peak at 405 nm, whereas both reservoirs show absorbance peaks lie in the region from 300 nm to 370 nm. Therefore, this study shows that different types of contaminants can absorb light only at specific wavelength regions by considering the concentration of samples. The developed ESP32-based spectrometer can be applied for on-site water quality monitoring as it is portable, light, simple and can be monitored in real time using multiple devices.

1. Introduction

Water contamination increases in parallel with technological advances. Pesticides and metal contribute the most to water contamination in agriculture [1,2]. The concentration of metal in soil and water has continuously increased due to industrialization and electronics wastes, which affect human, animals and plants [3]. Heavy metals are chemical elements that have a relatively high density and are poisonous even at low concentrations. Therefore, they are commonly associated with contamination, potential toxicity or ecotoxicity. Metal contaminants that are consumed by plants may cause various health risks when they enter the human body. Phytotoxicity by lead (Pb) causes disorders in normal plant physiological activities, killing cells when organisms are exposed to high concentrations [4]. Untreated wastewater carries a substantial amount of heavy metals and causes potential ecological risks to the environment, food quality, soil health and sustainable agriculture [5]. Metals are toxic at concentrations above ambient conditions, non-biodegradable in the environment and accumulate in animal and plant tissue [6]. The absorption spectrum range of heavy metal ion is from 400 to 500 nm and the absorbance peak for copper ions is around 498 nm [7].
Meanwhile, organic contaminants refer to any chemicals based on carbon such as pesticides, organic solvents and petroleum-based waste. The contaminant is usually produced by the organic nature that has a covalent bond with another compound. These types of contaminants are toxic or carcinogenic not only to humans but also to animals and plants [8]. The organic toxic may affect roots and leaves. Organic pollutants may have toxic effects on plant and root cell structure, biosynthesis, membrane stability and DNA [9]. The absorbance spectrum range for organic matter lies between 280 nm and 380 nm [7]. The intensive use of inorganic fertilizers and pesticides can cause the loss of biodiversity in soils and health problems in plants. Thus, the fertilization leads to water, soil and air pollution [10].
Good water quality monitoring and treatment can produce high quality crops as crop stress can hinder photosynthesis, thereby reducing the growth, fruit weight and yield. Recent studies on water quality include the assessment of water quality using a cyber physical system [11], a filtration system [12] and the estimation of groundwater quality using the integration of a water quality index [13]. Optical sensing is a recent technique that has potential use in water irrigation systems since the method is non-invasive and has a high reliability. Optical techniques can consist of laser application [14], optical sensors [15] and spectroscopy [7,16,17,18,19]. Spectroscopy is a reliable physical study used in physics, materials science, chemistry, biochemistry and biomolecular studies since it is suitable for environmental protection and has high detection efficiency [7].
Most spectroscopy studies [17,18,19] had been conducted using lab-based methods in which a spectrometer or detector was used to measure the optical properties of the samples, and data were displayed in a computer in the lab. These methods are accurate and reliable, but they are complicated and time consuming because samples need to be transported to the lab. It becomes an issue for any consumers who require fast results for quick action. The development of miniaturized analytical devices is important since the devices not only can give fast and reliable outcomes but also can bypass logistic issues via on-site testing or remote confirmation of detection [16,20].
Here, we developed a portable ESP32-based spectrometer to detect the light absorbance of chemical contaminants in irrigation water. The testing was also conducted using a lab-based method (Ocean Optics Spectrometer) to observe the reliability of the developed spectrometer. Optical dispersion and the Beer–Lambert law theory were referred to in this study, and we focus on contamination in irrigation water. We use samples from organic and metal contaminants as they are common issues faced in water irrigation systems in Malaysia. The system was developed using an ESP32 microcontroller to control the spectrometer and a light sensor to sense and measure the light. The output was displayed in a Blynk online application for real-time monitoring using a mobile phone and a laptop. We tested ammonium nitrate, organic pesticides, zinc oxide and water sources from the irrigation system. The sample solutions were prepared by dissolving the chemical compound in the deionized water solution. The presence of contaminants can be detected by their optical properties because they have molecules that can absorb the light. Thus, this study can further assist farmers to monitor irrigation systems that need high quality water for plants. This is because excessive organic contaminants and heavy metals in water can lead to the abnormal growth of plants.

2. Theoretical Study

The spectrometer was developed based on optical dispersion and the Beer–Lambert Law.

2.1. Optical Dispersion

Optical dispersion occurs when light is separated into different individual colors of the spectrum and exposed to diffraction grating [21]. The rainbow color spectrum is produced when the white light is separated into components of different wavelengths or colors. When a light ray passes through one transparent substance and into another, its path bends or refracts. Different wavelengths are separated by modest angles because the refraction index of optical glasses varies by only a few percent across the visible spectrum [21].

2.2. Light Absorbance and Transmittance Based on Beer–Lambert Law

Light absorbance and transmittance in the sample can be found using the Beer–Lambert law. The Beer–Lambert law is a linear relationship between the light absorbance and the concentration of solution. The Beer-Lambert law states that the concentration of a solution is directly proportional to the light absorbance, as shown in Equation (1) [22,23], where A refers to the light absorbance at a given wavelength of light, ε is the molar absorptivity, b is the path length referring to the distance of light passing through the solution and c is the concentration of the compound in the solution.
A b s o r b a n c e A = ε b c   =   l o g   ( T )
The light absorbance (A) has an algorithmic relationship to the light transmittance (T) [9]. The light transmittance (T) of the solution is defined as the ratio of the transmitted intensity (It) over the incident intensity (I0). The light transmittance can be defined as in Equation (2) [22,23,24], where T refers to the light transmittance of a sample, It is the transmitted light intensity and I0 is the incident light intensity.
T r a n s m i t t a n c e T = I t I 0
The incident and transmitted light intensities can be calculated according to Equation (3) [24].
A b s o r b a n c e A = l o g T = l o g I t I 0

3. Materials and Methods

3.1. Sample Preparation

Zinc, ammonium nitrate and organic pesticides were tested because they were among the top environmental toxicants endangering the relevant environment [25]. Water from two reservoirs, used for irrigation was also tested.

3.1.1. Ammonium Nitrate (NH4NO3)

Ammonium nitrate can contaminate water when there is a spill from fertilizer. Ammonium nitrate results in small root and small leaf area, which may contribute to a low carbon gain and inhibit crop growth. Ammonium nitrate was prepared by mixing 8.2 g NH4NO3 that had around a 0.052–10 µm particle size with 60 mL of deionized water, which produced 0.14 g/mL of sample concentration.

3.1.2. Organic Pesticides

Organic pesticides are chemical compounds or mixtures of chemical compounds that are used to prevent or reduce insect populations. Organic pesticides are made from natural ingredients such as minerals, plants and microorganisms. The elements in pesticides that inhibit plant growth are usually coming from organochlorine DDT, endosulfan, endrin and heptachlor [25]. The larger the organic matter content, the greater the absorption of pesticides.

3.1.3. Zinc Oxide

Zinc oxide is a metal oxide material that has bandgap tailoring, doping with various types of materials and is able to form many structures [26]. Metal contaminations can lead to the decline and deterioration of soil fertility and environment quality [27]. Zinc exists in irrigation water due to chemical spills, which can affect plants. Zinc is a heavy metal compound that has a strong metallic bond. A high concentration of zinc can cause toxicity in plants, which itself can cause the stunting of shoots, the curling and rolling of young leaves and the death of leaf tips and chlorosis. The particle size of zinc oxide used in the system and dissolved in the water was less than 100 nm. A 0.125 g/mL solution was prepared by dissolving 7.5 g of zinc oxide powder in 60 mL of deionized water. The solution was stirred frequently during the testing process to ensure the solution was well mixed.

3.1.4. Water Sources from Irrigation System

The irrigation water sample was taken from different water sources in Nilai. The sample was tested, and types of contaminants could be investigated by observing the spectrum of light absorption. Reservoir I is located near the Faculty of Science and Technology, Universiti Sains Islam Malaysia (USIM). It is used to irrigate the Nursery Landscape, Department of Development and Facilities Management (JPPF), USIM. According to the caretaker of the area, the water may have organic material since it is near the area’s sewage. The water source is used twice a day to irrigate the agriculture area. Reservoir II is also located in USIM, but it is rarely used for the irrigation system. The water source may indicate the presence of organic material based on its color. We observe that Reservoir II contains many living things, such as fish, which also can contribute to organic contaminants in the water sample.

3.2. Spectroscopy Techniques

Spectroscopy is a non-destructive approach that uses the interaction effect of electromagnetic radiation to identify the energy level and structure of an atomic or molecular substance [28]. Ultraviolet-visible (UV-Vis) spectroscopy methods are used to quantify the transition of ions and highly conjugated electronic compounds by measuring an electron transition corresponding to the excitation of the outer electrons [29]. When light is absorbed by a material, valence (outer) electrons are excited from their normal (ground) states to higher energy (excited) states. Broad absorption peak can be seen instead of sharp absorption peak. Vibrational energy levels are available at each electronic energy level, and transitions can occur to and from the different vibrational levels and, thus, result in peak broadening [29].
We developed a ESP32-based spectrometer and set up the experiment using a lab-based spectrometer, ultraviolet-visible (UV) Ocean Optics spectrometer (Ocean Insight). Ocean Optics spectrometer is commercially used for finding light transmittance, absorbance and fluorescence of any material. The measurements from both spectroscopy techniques were averaged from 10 measurements.

3.2.1. Measuring Light Absorbance Using a Portable Spectroscopy Technique (ESP32-Based Spectrometer)

ESP32 microcontroller was used to read the data waveform generated from the system. Servo motor was used in the system to move a compact-disk (CD) player to provide different light spectrum ranges. Light source (XM-L2 LED Light source, spectrum ranging from ~300 nm to 780 nm) shined the CD player that showed the characteristics of an optical grating. The system was placed in a closed black box to prevent outside light from affecting the samples and to reduce the reflectivity of the internal surfaces. A light sensor (silicon photodiode) was located near the sample to measure the amount of transmitted light. The sensor has high photo sensitivity and radiant sensitivity to measure light from 300 nm to 1200 nm and transform it into electricity. Figure 1 shows the spectrometer that has been developed. Figure 1a,b show the front view and side view of the design to justify the portability of the spectrometer, whereas Figure 1c depicts the position of light source, ESP32 microcontroller and light sensor inside the box. When the light source shined on the CD player, light spectrum was diffracted and the light passed through the sample via the small slit. The enclosure was closed during measurement to reduce effects from surrounding light.
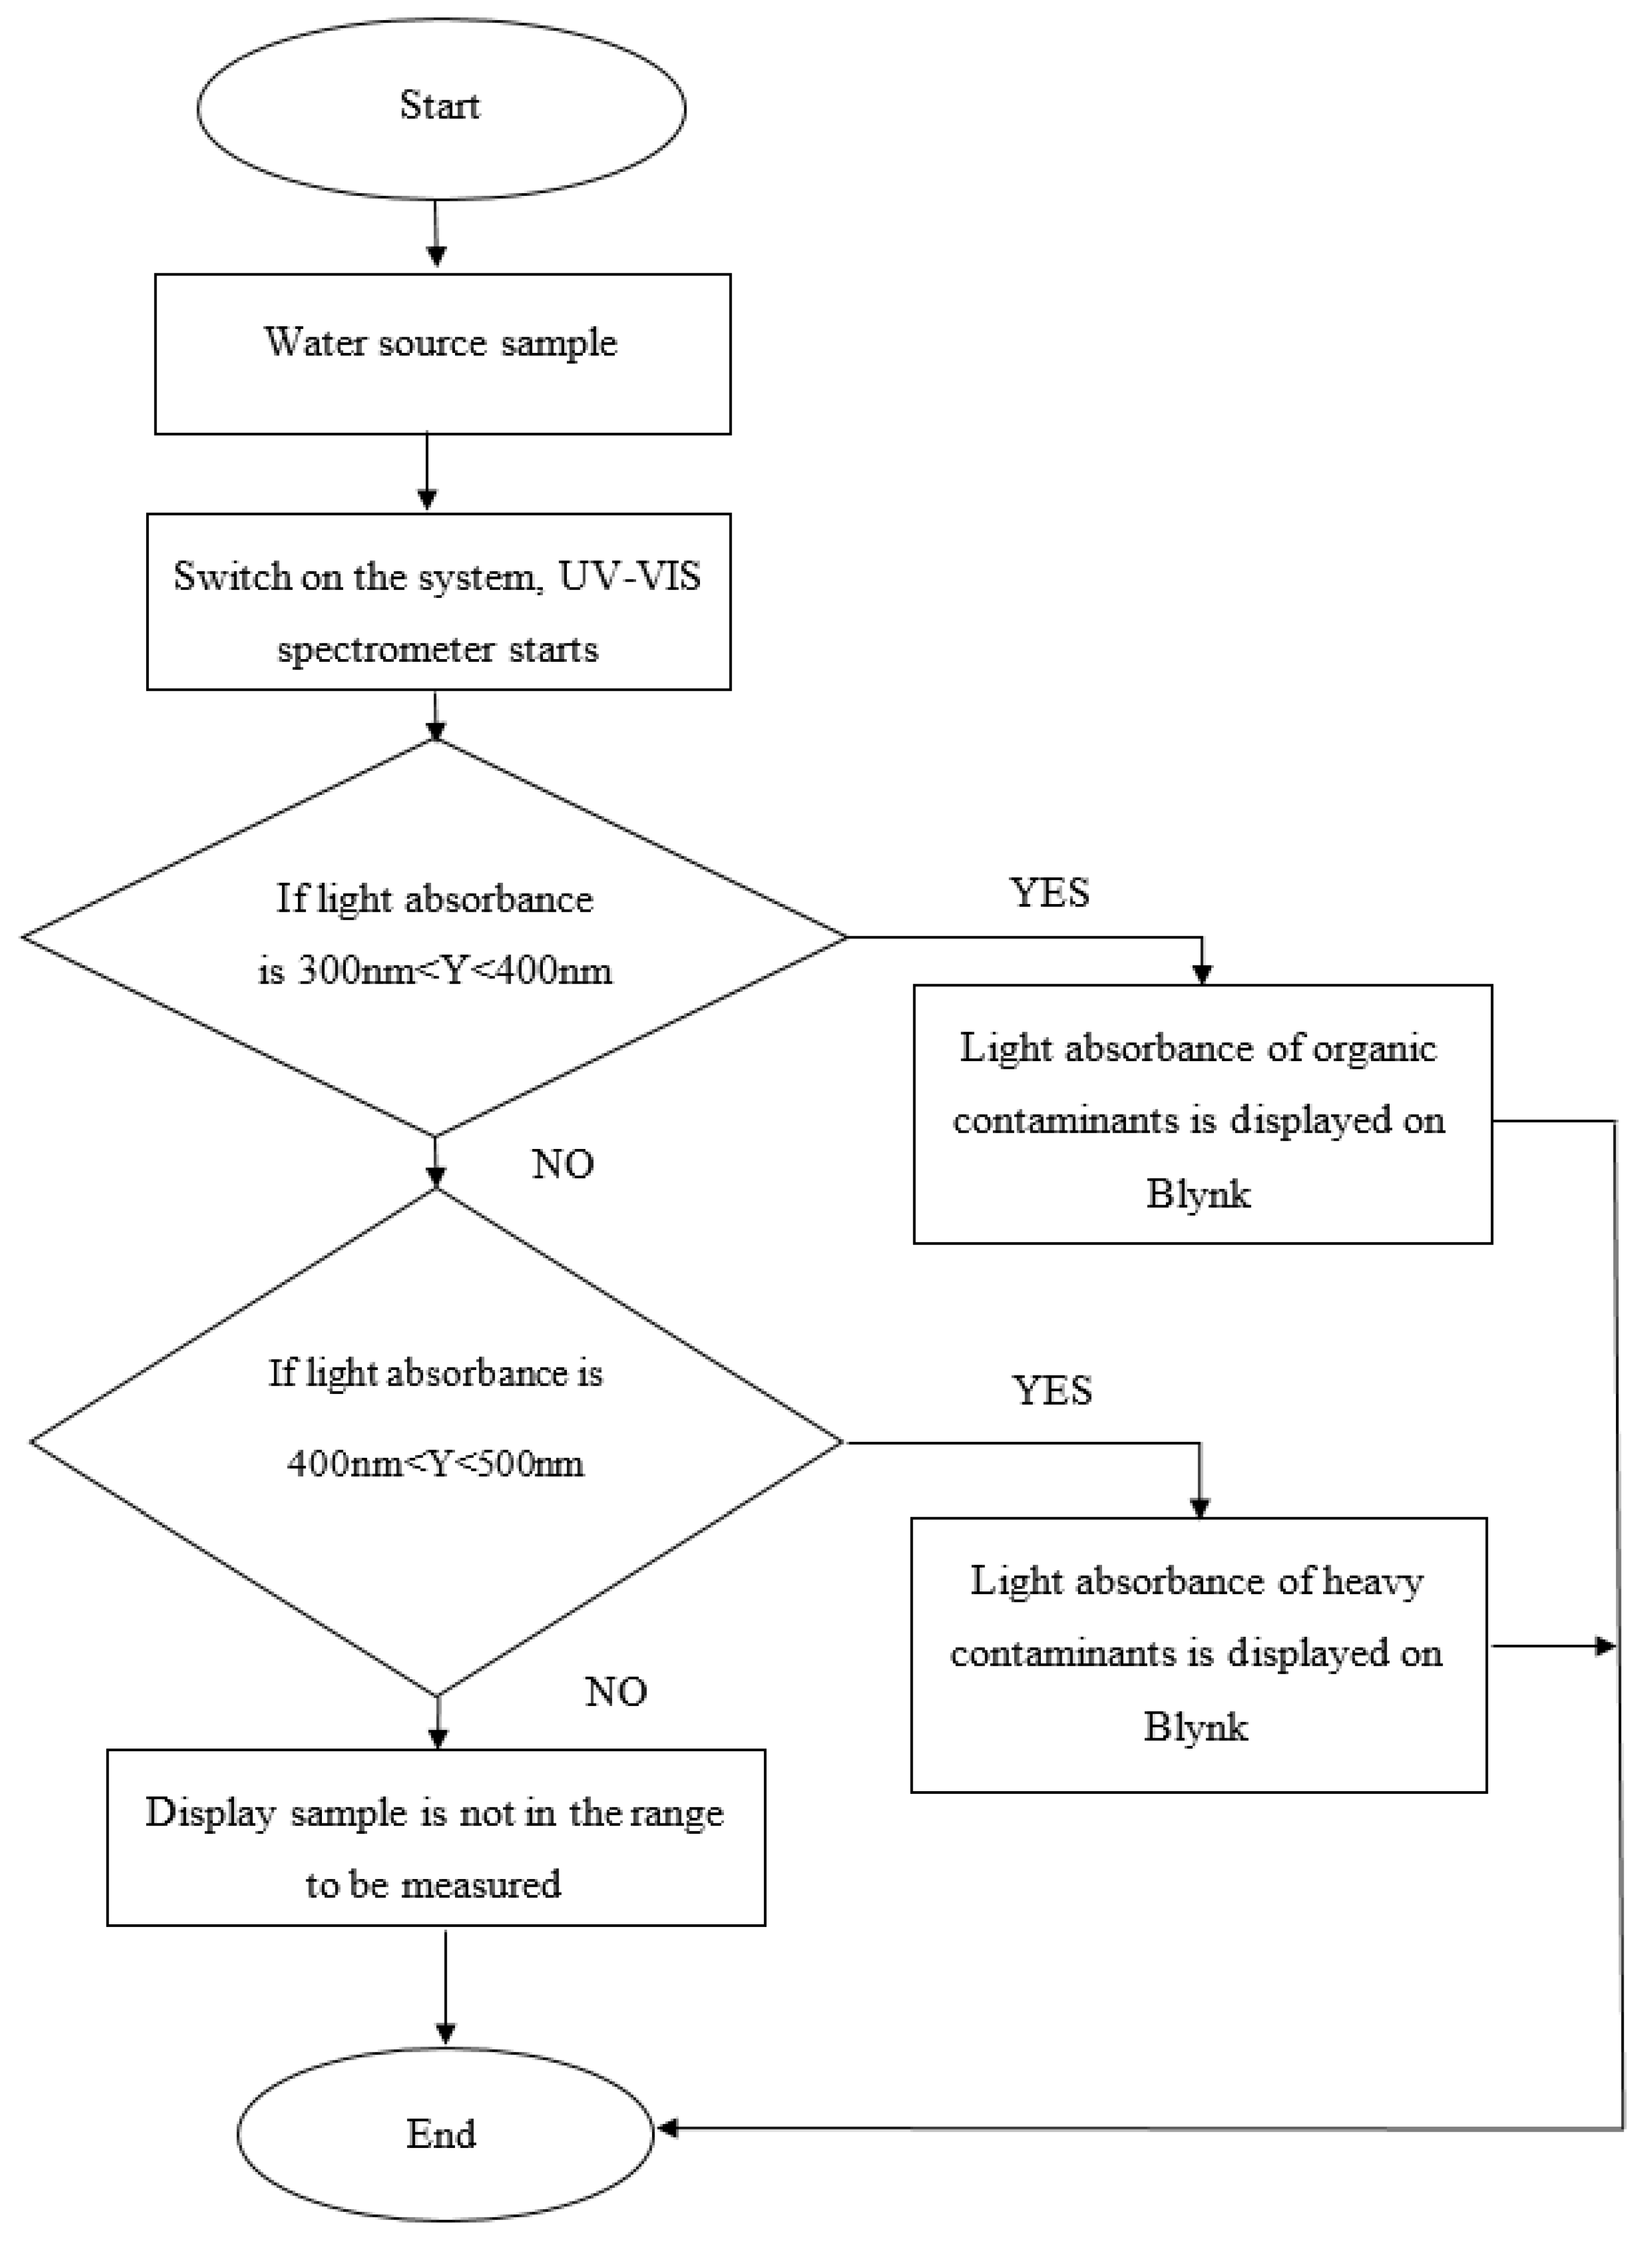
Flow chart of the testing method using ESP32-based spectrometer is depicted in Figure 2. When ESP32 microcontroller was connected to a power source, the servo started to rotate, and various colors of light were exposed to the sample. Light sensor measured the light transmission in the system. After obtaining the light transmission, the light absorbance can be calculated using Beer–Lambert law. If the light absorbance had the maximum peak in the UV-Vis range, the data were analyzed to determine whether the contaminants were organic or heavy metals. Otherwise, if the maximum light absorbance was not in the range of UV-Vis, the system was terminated and another sample was tested. The sample was tested ten times to ensure accuracy of the data.

3.2.2. Measuring Light Absorbance Using a Lab-Based Spectroscopy Technique (Ocean Optics Spectrometer)

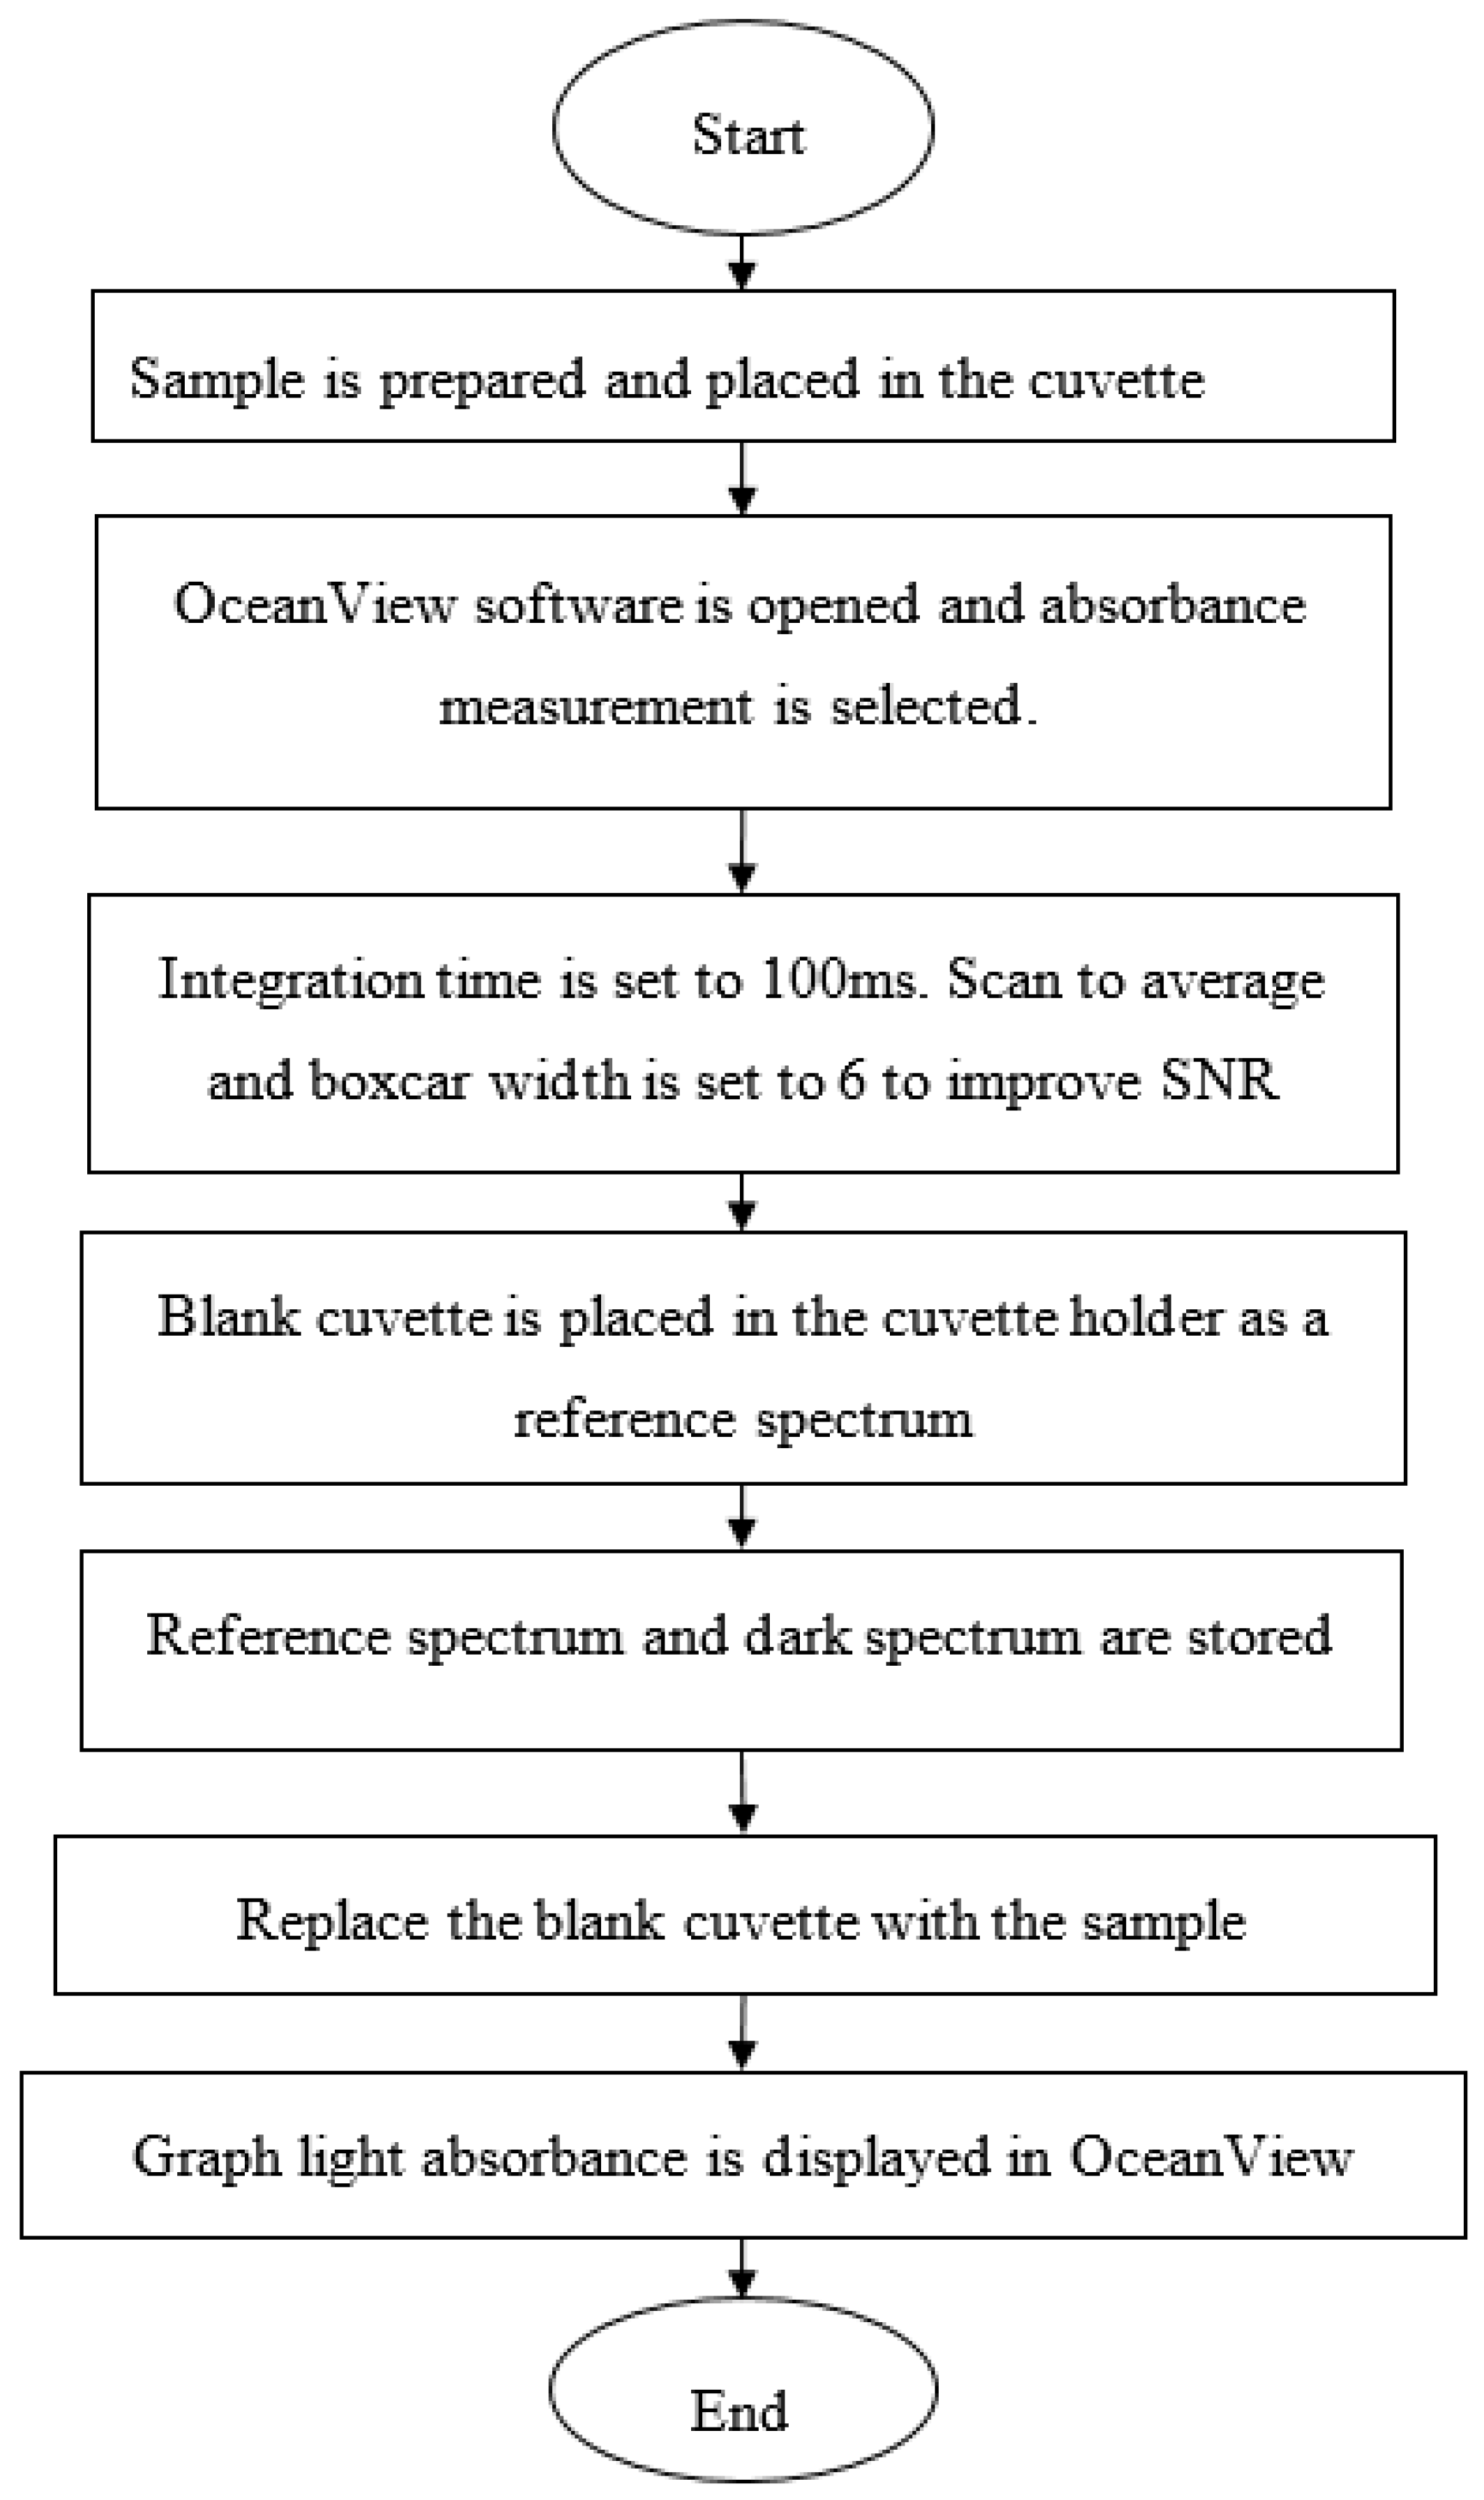
The measurement of light absorbance using the Ocean Optics Spectrometer was conducted according to a flow chart in Figure 3. Sample was placed in the cuvette and absorbance measurement in OceanView software was applied.
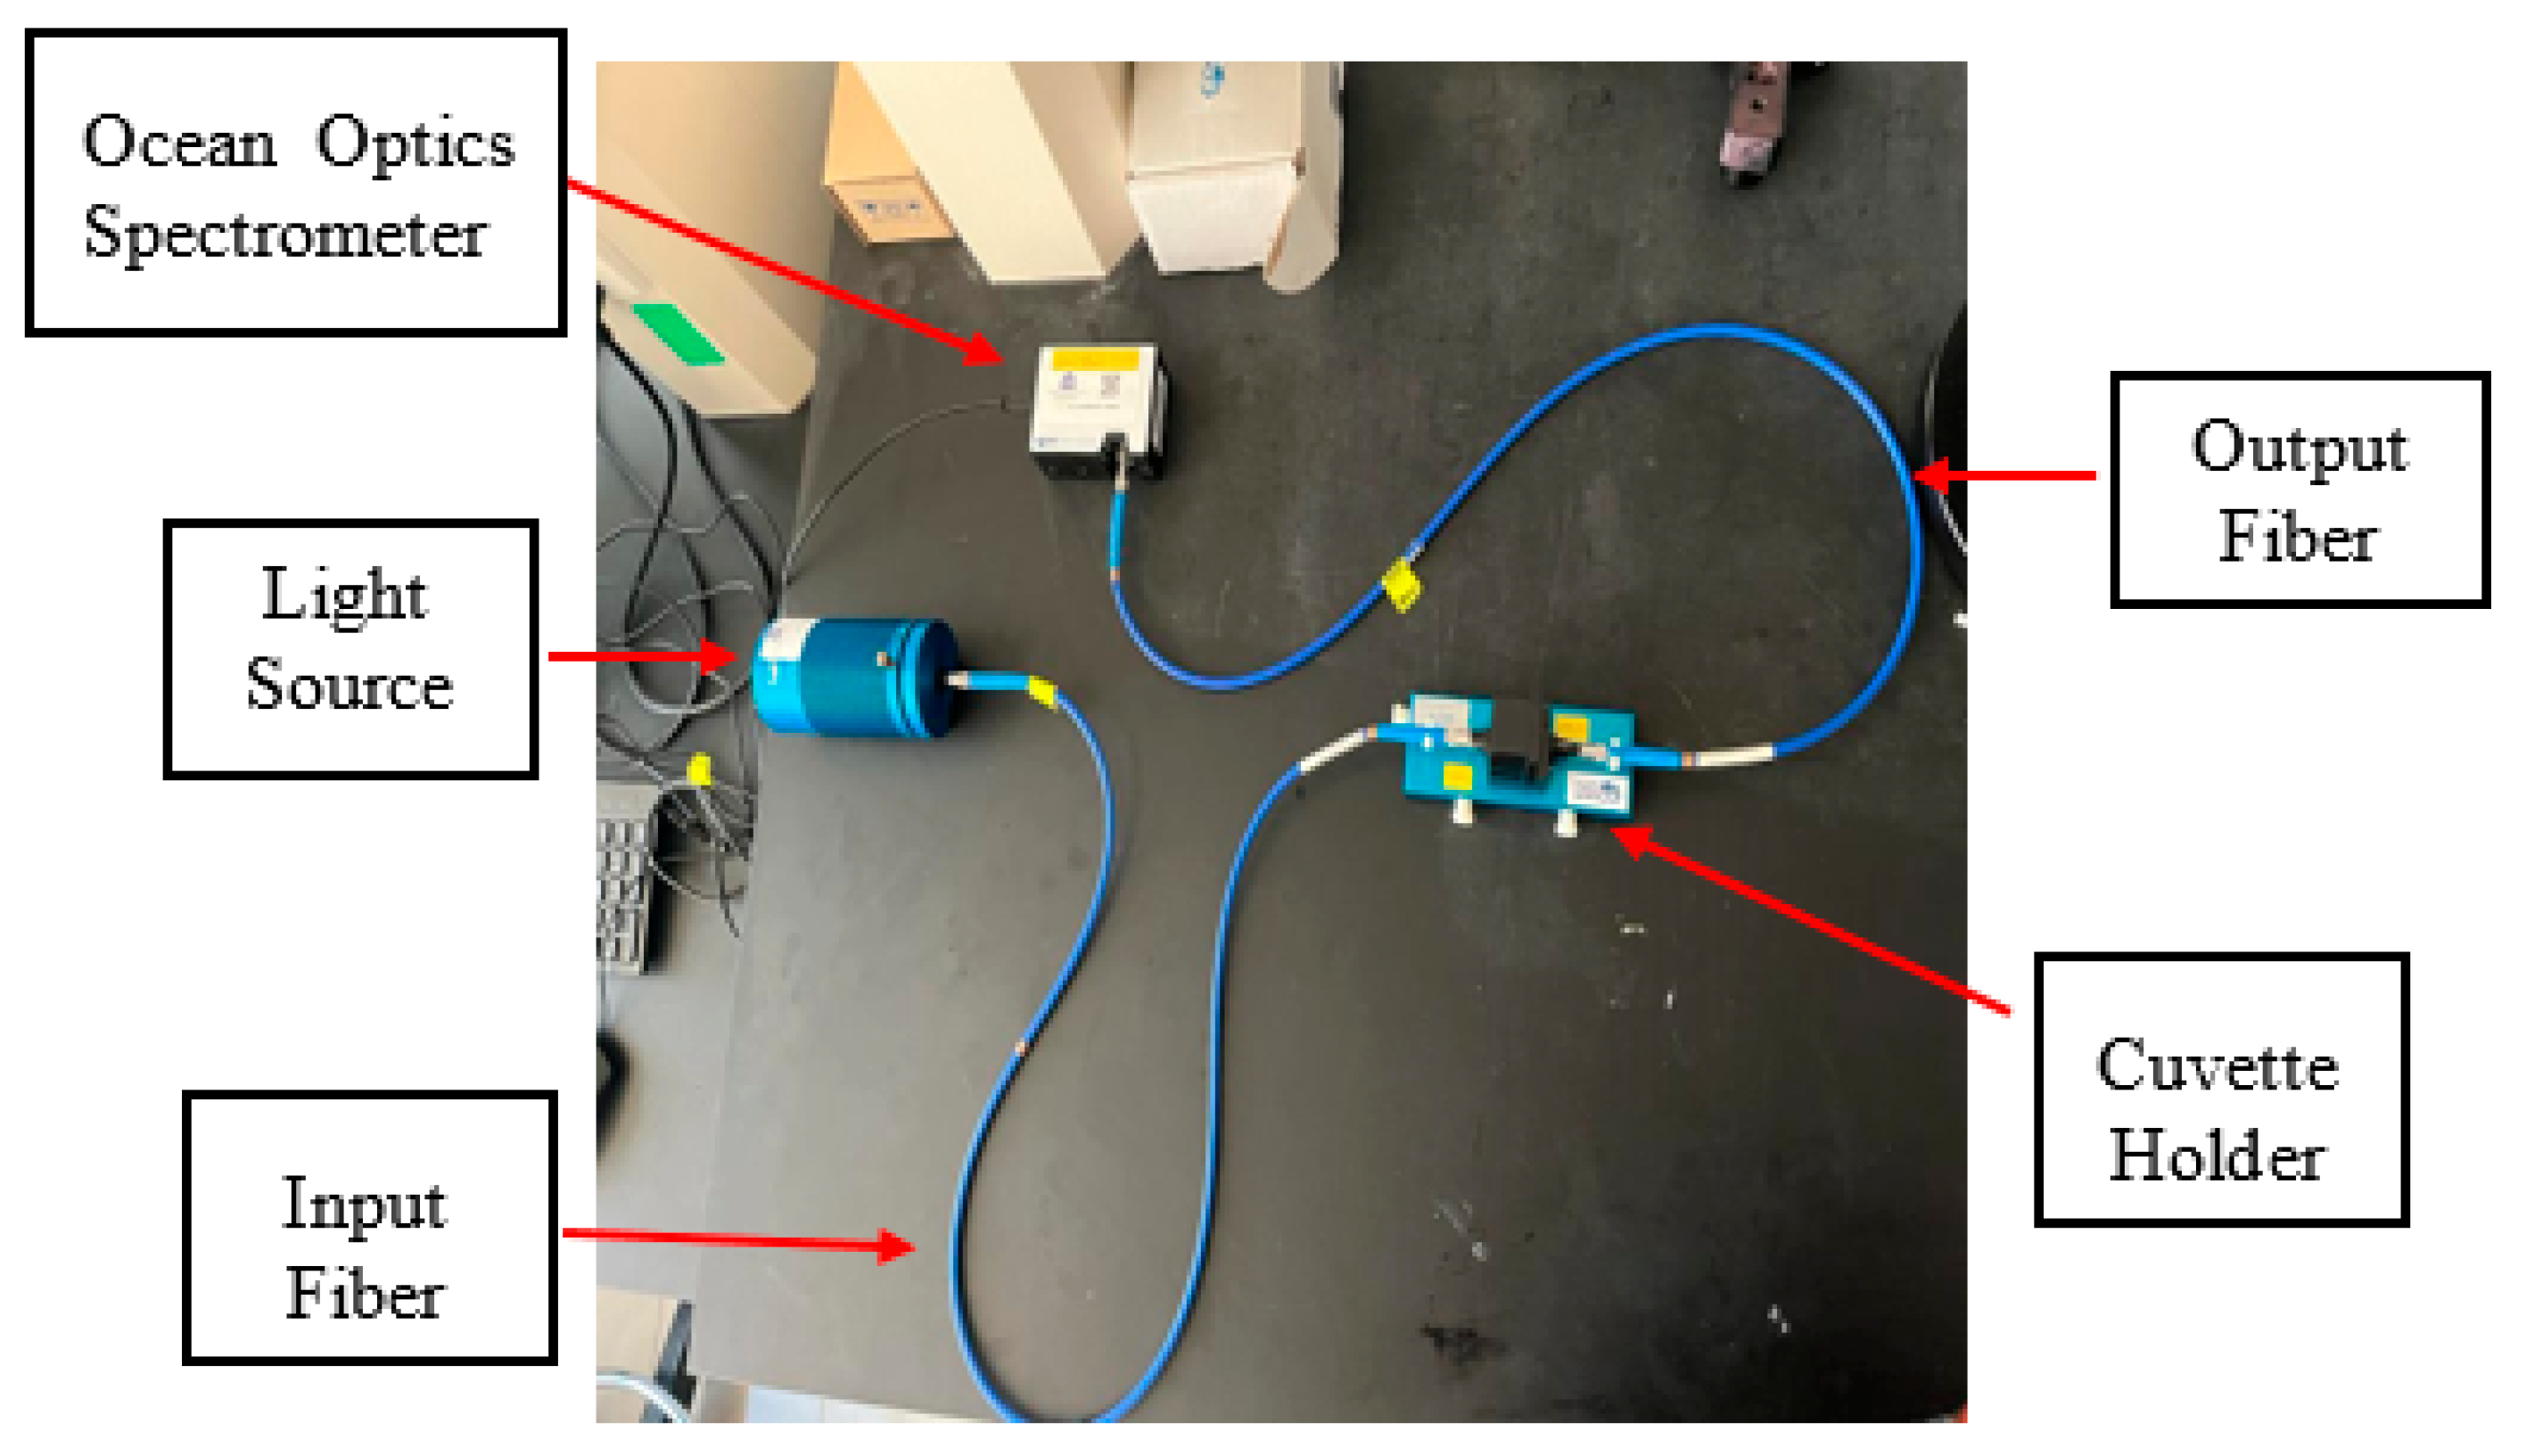
Figure 4 shows the experimental setup using the Ocean Optics spectrometer. A light source produced light in a range from 350 to 1000 nm that passed through the plastic cuvette that had samples. The transmitted light was measured by the Ocean Optics spectrometer, which was connected to a computer. The OceanView software was installed in the computer to record the data that were measured by the spectrometer and to display the spectral response. The amount of light transmitted through the sample decreased because some light may have been absorbed by the molecules or particles in the samples, based on the Beer–Lambert law [22,23]. To calibrate the spectrometer, an empty cuvette was shined by the light source, and the light absorbance was stored as a reference spectrum.

4. Results

4.1. Real-Time Monitoring Using Blynk Application

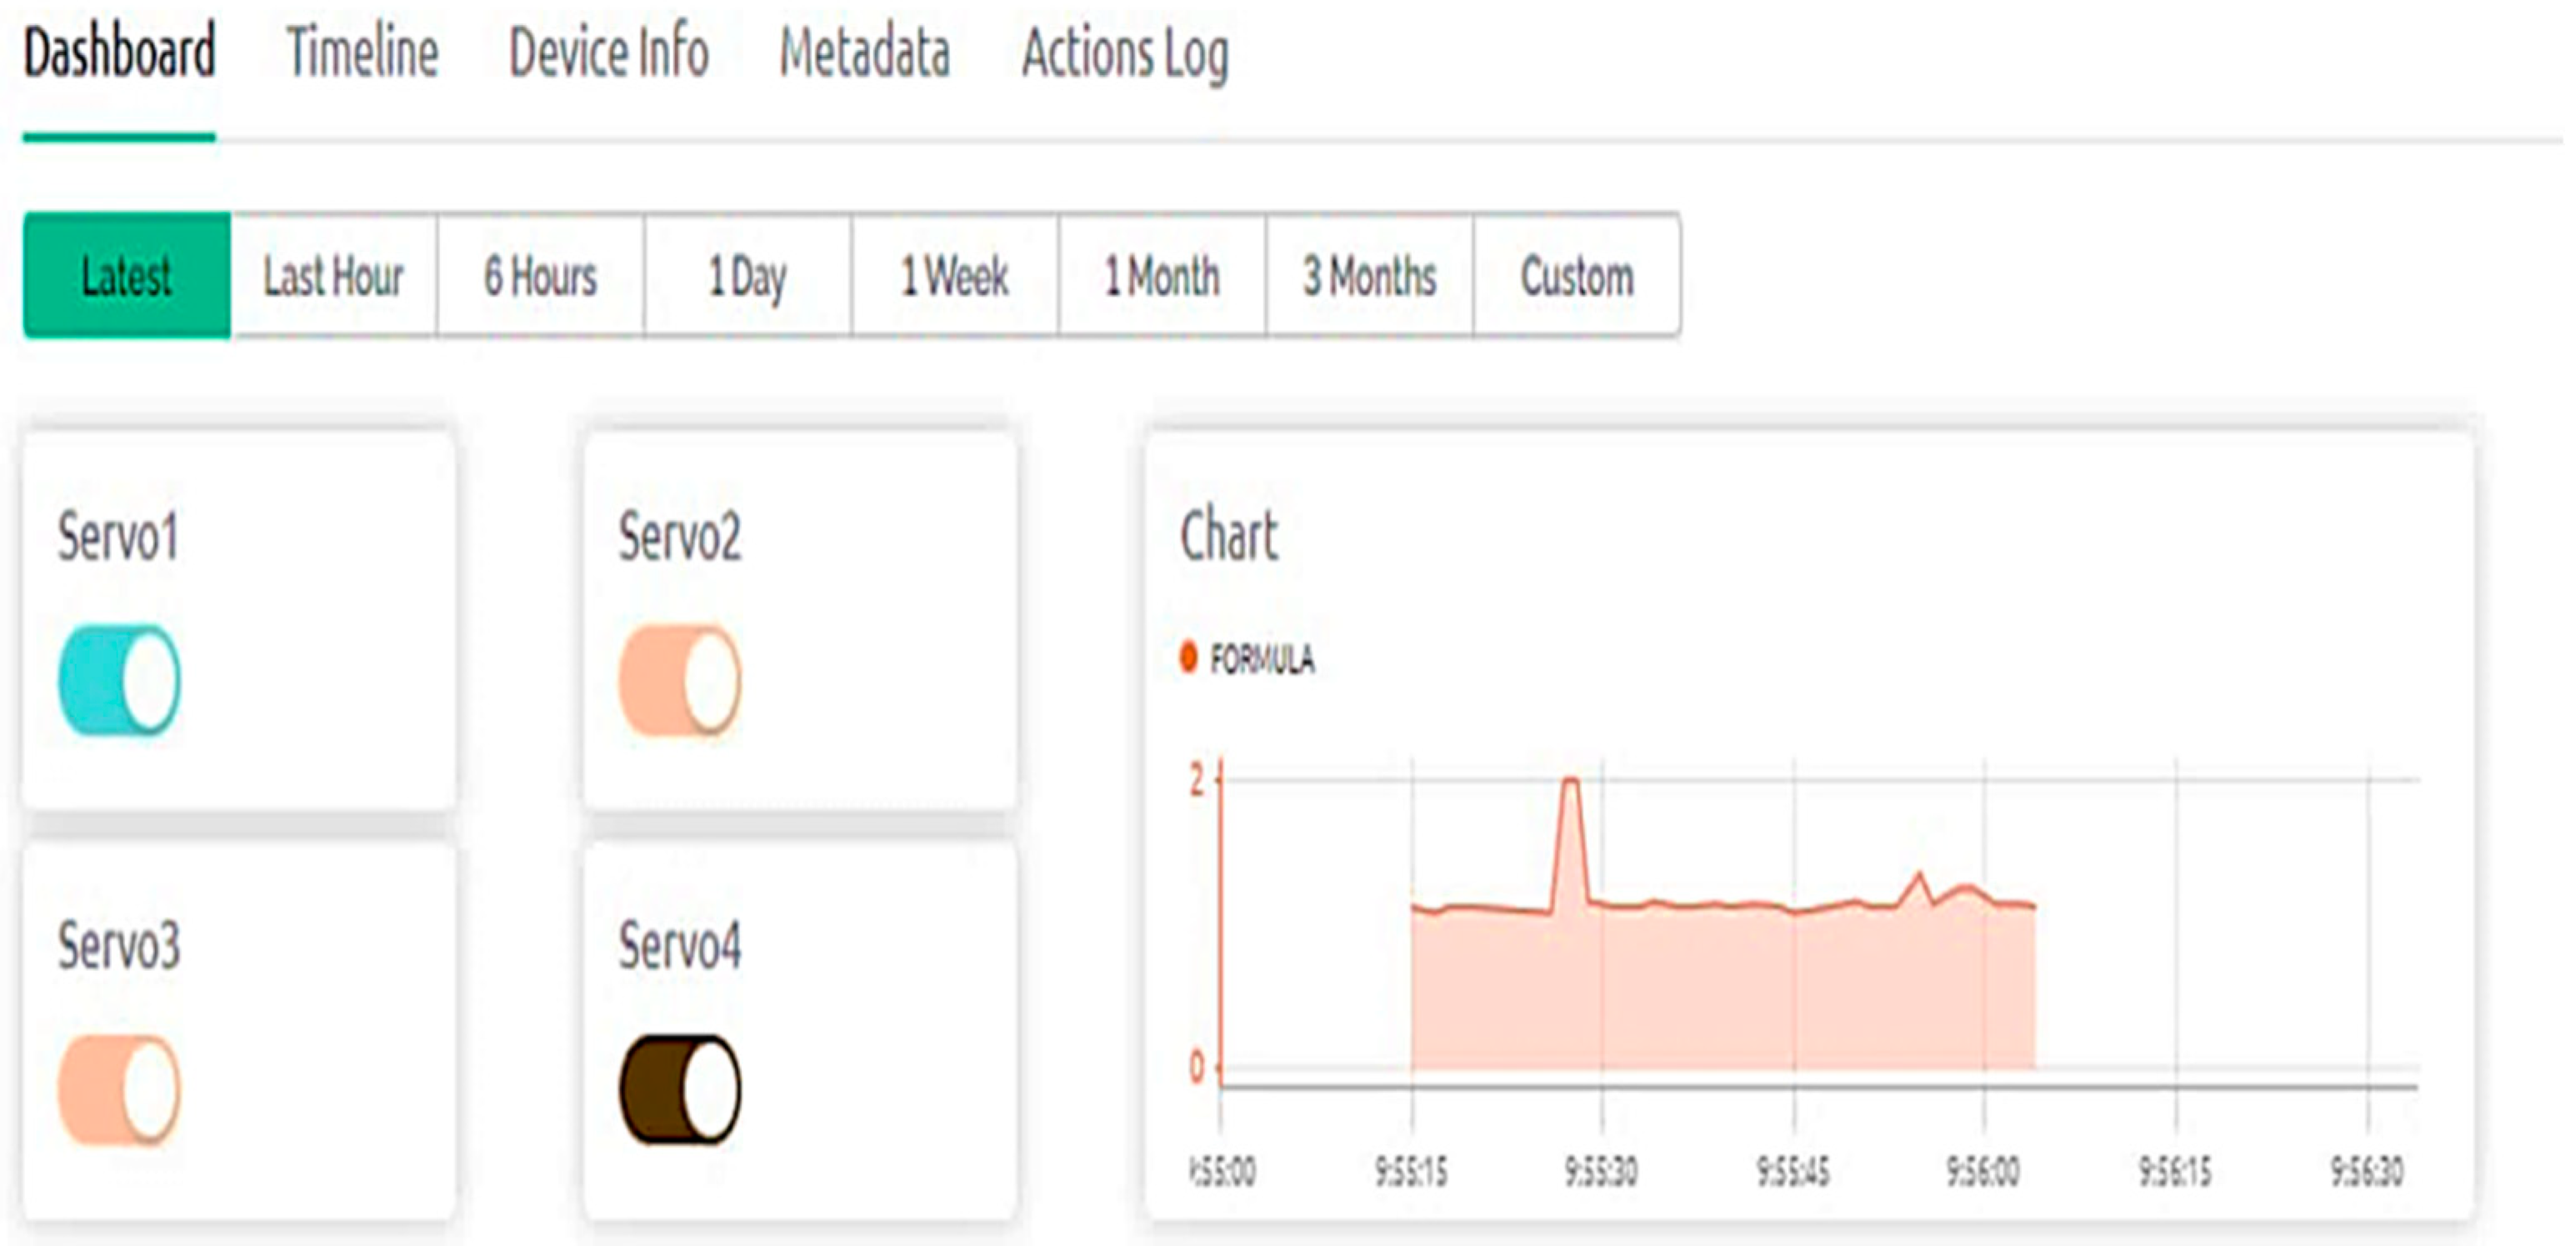
The sample was tested, and the output was displayed using a Blynk application for real-time monitoring. The data slightly fluctuated due to the sensitivity of the light sensor. Thus, the measurement was repeated ten times. The output was averaged, and the data were plotted using Origin software to observe the absorbance peak. Figure 5 shows the real-time monitoring and sensing method using a mobile phone. The light transmittance, It, and the light absorbance, A, can be observed with the Blynk application.
In Figure 5, the top display shows four buttons (ON and OFF) to control the movement of the servo motor to vary the spectrum wavelength. The value of the transmitted light, It, from the sample is shown on the Blynk display. The light sensor detects light and converts it to an electrical signal output. The transmitted light is then converted to the absorbed light using the Beer–Lambert law. The value of the light sensor is displayed together with the value of the light absorbance at the specific range of the spectrum. Figure 6 depicts the real-time monitoring and sensing by a computer. The servo motor can be turned on or off to change the region of the spectrum wavelength. The output of the absorbance value versus time is displayed by the graph.

4.2. Light Absorbance from ESP32-Based Spectrometer

The light absorbance using the ESP32-based spectrometer and the Ocean Optics spectrometer was plotted in Origin. Figure 7a–e show the output of the light absorbance (wavelength ranging from 300 nm to 700 nm) from the ESP32-based spectrometer. Figure 7a shows the light absorbance from the pesticide sample with the highest absorbance peak lying in the wavelength ranging from 300 nm to 400 nm. The absorbance peak of ammonium nitrate is also within the wavelength range between 300 nm and 400 nm (Figure 7b), and the absorbance peak of zinc oxide using ESP32-based spectrometer lies between 400 nm and 500 nm with the absorbance peak at 400 nm, as shown in Figure 7c. Meanwhile, Figure 7d shows the light absorption spectrum of Reservoir I and the absorbance peak lies in the region between 300 nm and 400 nm, which indicates that the water may consist of organic contaminants. Reservoir II shows the wavelength range of the absorbance spectrum to be between 300 nm and 400 nm, which also shows that the water sample may consist of organic contaminants (Figure 7e).

4.3. Light Absorbance from Ocean Optics Spectrometer

The sample was also tested with a lab-based spectroscopy method. The light absorbance output from the Ocean Optics spectrometer for each water sample is depicted in Figure 8a–e. Figure 8a shows the absorption spectrum of the pesticide sample (from 300 nm to 400 nm) with the absorbance peak at ~361 nm [16]. Meanwhile, Figure 8b shows the absorbance spectrum of ammonium nitrate and the absorption peak lies at ~363. Furthermore, the absorbance peak of zinc oxide (Figure 8c) is ~405 nm and the absorption peaks of Reservoir I (Figure 8d) and Reservoir II (Figure 8e) are ~346 nm and ~361 nm, respectively.

5. Discussion

Detecting heavy metal and organic contaminants in water is crucial in agriculture. In this research, three contaminants (zinc oxide, ammonium nitrate and organic pesticide), commonly found in irrigation water, and two irrigation water sources (Reservoir I and Reservoir II) were tested. Other chemical elements can also be tested as long as they can absorb light in the ultraviolet and visible spectral ranges. The light source needs to be changed to infrared to detect elements with wavelengths over 800 nm.
The developed spectrometer can display outputs on multiple devices such as mobile phones (Figure 5) and computers (Figure 6). Figure 7a depicts that the highest absorbance of the pesticide sample is in the range from 300 nm to 400 nm. We attribute that to the organic compounds in pesticides, which may comprise of rotenone, neem, pyrethrum and minerals, such as cryolite, boric acid and diatomaceous earth. The chemical compounds also can contribute to the color of the pesticide solution. A previous study conducted by Rohit et al. [30] also showed a quite similar absorbance range of pesticides, from 360 nm to 400 nm.
Meanwhile, the absorption peak of the nitrate sample also lies from 300 nm to 400 nm (Figure 7b). The nitrate ions can be classified as ions that have a strong absorption range in ultraviolet spectrum region, from 280 nm to 320 nm [31]. Most types of UV sources emit in the spectrum region and can interact with nitrate in water to generate hydroxyl radicals [31,32]. When the electromagnetic energy, such as UV light, propagates in aqueous samples, a fraction of energy can be transferred to the ions via the transition of electrons between different energy levels [23,33]. Thus, it shows that nitrate ion achieves the excitation in the region of 300 nm to 400 nm.
Then, the absorption spectrum of zinc oxide lies from 400–500 nm (Figure 7c). The result is similar to the previous studies from Kolli et al. [34] and Darroudi et al. [35], in which the absorbance spectrum of zinc ranged from 350 nm to 500 nm with absorption peaks ~383 nm and at ~357 nm, respectively. This is because the metal bond has strong electron excitation in the respective wavelength region. The electron transition in zinc oxide occurs due to the transition from the valence band to the conduction band. Metal sources in the environment are both anthropogenic and natural. The sources include effluents from wastewater treatment plants, industrial and agricultural wastes, power stations, mining, boating activities, transportation vehicles, urban runoff and geological processes [6].
Reservoir I (Figure 7d) and Reservoir II (Figure 7e) show that the absorbance peaks lie within the wavelength range of 300 nm to 400 nm. This is because the organic material consists of carbon and a hydrogen bond and is matched with the absorption energy from the molecules in the sample solution. The light absorbance of Reservoir II is slightly low compared to Reservoir I since the water is not as turbid as Reservoir I. Reservoir II is not near any sewage area, but the reservoir has many fish, which may also contribute to organic compounds.
In comparison to the ESP32-based spectroscopy method, the lab-based spectrometer (Figure 8) can give higher accuracy due to the continuous reading or light scanning of each sample. The absorption peak of zinc oxide (Figure 8c) is at ~405 nm due to electron transition in the spectrum region. It can be assigned to the intrinsic band-gap absorption of ZnO due to the electron transitions from the valence band to the conduction band (O→Zn) [35]. Then, Ocean Optics spectrometer depicts the absorbance peak at ~346 nm for Reservoir I (Figure 8d) because the organic particles achieve the excitation energy within this region [36]. The Ocean Optics spectrometer also depicts the absorbance peak at ~361 nm for Reservoir II (Figure 8e), which lies from 300 nm to 400 nm. This shows that Reservoirs I and II contain organic contaminants.
Both types of spectrometers have proved the ability to measure the light absorbance to further detect organic and heavy contaminants in water samples. The comparison of system performance between lab-based spectrometer and portable ESP32-based spectrometer is shown in Table 1. These two techniques have advantages and disadvantages, respectively. ESP32-based spectrometer is portable, low-cost and can be monitored in real-time via multiple devices, whereas Ocean Optic spectrometer is non-portable (must be set up with a light source and a computer), requires lab-based monitoring and is high-cost. However, the Ocean Optic spectrometer can give higher accuracy. Thus, it depends on farmers or consumers to choose their preferred method.

6. Conclusions

In conclusion, we have developed a portable spectrometer that can measure light absorbance to detect contaminants in water. The spectrometer was developed based on optical dispersion and the Beer–Lambert law. Different types of chemical compounds can produce different absorbance peaks based on their chemical structure. The study investigates the relationship between the types of compounds and absorption spectrum to obtain the light transmittance and absorbance of the sample. The study can be used further to sense any presence of organic and metal contaminants in irrigation water. The spectrometer consists of the ESP32 microcontroller, a servo motor to control spectra movement, a light sensor to measure light transmittance and Blynk software to display the output of the spectrometer. An experiment to measure light absorbance using a lab-based spectrometer, Ocean Optics spectrometer, was also set up. The organic contaminants have an absorbance peak that lies between 300 nm and 400 nm, whereas the heavy metal contaminants show a peak that lies between 400 nm and 500 nm. The irrigation water from two different water sources (Reservoir I and Reservoir II) was tested using the ESP32 and Ocean Optics spectrometers and both sources show the presence of organic contaminants. Thus, we believe that the ESP32-based spectrometer can reliably be used in irrigation systems since the device is portable and can be monitored in real-time. The other advantages of the ESP32-based spectrometer are that it is low-cost, non-invasive and can differentiate types of contaminants based on optical properties. It is also a simple and fast method for quantitative estimation.
In the future, a larger battery capacity will be used to ensure the spectrometer can last longer. We will perform simultaneous detection of elements by combining a few contaminants into one sample. We will test more heavy metal elements such as copper and iron. Rivers and lakes, especially polluted rivers will be tested as well. The ESP32-based spectrometer can be further upgraded to find concentrations or the molar absorptivity of biological macromolecules and organic molecules.

Author Contributions

Conceptualization, supervision, project administration, funding acquisition, W.Z.W.I.; writing—original draft preparation, W.A.N.W.A.; experiment, writing—review and editing, S.N.Z.; funding acquisition and review, K.N.Z.A.; reviewing and proof reading, W.M.W.A.K. All authors have read and agreed to the published version of the manuscript.

Funding

This research was funded by the Ministry of Higher Education, Malaysia under the Fundamental of Research Grant Scheme, grant number FRGS/1/2021/WAB02/USIM/02/1 and USIM-MMU Matching grant (USIM/MG/MMU-PPKMT-ZDA/FKAB/SEPADAN-S/70822). The APC was funded by Universiti Sains Islam Malaysia (USIM).

Institutional Review Board Statement

Not applicable.

Data Availability Statement

Not applicable.

Acknowledgments

We would like to acknowledge our funder, the Ministry of Higher Education, Malaysia (MOHE), all members of Faculty of Engineering and Built Environment (FKAB), USIM and our families.

Conflicts of Interest

We declare no conflict of interest that can influence the representation or interpretation of the reported research results. The funders had no role in the design of the study; in the collection, analyses, or interpretation of data; in the writing of the manuscript; or in the decision to publish the results.

References

  1. Food and Agriculture Organization of the United Nations. Water for Sustainable Food and Agriculture: A report produced for the G20 Presidency of Germany. 2017. Available online: https://www.fao.org/3/i7959e/i7959e.pdf (accessed on 10 April 2023).
  2. Food and Agriculture Organization of the United Nations. The State of the World’s Land and Water Resources for Food and Agriculture 2021—Systems at Breaking Point. 2022. Available online: https://www.fao.org/land-water/solaw2021/en/ (accessed on 10 April 2023).
  3. Ciaramella, B.R.; Corinzia, S.A.; Cosentino, S.L.; Testa, G. Phytoremediation of Heavy Metal Contaminated Soils Using Safflower. Agronomy 2022, 12, 2302. [Google Scholar] [CrossRef]
  4. Hernández-Pitalúa, D.; Hernández-Orduña, M.G.; Martínez-Escalante, G.A.; Lagunes-Gómez, I. Influence of Lead (Pb) and Its Relationship with the pH of Water on the Growth of Creole Maize (Zea mays L.). Agriculture 2022, 12, 749. [Google Scholar] [CrossRef]
  5. Hashem, I.A.; Abbas, A.Y.; Abd El, A.E.-N.H.; Salem, H.M.; El-Hosseiny, O.E.; Abdel-Salam, M.A.; Saleem, M.H.; Zhou, W.; Hu, R. Potential of rice straw biochar, sulfur and ryegrass (Lolium perenne L.) in remediating soil contaminated with nickel through irrigation with untreated wastewater. PeerJ 2020, 6, 2020. [Google Scholar] [CrossRef]
  6. Hall, L.W.; Anderson, R.D. A Comparison of Sediment Metal Concentrations as Potential Stressors to Resident Benthic Communities in an Agricultural Waterbody. Agriculture 2022, 12, 1029. [Google Scholar] [CrossRef]
  7. Guo, Y.; Liu, C.; Ye, R.; Duan, Q. Advances on water quality detection by uv-vis spectroscopy. Appl. Sci. 2020, 10, 6874. [Google Scholar] [CrossRef]
  8. Hashimi, M.H.; Hashimi, R.; Ryan, Q. Toxic Effects of Pesticides on Humans, Plants, Animals, Pollinators and Beneficial Organisms. Asian Plant Res. J. 2020, 5, 37–47. [Google Scholar] [CrossRef]
  9. Zhang, C.; Feng, Y.; Liu, Y.; Chang, H.; Li, Z.; Xue, J. Uptake and translocation of organic pollutants in plants: A review. J. Integr. Agric. 2017, 16, 1659–1668. [Google Scholar] [CrossRef] [Green Version]
  10. Chandini, R.; Kumar, R.; Prakash, O. The Impact of Chemical Fertilizers on our Environment and Ecosystem. Res. Trends Environ. Sci. 2019, 4, 69–86. Available online: https://www.researchgate.net/publication/331132826 (accessed on 5 April 2023).
  11. Zainurin, S.N.; Ismail, W.Z.W.; Mahamud, S.N.I.; Ismail, I.; Jamaludin, J.; Ab. Aziz, N.A. Integration of Sensing Framework with A Decision Support System for Monitoring Water Quality in Agriculture. Agriculture 2023, 13, 1000. [Google Scholar] [CrossRef]
  12. Razman, N.A.; Wan Ismail, W.Z.; Razak, M.H.A.; Ismail, I.; Jamaludin, J. Design and analysis of water quality monitoring and filtration system for different types of water in Malaysia. Int. J. Environ. Sci. Technol. 2023, 20, 3789–3800. [Google Scholar] [CrossRef]
  13. Sevda, T. Estimation of groundwater quality using an integration of water quality index, artificial intelligence methods and GIS: Case study, Central Mediterranean Region of Turkey. Appl. Water Sci. 2023, 13, 15. [Google Scholar]
  14. Wan Ismail, W.Z.; Goldys, E.M.; Dawes, J.M. Extended emission wavelength of random dye lasers by exploiting radiative and non-radiative energy transfer. App. Phys. B 2016, 122, 40. [Google Scholar] [CrossRef]
  15. Peteinatos, G.G.; Korsaeth, A.; Berge, T.W.; Gerhards, R. Using optical sensors to identify water deprivation, nitrogen shortage, weed presence and fungal infection in wheat. Agriculture 2016, 6, 24. [Google Scholar] [CrossRef] [Green Version]
  16. Laganovska, K.; Zolotarjovs, A.; Vázquez, M.; Mc Donnell, K.; Liepins, J.; Ben-Yoav, H.; Karitans, V.; Smits, K. Portable low-cost open-source wireless spectrophotometer for fast and reliable measurements. HardwareX 2020, 7, e00108. [Google Scholar] [CrossRef]
  17. Zhang, H.; Zhang, L.; Wang, S.; Zhang, L.S. Online water quality monitoring based on UV–Vis spectrometry and artificial neural networks in a river confluence near Sherfield-on-Loddon. Environ. Monit. Assess. 2022, 194, 9. [Google Scholar] [CrossRef]
  18. Kamil, N.A.I.M.; Nor’aini, Z.S.; Wan Ismail, W.Z.; Balakrishnan, S.R.; Juliza Jamaludin, J.; Ismail, I. Investigating the Quality of Milk using Spectrometry Technique and Scattering Theory. Eng. Technol. Appl. Sci. Res. 2021, 11, 7111–7117. [Google Scholar] [CrossRef]
  19. Kamil, N.A.I.M.; Ismail, W.Z.; Wan Ismail, I.; Jamaludin, J.; Hanasil, N.S.; Ibrahim, R.K.R. Analysis of Milk from Different Sources Based on Light Propagation and Random Laser Properties. Photonics 2021, 8, 486. [Google Scholar] [CrossRef]
  20. Rateni, G.; Dario, P.; Cavallo, F. Smartphone-Based Food Diagnostic Technologies: A Review. Sensors 2017, 17, 1453. [Google Scholar] [CrossRef]
  21. Transportation, L.F.S. Chapter 12 Linear Fiber-Optic Signal Transportation. In Modern Cable Television Technology, 2nd ed.; Elsevier: Amsterdam, The Netherlands, 2004; pp. 509–557. [Google Scholar]
  22. Listiaji, P.; Suparta, G.B. Low-cost imaging spectrophotometer system for absorbance measurement. J. Phys. Conf. Ser. 2020, 1567, 042093. [Google Scholar] [CrossRef]
  23. Wilson, K.; Walker, J. Principles and Techniques of Biochemistry and Molecular Biology, 7th ed.; John Wiley & Sons, Ltd.: Hoboken, NJ, USA, 2011; Volume 39. [Google Scholar]
  24. Agilent Technologies. The Basics of UV-Vis Spectrophotometry A Primer. 2021. Available online: https://www.agilent.com/cs/library/primers/public/primer-uv-vis-basics-5980-1397en-agilent.pdf (accessed on 10 April 2023).
  25. Tzanetou, E.N.; Karasali, H. A Comprehensive Review of Organochlorine Pesticide Monitoring in Agricultural Soils: The Silent Threat of a Conventional Agricultural Past. Agriculture 2022, 12, 728. [Google Scholar] [CrossRef]
  26. Hamid, N.; Suhaimi, S.; Othman, M.Z.; Wan Ismail, W.Z. A Review on Thermal Evaporation Method to Synthesis Zinc Oxide as Photocatalytic Material. Nano Hybrids Compos. 2021, 31, 55–63. [Google Scholar] [CrossRef]
  27. Mlangeni, A.T.; Raab, A.; Kumambala, P.; Monjerezi, M.; Matumba, L.; Feldmann, J. Evaluation of Metal (loids) Concentrations in Soils of Selected Rice Paddy Fields in Malawi. Agronomy 2022, 12, 2349. [Google Scholar] [CrossRef]
  28. Cooper, M.; Michael, K. Chapter 2: Spectroscopy: How we know what we know about the structure of matter in OCLUE. In Organic Chemistry, Life, the Universe & Everything; Michigan State University Libraries: East Lansing, MI, USA, 2020; ISBN 978-1-62610-102-9. [Google Scholar]
  29. The Royal Society of Chemistry. Ultraviolet/visible spectroscopy. In Modern Chemical Techniques; The Royal Society of Chemistry: London, UK, 2015; pp. 92–115. [Google Scholar]
  30. Rohit, J.V.; Kailasa, S.K. Cyclen dithiocarbamate-functionalized silver nanoparticles as a probe for colorimetric sensing of thiram and paraquat pesticides via host–guest chemistry. J. Nanoparticle Res. 2014, 16, 2585. [Google Scholar] [CrossRef]
  31. Sohbatzadeh, F.; Bagheri, H.; Safari, R. Effect of electrical discharge in water on concentration of nitrate solution. Chin. Phys. B 2017, 26, 025101. [Google Scholar] [CrossRef]
  32. Keen, O.S.; Love, N.G.; Linden, K.G. Nitrate Photochemistry in the Context of Water Reclamation. In Water Reclamation and Sustainability; Elsevier: Amsterdam, The Netherlands, 2014; pp. 229–246. [Google Scholar] [CrossRef]
  33. Yeshno, E.; Arnon, S.; Dahan, O. Real-time monitoring of nitrate in soils as a key for optimization of agricultural productivity and prevention of groundwater pollution. Hydrol. Earth Syst. Sci. 2019, 23, 3997–4010. [Google Scholar] [CrossRef] [Green Version]
  34. Manyasree, D.; Kiranmayi, P.; Kolli, V.R. Characterization and antibacterial activity of zno nanoparticles synthesized by co precipitation method. Int. J. Appl. Pharm. 2018, 10, 224–228. [Google Scholar] [CrossRef] [Green Version]
  35. Zak, A.K.; Razali, R.; Majid, W.H.A.; Darroudi, M. Synthesis and characterization of a narrow size distribution of zinc oxide nanoparticles. Int. J. Nanomed. 2011, 6, 1399–1403. [Google Scholar] [CrossRef] [Green Version]
  36. Schaller, C. Structure & Reactivity in Organic, Biological and Inorganic Chemistry; College Saint Benedict/Saint John’s University: Queens, NY, USA, 2014. [Google Scholar]
Figure 1. ESP32 spectrometer. (a) Front view of the system; (b) side view of the system; (c) enclosure view of the system.
Agriculture 13 01202 g001
Figure 2. Flow chart of the testing method using ESP32-based spectrometer.
Agriculture 13 01202 g002
Figure 3. Flow chart of the testing method using the Ocean Optics spectrometer.
Agriculture 13 01202 g003
Figure 4. Experimental setup using Ocean Optics spectrometer.
Agriculture 13 01202 g004
Figure 5. Real-time monitoring and sensing by a mobile phone. It value refers to light transmittance and Absorb value refers to light absorbance.
Agriculture 13 01202 g005
Figure 6. Real-time monitoring and sensing by a computer. Servo 1 to Servo 4 refers to servo motor that can be turned on or off to change the region of the spectrum wavelength.
Agriculture 13 01202 g006
Figure 7. Light absorbance output (wavelength range from ~300 nm to 700 nm) from ESP32-based spectrometer for (a) pesticide, (b) ammonium nitrate, (c) zinc oxide, (d) Reservoir I and (e) Reservoir II. The value is averaged from 10 measurements, and there is a slight variation (standard error) in the measurement. The standard error is shown by the black arrow.
Agriculture 13 01202 g007
Figure 8. Light absorbance output (wavelength range from 300 nm to 700 nm) from Ocean Optic spectrometer for (a) pesticide, (b) ammonium nitrate, (c) zinc oxide, (d) Reservoir I and (e) Reservoir II. The value is averaged from 10 measurements.
Agriculture 13 01202 g008
Table 1. System comparison between ESP32-based spectrometer and Ocean Optic spectrometer.
ESP32-Based SpectrometerOcean Optic Spectrometer
PortableNon-portable
On-site real-time monitoringLab based monitoring
Low costHigh cost
Less accurate More accurate
Monitor and display result via mobile phone and computerMonitor and display via computer
Non-invasiveNon-invasive
Disclaimer/Publisher’s Note: The statements, opinions and data contained in all publications are solely those of the individual author(s) and contributor(s) and not of MDPI and/or the editor(s). MDPI and/or the editor(s) disclaim responsibility for any injury to people or property resulting from any ideas, methods, instructions or products referred to in the content.