

ResViT-Rice: A Deep Learning Model Combining Residual Module and Transformer Encoder for Accurate Detection of Rice Diseases


Abstract
:1. Introduction
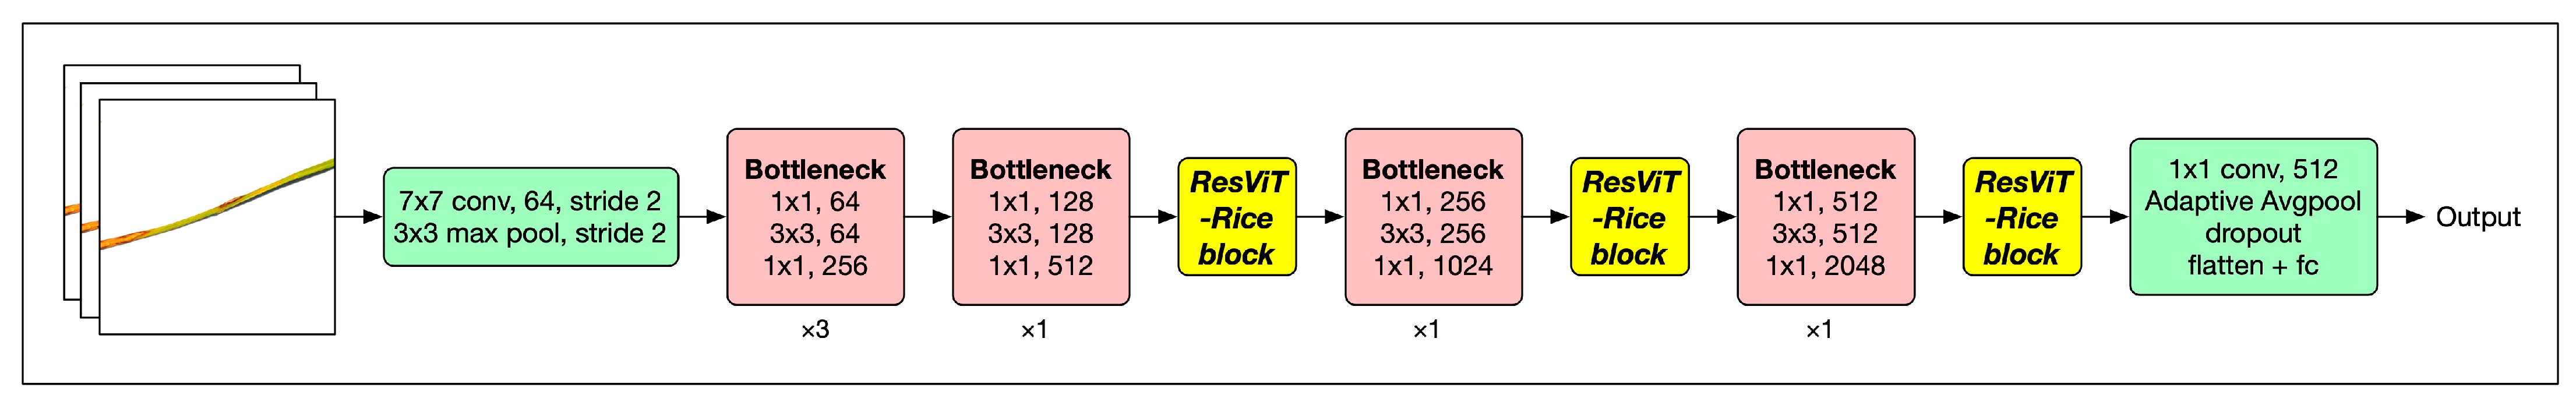
- The incorporation of the ResNet [19] model as the backbone network of our structure enabled effective extraction of image features. The employment of residual blocks paved the way for efficient information transfer, mitigating the gradient vanishing issue and thereby enhancing the stability during the training phase, all the while reducing the overall parameters;
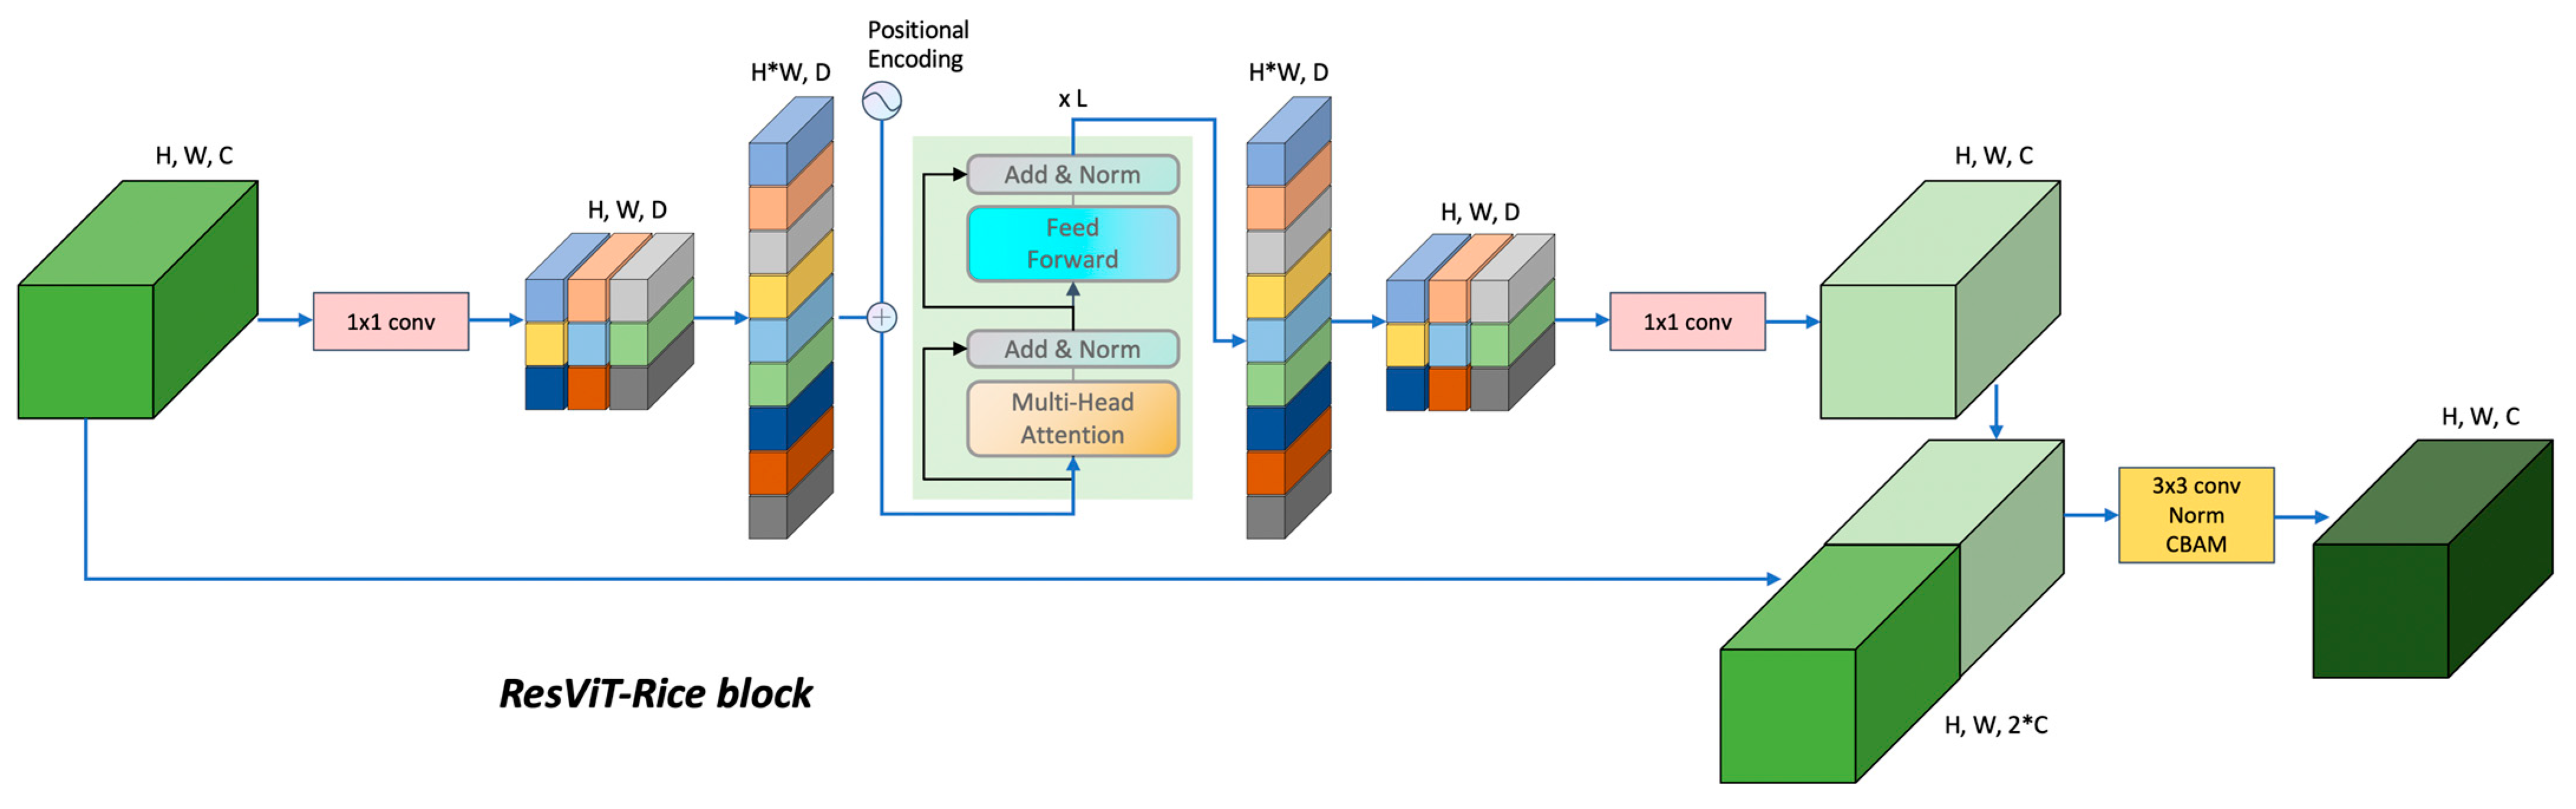
- We incorporated the transformer architecture into our model, aiming to leverage its powerful self-attention mechanism, which demonstrated exceptional performance in image-processing tasks. Our approach adopted a hybrid structure that combined CNNs and transformer encoder. The CNN component provided spatial inductive bias and accelerated network convergence, thereby enhancing the stability of the training process;
- The convolutional block attention module (CBAM) attention mechanism was integrated into the ResViT-Rice block, allowing the model to adjust adaptively to the significance of different regions within the input feature map. This was especially beneficial for rice disease-detection tasks where disease localization within the image might be random. By deploying attention mechanisms, we ensured that the model prioritized disease-afflicted areas, thereby boosting the model’s accuracy.
2. Materials and Methods
2.1. Data Source
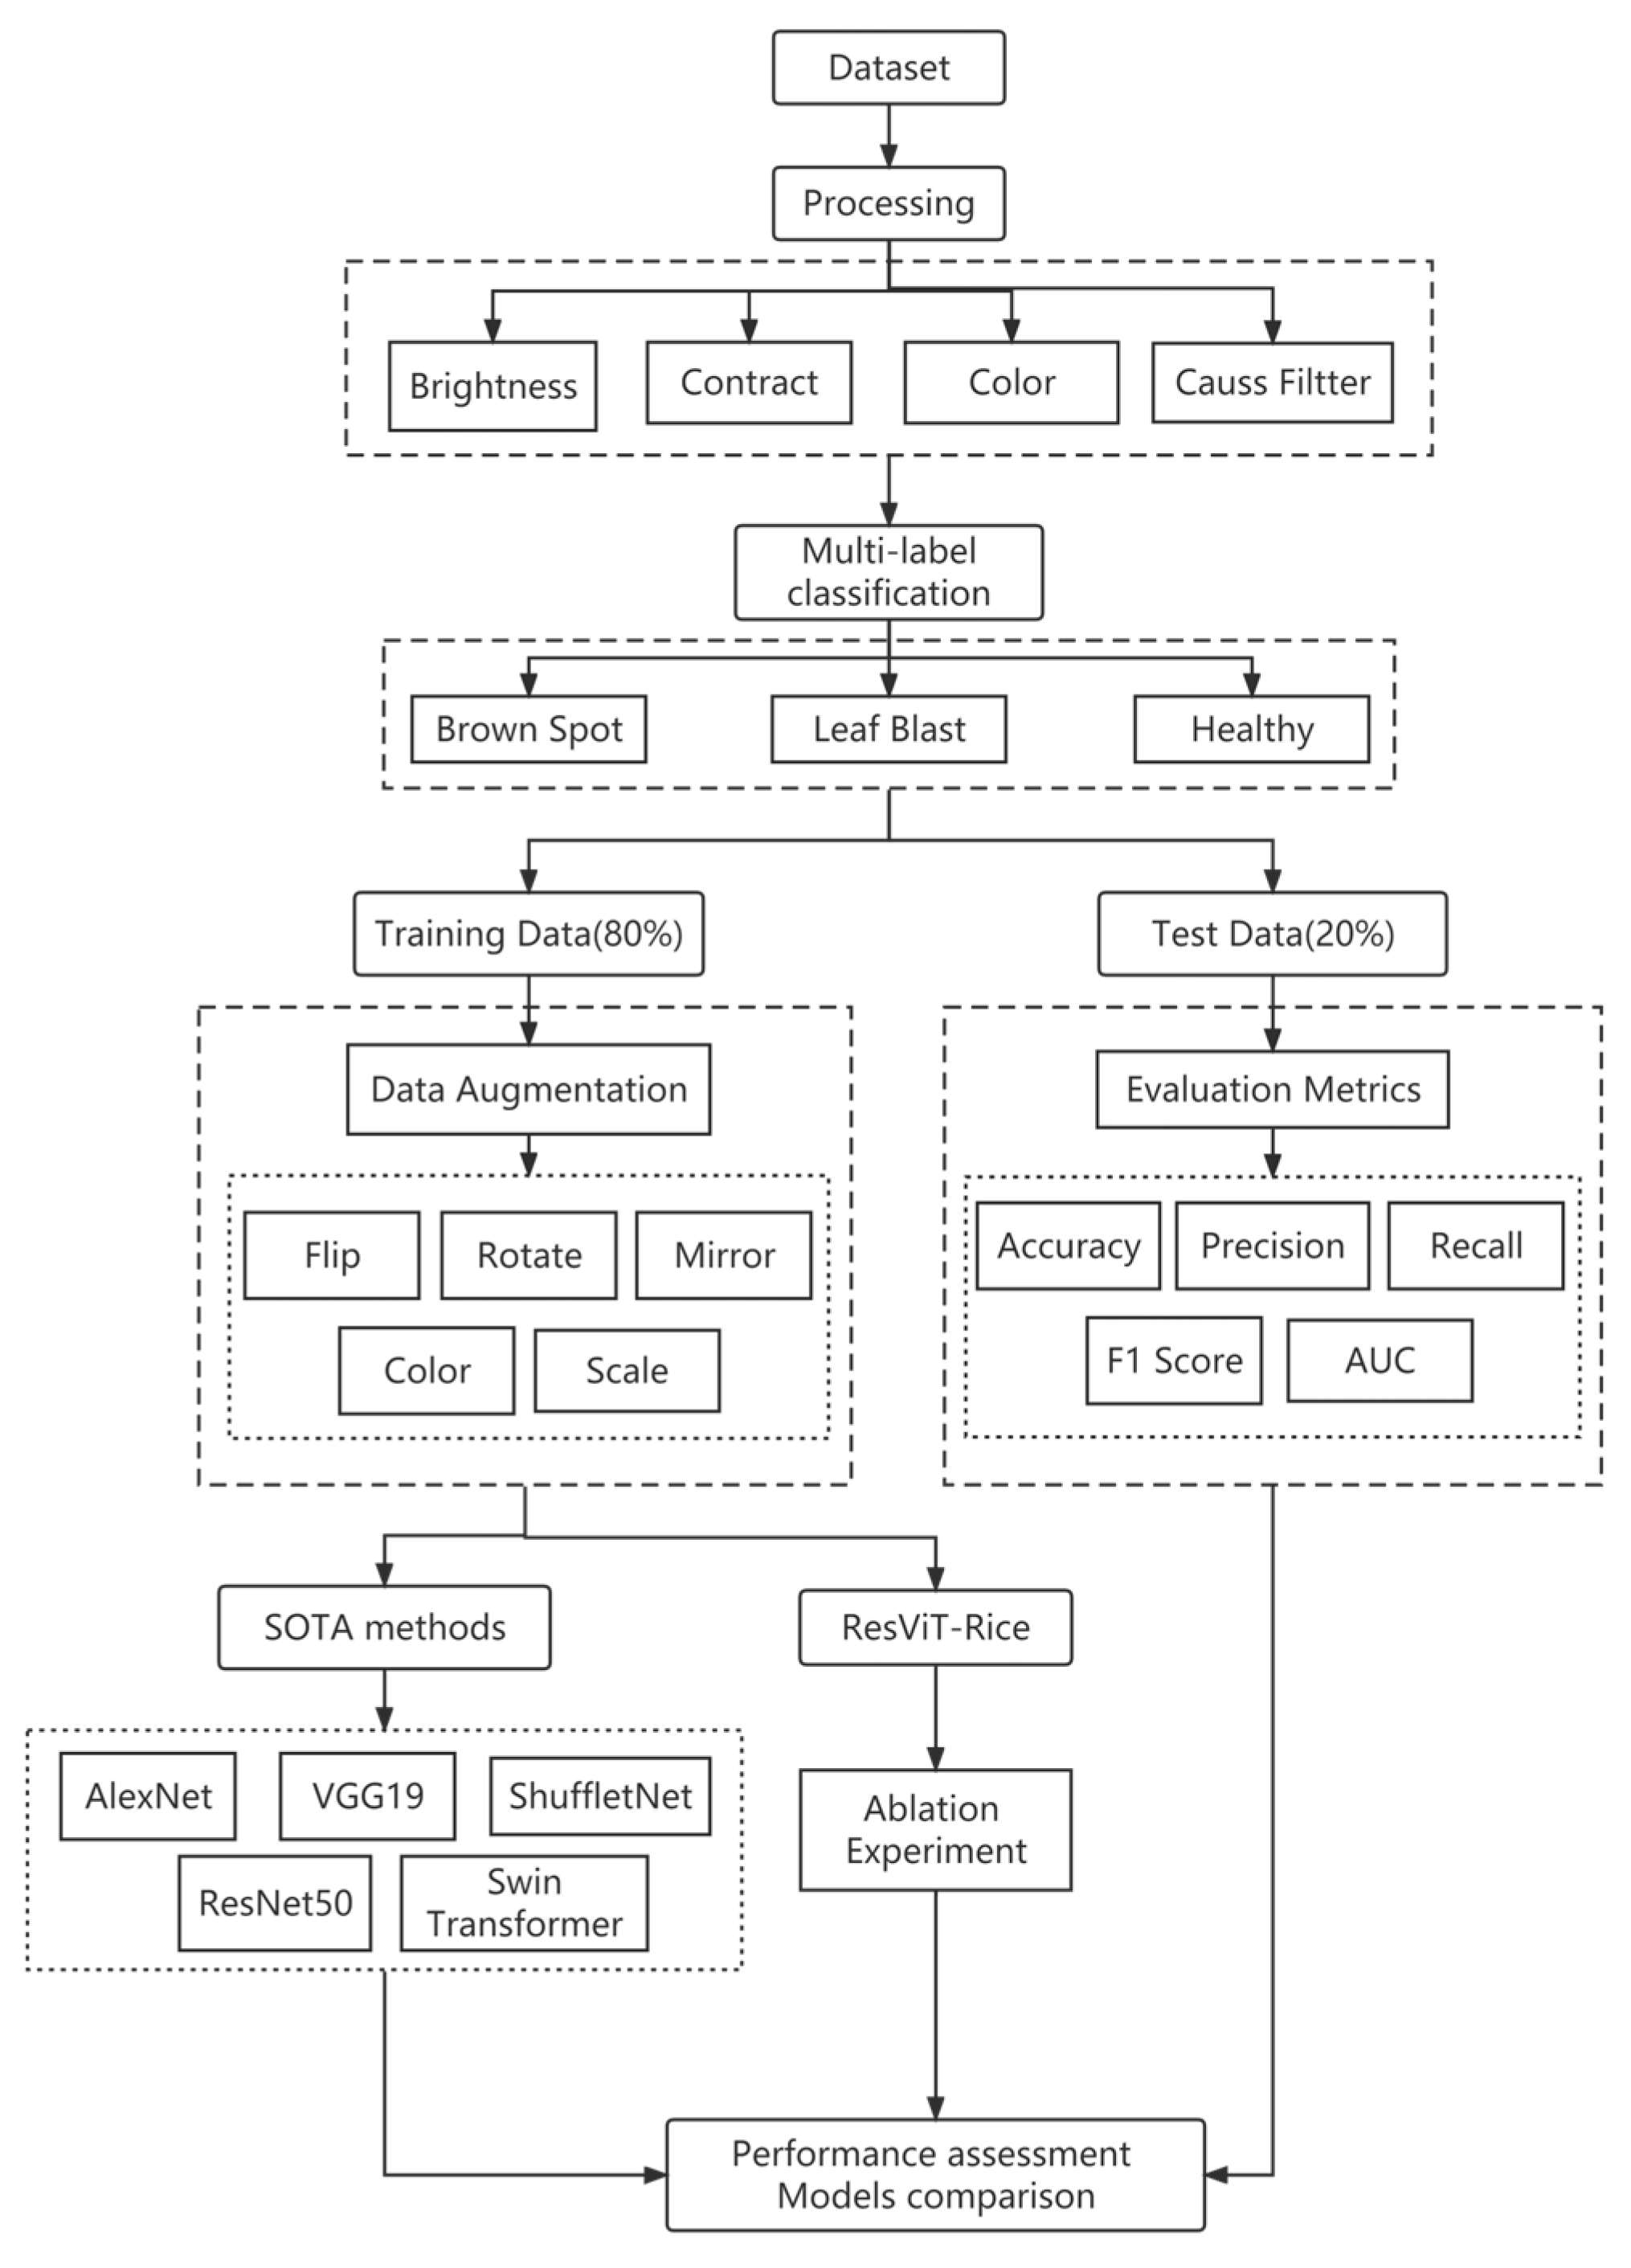
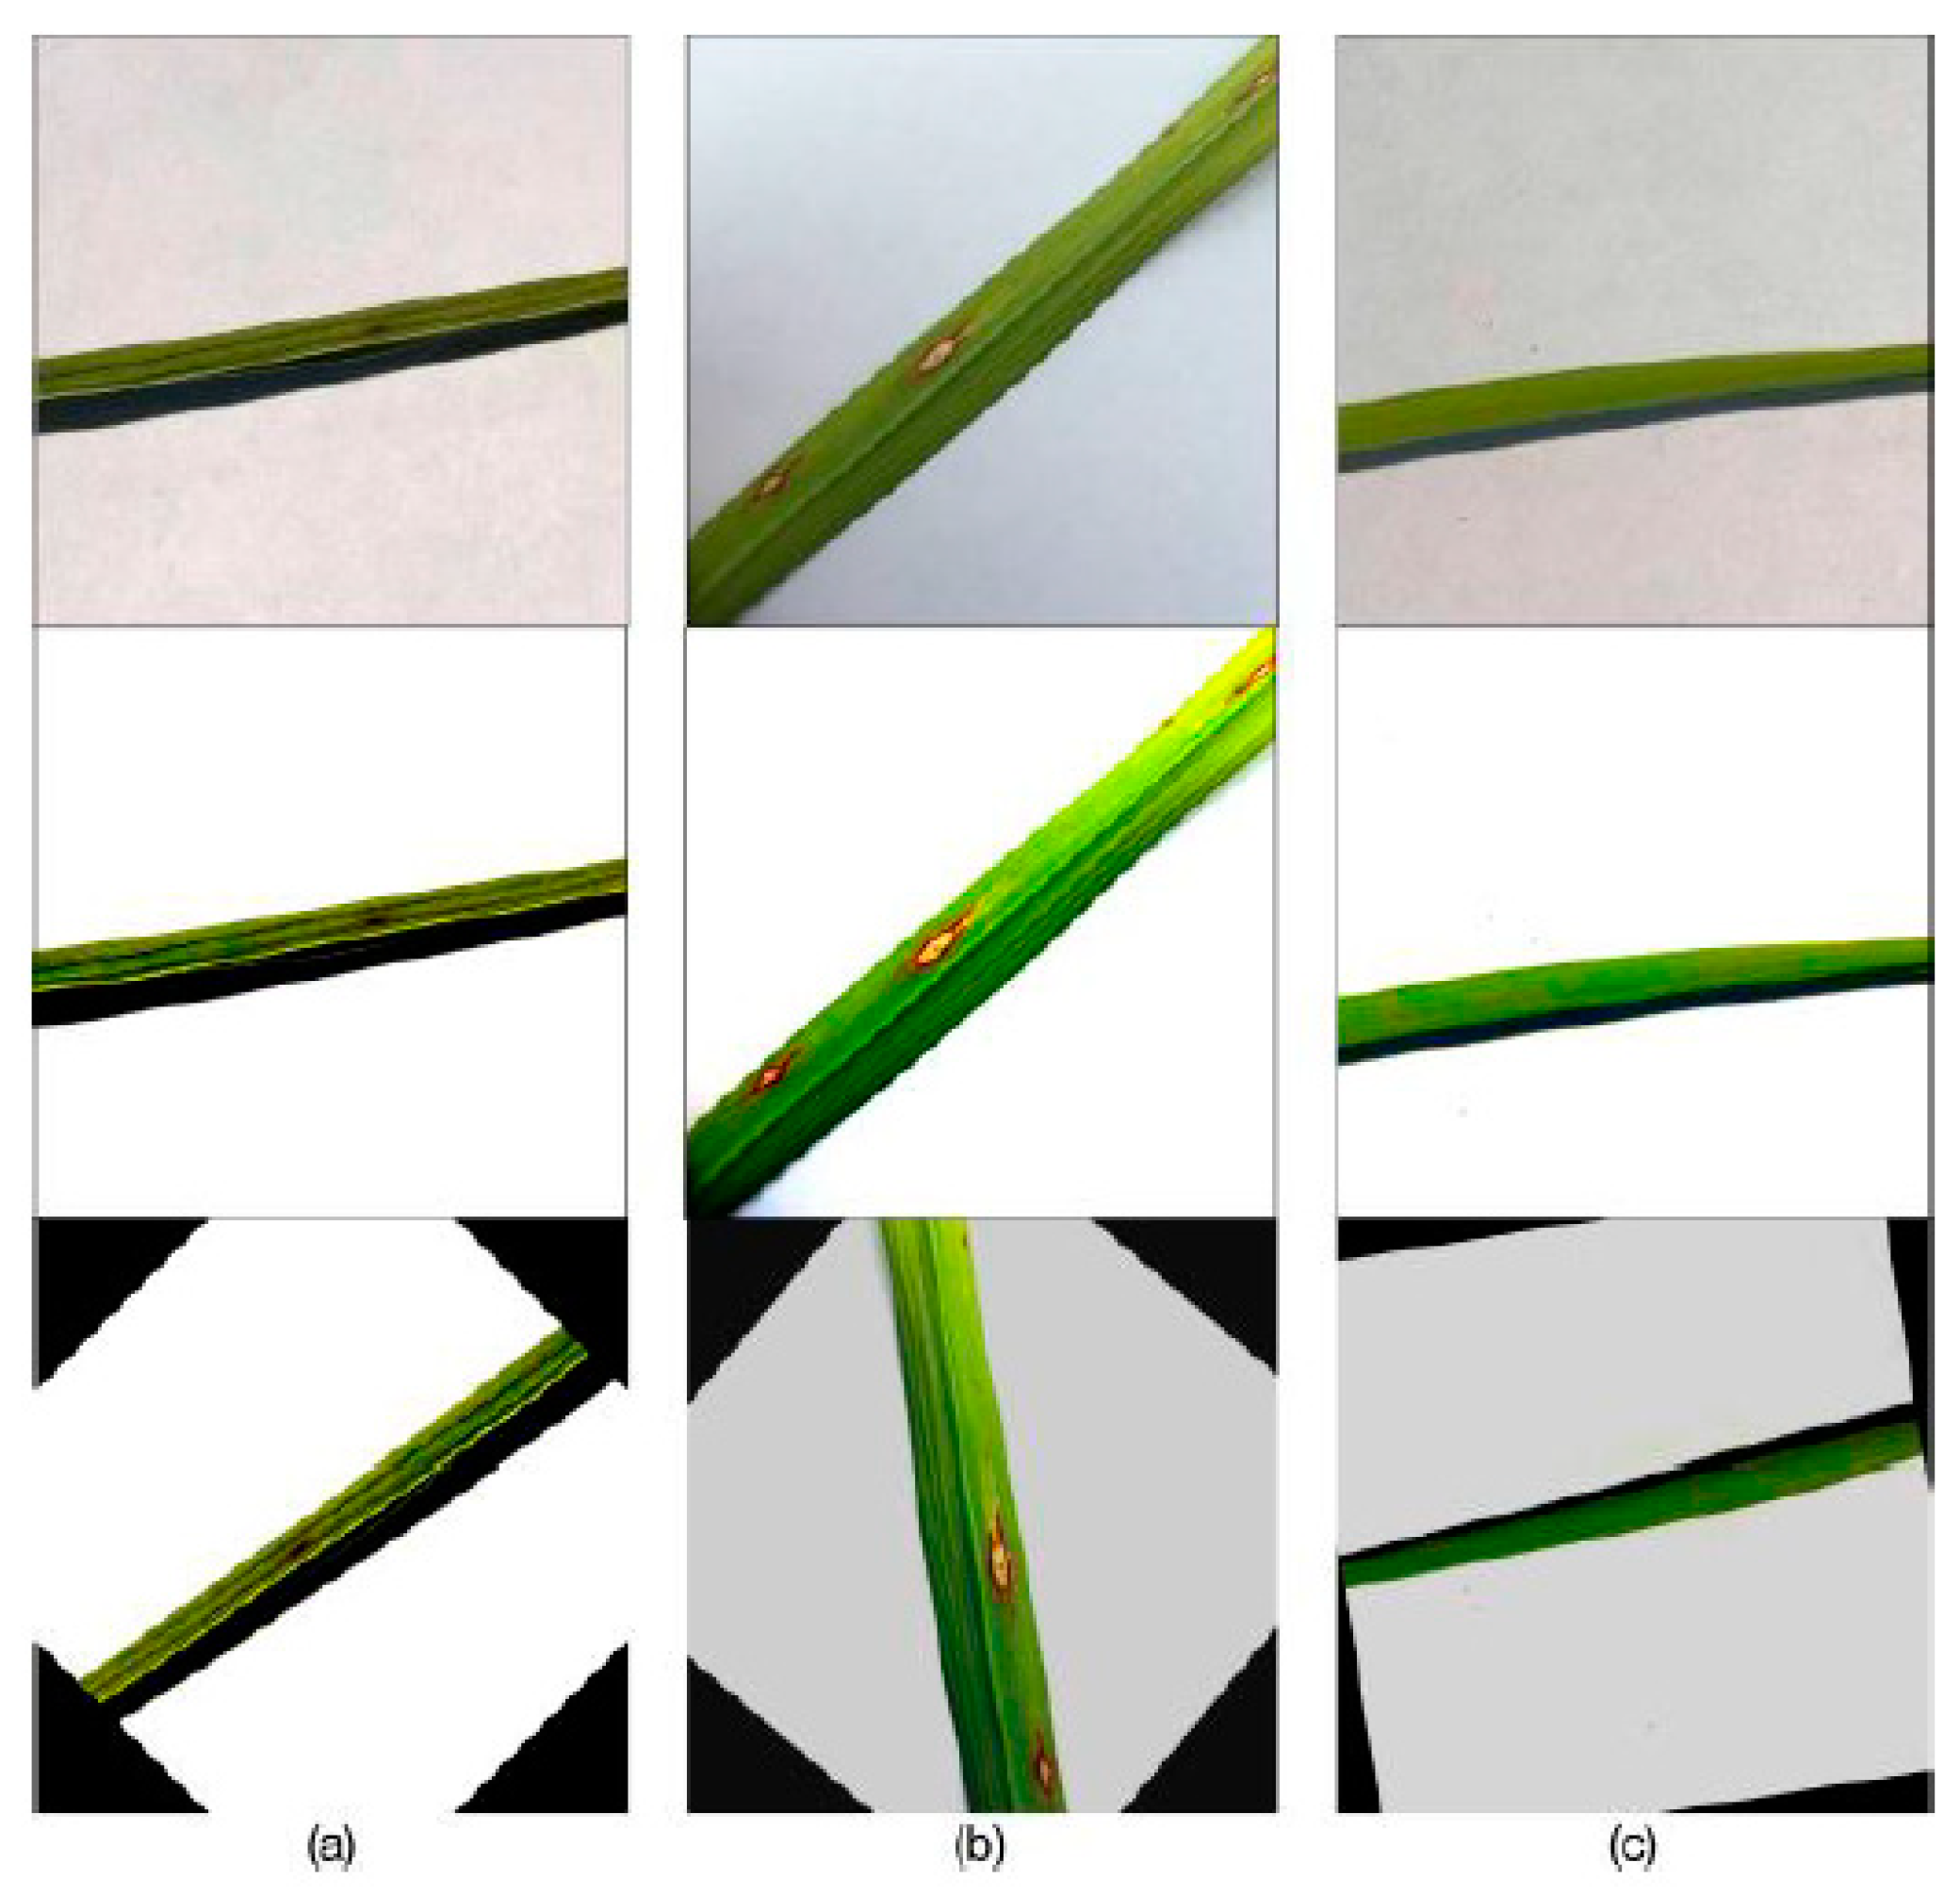
2.2. Data Preprocessing
2.3. Proposal of ResViT-Rice
2.4. Other Mainstream Models
2.5. Model Evaluation
2.6. Ablation Experiments
3. Result
3.1. Experimental Setup
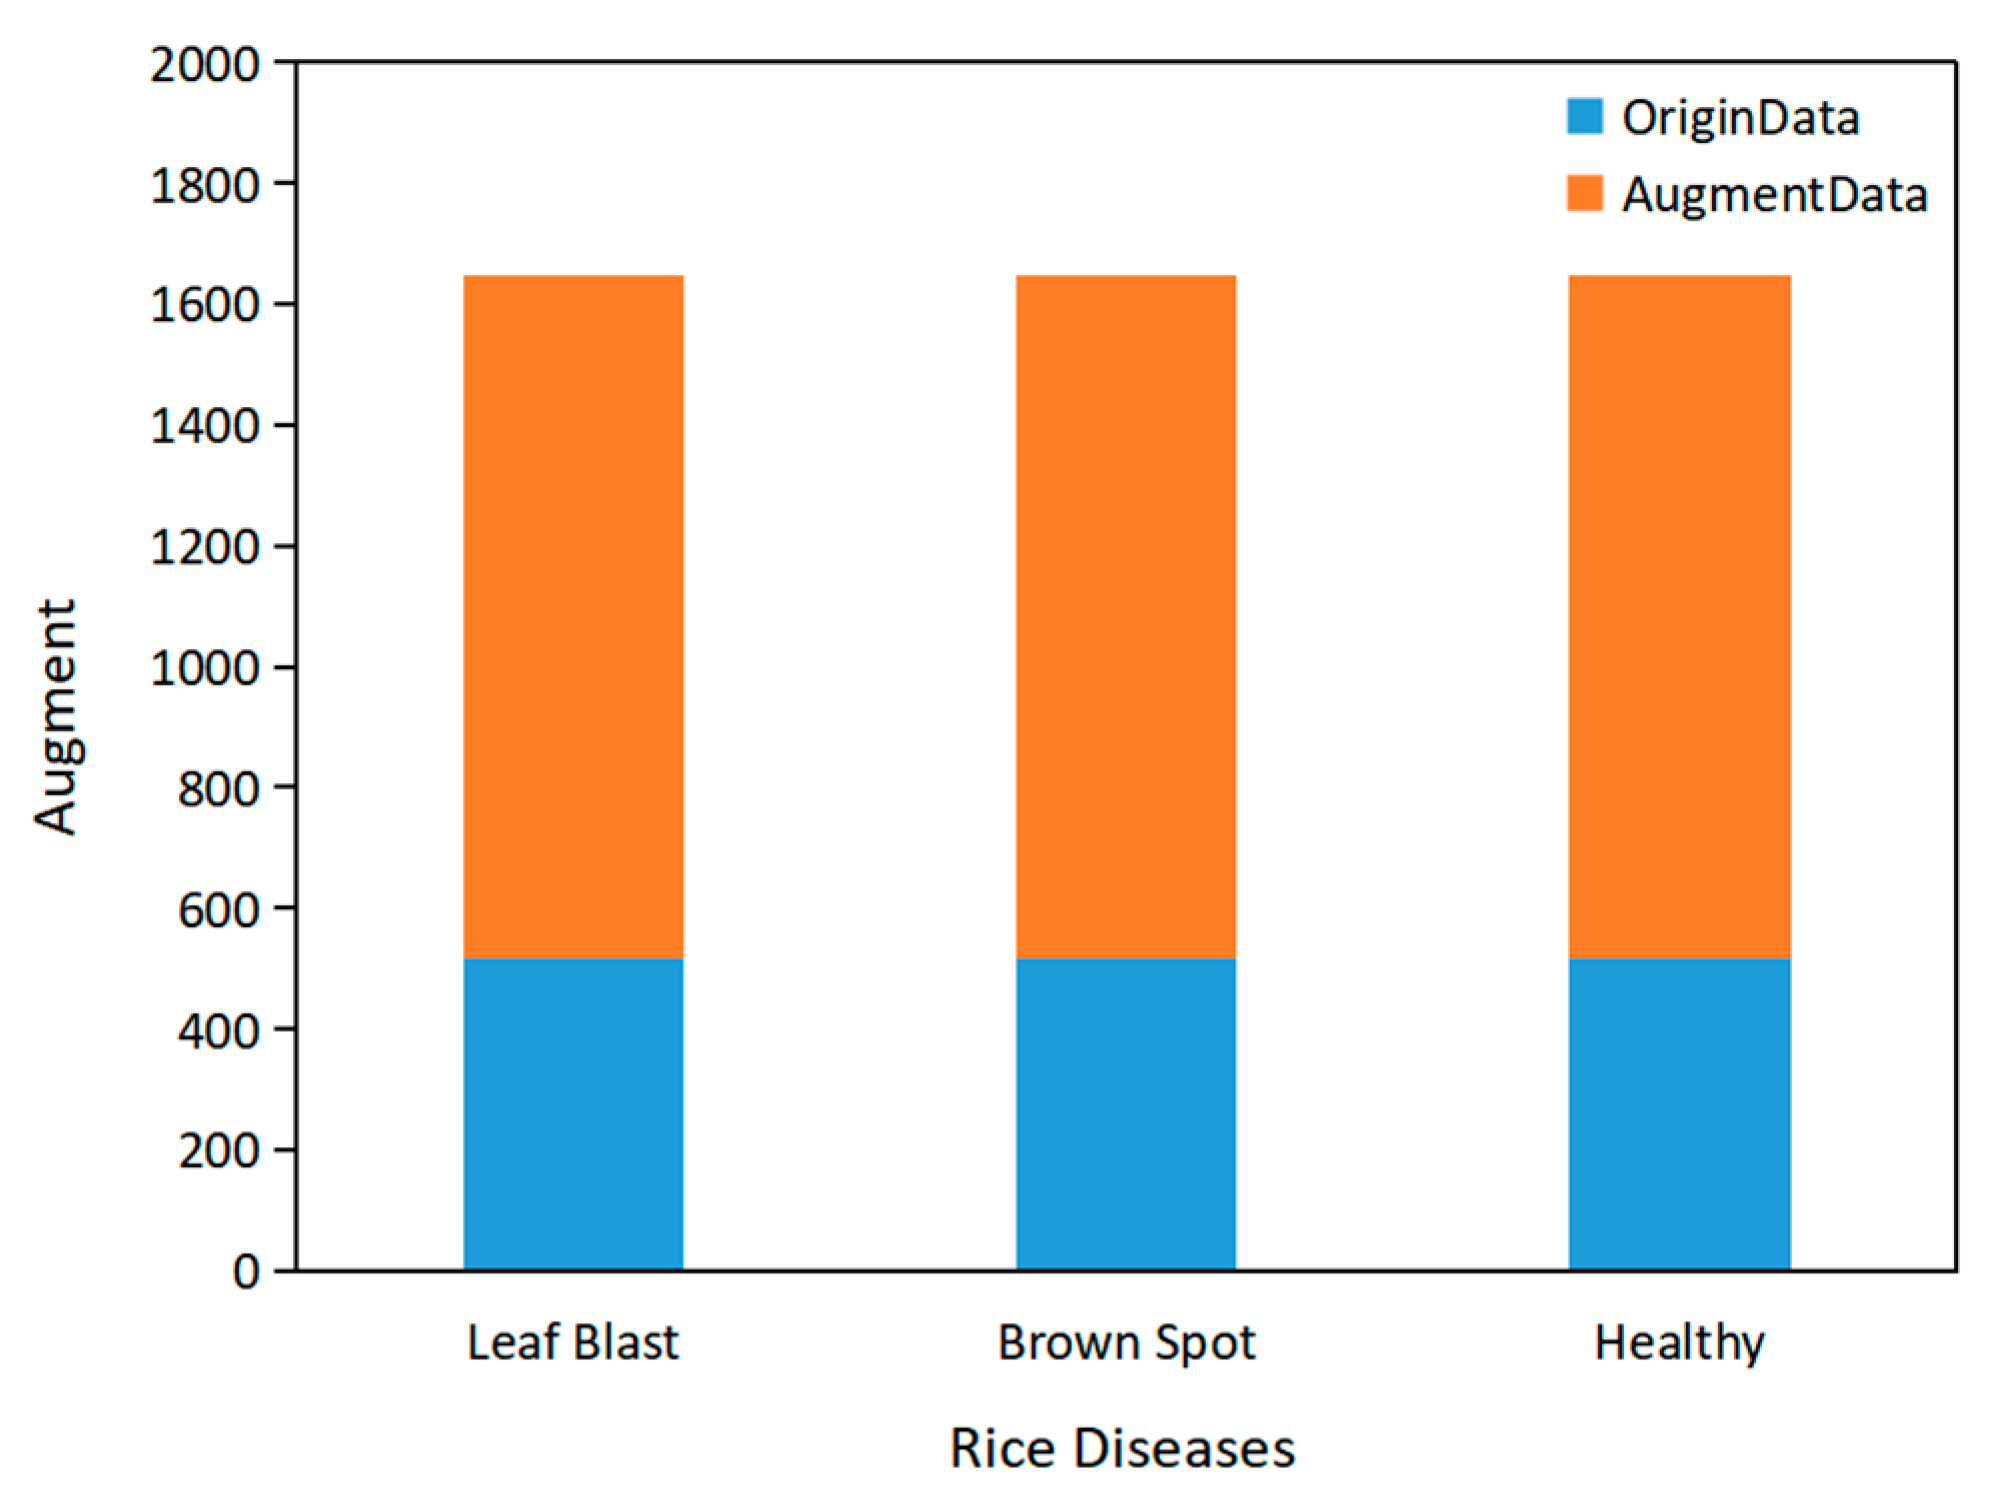
3.2. Results of Data Preprocessing
3.3. Results of ResViT-Rice
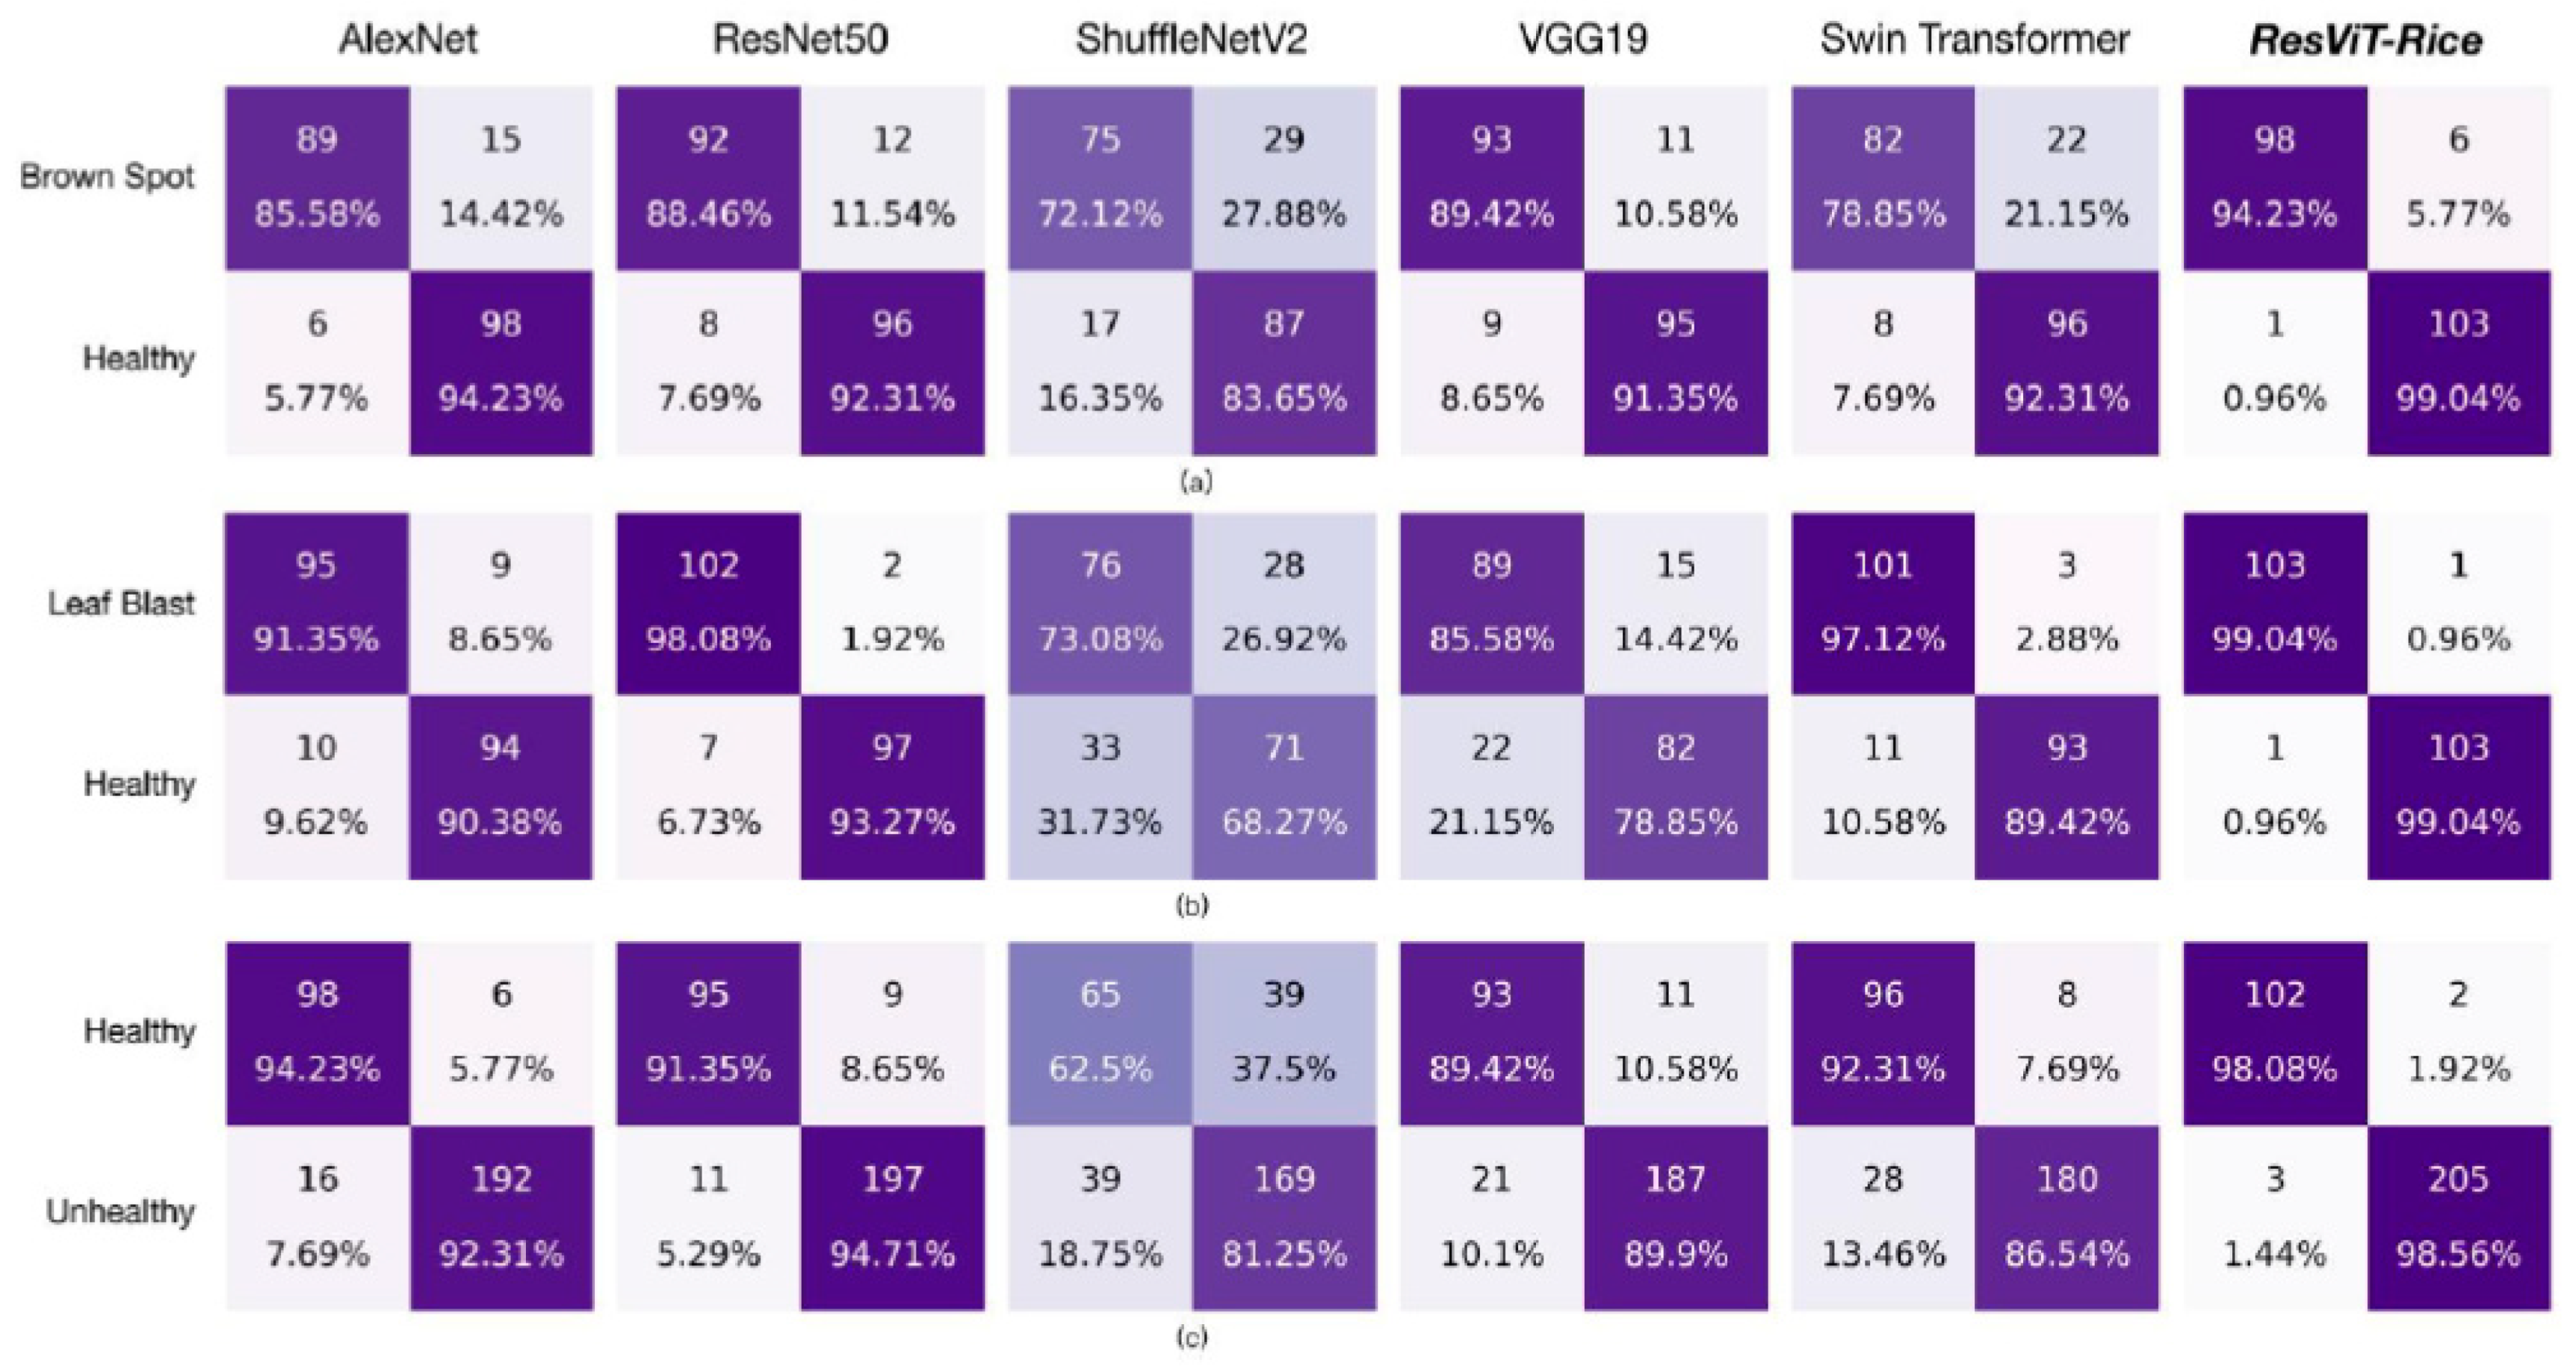
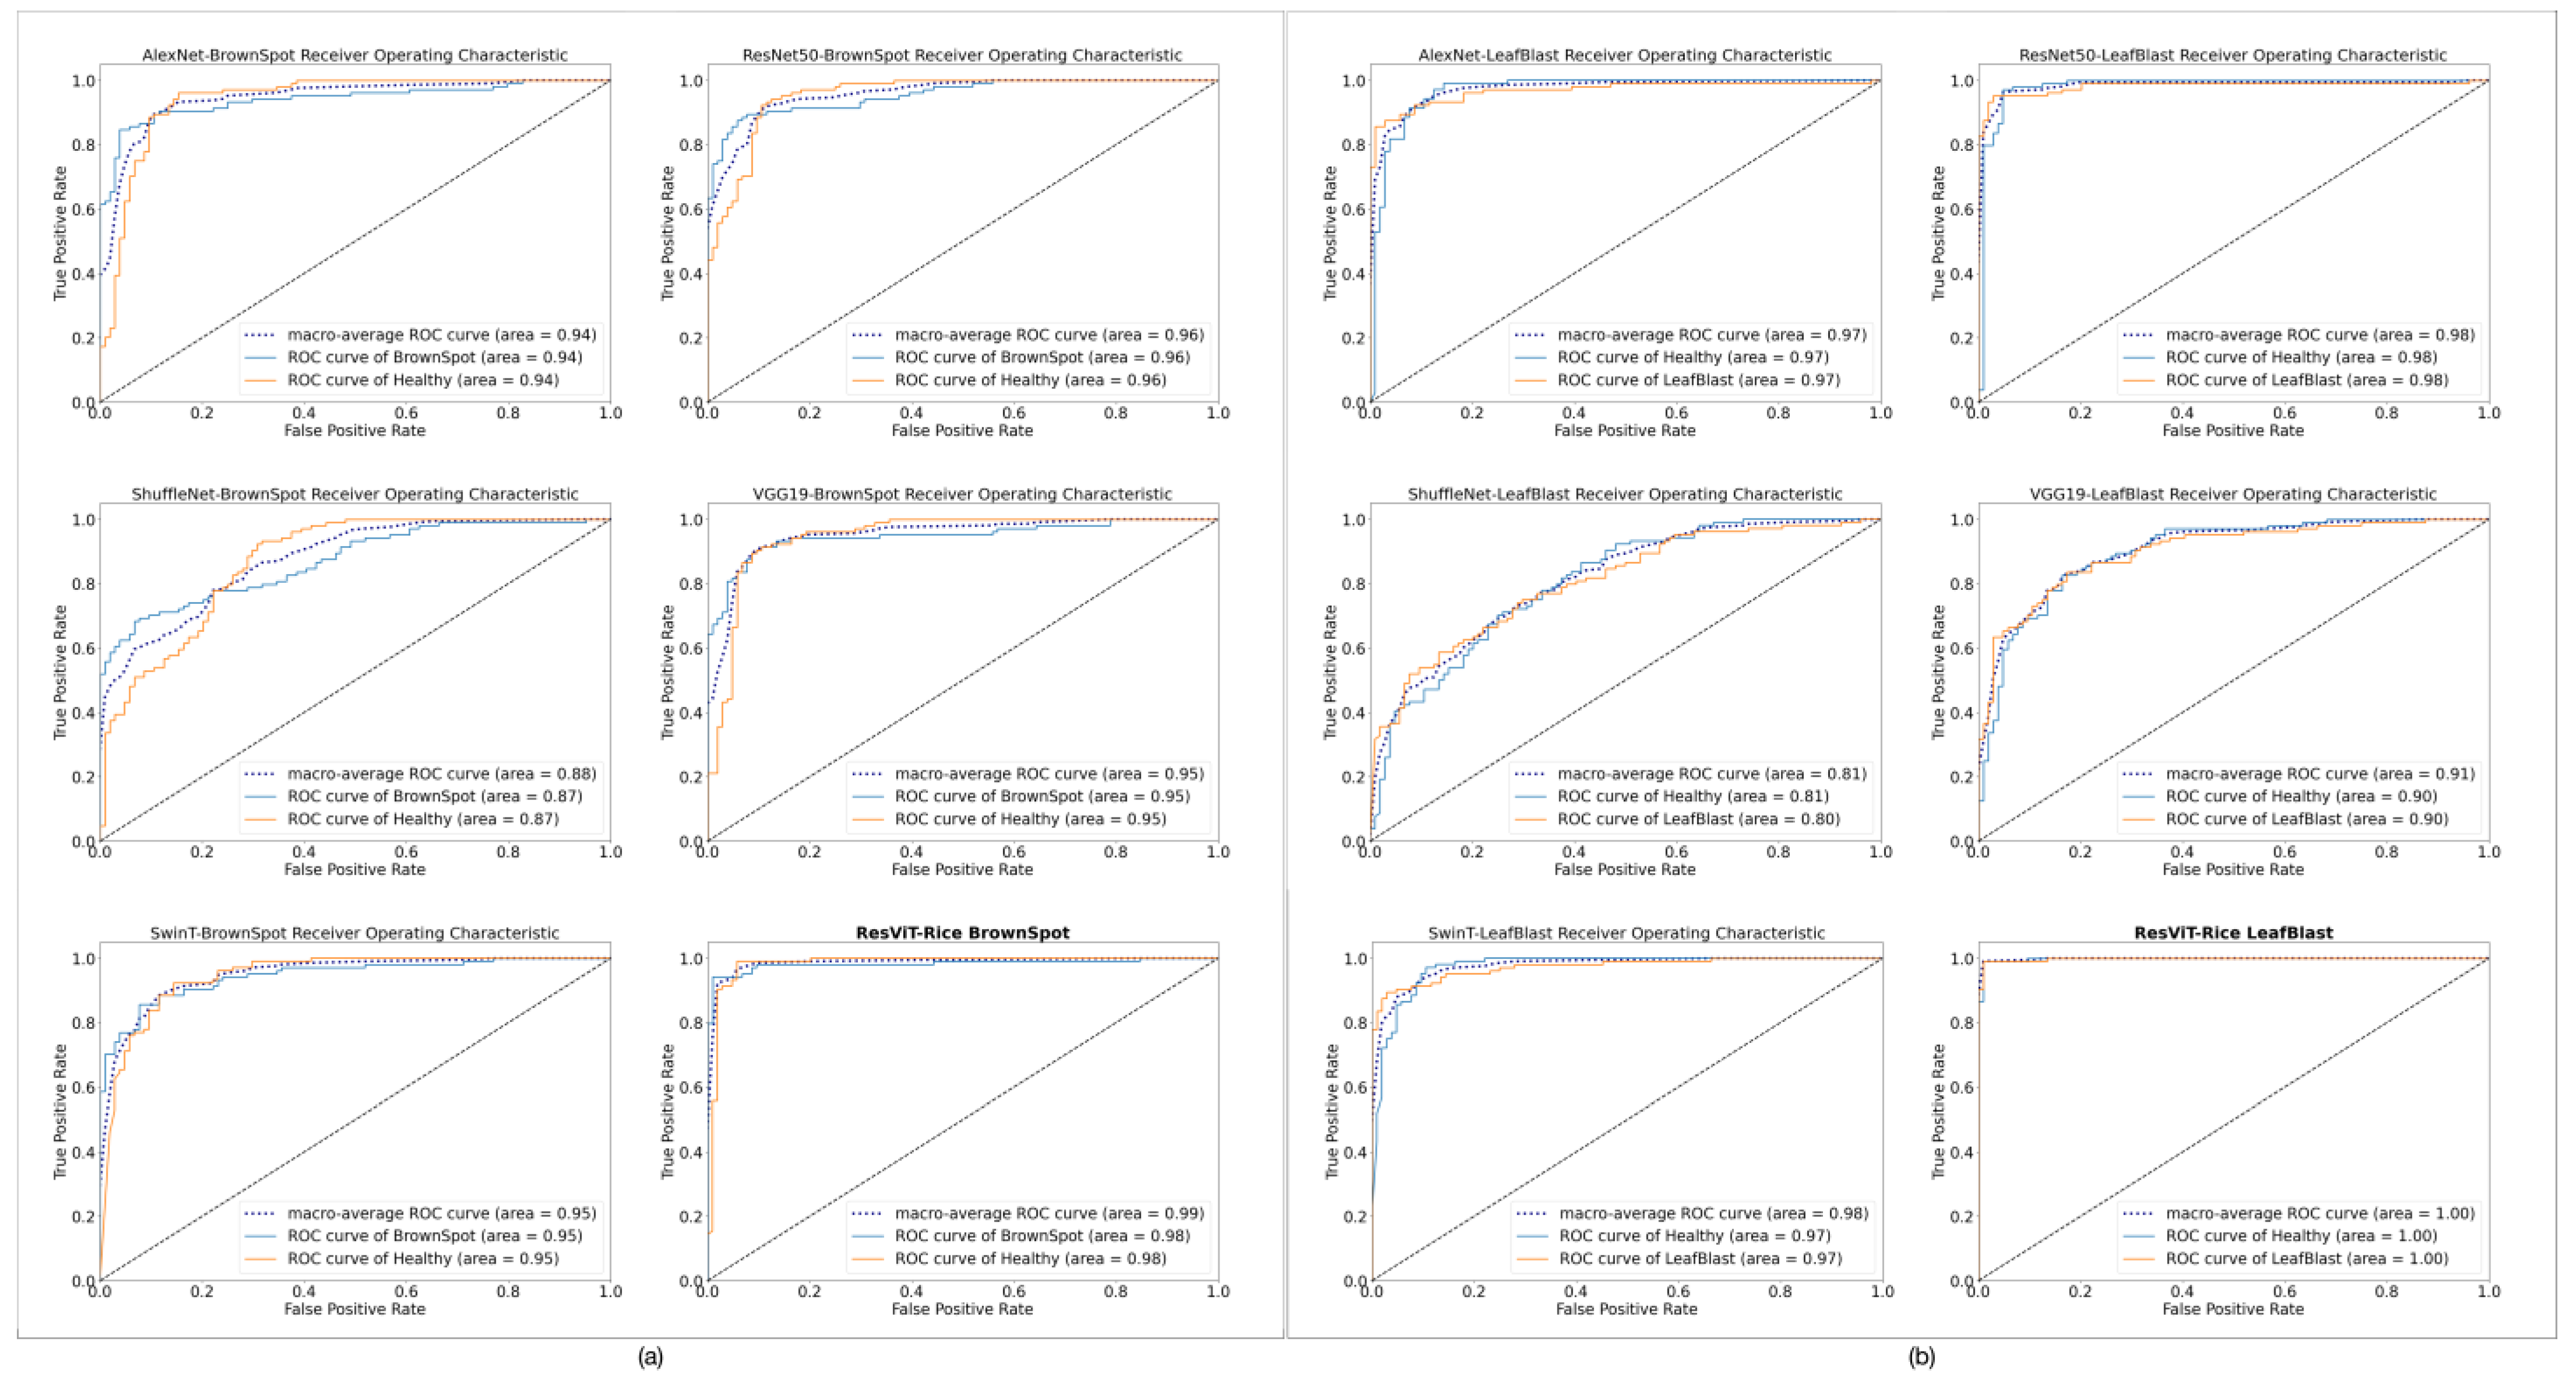
3.4. Results of SOTA Models
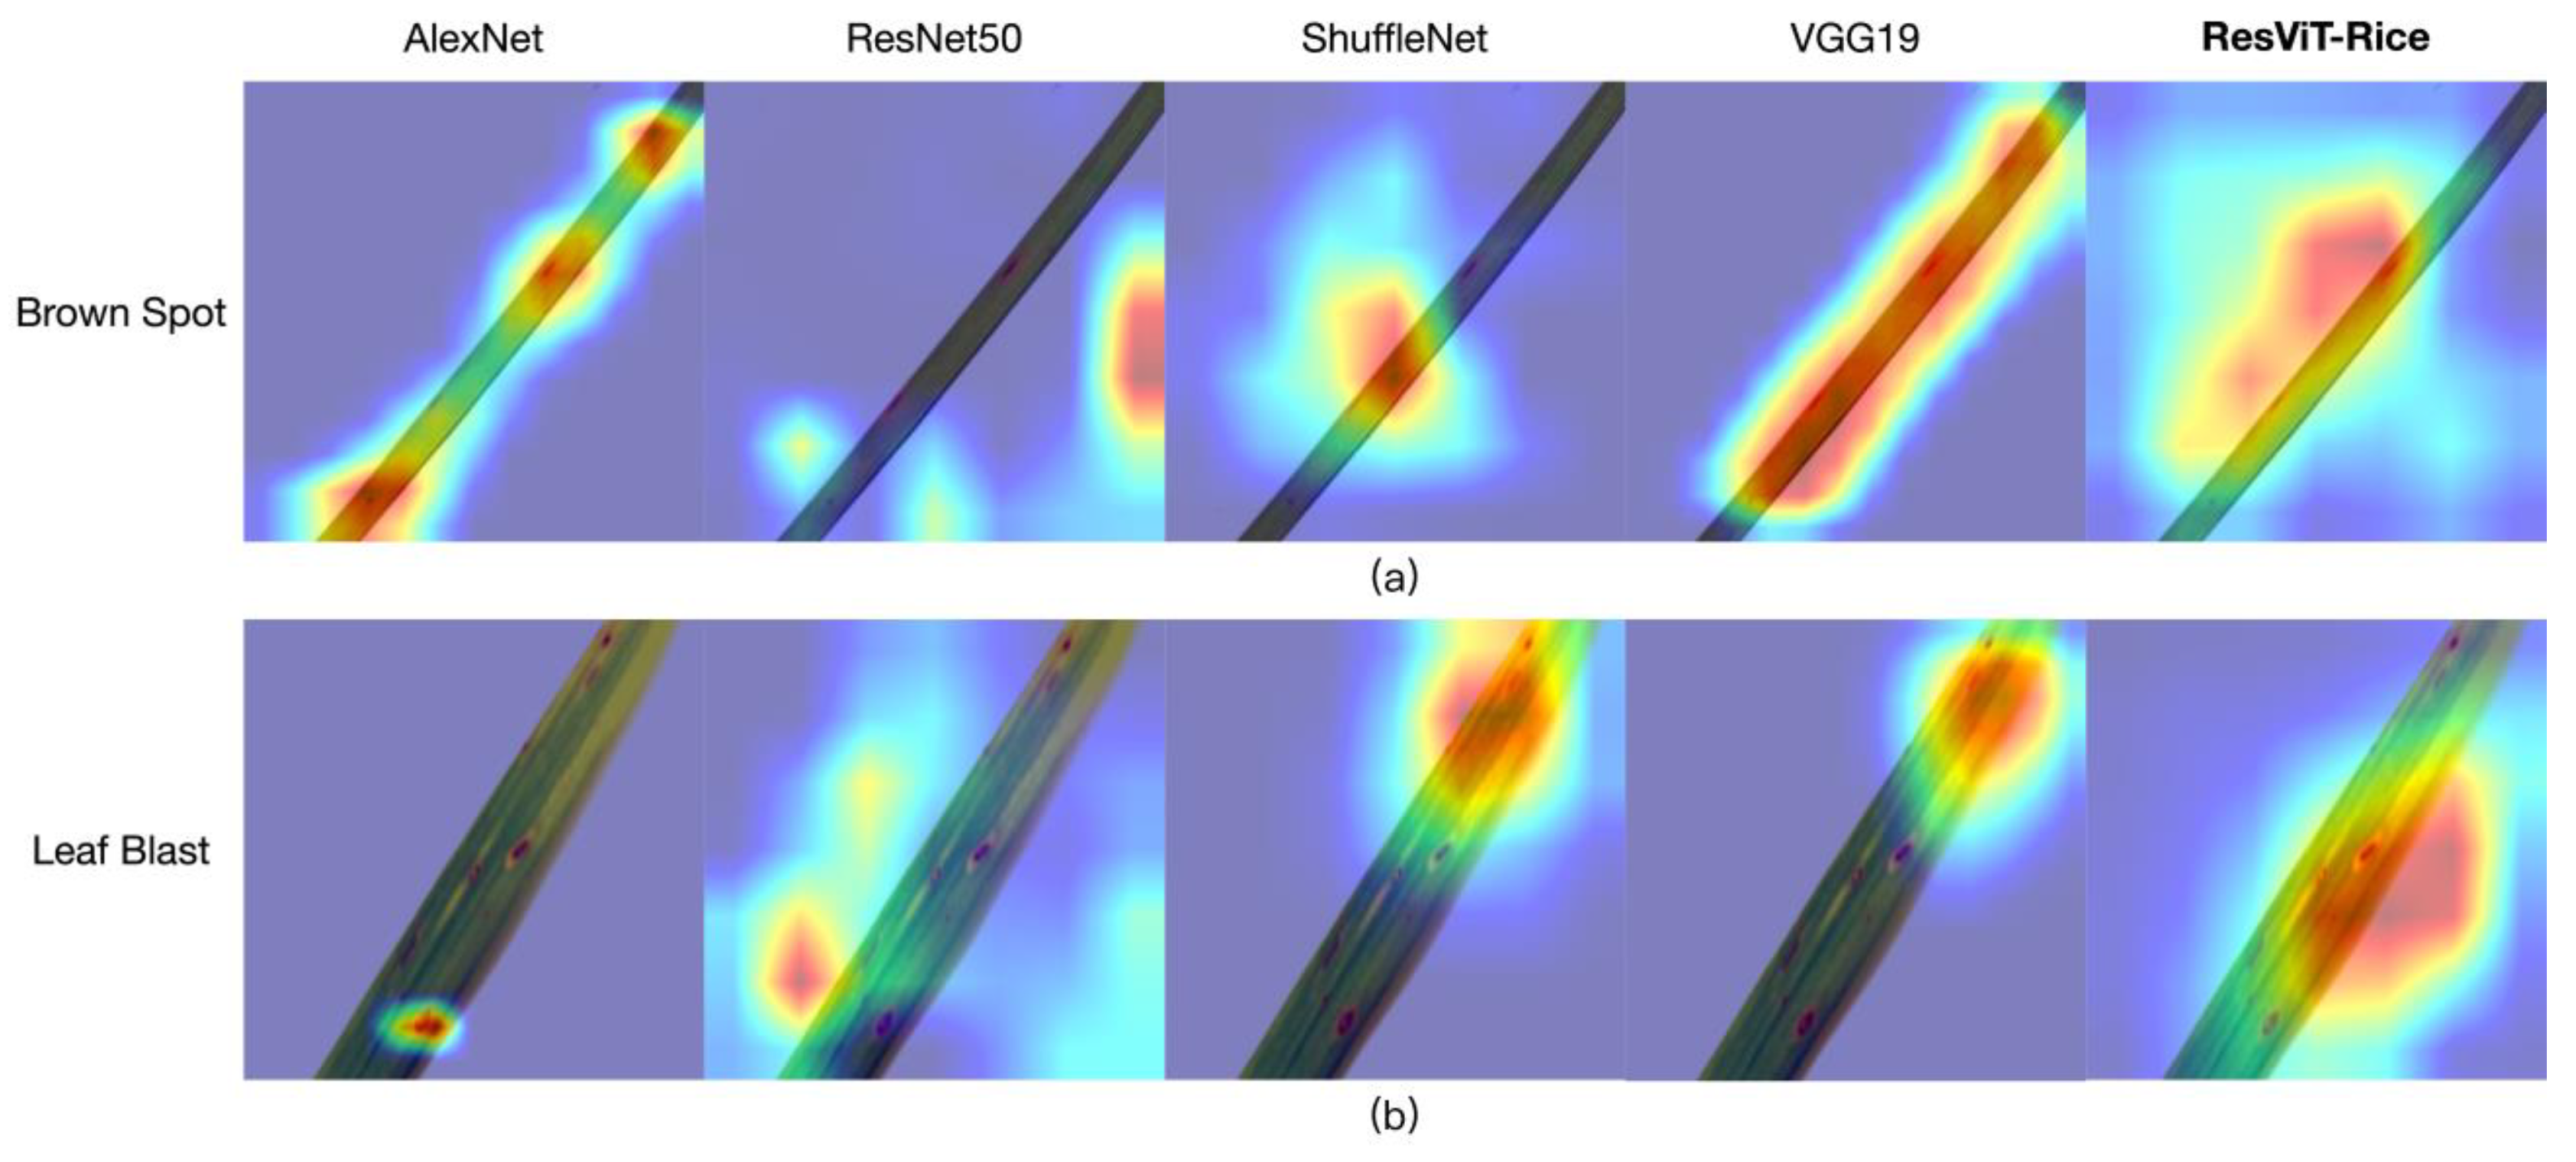
3.5. Feature-Visualization Process
3.6. Results of Ablation Experiments
4. Discussion
4.1. Advantages of ResViT-Rice
- ResViT-Rice employed the outstanding ResNet model as the backbone network to extract image features. The use of residual structures allowed for a smoother information transfer, avoiding the problem of gradient vanishing and making the network more stable during training while also reducing the number of parameters [29,30];
- The transformer architecture was introduced to the proposed model. Although many excellent transformer-based works have emerged in the visual domain, such as the Swin transformer [31], there is still a gap in terms of model parameters and inference speed compared to lightweight models based on CNN [32]. Most importantly, training a transformer architecture on images is difficult, as it requires more training data, epochs, and regularization, and the transformer architecture is sensitive to data augmentation [33]. However, we are unwilling to abandon the powerful performance of the self-attention mechanism of the transformer architecture when applied to images. Therefore, we adopted a hybrid architecture of CNN and transformer. CNN can provide spatial inductive bias and accelerate network convergence, making the network training process more stable;
- The CBAM was adopted in the ResViT-Rice block, which can adaptively adjust the importance of different regions in the input feature map [34], thereby increasing the model’s attention to important areas. In rice disease-detection tasks, the location of some diseases in the image may be random, so by introducing attention mechanisms, we can make the model pay more attention to disease areas, thereby improving the model’s accuracy [35].
4.2. Limitations of Other Mainstream Models
4.3. Limitation of Our Work
5. Conclusions
- By integrating the residual module with the encoder from the transformer architecture and introducing attention mechanisms, we proposed an improved deep learning model, ResViT-Rice, and compared it with other mainstream models. The results showed that our model performed the best in all evaluation metrics, with an accuracy of up to 99%;
- Based on the results of our ablation experiments, we had made the significant finding that our ResViT block was essentially an attention mechanism module. It was not only compatible with the ResNet50 network model but can also be combined with various other network models. This suggests that our ResViT block has wide applicability and can be broadly applied in various scenarios. By incorporating the ResViT block into other network models, we can further enhance their performance, thereby boosting their expressiveness. Therefore, our research is not limited to ResNet50 and can be extended to other network structures, providing more competitive solutions for different fields and tasks;
- Finally, our method is not only limited to rice disease detection but is also applicable to the detection and identification of diseases in other crops. In the future, this method is expected to be widely used in agriculture, contributing to the improvement of agricultural production and economic benefits.
Supplementary Materials
Author Contributions
Funding
Institutional Review Board Statement
Data Availability Statement
Conflicts of Interest
References
- Asibi, A.E.; Chai, Q.; Coulter, J.A. Rice Blast: A Disease with Implications for Global Food Security. Agronomy 2019, 9, 451. [Google Scholar] [CrossRef] [Green Version]
- Candole, B.L.; Siebenmorgen, T.J.; Lee, F.N.; Cartwright, R.D. Effect of Rice Blast and Sheath Blight on Physical Properties of Selected Rice Cultivars. Cereal Chem. J. 2000, 77, 535–540. [Google Scholar] [CrossRef] [Green Version]
- Ng, L.C.; Sariah, M.; Sariam, O.; Radziah, O.; Zainal Abidin, M.A. Bio-efficacy of microbial-fortified rice straw compost on rice blast disease severity, growth and yield of aerobic rice. Australas. Plant Pathol. 2012, 41, 541–549. [Google Scholar] [CrossRef]
- Chukwu, S.C.; Rafii, M.Y.; Ramlee, S.I.; Ismail, S.I.; Hasan, M.M.; Oladosu, Y.A.; Magaji, U.G.; Akos, I.; Olalekan, K.K. Bacterial leaf blight resistance in rice: A review of conventional breeding to molecular approach. Mol. Biol. Rep. 2019, 46, 1519–1532. [Google Scholar] [CrossRef]
- Chhabra, R.; Sharma, R.; Hunjan, M.S.; Sharma, V.K.; Sharma, P.; Chauhan, S.K. Microstructural and metabolic variations induced by Bipolaris oryzae inciting brown spot disease of rice. Cereal Res. Commun. 2023. [Google Scholar] [CrossRef]
- Aslam, H.M.U.; Naveed, K.; Hussain, S.I.; Shakeel, Q.; Ashraf, W.; Anwaar, H.A.; Raza, M.M.; Sarfraz, S.; Tariq, I. First Report of Brown Leaf Spot of Rice Caused by Bipolaris zeicola in Pakistan. Plant Dis. 2021, 105, 212. [Google Scholar] [CrossRef]
- Nur Ain Izzati, M.Z.; Madihah, M.Z.A.; Nor Azizah, K.; Najihah, A.; Muskhazli, M. First Report of Bipolaris cactivora Causing Brown Leaf Spot in Rice in Malaysia. Plant Dis. 2019, 103, 1021. [Google Scholar] [CrossRef]
- Barnwal, M.K.; Kotasthane, A.S.; Magculia, N.; Mukherjee, P.K.; Savary, S.; Sharma, A.K.; Singh, H.B.; Singh, U.; Sparks, A.H.; Variar, M.; et al. A review on crop losses, epidemiology and disease management of rice brown spot to identify research priorities and knowledge gaps. Eur. J. Plant Pathol. 2013, 136, 443–457. [Google Scholar] [CrossRef] [Green Version]
- Mamat, N.; Othman, M.F.; Abdulghafor, R.; Alwan, A.A.; Gulzar, Y. Enhancing Image Annotation Technique of Fruit Classification Using a Deep Learning Approach. Sustainability 2023, 15, 901. [Google Scholar] [CrossRef]
- Gulzar, Y. Fruit Image Classification Model Based on MobileNetV2 with Deep Transfer Learning Technique. Sustainability 2023, 15, 1906. [Google Scholar]
- Wang, Y.; Wang, H.; Peng, Z. Rice diseases detection and classification using attention based neural network and bayesian optimization. Expert Syst. Appl. 2021, 178, 114770. [Google Scholar] [CrossRef]
- Daniya, T.; Vigneshwari, S. Deep Neural Network for Disease Detection in Rice Plant Using the Texture and Deep Features. Comput. J. 2021, 65, 1812–1825. [Google Scholar] [CrossRef]
- Kim, D.; Jeong, S.; Kim, B.; Kim, S.-j.; Kim, H.; Jeong, S.; Yun, G.-y.; Kim, K.-Y.; Park, K. Automated Detection of Rice Bakanae Disease via Drone Imagery. Sensors 2023, 23, 32. [Google Scholar] [CrossRef]
- Haque, M.E.; Rahman, A.; Junaeid, I.; Hoque, S.U.; Paul, M. Rice Leaf Disease Classification and Detection Using YOLOv5. arXiv 2022, arXiv:2209.01579. [Google Scholar]
- Gao, Y.; Wang, H.; Li, M.; Su, W.-H. Automatic Tandem Dual BlendMask Networks for Severity Assessment of Wheat Fusarium Head Blight. Agriculture 2022, 12, 1493. [Google Scholar] [CrossRef]
- Liu, B.-Y.; Fan, K.-J.; Su, W.-H.; Peng, Y. Two-Stage Convolutional Neural Networks for Diagnosing the Severity of Alternaria Leaf Blotch Disease of the Apple Tree. Remote Sens. 2022, 14, 2519. [Google Scholar] [CrossRef]
- Wang, Y.-H.; Su, W.-H. Convolutional Neural Networks in Computer Vision for Grain Crop Phenotyping: A Review. Agronomy 2022, 12, 2659. [Google Scholar] [CrossRef]
- Su, W.-H.; Zhang, J.; Yang, C.; Page, R.; Szinyei, T.; Hirsch, C.D.; Steffenson, B.J. Automatic Evaluation of Wheat Resistance to Fusarium Head Blight Using Dual Mask-RCNN Deep Learning Frameworks in Computer Vision. Remote Sens. 2021, 13, 26. [Google Scholar] [CrossRef]
- He, K.; Zhang, X.; Ren, S.; Sun, J. Deep Residual Learning for Image Recognition. In Proceedings of the 2016 IEEE Conference on Computer Vision and Pattern Recognition (CVPR), Las Vegas, NV, USA, 27–30 June 2016; pp. 770–778. [Google Scholar]
- Simonyan, K.; Zisserman, A. Very Deep Convolutional Networks for Large-Scale Image Recognition. arXiv 2014, arXiv:1409.1556. [Google Scholar]
- Zhang, X.; Zhou, X.; Lin, M.; Sun, J. ShuffleNet: An Extremely Efficient Convolutional Neural Network for Mobile Devices. In Proceedings of the 2018 IEEE/CVF Conference on Computer Vision and Pattern Recognition, Salt Lake City, UT, USA, 18–23 June 2018; pp. 6848–6856. [Google Scholar]
- Krizhevsky, A.; Sutskever, I.; Hinton, G.E. ImageNet classification with deep convolutional neural networks. Commun. ACM 2012, 60, 84–90. [Google Scholar] [CrossRef] [Green Version]
- Liu, Z.; Lin, Y.; Cao, Y.; Hu, H.; Wei, Y.; Zhang, Z.; Lin, S.; Guo, B. Swin Transformer: Hierarchical Vision Transformer using Shifted Windows. In Proceedings of the 2021 IEEE/CVF International Conference on Computer Vision (ICCV), Montreal, BC, Canada, 10–17 October 2021; pp. 9992–10002. [Google Scholar]
- Sethy, P.K.; Barpanda, N.K.; Rath, A.K.; Behera, S.K. Deep feature based rice leaf disease identification using support vector machine. Comput. Electron. Agric. 2020, 175, 105527. [Google Scholar] [CrossRef]
- Ghosal, S.; Sarkar, K. Rice Leaf Diseases Classification Using CNN With Transfer Learning. In Proceedings of the 2020 IEEE Calcutta Conference (CALCON), Salt Lake City, UT, USA, 28–29 February 2020; pp. 230–236. [Google Scholar]
- Islam, M.A.; Shuvo, M.N.R.; Shamsojjaman, M.; Hasan, S.; Shahadat, M.A.; Khatun, T. An Automated Convolutional Neural Network Based Approach for Paddy Leaf Disease Detection. Int. J. Adv. Comput. Sci. Appl. 2021, 12. [Google Scholar] [CrossRef]
- Patidar, S.; Pandey, A.; Shirish, B.A.; Sriram, A. Rice Plant Disease Detection and Classification Using Deep Residual Learning. In Proceedings of the International Conference on Machine Learning, Vienna, Austria, 12–18 July 2020. [Google Scholar]
- Zhou, Y.; Fu, C.; Zhai, Y.; Li, J.; Jin, Z.; Xu, Y. Identification of Rice Leaf Disease Using Improved ShuffleNet V2. Comput. Mater. Contin. 2023, 75, 4501–4517. [Google Scholar] [CrossRef]
- He, F.X.; Liu, T.L.; Tao, D.C. Why ResNet Works? Residuals Generalize. IEEE Trans. Neural Netw. Learn. Syst. 2020, 31, 5349–5362. [Google Scholar] [CrossRef] [PubMed] [Green Version]
- Allen-Zhu, Z.; Li, Y. What can ResNet learn efficiently, going beyond kernels? In Proceedings of the 33rd International Conference on Neural Information Processing Systems, Vancouver, BC, Canada, 8–14 December 2019; Curran Associates Inc.: Red Hook, NY, USA, 2019; p. 809. [Google Scholar]
- Liu, Z.; Hu, H.; Lin, Y.; Yao, Z.; Xie, Z.; Wei, Y.; Ning, J.; Cao, Y.; Zhang, Z.; Dong, L.; et al. Swin Transformer V2: Scaling Up Capacity and Resolution. In Proceedings of the 2022 IEEE/CVF Conference on Computer Vision and Pattern Recognition (CVPR), New Orleans, LA, USA, 18–24 June 2022; pp. 11999–12009. [Google Scholar]
- Touvron, H.; Cord, M.; Sablayrolles, A.; Synnaeve, G.; J’egou, H.e. Going deeper with Image Transformers. In Proceedings of the 2021 IEEE/CVF International Conference on Computer Vision (ICCV), Montreal, BC, Canada, 10–17 October 2021; pp. 32–42. [Google Scholar]
- Graham, B.; El-Nouby, A.; Touvron, H.; Stock, P.; Joulin, A.; Jégou, H.; Douze, M. LeViT: A Vision Transformer in ConvNet’s Clothing for Faster Inference. In Proceedings of the 2021 IEEE/CVF International Conference on Computer Vision (ICCV), Montreal, BC, Canada, 10–17 October 2021; pp. 12239–12249. [Google Scholar]
- Yang, X. An Overview of the Attention Mechanisms in Computer Vision. J. Phys. Conf. Ser. 2020, 1693, 012173. [Google Scholar] [CrossRef]
- Peng, J.; Wang, Y.; Jiang, P.; Zhang, R.; Chen, H. RiceDRA-Net: Precise Identification of Rice Leaf Diseases with Complex Backgrounds Using a Res-Attention Mechanism. Appl. Sci. 2023, 13, 4928. [Google Scholar] [CrossRef]
- Yakkundimath, R.; Saunshi, G.; Anami, B.; Palaiah, S. Classification of Rice Diseases using Convolutional Neural Network Models. J. Inst. Eng. (India) Ser. B 2022, 103, 1047–1059. [Google Scholar] [CrossRef]
- Prasetyo, H.D.; Triatmoko, H.; Nurdiansyah; Isnainiyah, I.N. The Implementation of CNN on Website-based Rice Plant Disease Detection. In Proceedings of the 2020 International Conference on Informatics, Multimedia, Cyber and Information System (ICIMCIS), Jakarta, Indonesia, 19–20 November 2020; pp. 75–80. [Google Scholar]
- Ajra, H.; Nahar, M.K.; Sarkar, L.; Islam, M.S. Disease Detection of Plant Leaf using Image Processing and CNN with Preventive Measures. In Proceedings of the 2020 Emerging Technology in Computing, Communication and Electronics (ETCCE), Dhaka, Bangladesh, 21–22 December 2020; pp. 1–6. [Google Scholar]
- Acharya, A.; Muvvala, A.; Gawali, S.; Dhopavkar, R.; Kadam, R.; Harsola, A. Plant Disease detection for paddy crop using Ensemble of CNNs. In Proceedings of the 2020 IEEE International Conference for Innovation in Technology (INOCON), Bangaluru, India, 6–8 November 2020; pp. 1–6. [Google Scholar]
- Zhao, X.; Huang, P.; Shu, X. Wavelet-Attention CNN for image classification. Multimed. Syst. 2022, 28, 915–924. [Google Scholar] [CrossRef]
- Wu, H.; Xiao, B.; Codella, N.; Liu, M.; Dai, X.; Yuan, L.; Zhang, L. CvT: Introducing Convolutions to Vision Transformers. In Proceedings of the 2021 IEEE/CVF International Conference on Computer Vision (ICCV), Montreal, BC, Canada, 10–17 October 2021; pp. 22–31. [Google Scholar]
- Kumar, P.R.; Kiran, R.; Singh, U.P.; Rathore, Y.; Janghel, R.R. Rice Leaf Disease Detection using Mobile Net and Inception V.3. In Proceedings of the 2022 IEEE 11th International Conference on Communication Systems and Network Technologies (CSNT), Indore, India, 23–24 April 2022; pp. 282–286. [Google Scholar]
- Masykur, F.; Adi, K.; Nurhayati, O.D. Classification of Paddy Leaf Disease Using MobileNet Model. In Proceedings of the 2022 IEEE 8th International Conference on Computing, Engineering and Design (ICCED), Virtual, 28–29 July 2022; pp. 1–4. [Google Scholar]
- Chavan, A.; Shen, Z.; Liu, Z.; Liu, Z.; Cheng, K.T.; Xing, E. Vision Transformer Slimming: Multi-Dimension Searching in Continuous Optimization Space. In Proceedings of the 2022 IEEE/CVF Conference on Computer Vision and Pattern Recognition (CVPR), New Orleans, LA, USA, 18–24 June 2022; pp. 4921–4931. [Google Scholar]
- He, J.; Ding, Y.; Zhang, M.; Li, D. Towards efficient network compression via Few-Shot Slimming. Neural Netw. 2022, 147, 113–125. [Google Scholar] [CrossRef]


| The Serial Number of ResViT-Rice Block | 1 | 2 | 3 |
|---|---|---|---|
| H | 28 | 14 | 7 |
| W | 28 | 14 | 7 |
| C | 512 | 1024 | 2048 |
| D | 64 | 128 | 256 |
| dim of feedforward | 128 | 256 | 512 |
| number of layers | 2 | 4 | 3 |
| Layer Name | Output Size | Parameters |
|---|---|---|
| Input image | 2242243 | 0 |
| Conv 1 | 11211264 | 9408 |
| BatchNorm | 11211264 | 128 |
| ReLuMaxPool | 11211264 | 0 |
| Bottleneck 1-1 | 5656256 | 75,008 |
| Bottleneck 1-2 | 5656256 | 70,400 |
| Bottleneck 1-2 | 5656256 | 70,400 |
| Bottleneck 2 | 2828512 | 379,392 |
| ResViT-Rice block 1 | 2828512 | 4,967,906 |
| Bottleneck 3 | 14141024 | 1,512,448 |
| ResViT-Rice block 2 | 14141024 | 19,955,810 |
| Bottleneck 4 | 772048 | 6,039,552 |
| ResViT-Rice block3 | 772048 | 79,192,674 |
| Conv 2 | 77512 | 1,048,576 |
| AdaptiveAvgPool | 11512 | 0 |
| Linear | 2 | 1026 |
| Total | / | 113,322,728 |
| Metric | Equation |
|---|---|
| Accuracy | |
| Precision | |
| Recall | |
| F1-score |
| Model | Accuracy | Precision | Recall | F1 Score | AUC | |
|---|---|---|---|---|---|---|
| Leaf Blast | AlexNet [22] | 0.9087 | 0.9087 | 0.9087 | 0.9087 | 0.9735 |
| ResNet50 [19] | 0.9567 | 0.9578 | 0.9567 | 0.9567 | 0.9850 | |
| VGG19 [20] | 0.8221 | 0.8236 | 0.8221 | 0.8219 | 0.9056 | |
| ShuffleNet [21] | 0.7067 | 0.7072 | 0.7067 | 0.7066 | 0.8108 | |
| Swin Transformer [23] | 0.9326 | 0.9352 | 0.9326 | 0.9325 | 0.9766 | |
| ResViT-Rice | 0.9904 | 0.9904 | 0.9904 | 0.9904 | 0.9987 | |
| Brown Spot | AlexNet [22] | 0.8990 | 0.9020 | 0.8990 | 0.8988 | 0.9449 |
| ResNet50 [19] | 0.9038 | 0.9044 | 0.9038 | 0.9038 | 0.9583 | |
| VGG19 [20] | 0.9038 | 0.9040 | 0.9038 | 0.9038 | 0.9517 | |
| ShuffleNet [21] | 0.7788 | 0.7826 | 0.7788 | 0.7781 | 0.8760 | |
| Swin Transformer [23] | 0.8557 | 0.8623 | 0.8557 | 0.8557 | 0.9495 | |
| ResViT-Rice | 0.9663 | 0.9674 | 0.9663 | 0.9663 | 0.9873 | |
| Healthy | AlexNet [22] | 0.9294 | 0.9330 | 0.9294 | 0.9302 | 0.9705 |
| ResNet50 [19] | 0.9358 | 0.9362 | 0.9358 | 0.9360 | 0.9863 | |
| VGG19 [20] | 0.8974 | 0.9015 | 0.8974 | 0.8985 | 0.9436 | |
| ShuffleNet [21] | 0.7500 | 0.7500 | 0.7500 | 0.7500 | 0.8347 | |
| Swin Transformer [23] | 0.8846 | 0.8963 | 0.8846 | 0.8867 | 0.9636 | |
| ResViT-Rice | 0.9839 | 0.9840 | 0.9839 | 0.9839 | 0.9962 |
| Reference | Method | Dataset Used | Accuracy | Precision | Recall | F1-Score |
|---|---|---|---|---|---|---|
| [11] | Neural network with Bayesian optimization | 500 images | 0.9465 | 0.9260 | 0.8740 | 0.8960 |
| [12] | RideSpider water wave (RSW) | NA | 0.9050 | NA | 0.7900 | NA |
| [13] | YOLOv3 | 28,365 images | 0.9049 | NA | NA | NA |
| [14] | YOLOv5 | 1500 images | 0.9000 | 0.9000 | 0.6700 | 0.7600 |
| [25] | VGG-16 | NA | 0.9246 | NA | NA | NA |
| [26] | Inception-ResNet-V2 | 984 images | 0.9268 | 0.9370 | 0.9260 | 0.9280 |
| [27] | Residual neural network | 120 images | 0.9583 | 0.9400 | 0.9400 | 0.9400 |
| [28] | Improved ShuffleNet V2 | 1608 images | 0.9440 | 0.9680 | 0.9670 | 0.9680 |
| Our Work (ResViT-Rice) | Hybrid architecture of CNN and transformer | 1548 images | 0.9910 | 0.9900 | 0.9900 | 0.9900 |
| Module to be Ablated | Accuracy | Precision | Recall | F1 Score | AUC | |
|---|---|---|---|---|---|---|
| Leaf Blast | Block 3 | 0.8605 | 0.8704 | 0.8605 | 0.8596 | 0.9581 |
| Block 2 and 3 | 0.8509 | 0.8512 | 0.8509 | 0.8509 | 0.9378 | |
| CBAM | 0.8221 | 0.8235 | 0.8221 | 0.8219 | 0.9000 | |
| None (ResViT-Rice) | 0.9904 | 0.9904 | 0.9904 | 0.9904 | 0.9987 | |
| Brown Spot | Block 3 | 0.8990 | 0.9035 | 0.8990 | 0.8987 | 0.9596 |
| Block 2 and 3 | 0.8557 | 0.8605 | 0.8557 | 0.8552 | 0.9498 | |
| CBAM | 0.8653 | 0.8675 | 0.8653 | 0.8651 | 0.9258 | |
| None (ResViT-Rice) | 0.9663 | 0.9674 | 0.9663 | 0.9663 | 0.9873 |
Disclaimer/Publisher’s Note: The statements, opinions and data contained in all publications are solely those of the individual author(s) and contributor(s) and not of MDPI and/or the editor(s). MDPI and/or the editor(s) disclaim responsibility for any injury to people or property resulting from any ideas, methods, instructions or products referred to in the content. |
© 2023 by the authors. Licensee MDPI, Basel, Switzerland. This article is an open access article distributed under the terms and conditions of the Creative Commons Attribution (CC BY) license (https://creativecommons.org/licenses/by/4.0/).
Share and Cite
Zhang, Y.; Zhong, L.; Ding, Y.; Yu, H.; Zhai, Z. ResViT-Rice: A Deep Learning Model Combining Residual Module and Transformer Encoder for Accurate Detection of Rice Diseases. Agriculture 2023, 13, 1264. https://doi.org/10.3390/agriculture13061264
Zhang Y, Zhong L, Ding Y, Yu H, Zhai Z. ResViT-Rice: A Deep Learning Model Combining Residual Module and Transformer Encoder for Accurate Detection of Rice Diseases. Agriculture. 2023; 13(6):1264. https://doi.org/10.3390/agriculture13061264
Chicago/Turabian StyleZhang, Yujia, Luteng Zhong, Yu Ding, Hongfeng Yu, and Zhaoyu Zhai. 2023. "ResViT-Rice: A Deep Learning Model Combining Residual Module and Transformer Encoder for Accurate Detection of Rice Diseases" Agriculture 13, no. 6: 1264. https://doi.org/10.3390/agriculture13061264
APA StyleZhang, Y., Zhong, L., Ding, Y., Yu, H., & Zhai, Z. (2023). ResViT-Rice: A Deep Learning Model Combining Residual Module and Transformer Encoder for Accurate Detection of Rice Diseases. Agriculture, 13(6), 1264. https://doi.org/10.3390/agriculture13061264