Article

Vibration Characteristic Analysis and Structural Optimization of the Frame of a Triplex Row-Baling Cotton Picker

1
College of Mechanical and Electrical Engineering, Shihezi University, Shihezi 832003, China
2
Collaborative Innovation Center of Province-Ministry Co-Construction for Cotton Modernization Production Technology, Shihezi 832003, China
3
Key Laboratory of Northwest Agricultural Equipment, Ministry of Agriculture and Rural Affairs, Shihezi 832003, China
4
Xinjiang Production and Construction Corps Eighth Division Shihezi Agricultural and Animal Husbandry Mechanization Technology Training Station, Shihezi 832003, China
5
Shandong Swan Modernization Agricultural Machinery Equipment Co., Ltd., Jinan 250032, China
*
Author to whom correspondence should be addressed.
Agriculture 2023, 13(7), 1440; https://doi.org/10.3390/agriculture13071440
Submission received: 28 May 2023 / Revised: 29 June 2023 / Accepted: 3 July 2023 / Published: 21 July 2023
(This article belongs to the Section Agricultural Technology)

Abstract

:
The frame of the cotton picker is exposed to complex and varying loads during its operation. Therefore, conducting research on the vibration characteristics of the frame is crucial. In this study, vibration tests were conducted on the main vibration sources in a cotton picker at several measuring points on the frame. An accelerometer sensor was utilized to collect the signals. Fourier analysis was applied to analyze the vibration sources, encompassing the excitation frequency and the vibration source-coupled excitation frequency. Modal tests were also conducted to validate the finite element model and determine the natural frequencies of the frame. The results showed that the natural frequencies of the frame, specifically the third-order, fourth-order, and sixth-order frequencies, were comparable to the vibration source-coupled excitation frequencies. To prevent frame resonance, the response surface method was used to optimize the frame. Based on the MOGA algorithm, scheme 4 was identified as the optimal design. Furthermore, fatigue life calculations were carried out to optimize the parts with short lifespans on the frame, thereby enhancing the working performance.

1. Introduction

The frame of triplex row-baling cotton pickers is influenced by various factors, including the engine, ground, and other load excitations during work. Some studies have revealed that structural resonance occurs when the structures are within a specific excitation frequency range or direction. This phenomenon exacerbates fatigue damage and has numerous impacts on structural strength [1,2,3]. The frame serves as the most crucial load-bearing component on the triplex row-baling cotton picker and plays a vital role in guaranteeing the machine’s normal operation and driving safety. Therefore, researching the vibration characteristics of a cotton picker holds significant importance for optimizing its structure and enhancing its working life.
Researchers have studied the structural vibrations of agricultural machinery. Tang found that the threshing machine of the combine harvester generated unbalanced vibrations due to straw winding. These vibrations are expected to significantly impact the stability and lifespan of the equipment [4]. Ebrahimi found that the vibration of the stripping header on combine harvesters could lead to a loss of yield and diminish the machine’s lifespan. Therefore, vibration tests were carried out on the stripping header of the combine harvester. The frequency-domain decomposition method was used to calculate the modal parameters and modify the finite element model. Finally, the resonance of the stripping header on the combine harvesters was avoided and the fifth-order natural frequency was reduced using structural modifications [5]. Chandravanshi employed a sensor, namely, a signal analyzer, to conduct experimental modal analysis on a vertically tapered frame, and finite element analysis was used for verification. Meanwhile, the vibration characteristics and failed structural sections were obtained using the computed results [6]. Wang conducted a modal analysis on the frame of precision vegetable seeders and verified the accuracy of the finite element model. The modal test results showed that the engine excitation was the main factor of frame resonance. Moreover, a method of adding a fixed beam was proposed to optimize the structure, and field testing was carried out. The results showed that the sowing quality of the precision vegetable seeders was significantly improved [7]. Wang found that there was insufficient fatigue life during the service life of the metro vehicles. To study the effects of vibrations on the fatigue life of a bogie frame, a finite element model of the bogie frame was established. The results showed that the transverse and vertical vibration excitations of the motor contributed greatly to the fatigue damage of the frame [2]. Zhang solved the six natural frequencies of the threshing machine based on the stress and strain distributions in a threshing machine frame of the crawler rice combine harvester. A simulation was carried out to verify the optimization results. The results showed that the first six natural frequencies in the optimized threshing machine avoided the excitation frequency in the working parts. Compared to the unoptimized threshing machine, the weight of the threshing machine was reduced by 13.75% [8]. Chen found that the violent vibration in the frame was produced under multi-source excitations when the rice combine harvester was working. Based on this multi-source excitation, the frame and threshing frame consisted of the complete frame of a combine harvester, which was utilized to analyze the constrained modal characteristics and internal relations of the frame. The rigid-body dynamic models of the 7-DOF frame were established to obtain the vibration mode and frequency of the frame. In addition, the effectiveness of the dynamic models was verified via experiments and simulations [9]. In Gao’s study, the power spectral density (PSD) of the axial force on the bolt was loaded to analyze the fatigue life of bolts and nuts. Finite element analysis of the random vibration was carried out for the whole structure, and fatigue tests were conducted on the simplified bolt. The results showed that the theoretical analysis and experimental results were coincident, which proved the failure mechanism of the bolts [10]. Zhang proposed a method to predict the fatigue life of airborne equipment; it combines the finite element model of an airborne electrical control box, Miner’s linear cumulative damage criterion, and the Gaussian-distribution Steinberg method to estimate the fatigue life of the electronic control box in three directions. The results of the vibration test were consistent with those of the finite element simulation [11]. To solve the problem of low data availability due to sensor failures, Li et al. [12] adopted a global feature extraction scheme to fully utilize multiple sensor signals. Additionally, they introduced adversarial learning to extract the generalized sensor-invariant features. Finally, using deep learning, a residual service life (RUL) has been proposed to predict sensor faults.
The above research methods provide references for studying the vibration characteristics of cotton pickers. Compared to other machineries, cotton pickers have a large volume, substantial weight, and an intricate structure. The cotton picker is influenced by multiple vibration excitations, such as the engine, fan, and picking head during work, resulting in vibration coupling between vibration sources. Therefore, the frame vibration condition is relatively complex. There is very little research on cotton picker vibration, and the frame vibration status of the cotton picker is not clear. The amplitude of the high-frequency vibration is small, and the transient response components rapidly decay, resulting in a stable structural system. Low-frequency vibrations have a long duration and large amplitude, leading to an unstable structural system. Therefore, a low-order frequency plays an important role in improving the strength and stability of the frame structure. This study considered various factors and tested the cotton picker frame with a low-frequency vibration (0~400 Hz).

2. Analysis of Vibration Excitation Sources

The soil in a cotton field generates excitations for the cotton pickers [13]. Relevant studies revealed that the size of the excitations generated by the soil is mainly related to the unevenness of the ground and the working speed. The calculation formula for excitations is as follows:
f 0 = 1000   v m λ
where f0 represents the excitation frequency of the ground (Hz), and vm indicates the working speed (m/s). λ is the wavelength of the unevenness of the ground, which is typically 320 mm.
The main vibration sources for a triplex row-baling cotton picker are the engine, fan, and picking head. To explore the excitation characteristics of the vibration sources, signals from three vibration sources were collected. The tests were carried out when cotton pickers did not work to reduce unnecessary interferences. In addition, the signals were collected when the engine ran smoothly.
The engine drives the whole equipment to operate as a power source for the triplex row-baling cotton picker. The cotton picker adopted a diesel engine with a 6-cylinder 4-stroke. There were two primary causes of engine vibration. The first reason was the inertial force and moment generated by the movement of the crankshaft and piston in the engine. The second reason was the shockwave generated by the ignition of the engine. The mutual cancellation of the first- and second-order inertia forces and moments in a 6-cylinder engine led to the absence of any external vibration generation. This could be attributed to the engine’s unique characteristics. The vibration generated by the explosive shock force was directly related to the cylinder configuration and stroke of the engine. The ignition fired three times for every rotation of the crankshaft in a 6-cylinder engine. Therefore, the formula for the engine excitation frequency is as follows [12]:
f = n 60 × 3
where n is the rotation rate, r/min.
The cotton picker operated with three gears: 800 r/min, 1200 r/min, and 2000 r/min. The signal acquisition of the engine in the three-axis direction was carried out when the rotation rate of the cotton picker was 800 r/min (as shown in Figure 1a). Fourier analysis was performed on the frequency-domain signal to obtain the frequency-domain diagram of the signal (as shown in Figure 1b). The main frequency of the engine was 40 Hz, which was consistent with the calculated results. Meanwhile, frequency doubling, such as doubling at 80 Hz and quadrupling at 240 Hz, was found.
The fan of the cotton picker provided wind power to transport the cotton, which was then transferred to the grain silos for cotton collection. The calculation formula for frequency is as follows:
f = n 60
The fan operated with three gears: 1700 r/min, 2600 r/min, and 4300 r/min. To investigate the differences between the excitation frequency in a fan and the calculated excitation frequency using Formula (3), the signal acquisition in the fan was completed at 4300 r/min. Figure 2a shows the frequency-domain diagram of the fan. The frequency of the fan was calculated to be 71.6 Hz, which was the main excitation frequency.
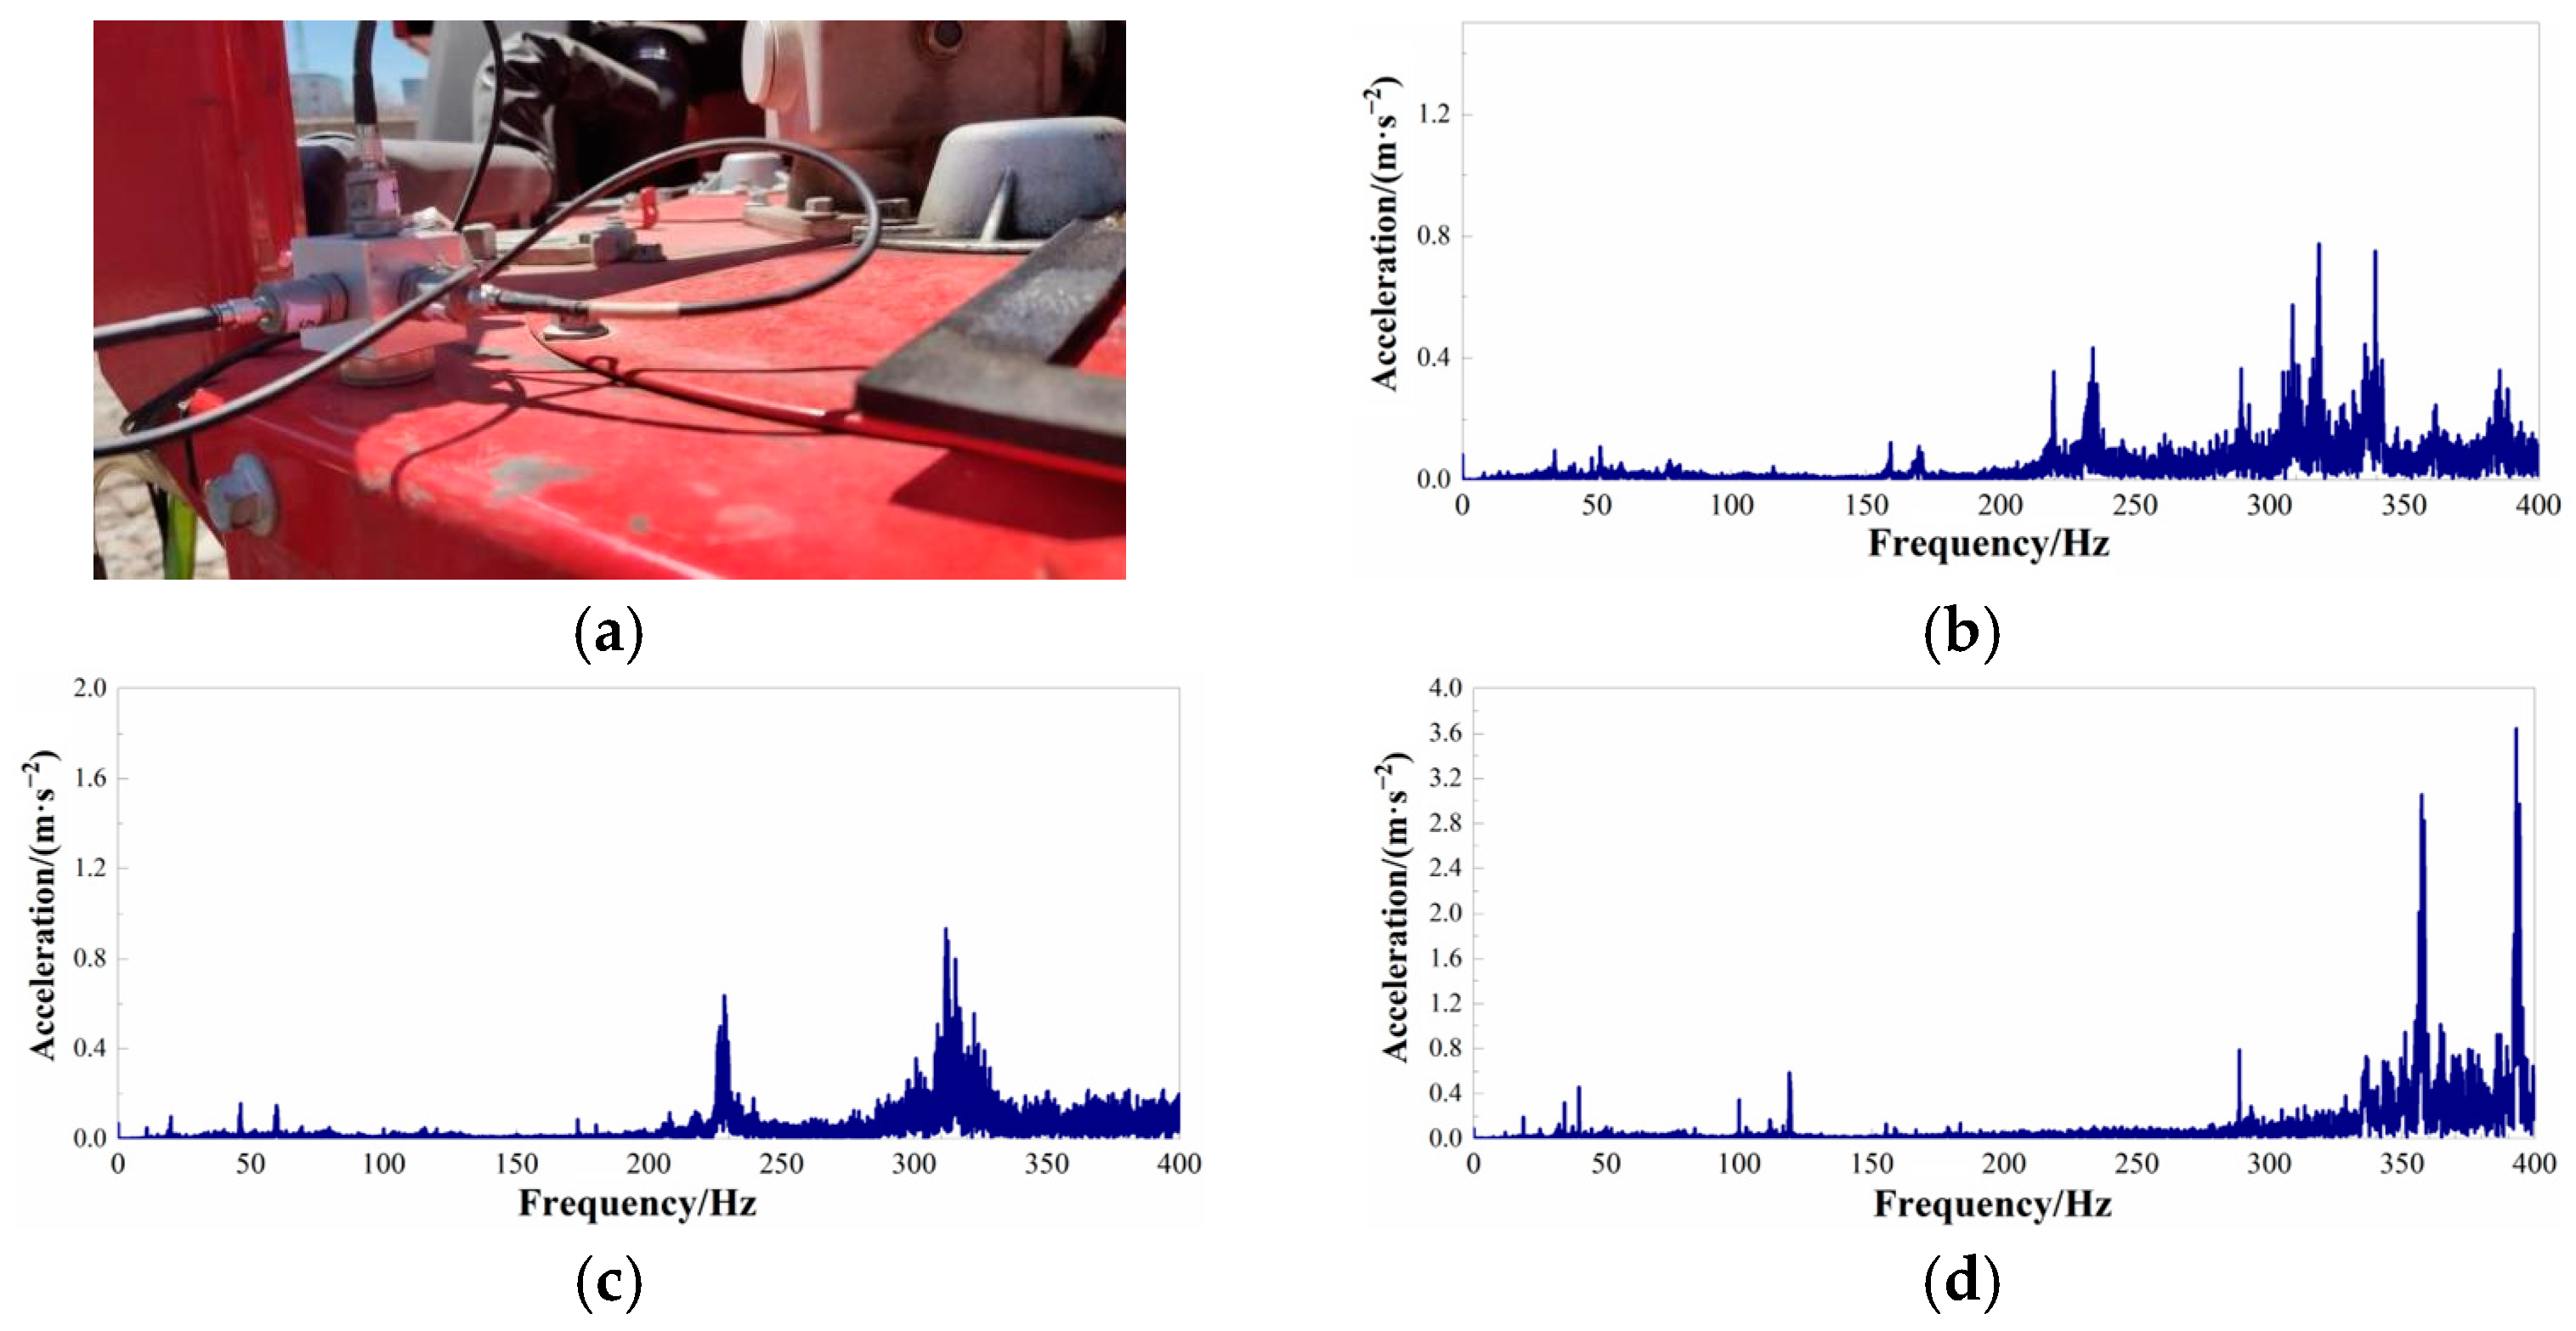
The rotating spindles in the picking head collected the cotton when the cotton stalk passed through it. The numerous rotating components in the picking head and their varied rotational speeds led to complex excitations generated by the picking head. Therefore, it was difficult to calculate the excitation frequency produced by picking heads using Formula (3). The three gears of the picking head were collected and analyzed using Fourier transform. Figure 3b–d show the frequency-domain diagram of the picking head.
As shown in Figure 3a–c, the excitation amplitude of the picking head was small, within the range of 0 to 200 Hz. The main excitation frequencies of the first gear, third gear, and second gear were 220~250 Hz, 350~400 Hz, and 300~350 Hz, respectively. Compared to the engine and fan, the main excitation frequency of the picking head was ambiguous and fell within a wide excitation range. The reason for this was that there were numerous rotating parts in the picking head.
The main excitation frequencies of the engine, fan, and picking head of a triplex row-baling cotton picker under different gears are shown in Table 1:

3. Investigation on Vibration Characteristics and Vibration Coupling of the Frame

The main vibration sources in the cotton picker were tested to determine their excitation frequency. The cotton picker consisted of multiple drive systems and vibration sources. Each vibration source had its own excitation frequency [13]. Therefore, vibration coupling occured between the vibration sources and drive systems. Vibration tests were carried out on cotton pickers under multiple working conditions.
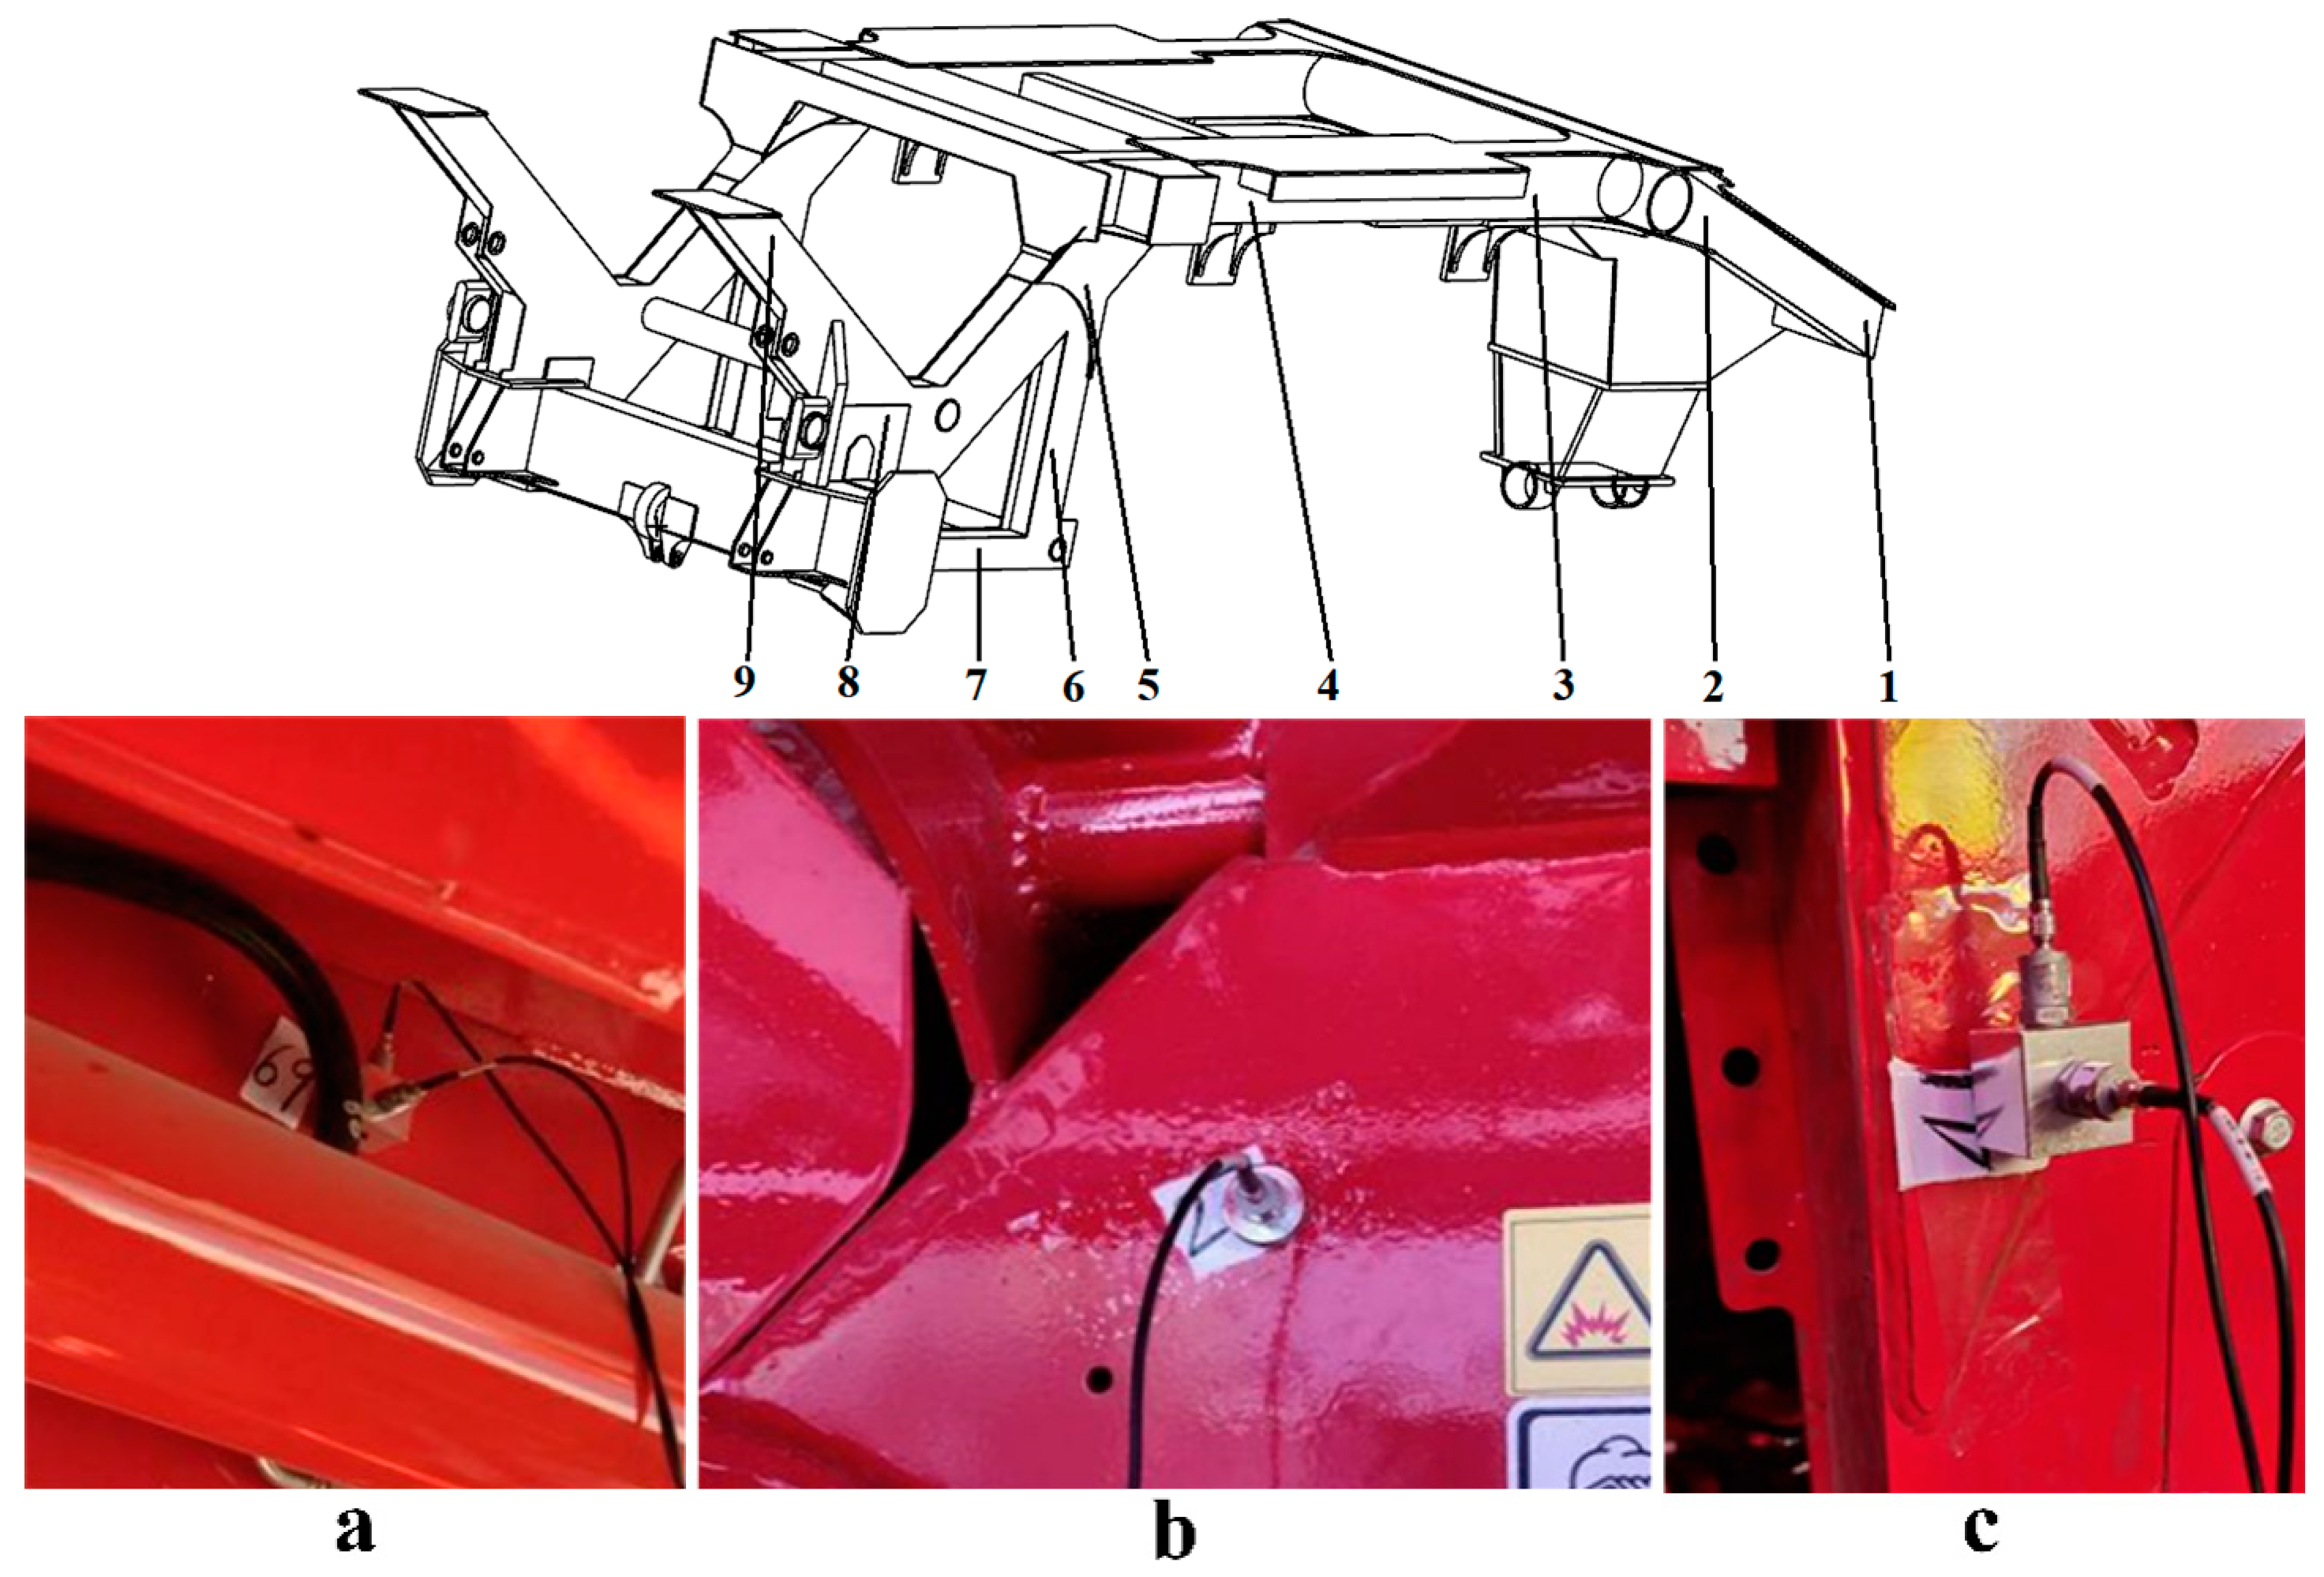
There were nine measuring points for this test located on the unilateral frame, as shown in Figure 4. Measuring points 1 and 2 were located at the front and rear-side positions of the left rear longeron to evaluate the vibration condition of the rear frame. Measuring point 3 was located at the middle rear-side position of the left longeron, adjacent to the engine. Measuring point 4 was located at the front middle-side position of the left longeron to evaluate the vibration condition of the middle frame. Measuring points 5 and 6 were located at the upper and middle-rear positions of the left welding frame, respectively. Measuring point 7 was located at the bottom of the left welding frame to evaluate the vibration condition of the front middle-side position of the frame. Measuring point 8 was located at a connecting position between the right welding frame and the front axle. Measuring point 9 was located at the front side of the right welding frame to evaluate the vibration condition of the front side of the frame.
The vibration tests were carried out under three working conditions for all measuring points, and the resulting signals were collected. The time-domain and frequency-domain signals were analyzed. The time-domain signals were expressed by the root mean square value (effective value) of acceleration [14]. The root mean square was calculated using the following formula:
R M S = 1 N k = 1 n x k 2 = x 1 2 + x 2 2 + + x n 2 N
where xk is the vibration signal and N is the average number
The root mean square value of acceleration was calculated for all measuring points in three directions, considering different working conditions, as shown in Table 2. X represents the left and right directions of the frame. Y represents the front and rear directions of the frame, and Z represents the up and down directions of the frame.
The specific details are as follows. The position of the vibration source was associated with the arrangement of the measurement points. Measuring points 1, 2, and 3 were located at the rear end of the overall frame (near the engine) to assess the engine’s effect on the frame. Measuring points 4, 5, and 6 were situated in the middle of the frame (near the fan) to evaluate the fan’s effect on the frame. Measuring points 7, 8, and 9 were utilized to estimate the effects of the picking head of a cotton picker on the frame.
From Table 2, it can be seen that the root mean square values (RMS) of all measuring points were significantly low under both condition 1 and condition 2. The difference in the RMS calculated under condition 1 and condition 2 was also very small. The RMS acquired under condition 3 was considerably high. This indicates that the frame vibration was relatively mild, and the difference in the vibration amplitude was small under condition 1 and condition 2. The main reasons for this are as follows. Condition 3 had a greater impact on the frame vibration compared to condition 1 and condition 2. This may be because the speed of the vibration source was low under condition 1 and condition 2, whereas the speed of the vibration source significantly increased under condition 3. Overall, the RMS of most measuring points in the X-direction were greater than those in the Y- and Z-directions. This indicates that the vibration of the frame was mainly concentrated in the X-direction, followed by the Y- and Z-directions. The measuring points (1, 2, 3, and 4) were located in the middle and rear positions of the frame and had a higher RMS. The measuring points (5, 6, 7, 8, and 9) were located in the middle and front positions of the frame and had a lower RMS. This indicates that the engine had a greater impact on the vibration of the frame than the fan and picker head.
The RMS in the Y-direction was slightly higher than those in the X- and Z-directions at measuring points 4, 5, and 6 under conditions 2 and 3. These points were located near the wind turbine, which indicates that the effect of the fan on the frame was concentrated in the Y- and X-directions. As the speed increased, the increase in RMS at measuring points 7, 8, and 9 was much lower than that at other points. This suggests that the picking head had a smaller impact on the frame vibration. The possible reasons for this are its heavy weight and less stimulation from internal rotating components, resulting in a smaller impact on the frame. A summary of the vibration characteristics of the frame under multiple operating conditions is as follows: the severity of the frame vibration was most affected by the engine, followed by the fan, and finally, the picking head; the main focus of the frame vibration was in the middle and rear parts of the frame, with the vibration direction mainly in the X-direction.
The frequency-domain signals were obtained by analyzing the acceleration signal of the measuring point using Fourier analysis. The two frequencies with the highest amplitude in the frequency-domain signal were utilized to represent the frequency-domain characteristics, as shown in Table 3. The dominant frequencies of all measuring points under condition 1 were mostly double the frequency of 80 Hz from the engine, a dominant frequency of 40 Hz, and multiple other frequencies. This indicates that the engine excitation had a greater impact on the frame vibration than the other vibration source excitations. The frequencies of measuring points 5 and 6 were 260 Hz and 130 Hz, respectively, which were not in the excitation range of the three vibration sources (as shown in Table 1), indicating the formation of a coupling frequency. The dominant frequencies of all measuring points under condition 2 were mostly double the frequency of 120 Hz of the engine, a dominant frequency of 60 Hz, and multiple other frequencies. Meanwhile, coupling frequencies 160 Hz and 260 Hz were formed. The frequencies of all measuring points under condition 3 included the engine excitation frequency and coupling frequency (150 Hz, 235 Hz, and 330 Hz). With an increase in the rotational rate, the number of coupling frequencies increased. Therefore, it is not only necessary to consider the influences of the main excitation of the vibration sources but also the coupling excitation generated by the vibration sources at high rotational speed.
According to the results of the frequency analysis under the three conditions, the vibration frequencies of the frame consisted of the excitation frequency of the engine and the coupling excitation frequencies of the vibration sources. The excitation frequencies of the fan and picking head made small contributions to the frame vibration of the cotton picker.

4. Modal Analysis

4.1. Finite Element Modal Analysis

Modal analysis is one of the research methods used in structural dynamics to study structural vibrations. Modal parameters can be determined by calculating finite elements and conducting tests to identify the presence of resonance states in structures. The general differential equation of system vibration can be expressed using the following formula:
M x ¨ + C x ¨ + K x ¨ = F
where M is the quality matrix; C is the damping matrix; K is the stiffness matrix; F is the force of external excitation; X is the displacement vector generated by the vibration.
Laplace transform of both sides of Equation (6) is as follows:
s 2 M + s K + K · X s = 0
where s is the Laplace transform factor and X(s) is the Laplace change of the displacement response. The damping of the triplex row-baling cotton picker was very small, which can be regarded as a vibration without damping.
s 2 M + K · X s = 0
The equation for the system dynamics can be changed as follows:
K w 2 M · X w = 0
The natural frequency was affected by structural stress due to the influences of the stress load on the frame.
K + K r w 2 M · X w = 0
where Kr is the prestressed matrix. The characteristic values ωi (i = 1,2, …, n) were obtained using Formula (6). The ωi was used to calculate φi, which is a vibrational form under the vibration frequency ωi.
The finite element model was calculated using the ANSYS software, which can be divided into free mode analysis and prestressed mode analysis. Free mode analysis of the frame of the cotton picker was conducted without considering the boundary conditions and constraints. As a result, the obtained findings represent the inherent characteristics of the frame. However, the frame of a cotton picker was subjected to loads and constraints from different components, which led to changes in its natural frequency and mode as the boundary conditions were altered. Therefore, the prestressed modal analysis method was more suitable for investigating the frame model. A three-dimensional model of the triplex row-baling cotton picker, which was 5.7 meters in length and 1.3 meters in height, was structured. The material used for the frame was Q345-A, and its properties are shown in Table 4.
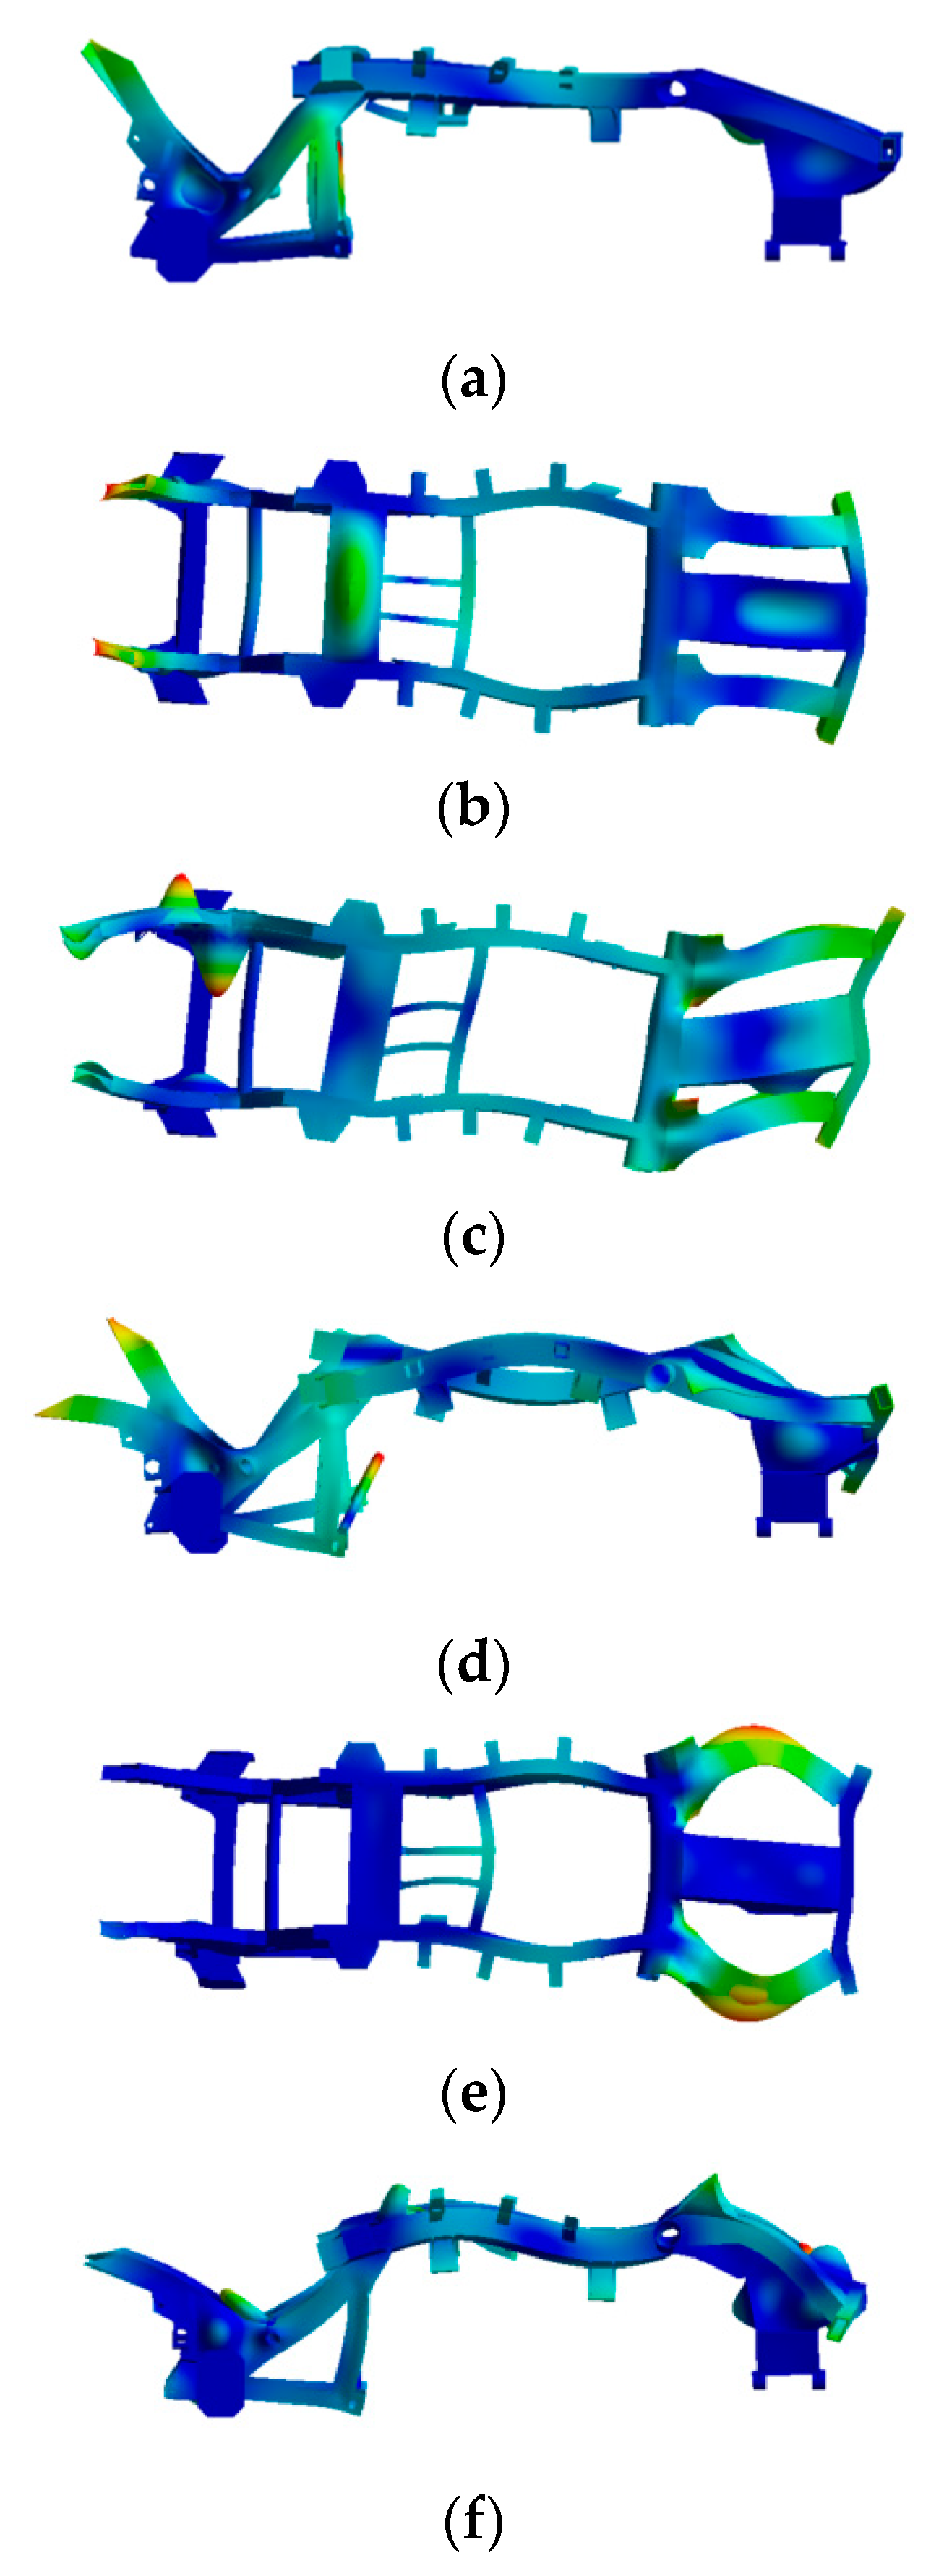
The 3D model frame was imported into the ANSYS Workbench software to create a grid division. In addition, the 3D model was simplified to reduce the calculation time and simulation workload. The overall structure of the frame was mainly composed of welded tubular steel and plate steel, with a thickness ranging from 5 to 10 mm. Therefore, the plate and shell structures were selected as the midplane for processing. The optimized model included 130,255 mesh nodes and 28,316 mesh elements, with an average quality of 0.71. The results of the finite element model are shown in Figure 5.

4.2. Experimental Modal Analysis

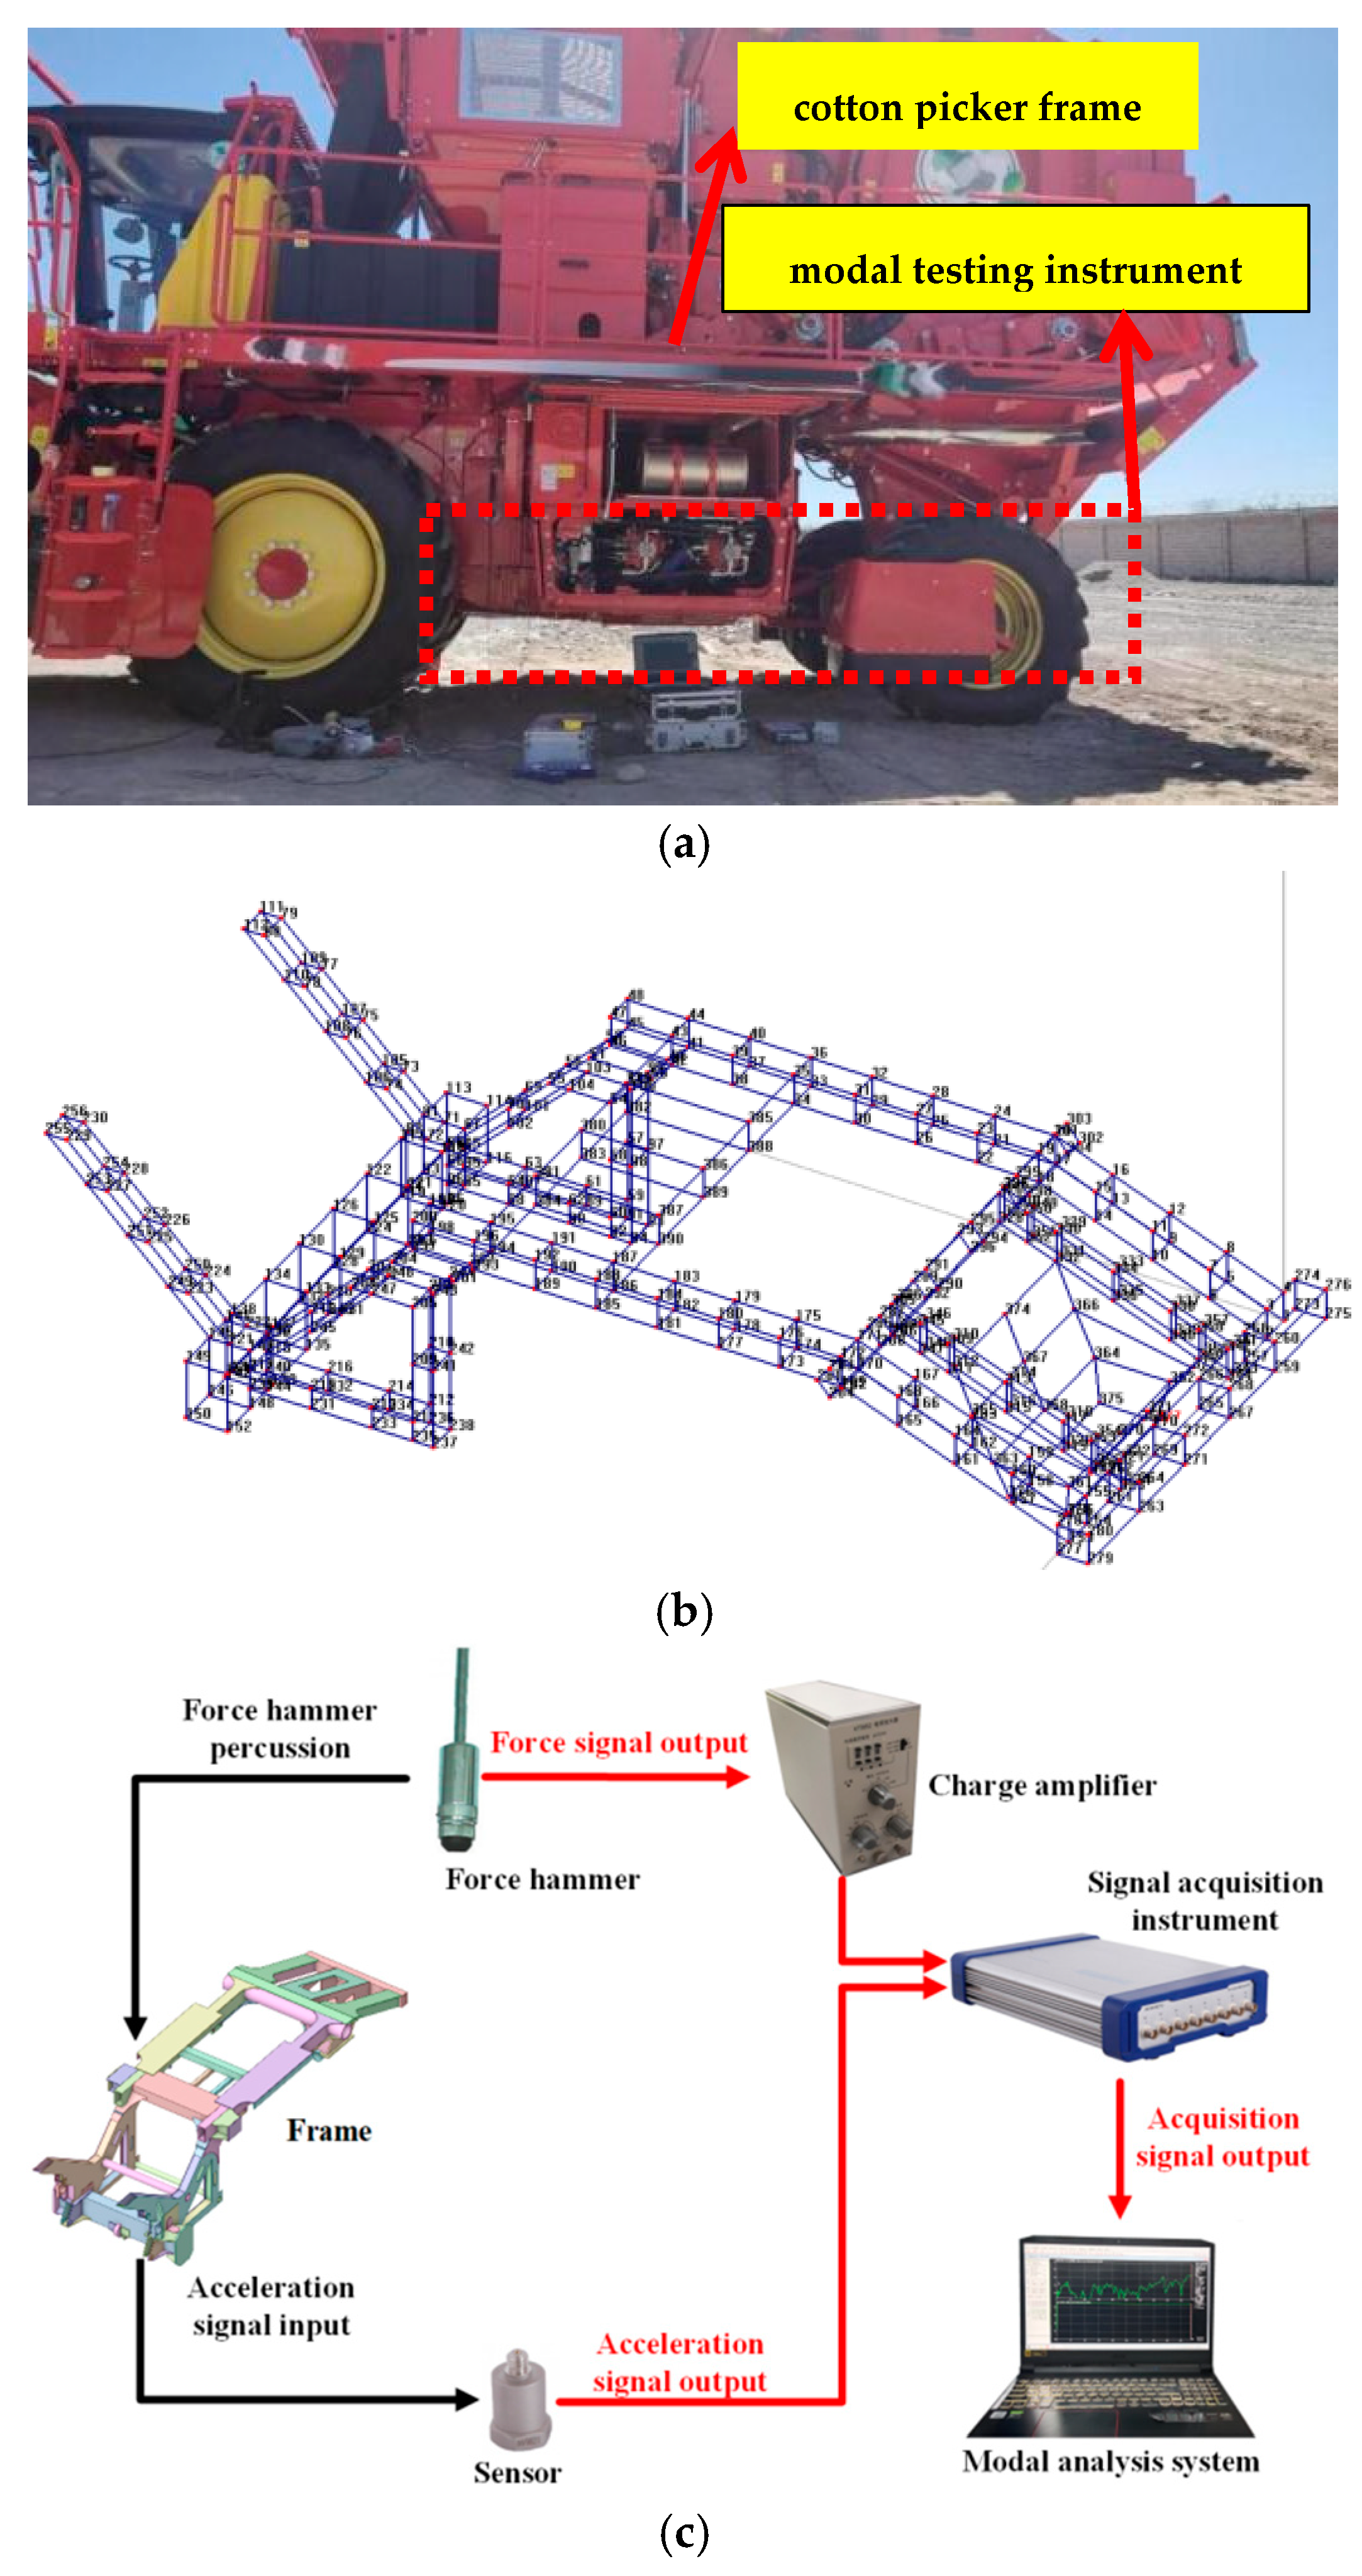
Modal analysis was the key step to verify the effectiveness of the results obtained from the finite element model of the frame. The inherent characteristics of a frame could be determined by analyzing the input and output signals. The modal analysis included the use of the hammer and vibration exciter methods. The movement of the impact hammer in the hammer method was convenient and did not contribute to the dynamic characteristics of the workpiece. The hammer method was utilized in this test by combining the characteristics of a cotton picker. The test equipment included a DFC high-elastic energy-gathering hammer, INV9821 acceleration sensor, INV306V signal acquisition instrument, KT5852 charge amplifier, and DASP V11 analysis system. A diagram of the field test setup is shown in Figure 6.
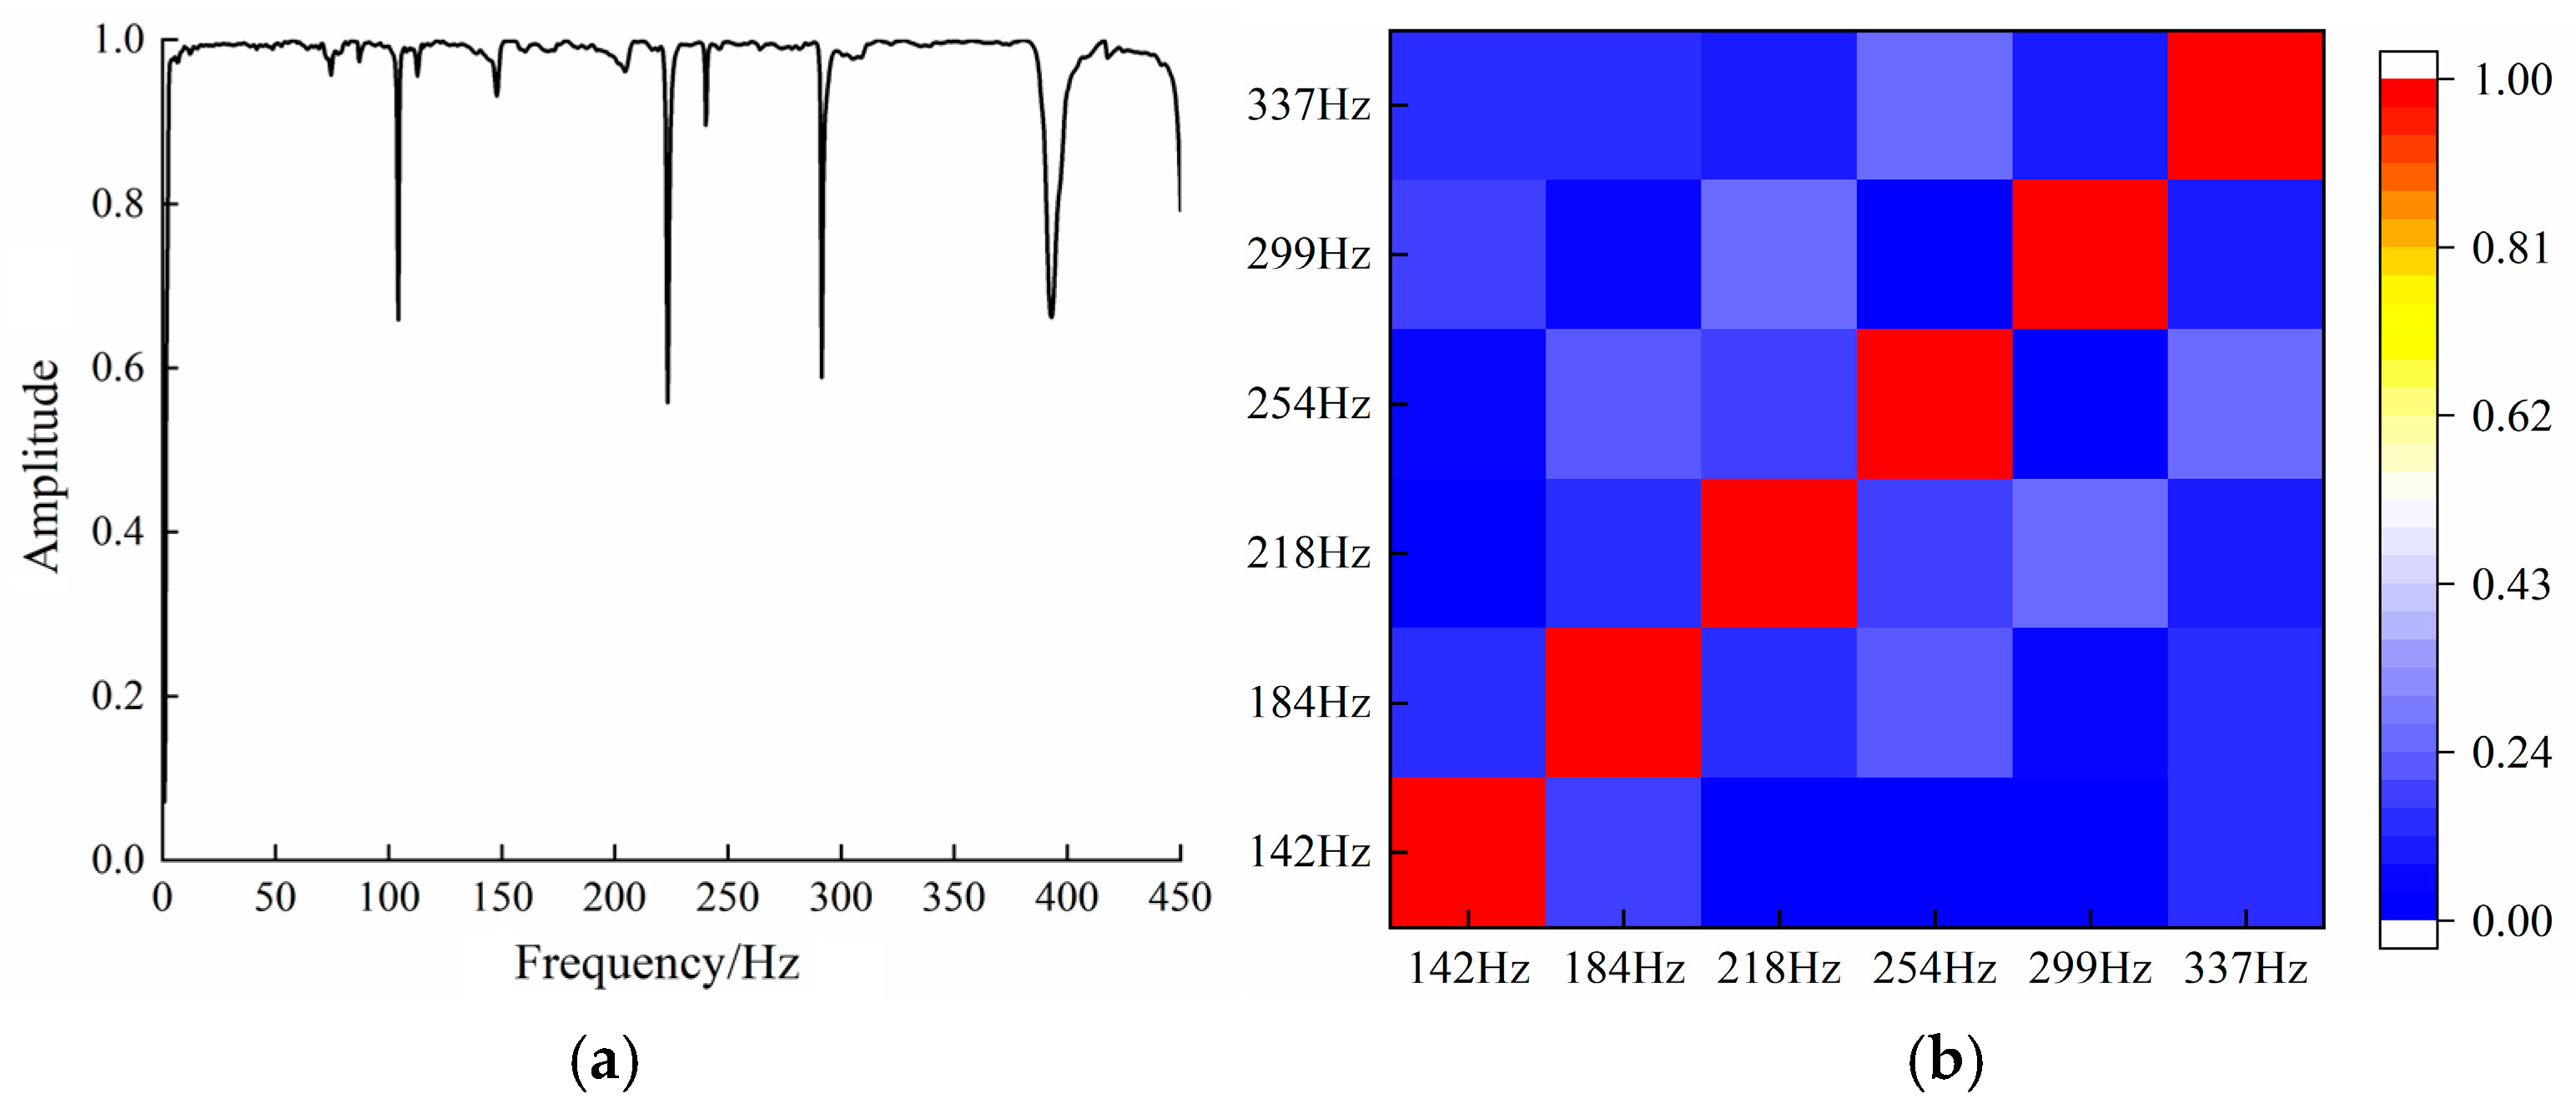
The sampling method adopted a variable time base technology in this test [15,16,17]. According to the Shannon sampling theorem, the sampling frequency (fs) is at least double the highest frequency of the measured signal. This paper focuses on the modal responses in the range of 0 to 400 Hz. The acceleration sampling of the frequency was 2500 Hz. The sampling was completed using a variable time base four times, with a sampling frequency of 10 KHz. Meanwhile, the hammering tests were carried out four times for single-point signal acquisition to obtain more accurate signals. Figure 7a shows the curve of a signal coherence function. The coherence of the signal in the range of 0 to 400 Hz was located near 1, with a decrease observed at the anti-resonance peak. This indicates a high measurement quality.
The modal assurance criterion (MAC) was used to examine the correlation between mode shapes [18]. The MAC is the dot product between the modal shape vectors, which indicates the geometric correlation between the two modal shape vectors. The value was close to 0, indicating a small correlation between the two mode shapes. As shown in Figure 8, the value between the same orders is 1, whereas the value between different orders is 0, indicating that the modes of different orders are not independent.
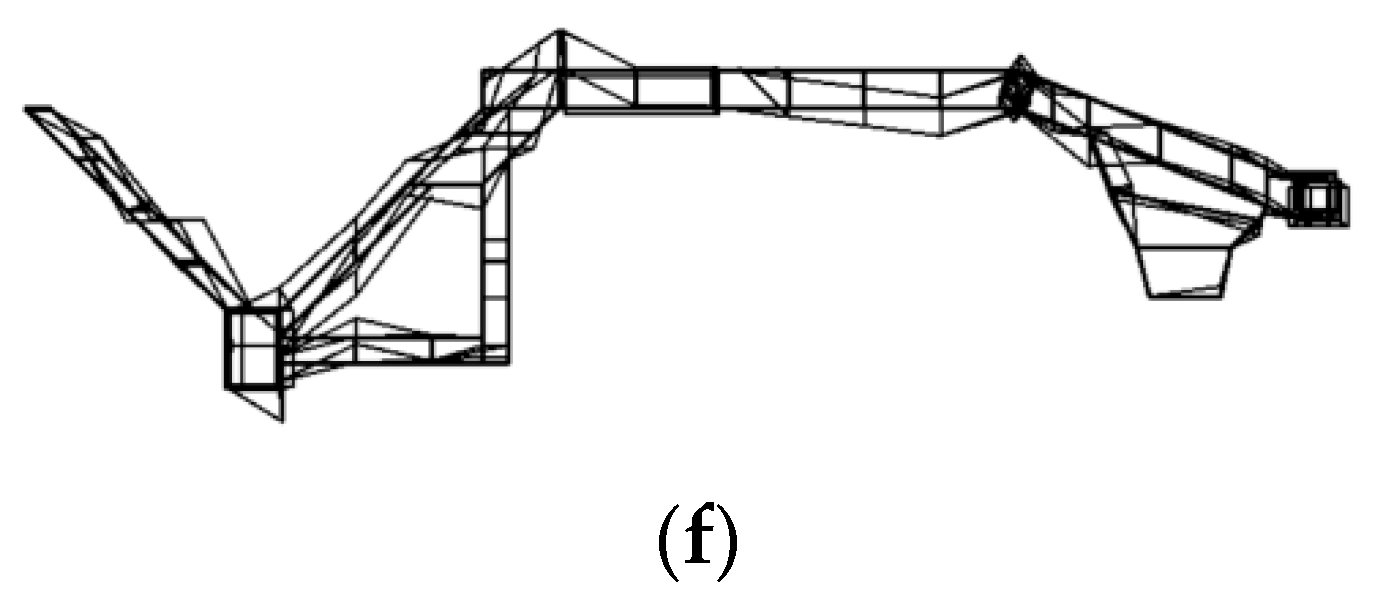
The response function of the system was calculated using the DASP software, which was applied to the test model to obtain the natural frequency and mode shape vectors of the cotton picker. The first six frequencies and vibration modes of the frame were extracted and analyzed. The results of the mode shapes are shown in Figure 8.
Table 5 shows the modal frequency of each order and the corresponding mode shapes. The frequency error of the finite element mode and test mode was less than 4%, with a maximum frequency error value of 3.1%. The mode shape trend of each mode was consistent, indicating an accurate finite element model and correct constraint conditions for actual situations.
When the results of the vibration measurement and modal frequency were combined, the frequency gap between the excitation frequency of the vibration source and the six modal frequencies was large. The vibration source did not cause frame resonance. The frequency gap between the modal frequency (218 Hz, 254 Hz, and 337 Hz) and the partially coupled frequency (235 Hz, 260 Hz, and 330 Hz) was minimal, leading to frame resonance. Therefore, when the frame was optimized, three modal frequencies were taken as the objectives for optimization.

5. Optimization

The response surface method is a product of combining mathematical and statistical methods for modeling and analyzing problems in which the response of interest is affected by multiple variables [19]. The whole structure of the machine was finalized, and the adjustable frame was not compatible. Therefore, the wall thickness of the frame was considered the design variable for optimization purposes, and the coupled frequency was chosen as the optimization objective for optimization. The optimization process was as follows:
(1)
The sensitivity analysis was performed on 20 design variables, and the variables with high sensitivity were selected.
(2)
Weldments with high sensitivity were designed for sampling to fit the response surface. By combining the MOGA (multi-objective genetic algorithm), the optimization and solution were completed.
(3)
According to the optimization results, an optimal scheme was determined using the entropy weight method and linear-weighting method.

5.1. Sensitivity Analysis

Sensitivity analysis means that the output of a model is affected by various input variations, and the model itself is affected by changes in the input. The mathematical implication is that the result of first-order sensitivity as a differential function of the independent variable is a function when function F(x) is differentiable.
S = F j = F x x j
S = Δ F x Δ x j
Equation (10) is the first-order differential sensitivity and Equation (11) is the first-order difference sensitivity.
The general characteristic equation of a system’s vibration is as follows.
High sensitivity means that the influences of the design variable on the optimization objectives are significant. Low sensitivity means that the influences of the design variable on the optimization objectives are minimal. Therefore, during the optimization process, the design variables with high sensitivity were optimized, whereas the design variables with low sensitivity were disregarded. The results of the sensitivity analysis are shown in Figure 9.
As shown in Figure 9, the design variables 2, 4, 5, 12, 16, 17, 18, and 20 exhibit high sensitivity with an absolute value greater than 10. Therefore, the size optimization for the 8 variables was completed, and a design size of 12 variables was reserved.

5.2. Response-Surface Fitting

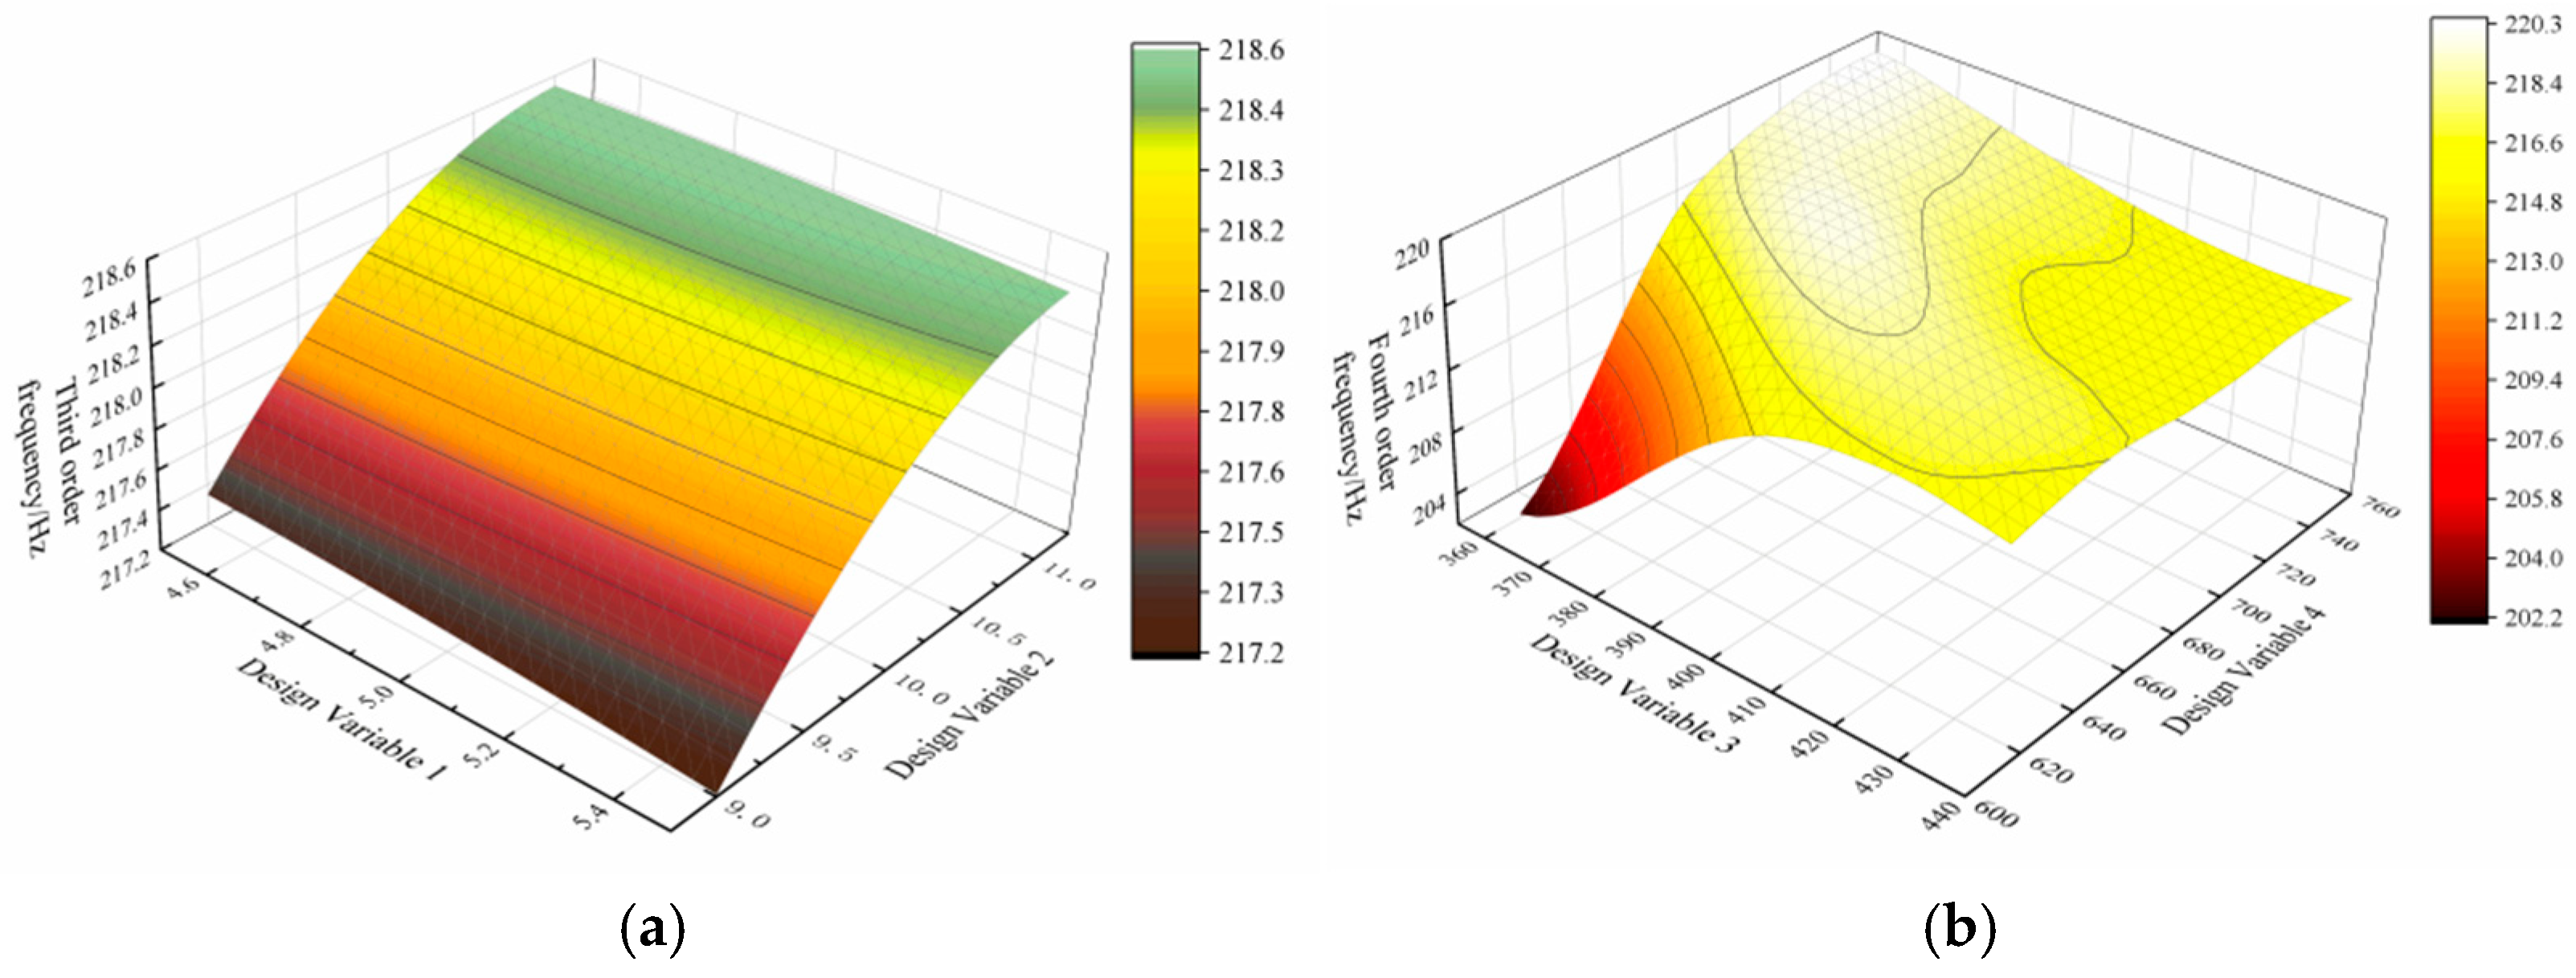
The eight variables with high sensitivity were sampled using a central composite design. For response-surface fitting of the sampling results, the goodness-of-fit indexes for the three optimization objectives of the genetic aggregation method were 1, 0.99, and 0.99, respectively. This indicates that the accuracy of the fitting was greater than 0.9, and the optimization quality was the highest. The response surfaces of the optimization model are shown in Figure 10.

5.3. Optimization Scheme and Evaluation

The multi-objective genetic algorithm (MOGA) was used to optimize the frame structure. The optimized four schemes that were obtained are shown in Table 6.
After optimization, four design schemes of the frame were obtained, which were evaluated to determine the best scheme. Considering the advantages and disadvantages of the evaluation models, the entropy weight method was selected as the solution method for determining the weight. The evaluation objects consisted of five schemes, whereas the evaluation indicators encompassed three optimization objectives. [20,21,22,23,24,25,26,27,28,29,30,31,32,33,34,35,36,37,38,39,40]. The steps are as follows.
The number of evaluation objects and evaluation indicators is m and n, respectively. Therefore, the original matrix B = x 11 x 1 m x n 1 x n m .
where Xij presents the jth index and ith evaluation object (i = 1, 2, …, m; j = 1,2, …, n). The matrix is B = (aij)5×3.
B = 218 254 337 216 252 330 212 254 333 219 253 350 218 252 340
The original matrix B was normalized, and the indicators were divided into positive and negative indicators. A positive indicator indicated that the higher value yielded positive or beneficial effects, whereas a negative indicator suggested the opposite. The value of the third- and fourth-order frequency was a negative indicator. The value of the sixth-order frequency was a positive indicator.
Positive indicator T i j = a i j min O i j max O i j min O i j + 0.1
Negative indicator T i j = max O i j O i j max O i j min O i j + 0.1
The normalized matrix C is as follows:
C = 0.15 0.01 0.36 0.44 1.01 0.01 1.01 0.01 0.16 0.01 0.51 1.01 0.15 1.01 051
The index was calculated to obtain the entropy ej and weight wj:
S = e j = 1 ln m i = 1 n x i j i = 1 n x i j ln x i j i = 1 n x i j
  w i = 1 e i j = 1 m 1 e i
wj = (0.35, 0.37, 0.28). The weight wj of each indicator was 0.35, 0.37, and 0.28, respectively.
The comprehensive score was calculated by using the linear weighting method.
  u i = j = 1 m w j · P i j
The calculated values of ui were 0.08, 0.23, 0.22, 0.21, and 0.24, respectively. According to the analysis results, the order of optimization schemes for the frame of the cotton picker was 4, 1, 2, 3, and the original scheme. Scheme 4 was selected as the best design scheme, and tests were carried out to verify its effectiveness.

5.4. Test Results

Optimized scheme 1 was selected as the design dimension of the frame. The optimized frame model was imported into the ANSYS software, and the modal analysis was conducted under the same boundary conditions. Figure 8 shows the results of the analysis. The frequency of the three optimization objectives of the optimized frame was similar to the results of optimized scheme 1, confirming the reliability of the results for both the optimization process and the optimization algorithm.
The mass of the optimized frame increased from 1805 Kg to 1890 Kg. The fourth-order modal frequency decreased to 252 Hz, and the sixth-order mode frequency increased to 340 Hz. Overall, the optimized frame performed better than the original scheme. As shown in Table 7.

6. Random Vibration Fatigue Analysis Based on Power Spectral Density

The excitation suffered by the cotton picker is usually an irregular and unpredictable signal. Therefore, the analysis of the random vibration fatigue in a frame can accurately predict its fatigue life.
The analysis method for random vibration includes both the time-domain and frequency-domain methods. The time-domain method extracts the response cycle using certain statistical methods based on the obtained structural response time history. It uses the fatigue life (SN) curve to analyze fatigue life. However, it is difficult to obtain a sufficient number of signal samples during the operation, and the time-domain method can easily cause large errors. The frequency-domain method employs the power spectral density of the measured response to predict fatigue life. The power spectral density function encompasses a wide range of statistical information, such as the random stress variance of the signal and amplitude probability distribution [41]. The cumulative fatigue damage is then calculated. Compared to the time-domain method, the frequency-domain method calculates fatigue damage more accurately. Therefore, the frequency-domain method was employed in this paper. The power spectral density function Sx(ω) and the autocorrelation function R(τ) were obtained by using Fourier transform.
  R x τ = l i m 1 t π 2 π 2 x t x t + τ d t  
  S x w = l i m 0 R x τ e ω t d τ
where ω is the vibration frequency; τ is the time difference between the two signals; t is the measurement time.
Steinberg proposed the three-interval method, which is based on Gaussian distribution and linear cumulative damage theory, to analyze the probability of fatigue life [42]. The probability of structural stress in the range of −3σ to +3σ was 97.3%. The probability of the structural stress exceeding the range of −3σ to +3σ was 0.27%. Therefore, any range that exceeded a value of 3σ did not cause damage to the structure. The linear cumulative damage theory was utilized to simplify the calculation formula for fatigue damage. The simplified formula is as follows:
D = n 1 σ N 1 σ + n 2 σ N 2 σ + n 3 σ N 3 σ = 0.6831   V a N 1 σ + 0.271   V a T N 2 σ + 0.0433   V a T N 3 σ
where Va is the average frequency; T is the reaction time of response; Niσ is equal to or lower than the actual number of cycles at the i level (i = 1,2,3). The number of allowable cycles corresponding to the stress level was determined from the fatigue curve. The fatigue life of structural members can be expressed as follows:
T = 1 V a + 0.6831 N 1 σ + 0.271 N 2 σ + 0.0433 N 3 σ
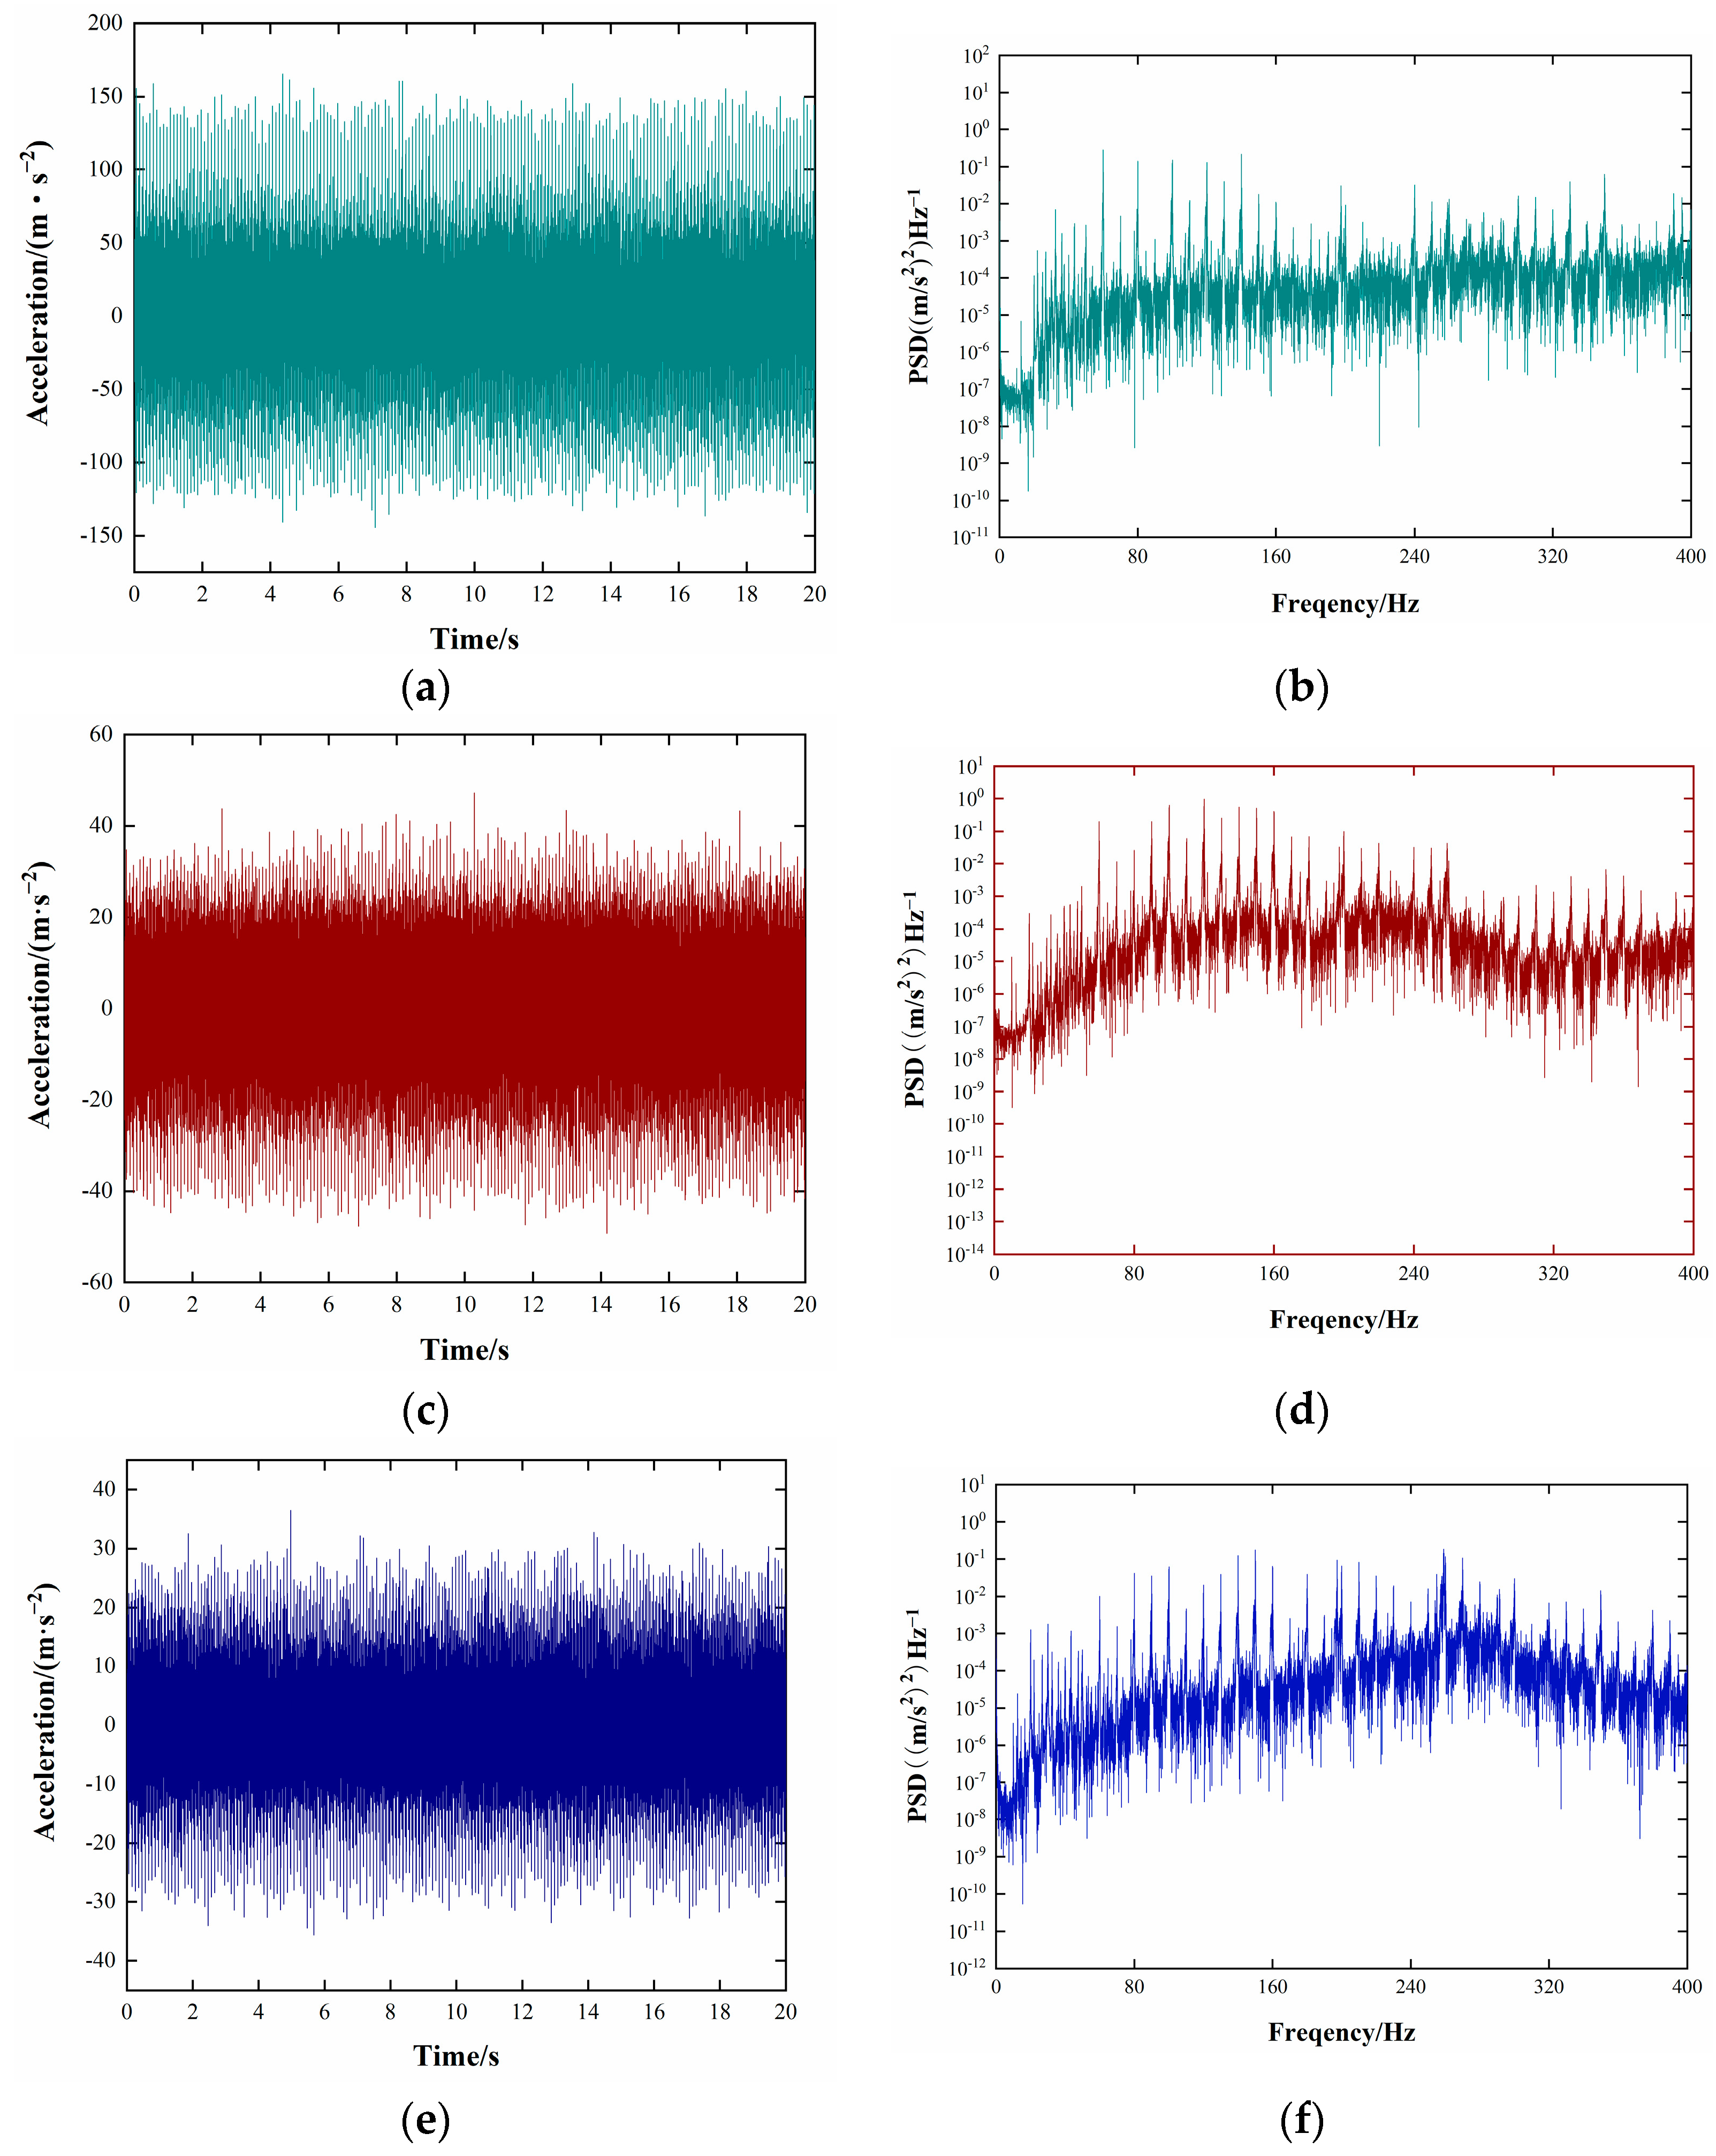
The collection of an accelerated load spectrum provides input for the analysis of frame fatigue and is important to estimate fatigue strength and life. The acceleration signal was acquired in the testing field and the frame of the cotton picker was investigated under three conditions. Combining the installation status of the vibration measuring points on the frame with the root mean square value of all the measuring points, the vibration was the most intense at measuring point 2, which was selected to obtain signals. The signal sampling frequency was 20.48 KHz in the test. The time-domain acceleration signals are shown in Figure 11a, and the acceleration power spectral density (PSD) was obtained using time-frequency conversion, as shown in Figure 11b.
According to the simulation results of random fatigue, a shorter fatigue life occurred in several welding positions. This can be attributed to the higher concentration of stress in these welded parts. Therefore, we enhanced the stability of the structure by reinforcing the supporting bar and increasing the local thickness at the weak points. The fatigue life of the frame was calculated under identical conditions, and the results are shown in Figure 12. The lifespan of the weak points in the frame improved significantly, lasting 7517 hours under extreme conditions.

7. Conclusions

In this paper, the vibration characteristics of a frame on a triplex row-baling cotton picker were analyzed and optimized, considering the actual working requirements. This was achieved using vibration tests and the finite element method. The conclusions are as follows:
(1)
Vibration tests were conducted on the engine, fan, picking head, and nine measuring points on the frame under multiple working conditions. The test results showed that the number of coupled frequencies increased with an increase in the rotary speed. Therefore, the effects of coupled excitation and vibration sources on the frame were the same.
(2)
The root mean square acceleration was calculated based on the data of the nine measuring points. The results showed that the engine had the greatest impact on the frame vibration, followed by the fan and picking head. The severity of the frame vibration was similar under working conditions 1 and 2, but the frame showed the most intense vibration under working condition 3. The vibration direction of the whole frame was mainly concentrated in the X-direction, followed by the Y-direction, and finally the Z-direction.
(3)
An analysis of the finite element mode and test mode of the frame was carried out to solve the first six orders of modal frequency and mode shape. The data error was less than 4%, and the mode shape for each order showed a similar trend. This indicated that the finite element model had high accuracy, and the boundary conditions were set based on the actual conditions.
(4)
The results of the vibration tests and modal frequency analysis indicated significant differences between the excitation frequency and six modal frequencies. On the other hand, the excitation frequency and coupled frequency exhibited minimal differences. The coupled frequencies of 235 Hz, 260 Hz, and 330 Hz were close to the third-order, fourth-order, and six-order modal frequencies. This resulted in the generation of frame resonance. The sensitivity analysis was conducted using three coupled frequencies as the optimization objectives and the wall thickness of the frame as the design variable. Eight variables with high sensitivity were sampled, and the results were fitted. The results of the response surface were optimized using MOGA to obtain four optimization schemes. Based on the estimation of the entropy weight method and the linear weighting method, scheme 4 emerged as the optimal design.
(5)
The vibration acceleration signals of measuring point 4 were collected in the frame under three conditions. The power spectral density function was computed, and the lifespan was determined based on Miner’s law. The lifespan of the frame greatly improved after adding a supporting bar and increasing the local thickness at the weak points. The minimum lifespan of the frame was 7517 hours.

Author Contributions

Conceptualization, J.D., H.L., X.B., G.W., T.P., Z.L. and P.Z.; methodology, J.D., H.L., X.B., G.W. and T.P.; software, J.D. and X.B.; validation, Z.L., P.Z. and F.T.; formal analysis, J.D. and F.T.; investigation, J.D., H.L., X.B, G.W., Z.L. and P.Z.; resources, J.D., X.B, G.W. and T.P.; data curation, J.D., H.L., X.B, G.W., T.P., Z.L. and P.Z.; writing—original draft preparation, J.D., H.L. and G.W.; writing—review and editing, J.D., G.W. and X.B.; visualization, P.Z. and F.T.; supervision Z.L., P.Z. and T.P.; project administration, X.B.; funding acquisition, X.B. All authors have read and agreed to the published version of the manuscript.

Funding

This study was funded by the innovation team construction plan in key areas of Xinjiang Production and Construction Corps (2019CB006) and the major science and technology project of Xinjiang Production and Construction Corps (2018AA008).

Institutional Review Board Statement

Not applicable.

Data Availability Statement

All relevant data presented in this paper are according to institutional requirements and, as such, are not available online. However, all data used in this manuscript are available from the authors upon reasonable request.

Conflicts of Interest

The authors declare no conflict of interest.

References

  1. Jin, X.; Chen, K.K.; Ji, J.T.; Zhao, K.X.; Du, X.W.; Ma, H. Intelligent vibration detection and control system of agricultural machinery engine. Measurement 2019, 145, 503–510. [Google Scholar] [CrossRef]
  2. Wang, Q.S.; Zhou, J.S.; Gong, D.; Wang, T.F.; Chen, J.X.; You, T.W.; Zhang, Z.F. The Influence of the Motor Traction Vibration on Fatigue Life of the Bogie Frame of the Metro Vehicle. Shock Vib. 2020, 2020, 7385861. [Google Scholar] [CrossRef]
  3. An, Q.; Li, F.; Fu, M.H. Influences of Traction Motor Vibration on Bogie Frame Fatigue Strength. J. Southwest Jiaotong Univ. 2010, 23, 209–212. [Google Scholar]
  4. Tang, Z.; Zhang, B.; Wang, M.L.; Zhang, H.T. Damping behaviour of a prestressed composite beam designed for the thresher of a combine harvester. Biosyst. Eng. 2021, 204, 130–146. [Google Scholar] [CrossRef]
  5. Reza, E.; Mohsen, E.; Saeed, Z. Vibration modeling and modification of cutting platform in a harvest combine by means of operational modal analysis (OMA). Measurement 2013, 46, 3959–3967. [Google Scholar]
  6. Chandravanshi, M.L.; Mukhopadhyay, A.K. Modal Analysis of a Vertically Tapered Frame. Int. J. Struct. Stab. Dyn. 2017, 17, 1771001. [Google Scholar] [CrossRef]
  7. Wang, J.; Xu, C.; Xu, Y.; Wang, J.; Zhou, W.; Wang, Q.; Tang, H. Resonance Analysis and Vibration Reduction Optimization of Agricultural Machinery Frame—Taking Vegetable Precision Seeder as an Example. Processes 2021, 9, 1979. [Google Scholar] [CrossRef]
  8. Zhang, H.T.; Tang, Z.; Li, Y.; Liu, X.; Ren, H. Lightweight Threshing Rack under Multisource Excitation Based on Modal Optimization Method. Adv. Mater. Sci. Eng. 2020, 2020, 2029501. [Google Scholar] [CrossRef]
  9. Chen, S.R.; Zhou, Y.P.; Tang, Z.; Lu, S.N. Modal vibration response of rice combine harvester frame under multi-source excitation. Biosyst. Eng. 2020, 194, 177–195. [Google Scholar] [CrossRef]
  10. Gao, D.Y.; Yao, W.X.; Wu, T. Failure analysis on the axial-connected bolts of the thin-walled cylinder under random vibration loading. Eng. Fail. Anal. 2019, 105, 756–765. [Google Scholar] [CrossRef]
  11. Zhang, D.Q.; Chen, Y.Y. Random Vibration Fatigue Life Analysis of Airborne Electrical Control Box. Appl. Sci. 2022, 12, 7335. [Google Scholar] [CrossRef]
  12. Li, X.; Xu, Y.X.; Li, N.P.; Yang, B.; Lei, Y.G. Remaining useful life prediction with partial sensor malfunctions using deep adversarial networks. IEEE-CAA J. Autom. Sin. 2023, 10, 121–134. [Google Scholar] [CrossRef]
  13. Wang, J.W.; Bai, H.C.; Sun, X.B.; Wang, J.L.; Tang, H.; Zhou, W.Q. Design and Dynamic Analysis of Spray Device for Paddy Field Sprayer. Trans. Chin. Soc. Agric. Mach. 2019, 50, 69–79. [Google Scholar]
  14. Lou, S.L. Analysis and Experimental Study on Vibration Characteristics of 3WQF80-10 Oil-Powered Unmanned Helicopter Rack; Chinese Academy of Agricultural Sciences: Beijing, China, 2018. [Google Scholar]
  15. Liu, X.G.; Wu, Z.Y.; Lu, J.; Xu, J.L. Investigation of the effect of rotation speed on the torsional vibration of transmission system. J. Adv. Mech. Des. Syst. Manuf. 2019, 13, JAMDSM0079. [Google Scholar] [CrossRef] [Green Version]
  16. Gao, Z.P.; Xu, L.Z.; Li, Y.M. Vibration measure and analysis of crawler-type rice and wheat combine harvester in field harvesting condition. Trans. Chin. Soc. Agric. Eng. 2017, 33, 48–55. [Google Scholar]
  17. Shen, S.; Ying, H.Q.; Lei, S.H. Modal Test for Yellow River Bridge Exciting with Hammer. J. Vib. Eng. 2000, 13, 492–495, (in Chinese with English abstract). [Google Scholar]
  18. Ayoub, M.; Fernández, D.R.A.; Ahmed, H.; Miguel, I.; Fakher, C.; Fernando, V.; Mohamed, H. Comparison of experimental and operational modal analysis on a back to back planetary gear. Mech. Mach. Theory 2018, 124, 226–247. [Google Scholar]
  19. Douglas, C. Montgomery, Design and Analysis of Experiments, 6th ed.; John Wiley & Sons: Hoboken, NJ, USA, 2007. [Google Scholar]
  20. Wu, G.D.; Duan, K.F.; Zuo, J.; Zhao, X.B.; Tang, D.Z. Integrated Sustainability Assessment of Public Rental Housing Community Based on a Hybrid Method of AHP-Entropy Weight and Cloud Model. Sustainability 2017, 9, 603. [Google Scholar]
  21. Shen, Y.Y.; Chen, D.X.; Zhang, M.Z.; Zuo, T. Fuzzy Comprehensive Safety Evaluation of Pipeline Disaster in China-Russia Crude Oil Permafrost Region Based on Improved Analytic Hierarchy Process-Entropy Weight Method. Adv. Mater. Sci. Eng. 2022, 2022, 3157793. [Google Scholar] [CrossRef]
  22. Yuan, X.Y.; Fan, Y.G.; Zhou, C.J.; Wang, X.D.; Zhang, G.H. Research on Twin Extreme Learning Fault Diagnosis Method Based on Multi-Scale Weighted Permutation Entropy. Entropy 2022, 24, 1181. [Google Scholar] [CrossRef]
  23. Zhang, S.; Wei, W.Z.; Chen, X.L.; Xu, L.Y.; Cao, Y.T. Vibration Performance Analysis and Multi-Objective Optimization Design of a Tractor Scissor Seat Suspension System. Agriculture 2023, 13, 48. [Google Scholar] [CrossRef]
  24. Zhong, X.; Xia, T.; Mei, Q. A Parameter-Adaptive VME Method Based on Particle Swarm Optimization for Bearing Fault Diagnosis. Exp. Technol. 2023, 47, 435–448. [Google Scholar] [CrossRef]
  25. Liu, F.; Wang, H.; Li, W.; Zhang, F.; Zhang, L.; Jiang, M.; Sui, Q. Fault diagnosis of rolling bearing combining improved AWSGMD-CP and ACO-ELM model. Measurement 2023, 209, 112531. [Google Scholar] [CrossRef]
  26. Wang, X.L.; Zheng, J.D.; Ni, Q.; Pan, H.Y.; Zhang, J. Traversal index enhanced-gram (TIEgram): A novel optimal demodulation frequency band selection method for rolling bearing fault diagnosis under non-stationary operating conditions. Mech. Syst. Signal Process. 2022, 172, 109017. [Google Scholar] [CrossRef]
  27. Jing, T.; Huang, D.H.; Mi, Z.; Yao, L.; Liu, X.L. An Intelligent Recognition Method of a Short-Gap Arc in Aviation Cables Based on Feature Weight Enhancement. IEEE Sens. J. 2023, 23, 3825–3836. [Google Scholar] [CrossRef]
  28. Wang, X.; She, B.; Shi, Z.S.; Sun, S.Y.; Qin, F.Q. Condition Monitoring of Mechanical Components Based on MEMED-NLOPE under Multiscale Features. Math. Probl. Eng. 2022, 2022, 3145402. [Google Scholar] [CrossRef]
  29. Laha, S.K.; Swarnakar, B.; Kansabanik, S.; Ray, S. A novel signal denoising method using stationary wavelet transform and particle swarm optimization with application to rolling element bearing fault diagnosis. Mater. Today-Proc. 2022, 66, 3935–3943. [Google Scholar] [CrossRef]
  30. Song, R.W.; Bai, X.L.; Zhang, R.; Jia, Y.; Pan, L.H.; Dong, Z.S. Bearing Fault Diagnosis Method Based on Multidomain Heterogeneous Information Entropy Fusion and Model Self-Optimisation. Shock Vib. 2022, 2022, 7214822. [Google Scholar] [CrossRef]
  31. Zhong, X.Y.; Xia, T.Y.; Zhao, Y.K.; Zhao, X. A frequency-weighted energy operator and swarm decomposition for bearing fault diagnosis. J. Intell. Fuzzy Syst. 2022, 42, 4027–4039. [Google Scholar] [CrossRef]
  32. Hou, B.C.; Wang, D.; Kong, J.Z.; Liu, J.; Peng, Z.K.; Tsui, K.L. Understanding importance of positive and negative signs of optimized weights used in the sum of weighted normalized Fourier spectrum/envelope spectrum for machine condition monitoring. Mech. Syst. Signal Process. 2022, 174, 109094. [Google Scholar] [CrossRef]
  33. Wang, C.L.; Gao, A.; Xuan, J.P. Optimal Demodulation Band Extraction Method for Bearing Faults Diagnosis Based on Weighted Geometric Cyclic Relative Entropy. Machines 2023, 11, 39. [Google Scholar] [CrossRef]
  34. Kong, F.N.; Song, C.; Zhuo, Y.W. Vibration Fault Analysis of Hydropower Units Based on Extreme Learning Machine Optimized by Improved Sparrow Search Algorithm. J. Vib. Eng. Technol. 2022, 11, 1609–1622. [Google Scholar] [CrossRef]
  35. Yang, Z.; Li, Z.Q.; Zhou, F.X.; Ma, Y.J.; Yan, B.K. Weak Fault Feature Extraction Method Based on Improved Stochastic Resonance. Sensors 2022, 22, 6644. [Google Scholar] [CrossRef] [PubMed]
  36. Zhang, K.; Chen, Z.H.; Yang, L.Y.; Liang, Y.C. Principal component analysis (PCA) based sparrow search algorithm (SSA) for optimal learning vector quantized (LVQ) neural network for mechanical fault diagnosis of high voltage circuit breakers. Energy Rep. 2023, 9, 954–962. [Google Scholar] [CrossRef]
  37. Yang, J.Z.; Zhou, C.J.; Li, X.F.; Pan, A.; Yang, T. A Fault Feature Extraction Method Based on Improved VMD Multi-Scale Dispersion Entropy and TVD-CYCBD. Entropy 2023, 25, 277. [Google Scholar] [CrossRef] [PubMed]
  38. Gai, Q.K.; Gao, Y.B.; Huang, L.; Shen, X.Y.; Li, Y.B. Microseismic response difference and failure analysis of roof and floor strata under dynamic load impact. Eng. Fail. Anal. 2022, 143, 106874. [Google Scholar] [CrossRef]
  39. Guo, R.X.; Gong, B. Research on remaining useful life of rolling bearings using EWT-DI-ALSTM. Meas. Sci. Technol. 2022, 33, 095104. [Google Scholar] [CrossRef]
  40. Wang, G.B.; Zhao, S.B.; Zhong, Z.X.; Zeng, D. Research on Shaft Current Damage Identification of Variable Condition Motor Bearings Based on Multiscale Feature Label Propagation and Manifold Metric Transfer. Lubricants 2023, 11, 69. [Google Scholar] [CrossRef]
  41. Aykan, M.; Çelik, M. Vibration fatigue analysis and multi axial effect in testing of aerospace structures. Mech. Syst. Signal Process. 2009, 23, 897–907. [Google Scholar] [CrossRef]
  42. Steinberg, D.S. Vibration Analysis for Electronic Equipment; Wiley: New York, NY, USA, 1988. [Google Scholar]
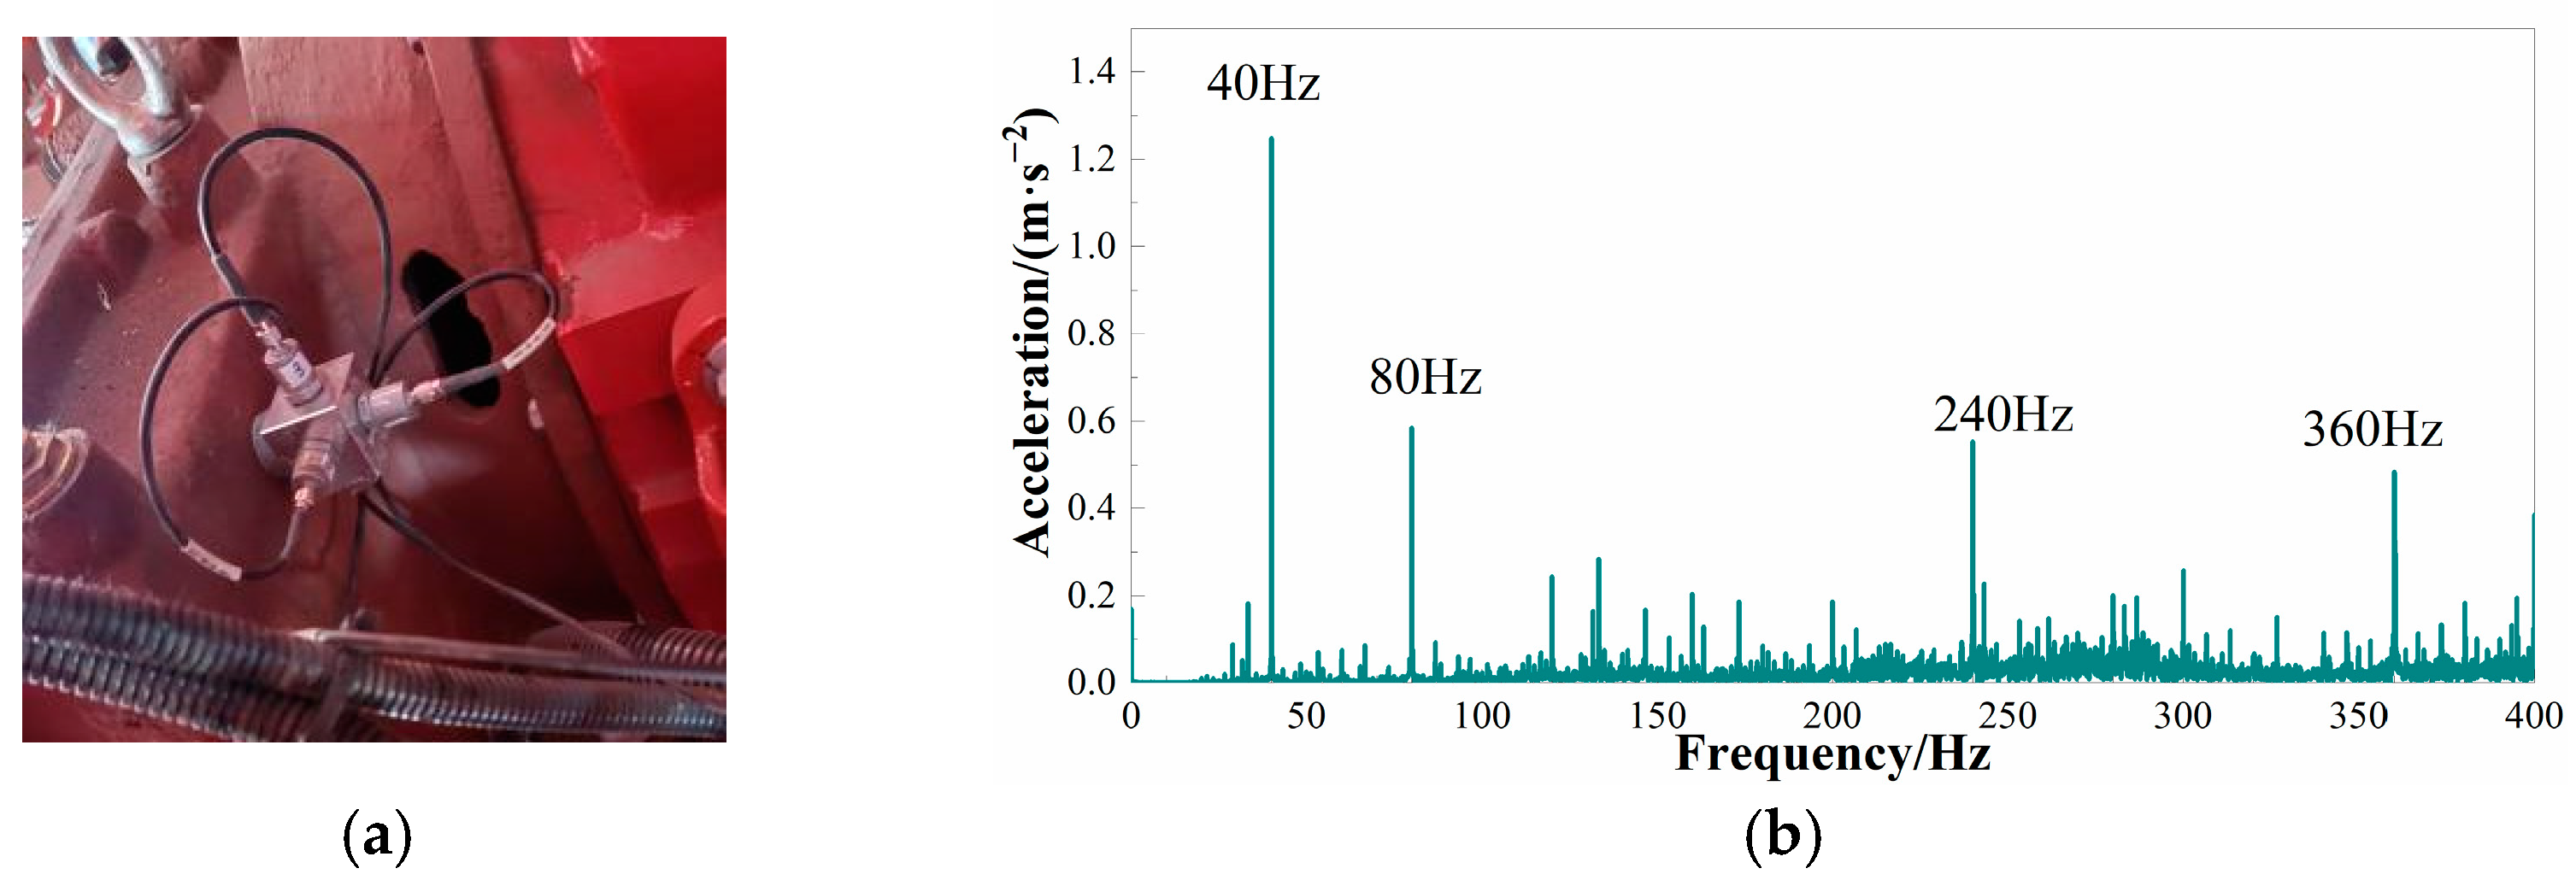
Figure 1. (a) Signal acquisition of the engine; (b) frequency-domain spectrum of the engine.
Agriculture 13 01440 g001
Figure 2. (a) Test fan; (b) frequency-domain diagram of the fan.
Agriculture 13 01440 g002
Figure 3. (a) Picking head; (b) frequency-domain diagram of first gear; (c) frequency-domain diagram of second gear; (d) frequency-domain diagram of third gear.
Agriculture 13 01440 g003
Figure 4. Installation position of the measuring points. (a) 2 measuring points; (b) 5 measuring points; (c) 6 measuring points.
Agriculture 13 01440 g004
Figure 5. (a) First-order finite element mode; (b) second-order finite element mode; (c) third-order finite element mode; (d) fourth-order finite element mode; (e) fifth-order finite element mode; (f) sixth-order finite element mode.
Agriculture 13 01440 g005
Figure 6. (a) Experimental modal; (b) distribution of measuring points; (c) test schematic diagram.
Agriculture 13 01440 g006
Figure 7. (a) Coherence function curve; (b) modal assurance parameter diagram.
Agriculture 13 01440 g007
Figure 8. Comparison of the mode shapes of FEM and EMA results. (a) First-order test mode; (b) second-order test mode; (c) third-order test mode; (d) fourth-order test mode; (e) fifth-order test mode; (f) sixth-order test mode.
Agriculture 13 01440 g008aAgriculture 13 01440 g008b
Figure 9. The results of sensitivity analysis.
Agriculture 13 01440 g009
Figure 10. Partial response surfaces. (a) Response surface of design variables 1 and 2 and third-order frequency; (b) Response surface of design variables 4 and 5 and fourth-order frequency.
Agriculture 13 01440 g010
Figure 11. Time-domain signals at measuring points. (a) Time-domain signals at measuring point 2. (b) Power spectrum. (c) Time-domain signals at measuring point 2Y. (d) Power spectrum. (e) Time-domain signals at measuring point 2Z. (f) Power spectrum.
Agriculture 13 01440 g011
Figure 12. The lifespan of the frame.
Agriculture 13 01440 g012
Table 1. Vibration frequencies of the main excitation sources.
Main Excitation SourceGearRotating Speed/(r/min)Vibration Frequency/Hz
engine180040, 80
2120060, 120
32000100, 200
Fan1170028
2260043
3430071
picking head1, 2 220~250
300~350
3350~400
Table 2. Root mean square values of the measuring point/m/s-2.
Measuring PointsCondition 1Condition 2Condition 3
XYZXYZXYZ
14.11.35.45.71.76.817.63.410.4
25.63.02.37.64.53.122.613.59.1
34.12.25.97.23.09.311.67.216
43.63.53.45.16.25.115.1169.6
54.03.23.24.95.14.99.21311.6
63.44.51.44.57.12.388.16.4
73.101.51.84.11.41.882.63.4
83.41.11.44.111.79.43.73.3
931.71.241.71.48.94.93.2
Table 3. Main frequencies of the measuring points/Hz.
Measuring PointsPeak SequencesCondition 1Condition 2Condition 3
XYZXYZXYZ
11808080360260360200200200
24024024060360260235300300
212408024060120260235200200
28040401206060200100100
31802404060260260235200200
2404080120120160150100100
41808080160160160150200165
2404040120120260200100100
51808080260120260235165200
22602604060260160200100165
61808040100120120200200200
21301208026060260100100165
71808080260260260330100330
212012040120120120100165235
8124080240260120260235100100
2802404012060100200200200
91808080260260120300235100
22404024032012060235330235
Table 4. Material attributes.
Density (ρ/kg·m-3)7850
Young’s modulus (pa)2.06 × 10¹¹
Poisson’s ratio (μ)0.3
Tensile strength σb (MPa)490–675
Yield strength σs (MPa)345
Elongation (δ/%)22
Table 5. Modal analysis of FEM and EMA results.
FEA Modal ResultsTest Modal ResultsError/%Mode
OrderFrequency/
Hz
OrderFrequency/Hz
114211392.1Homonymous bending of the frame bends along the Z-axis
218421903.1Reversed bending and torsion of the frame along the X-axis
321832211.3Homonymous bending and torsion of the frame along the X-axis
425442591.9Reversed bending and torsion of the frame along the Z-axis
529952912.6Reversed bending of the frame along the X-axis
633763331.1Homonymous bending of the frame bends along the Z-axis
Table 6. Optimization and design schemes.
Original Size/mmOptimum Proposal
Scheme 1Scheme 2Scheme 3Scheme 4
Design Variable154.55.24.55.5
2109910.59
3400440440360380
4680735750620650
510999.59.5
61099.51011
7130142142121142
81011101011
Optimization ObjectivesThird-order frequency/Hz218216212219218
Fourth-order frequency/Hz254250250253252
Sixth-order frequency/Hz337330333350340
Table 7. Comparison of the parameters before and after optimization.
Original SchemeOptimized Scheme
Quality1805 kg1890 kg
1 mode frequency/Hz142142
2 Mode frequency/Hz184179
3 Mode frequency/Hz218218
4 Mode frequency/Hz254252
5 Mode frequency/Hz299287
6 Mode frequency/Hz337340
Disclaimer/Publisher’s Note: The statements, opinions and data contained in all publications are solely those of the individual author(s) and contributor(s) and not of MDPI and/or the editor(s). MDPI and/or the editor(s) disclaim responsibility for any injury to people or property resulting from any ideas, methods, instructions or products referred to in the content.