Article

Research on the Level of Agricultural Green Development, Regional Disparities, and Dynamic Distribution Evolution in China from the Perspective of Sustainable Development

1
School of Economics, Hunan Agricultural University, Changsha 410000, China
2
School of Management, Suzhou University, Suzhou 234000, China
*
Author to whom correspondence should be addressed.
Agriculture 2023, 13(7), 1441; https://doi.org/10.3390/agriculture13071441
Submission received: 11 June 2023 / Revised: 16 July 2023 / Accepted: 19 July 2023 / Published: 21 July 2023
(This article belongs to the Section Agricultural Economics, Policies and Rural Management)

Abstract

:
Green development is a concept of sustainable development, aiming to protect the environment and ecosystems while meeting economic development needs. In the field of agriculture, green development has emerged as a crucial pathway for reconciling the conflicts between agricultural development and ecological conservation. To investigate the level of green development in Chinese agriculture, regional variations, and the evolutionary patterns, this paper is based on the framework of sustainable development theory. This study establishes a comprehensive evaluation system for agricultural green development and applies methods such as entropy-weighted TOPSIS, Dagum’s Gini coefficient, kernel density estimation, Moran’s I index, and Markov chains to analyze the level of agricultural green development, regional disparities, and dynamic evolution in China. The findings of this study reveal that: (1) The overall level of agricultural green development in China is steadily improving, with notable differences in the level of agricultural green development among different regions and provinces. There are significant disparities in agricultural green development between regions, and the overall disparities exhibit a fluctuating downward trend characterized by periods of increase followed by decrease. The regional disparities are identified as the primary cause of the overall disparities in agricultural green development in China. (2) The eight major economic regions in China are experiencing steady development in agricultural green practices, but there are varying degrees of polarization due to different development speeds. (3) This study also highlights a clear spatial positive correlation in the level of agricultural green development in China, with most provinces showing clustering in the first and third quadrants, indicating a “high–high” (H-H) and “low–low” (L-L) agglomeration pattern. (4) The study reveals that the level of agricultural green development in China exhibits a certain degree of stability. Over time, the probability of transitioning from lower-level regions to neighboring higher-level regions increases, and the agricultural green development level in neighboring regions can influence the spatial transfer probability within a given region. Therefore, agricultural green development demonstrates significant spatial dependence.

1. Introduction

In recent decades, with the continuous growth in the global population and the rapid development of the economy and society, human activities have had a tremendous impact on the Earth’s environment and ecosystems. The conventional economic development model has focused solely on maximizing current benefits and short-term economic growth, leading to the excessive consumption of natural resources and the emission of waste, while neglecting the importance of environmental protection and resource conservation. This has resulted in global-scale climate change and frequent natural disasters, posing increasingly severe ecological challenges to human survival and development [1]. In the face of the escalating environmental problems and the challenges of sustainable development, the concept of green development, which emphasizes the coordinated development of economic growth and environmental protection, has garnered growing attention and recognition. The United Nations’ Sustainable Development Goals (SDGs) have incorporated green development into the global development agenda, with 56 out of 169 specific goals directly related to the green economy [2]. The International Energy Agency (IEA) is dedicated to promoting green economic growth through initiatives such as publishing global reports on green economic growth, providing policy recommendations, and supporting technological cooperation to strengthen international collaboration and foster green economic development [3]. Currently, as the global ecological environment continues to deteriorate, global agricultural development faces a series of challenges related to land degradation, water scarcity and pollution, as well as food insecurity. These challenges have a significant impact on global food security and pose a major threat to the sustainable development of agriculture.
China, as a major agricultural nation, continues to hold a significant position in the national economy. Since the introduction of economic reforms and opening up, China’s agricultural economy has experienced rapid growth. The agricultural gross value added has increased from CNY 102.75 billion in 1978 to CNY 7.834 trillion in 2021, while grain production has risen from 609.5 billion jin in 1978 to 1.3657 trillion jin in 2021. With just 7% of the world’s arable land, China manages to feed 21% of the global population, achieving remarkable accomplishments in agricultural development [4]. However, the rapid development of Chinese agriculture has also led to increasingly prominent ecological issues, such as land degradation, the eutrophication of water bodies, and excessive carbon emissions [5]. The traditional extensive development model, which relied on input-driven agricultural growth, is no longer sustainable. To address the challenges of sustainable agricultural development, China considers green development in agriculture as a crucial pathway to ensure food security and protect the ecological environment [6]. In July 2018, the Ministry of Agriculture and Rural Affairs published the “Technical Guidelines for agricultural green development. (2018–2030),” which promotes the application of green production technologies throughout the agricultural production process, including green inputs, green production techniques, and post-production value-added technologies. Since 2017, the central government of China has consistently emphasized the acceleration of green agricultural prevention and control technologies, the promotion of agricultural input reduction and efficiency improvement technologies, and the establishment of agricultural green development pilot zones and experimental bases. These measures aim to conserve agricultural resources, protect the ecological environment, and shift agricultural production from quantity-oriented to quality- and efficiency-oriented production. The 19th National Congress of the Communist Party of China highlighted the need to transition from traditional agricultural development models to ecologically oriented agricultural production models and elevated the importance of agricultural green development to a national strategic level.
Agricultural green development embodies a conceptual and practical approach that seeks to achieve agricultural production through a sustainable, resource-efficient, and environmentally harmonious paradigm. The essence of agricultural green development lies in its emphasis on minimizing the depletion of natural resources and mitigating the adverse environmental impacts to the utmost extent during the agricultural production process. Simultaneously, it aims to enhance the quality of agricultural products and optimize the efficiency of agricultural production, leading to increased benefits and prosperity. As a comprehensive and systematic endeavor, agricultural green development encompasses a wide range of areas. Gaining a comprehensive and systematic understanding of the state of agricultural green development, is an important prerequisite and foundation for promoting its progress [7]. Measuring and analyzing the level of agricultural green development aids in monitoring and evaluating the environmental impact of agricultural activities while ensuring the sustainability of agricultural systems. It helps achieve goals related to ecosystem protection, efficient resource utilization, and future development. Additionally, measuring and analyzing the level of agricultural green development provides scientific evidence and guidance for policymakers. The application of evaluation frameworks can provide relevant information for agricultural policy formulation and decision-making, facilitating the harmonization of agricultural development with environmental sustainability, social equity, and economic growth. Therefore, research on measuring the level of agricultural green development is highly necessary.
Currently, within the academic community, there are three main approaches to measuring and analyzing the level of agricultural green development: calculating green total factor productivity [8,9,10], estimating agricultural carbon emissions [11,12,13], and calculating the comprehensive indices of agricultural green development [14,15,16]. Existing research outcomes in this field are significant for exploring green development, offering valuable insights for the direction of this study. However, the existing measures and analyses of agricultural green development. in the academic community also have certain limitations and shortcomings. Agricultural green development encompasses various aspects such as the ecological environment, resource utilization efficiency, economic benefits, and social benefits. Some scholars have adopted one-dimensional measurement indicators, such as green total factor productivity and agricultural carbon emission efficiency, which may have certain biases. The construction of comprehensive evaluation frameworks for agricultural green development by some researchers lacks theoretical framework support and may have inadequate theoretical basis. Furthermore, some scholars have only conducted the measurement and evaluation of the level of agricultural green development through their evaluation frameworks, without conducting systematic research and analysis on the regional disparities, spatial dynamics, and state transitions of agricultural green development in China. As a result, the comprehensive regional disparities, spatial differentiation, and evolutionary characteristics of agricultural green development in China cannot be fully reflected.
Considering these factors, this paper constructs a research framework for agricultural green development based on the perspective of sustainable development. The framework encompasses five dimensions: resource conservation, ecological stability, clean production, supply security, and efficiency enhancement, forming an evaluation system for agricultural green development. This paper measures the level of agricultural green development in 31 provinces of China from 2003 to 2020 and analyzes the current state of agricultural green development at the national level, focusing on eight major economic regions and provincial levels. The Dagum Gini coefficient and its decomposition method are utilized to measure and analyze regional disparities in agricultural green development across the country, with an examination of their spatial variations. Kernel density estimation, Moran’s I index, and Markov chains are employed to investigate the distribution dynamics and evolutionary trends of agricultural green development in China from temporal, spatial, and transitional probability perspectives, offering a comprehensive understanding of the status of agricultural green development in the country.

2. Literature Review

Agriculture, as the foundation of human socio-economic development, holds paramount importance in maintaining social stability and achieving economic growth. Emphasizing sustainable agricultural production methods, agricultural green development aims to protect and enhance the agricultural ecosystem, while promoting improvements in the quality of agricultural products and production efficiency. The core objective of agricultural green development lies in achieving sustainable agriculture, ensuring that agricultural production meets human needs while safeguarding natural resources and the environment. Moreover, as a comprehensive undertaking, agricultural green development encompasses a wide range of aspects, including the conceptual framework, connotation, influencing factors, evaluation measures, and developmental pathways. Academic circles have extensively explored agricultural green development from various perspectives, providing valuable insights and theoretical references for this study. By synthesizing existing literature on agricultural green development at both the domestic and international levels, this paper categorizes the relevant research into the following aspects:

2.1. Research on the Connotation of Agricultural Green Development

From the perspective of academic research, there is currently no unified understanding of the connotation of agricultural green development. It is widely recognized as a profound transformation in the agricultural development perspective and a long-term systematic endeavor. At present, the definition of the connotation of agricultural green development remains diverse in academia. Kansanga et al. (2019) defined agricultural green development as a process that respects natural laws, utilizes advanced scientific and technological means, explores sustainable agricultural development, and achieves the harmonious integration of economic, social, and ecological benefits to mitigate the adverse impacts of climate change [17]. Alsanius et al. (2019) suggested that agricultural green development involves the use of innovative technologies to address agricultural environmental issues and maximizes the utilization of local sustainable resources. It encompasses not only climate change and greenhouse gas reduction but also broader environmental sustainability concerns [18]. Gargano et al. (2021) viewed agricultural green development as the application of various professional skills to promote cleaner production in the agricultural sector and facilitate the ecological transformation of agriculture [19]. Huang et al. (2022) regarded agricultural green development as an extension and practice of the green development concept in the agricultural field. Its primary objectives are to deepen and sustain the development of sustainable agriculture, affirm and integrate ecological and green agricultural models, and embody features such as a low carbon footprint, economic viability, and safety [20]. Liu et al. (2022) described agricultural green development as a comprehensive undertaking that encompasses six aspects: the greenization of the entire process, including agricultural production layout, resource utilization, technological means, industrial systems, agricultural product supply, and consumption [21]. Zhang et al. (2021) defined agricultural green development as a process that respects natural laws, utilizes advanced scientific and technological means, explores sustainable agricultural development, and achieves the harmonious integration of economic, social, and ecological benefits [22]. Wang et al. (2021) perceived agricultural green development as a new development concept that aims to undertake sustainable development, relies on the establishment of green institutions and innovative mechanisms, and realizes the greenization of the entire process and all aspects of agricultural production [23]. Hou et al. (2022) consider agricultural green development as an extension and practice of the green development concept in the agricultural field, with the primary objectives of deepening and sustaining the development of sustainable agriculture, affirming and integrating ecological and green agricultural models, and embodying features such as a low carbon footprint, economic viability, and safety [24]. Huang et al. (2022) portrayed agricultural green development as a comprehensive undertaking that involves the greenization of the entire process, including the agricultural production layout, resource utilization, technological means, industrial systems, agricultural product supply, and consumption [20].

2.2. Research on Factors Influencing Agricultural Green Development

By means of a literature review, the factors influencing agricultural green development can be categorized into economic, policy, technological, and other factors. In terms of economic factors, Luo et al. (2023) assessed the green total factor productivity of agriculture using a non-radial and non-angular super-efficiency measurement model. Their study examined the impact of agricultural production agglomeration on green total factor productivity in agriculture and found an inverted U-shaped relationship between agricultural production agglomeration and green total factor productivity [25]. Saghaian (2022) employed panel data from 23 developed countries and 43 developing countries to empirically analyze the impact of agricultural product exports on environmental quality. This study revealed that the expansion of agricultural product export trade had adverse effects on the environmental quality of developing countries but reduced environmental pollution, such as N2O emissions, in developed countries [26]. Xu et al. (2021) investigated the relationship between trade openness, agricultural trade, and agricultural carbon emissions using a panel threshold model. The study found a significant single threshold effect of agricultural trade openness on agricultural carbon emissions [27]. Ge et al. (2023) measured China’s green total factor productivity (AGTFP) and agricultural labor surplus using the SBM-DDF–Luenberger method. They empirically examined the heterogeneous effects of urbanization on the efficiency of agricultural green development. The results showed that both household registration urbanization and permanent population urbanization significantly promoted the efficiency of agricultural green development, although the former had a smaller effect [28]. Ben Jebli M (2017) studied the relationship between agricultural product trade and agricultural sustainability using a vector error correction model (VECM) and Granger causality. The research concluded that international trade can optimize the allocation of development resources in the agricultural sector and reduce agricultural resource and environmental pollution [29]. Meanwhile, Wein ZJ (2018) used a mixed multi-regional input–output (MRIO) approach to examine the relationship between agricultural product trade and agricultural ecological environment. The findings indicated that agricultural product trade had a negative impact on agricultural green development to a certain extent [30].
In terms of policy factors influencing agricultural green development, Du et al. (2023) conducted an empirical study using panel data from Chinese prefecture-level cities between 2011 and 2020. They employed a difference-in-differences model to construct a quasi-natural experiment and investigated the impact of policies on agricultural carbon emissions. The research found that environmental protection policies significantly reduced agricultural carbon emissions by reducing emission sources [31]. Sun et al. (2022) measured the impact of environmental regulations on green total factor productivity in agriculture across 30 provinces and cities in China using a partially linear coefficient panel model. This study revealed that the impact of environmental regulations on green total factor productivity in agriculture was limited when the regional economic development level was low. However, as the regional economic development level gradually increased, the influence of environmental regulations on green total factor productivity in agriculture became more significant [32]. Wang et al. (2022) simulated the impact of various government policies on agricultural green development using a system dynamics model. They found that government policies for green development played a significant role in improving ecological benefits in agriculture [33]. Xu et al. (2022) investigated the interactive effects of environmental regulation and fiscal support for agriculture on agricultural green development using provincial panel data from China. Their study concluded that the interaction between environmental regulation and fiscal support for agriculture had a positive spatial spillover effect on agricultural green development [34].
In terms of technological factors influencing agricultural green development, Lin et al. (2023) conducted a study using interprovincial data from China. They employed the entropy method and SBM-GML index to investigate the impact of digital technology on green total factor productivity in agriculture. The research found that digital technology in agriculture can effectively promote green growth through green technological innovation, agricultural scale management, and the optimization of agricultural planting structures [35]. Zhu et al. (2022) analyzed the impact of agricultural mechanization on green total factor productivity (GTFP) in crop production using panel data from 30 provinces in China. They employed a stochastic frontier analysis based on the output-oriented distance function and found that agricultural mechanization significantly promoted green total factor productivity in crop production. As the level of mechanization increases, the promotion effect on green total factor productivity becomes more evident [36]. Zhang et al. (2022) studied the influence of agricultural technological innovation on agricultural green development from the perspectives of factor spillover pathways and product spillover pathways. The research revealed that the level of agricultural technological innovation not only improves the level of agricultural green development within a region but also promotes the agricultural green development of neighboring areas through positive spillover effects [37].
In terms of financial service factors influencing agricultural green development, Gao et al. (2022) used the GML model to measure the green total factor productivity (GTFP) in 30 provinces in China. They explored the impact of digital inclusive finance on GTFP in agriculture and its mechanisms. The research found that digital inclusive finance can indirectly help improve GTFP in agriculture by promoting agricultural technological innovation and optimizing industrial structure [38]. Hou et al. (2022) studied the role and effects of agricultural insurance on agricultural green development from an insurance perspective. The results indicated that agricultural insurance had a restraining effect on agricultural green development in China, and the impact of agricultural insurance on agricultural green development varied across different regions [39]. In contrast, Fang et al. (2021) used the SBM-GML index model based on provincial panel data from China to measure green total factor productivity in agriculture and analyzed the impact and mechanisms of agricultural insurance on GTFP. The study found that agricultural insurance significantly improved GTFP by expanding the scale of agricultural business [40]. Mei et al. (2020) conducted a sample survey to examine the constraining role of finance in agricultural green development. The research revealed that finance had a certain degree of inhibition on agricultural green development, necessitating financial reform to alleviate its inhibitory effects on agricultural green development [41].

2.3. Research on the Pathways to Achieve Agricultural Green Development

Existing research in academia suggests that, under the traditional agricultural development model, excessive resource consumption and severe environmental pollution have rendered agriculture unsustainable. It is essential to comprehensively explore paths to agricultural green development, encompassing agricultural technological innovation, institutional reforms, and management models, in order to promote sustainable agricultural development goals. Jiang et al. (2022) proposed the use of organic fertilizers and biological pest control methods to protect crop health and reduce environmental pollution in agricultural production [42]. Xiu et al. (2023) suggested assisting farmers in adopting agricultural water-saving irrigation technologies such as drip irrigation, sprinkler irrigation, and rainwater harvesting to reduce water wastage and improve water use efficiency in agriculture [43]. Tan et al. (2023) proposed integrating crop cultivation and livestock farming, utilizing crop straw as feed or organic fertilizer and utilizing livestock manure as fertilizer for crops to achieve agricultural ecological recycling [44]. Luo et al. (2023) proposed establishing a tripartite cooperation model among agricultural enterprises, universities, and governments to promote agricultural technological innovation, develop new agricultural production techniques and management models, and enhance agricultural productivity and reduce the negative environmental impacts of agricultural production [45]. Qian et al. (2021) suggested implementing ecological engineering measures such as vegetation restoration, soil improvement, and soil and water conservation to restore the ecological functions of farmland, improve the quality of arable land resources, and enhance the ecological environment [46]. Zou et al. (2022) emphasized the promotion of the resource utilization of agricultural waste, such as utilizing crop straw and livestock manure for the production of biomass energy to reduce the emission of agricultural waste [47].
Lei et al. (2023) proposed the formulation of policies to address agricultural development issues such as the misallocation of agricultural capital, labor, and land with low efficiency. The government should prioritize the regional allocation of agricultural production factors and adopt a green production-oriented agricultural production concept to promote the transformation and upgrading of the agricultural industry structure and the application of green agricultural technologies, thereby facilitating agricultural green development [48]. Liu, D. et al. (2021) suggest accelerating the implementation of clean agricultural production, increasing investment in agricultural science and technology research and development, establishing a more open platform for foreign trade, expanding the level of agricultural openness, and formulating policies to promote the deep integration of industry and agriculture, all aimed at enhancing green total factor productivity in agriculture [49]. Jiang et al. (2022) propose leveraging the development of the digital economy to achieve the integration of digital technology and agricultural production. The government should fully leverage the radiating role of the digital economy, share its dividends, and vigorously implement the digital economy development strategy to bridge the digital divide between regions. Policies should be implemented to drive the construction of rural digital infrastructure and empower agricultural green development through digital economic development [50]. Mo et al. (2023) suggested actively developing green finance to achieve goals such as optimizing the agricultural industry structure and promoting agricultural technological progress, thus promoting the sustainable development of Chinese agriculture [51].

2.4. Research on the Measurement of Agricultural Green Development Level

Constructing evaluation indicators for agricultural green development is an important method for quantitatively assessing and evaluating the level of agricultural green development. The construction of an evaluation system for agricultural green development is also a prerequisite for exploring paths and designing institutions to promote agricultural green development. Currently, there are two main approaches in academia for measuring the level of agricultural green development. The first approach involves measuring with single indicators, primarily including the green total factor productivity in agriculture and agricultural carbon intensity. Green total factor productivity in agriculture measures the level of greening in the agricultural production process based on productivity improvement and reduced resource consumption. A higher value of green total factor productivity indicates a higher level of agricultural green development. Measurement models such as non-radial directional distance function models with global benchmarks and Luenberger productivity indices are used to assess the level of agricultural green development [25,38,40,52,53,54,55,56]. On the other hand, agricultural carbon intensity measures the degree of greening in agriculture from the perspective of reducing emissions from agricultural non-point source pollution. A smaller agricultural carbon emissions value represents a higher level of agricultural green development. The carbon emissions from agriculture are examined based on a broad agricultural scope, reflecting the level of agricultural green development [57,58,59,60,61,62,63,64].
The second approach involves measuring the level of agricultural green development from multiple dimensions. As agricultural green development is a comprehensive system, involving complex content, constructing a comprehensive evaluation indicator system for agricultural green development can encompass richer information. Chen et al. (2023) constructed 15 evaluation indicators for the agricultural green development from three dimensions: socio-economic, technological progress, and resource environment. They used the entropy weight comprehensive evaluation method to measure the level of agricultural green development [65]. Liu et al. (2020) constructed an evaluation indicator system for green agricultural production from five dimensions: agricultural supply capacity, resource utilization, environmental quality, ecosystem maintenance, and farmers’ livelihoods. They used data from the Chinese Agricultural Census and statistical data from the National Statistical Yearbook to assess and analyze the level of green agricultural production. They provided suggestions for optimizing paths and upgrading green agricultural production in China [66]. Wan et al. (2023) measured the level of agricultural green development in China from four dimensions: policy greenness, industry greenness, technological greenness, and awareness greenness. They combined the Gini coefficient with the hesitant fuzzy multi-attribute decision-making method to analyze the state of agricultural green development in China [16]. Wang et al. (2021) adopted a new perspective based on the symbiosis of agricultural ecosystems to construct an evaluation indicator system for agricultural green development, including green production, green innovation, green ecological protection, and green economy. They measured and analyzed the level of agricultural green development in the Ili River Basin in China [23]. Liu, Y. et al. (2019) used panel data on agricultural production in China and constructed a five-dimensional indicator system for sustainable agricultural green development based on the population, social, economic, environmental, and resource dimensions. They used the entropy value method and coordination degree method to study the spatiotemporal dynamics and coordination of China’s agricultural green development index [67].
In summary, it can be seen that the academic community has made rich research achievements in the field of agricultural green development, and some important research findings have been obtained, which provide valuable references for this study. However, there are still some limitations. Firstly, there is no unified definition of the concept of agricultural green development in the academic community. Some scholars lack theoretical basis in defining agricultural green development, and the distinction and connection between agricultural green development and sustainable agricultural development are not clearly addressed. Furthermore, as agricultural green development is a comprehensive system, involving a wide range of content, measuring the level of agricultural green development solely through green total factor productivity and agricultural carbon intensity has certain limitations. Some scholars constructing comprehensive evaluation indicator systems for agricultural green development lack theoretical frameworks, and the selection of indicators may be subjective. Moreover, some scholars only conduct the simple measurement and evaluation of agricultural green development in China using indicator systems, without conducting systematic research and analysis on the regional differences, spatial evolution, and state transitions of agricultural green development in China, thus failing to fully reflect the level, regional differences, spatial variations, and evolutionary characteristics of agricultural green development in China. Finally, in terms of regional division and comparison, some scholars only divide China into simple categories such as “east, central, and west” or “grain-producing and non-grain-producing areas,” neglecting the vast territory and diverse ecological environments in China, which leads to a lack of consideration of the differential impacts of ecological environmental differences on the level of agricultural green development in different regions.
Based on these considerations, this study aims to construct a comprehensive evaluation system for agricultural green development based on the theory of sustainable agricultural development. In accordance with the standards of the eight comprehensive economic regions published by the Development Research Center of the State Council of China, which are more aligned with regional economic and social development as well as geographical and environmental characteristics, this study adopts these eight economic regions as the basis for regional division. This division is considered to be more reasonable. This study will employ various methods, including entropy value and the TOPSIS weighting method, Dagum Gini coefficient and its decomposition method, kernel density estimation method, Moran’s I index method, and Markov chain method to analyze the regional differences, their sources, and the spatiotemporal dynamic evolution trends of agricultural green development in China. By systematically studying and analyzing the situation of agricultural green development in China, this study aims to further enrich the research framework and content of agricultural green development, and provide references for relevant stakeholders in formulating decisions on agricultural green development.

3. Theoretical Analysis

3.1. Theoretical Analytical Framework Based on Sustainable Development Theory

The concept of sustainable development emerged in the 1960s [68]. In 1972, the international academic organization “Club of Rome” published the report “The Limits to Growth,” which provided an in-depth analysis of the significance of natural resources and the environment in economic development, as well as the complex relationship between population and resources. It raised an alarm about the limits of economic growth due to limited resources and sparked a worldwide wave of environmental protection [69]. In 1980, the International Union for Conservation of Nature (IUCN) published the report “World Conservation Strategy”, which provided a more systematic explanation of the theory of sustainable development. The connotation and definition of sustainable development lie in achieving development that meets the needs of the present generation without compromising the ability of future generations to meet their own needs. It mainly encompasses three aspects: sustainable development at the economic level, the social level, and the resource and environmental level [70]. The ultimate goal of sustainable development theory is to achieve common, coordinated, fair, efficient, and multidimensional development, fostering the harmonious development between humans and the natural environment [71]. Sustainable development theory is a theoretical framework that aims to achieve sustainable development in three dimensions: society, economy, and the environment. It emphasizes meeting current needs while not compromising the ability of future generations to meet their own needs. Based on an understanding of resource limitations, environmental pressures, and social equity, sustainable development theory seeks to strike a balance between social and economic development and environmental protection [72]. The scope of sustainable development theory includes the coordination of economic development and environmental protection, rational resource utilization and renewable resources, social equity, and inclusiveness, and the protection of ecosystems and biodiversity.
The theory of sustainable development incorporates economic, social, and environmental factors, which is crucial when studying issues related to the green development of agriculture. By constructing an evaluation framework for Agricultural Green Development based on the theory of sustainable development, we can systematically consider economic, social, and environmental factors, ensuring comprehensive and systematic assessments. Furthermore, sustainable development theory emphasizes a long-term perspective and the impact of current actions on future generations. It advocates for efficiency in economic development, which is an important consideration in researching agricultural green development. Moreover, sustainable development theory emphasizes social justice and inclusiveness, which are also crucial in the evaluation of agricultural green development. It requires the harmonization of agricultural production with the environment, reducing pollution and resource consumption, and preserving the sustainability of the ecological environment. Therefore, employing a sustainable development-based evaluation framework for assessing the level of agricultural green development allows for a more comprehensive and integrated consideration of economic, social, and environmental factors, promoting agriculture towards sustainability. Such an evaluation framework contributes to the formulation of agricultural policies and management measures, enhancing the efficiency and sustainability of agriculture to achieve the objectives of sustainable agricultural development.
In the evaluation framework for agricultural green development based on the theory of sustainable development (Figure 1), the achievement of sustainable agricultural development objectives requires a focus on resource conservation in the process of agricultural green development. Assessing the conservation of agricultural resources involves evaluating the efficiency and optimization levels of resources such as land, water, fertilizers, and pesticides. Effectively conserving agricultural resources contributes to improved production efficiency, reduced production costs, as well as decreased resource consumption and environmental pressure [73]. The objective of sustainable agricultural development necessitates a stable ecological environment. The stability of the ecological environment is a crucial prerequisite for agricultural green development, and emphasis should be placed on the protection and enhancement of the ecological environment. By adjusting green production practices, we can reduce the negative impacts of agriculture on ecosystems, thereby maintaining ecological balance and ecological security [74]. The achievement of sustainable agricultural development objectives requires clean agricultural production. Clean production is also an inherent requirement for agricultural green development. Achieving clean agricultural production involves reducing the usage of chemical fertilizers, pesticides, and agricultural films, thus minimizing the adverse effects of agricultural pollutants on the environment and ecosystems [75]. The achievement of sustainable agricultural development objectives requires attention to resource conservation in the process of agricultural green development. Clean agricultural production necessitates agricultural product supply security, which includes aspects such as grain supply, food safety, and agricultural product quality. Ensuring the stability and quality safety of agricultural product supply is crucial for maintaining social stability and meeting people’s livelihood needs [76]. The achievement of sustainable agricultural development objectives requires a focus on enhancing agricultural efficiency in the process of agricultural green development. By improving agricultural productivity, optimizing agricultural industry structure, and increasing farmers’ income levels, we can achieve the sustainable development of the agricultural economy and enhance the quality of farmers’ lives [77].

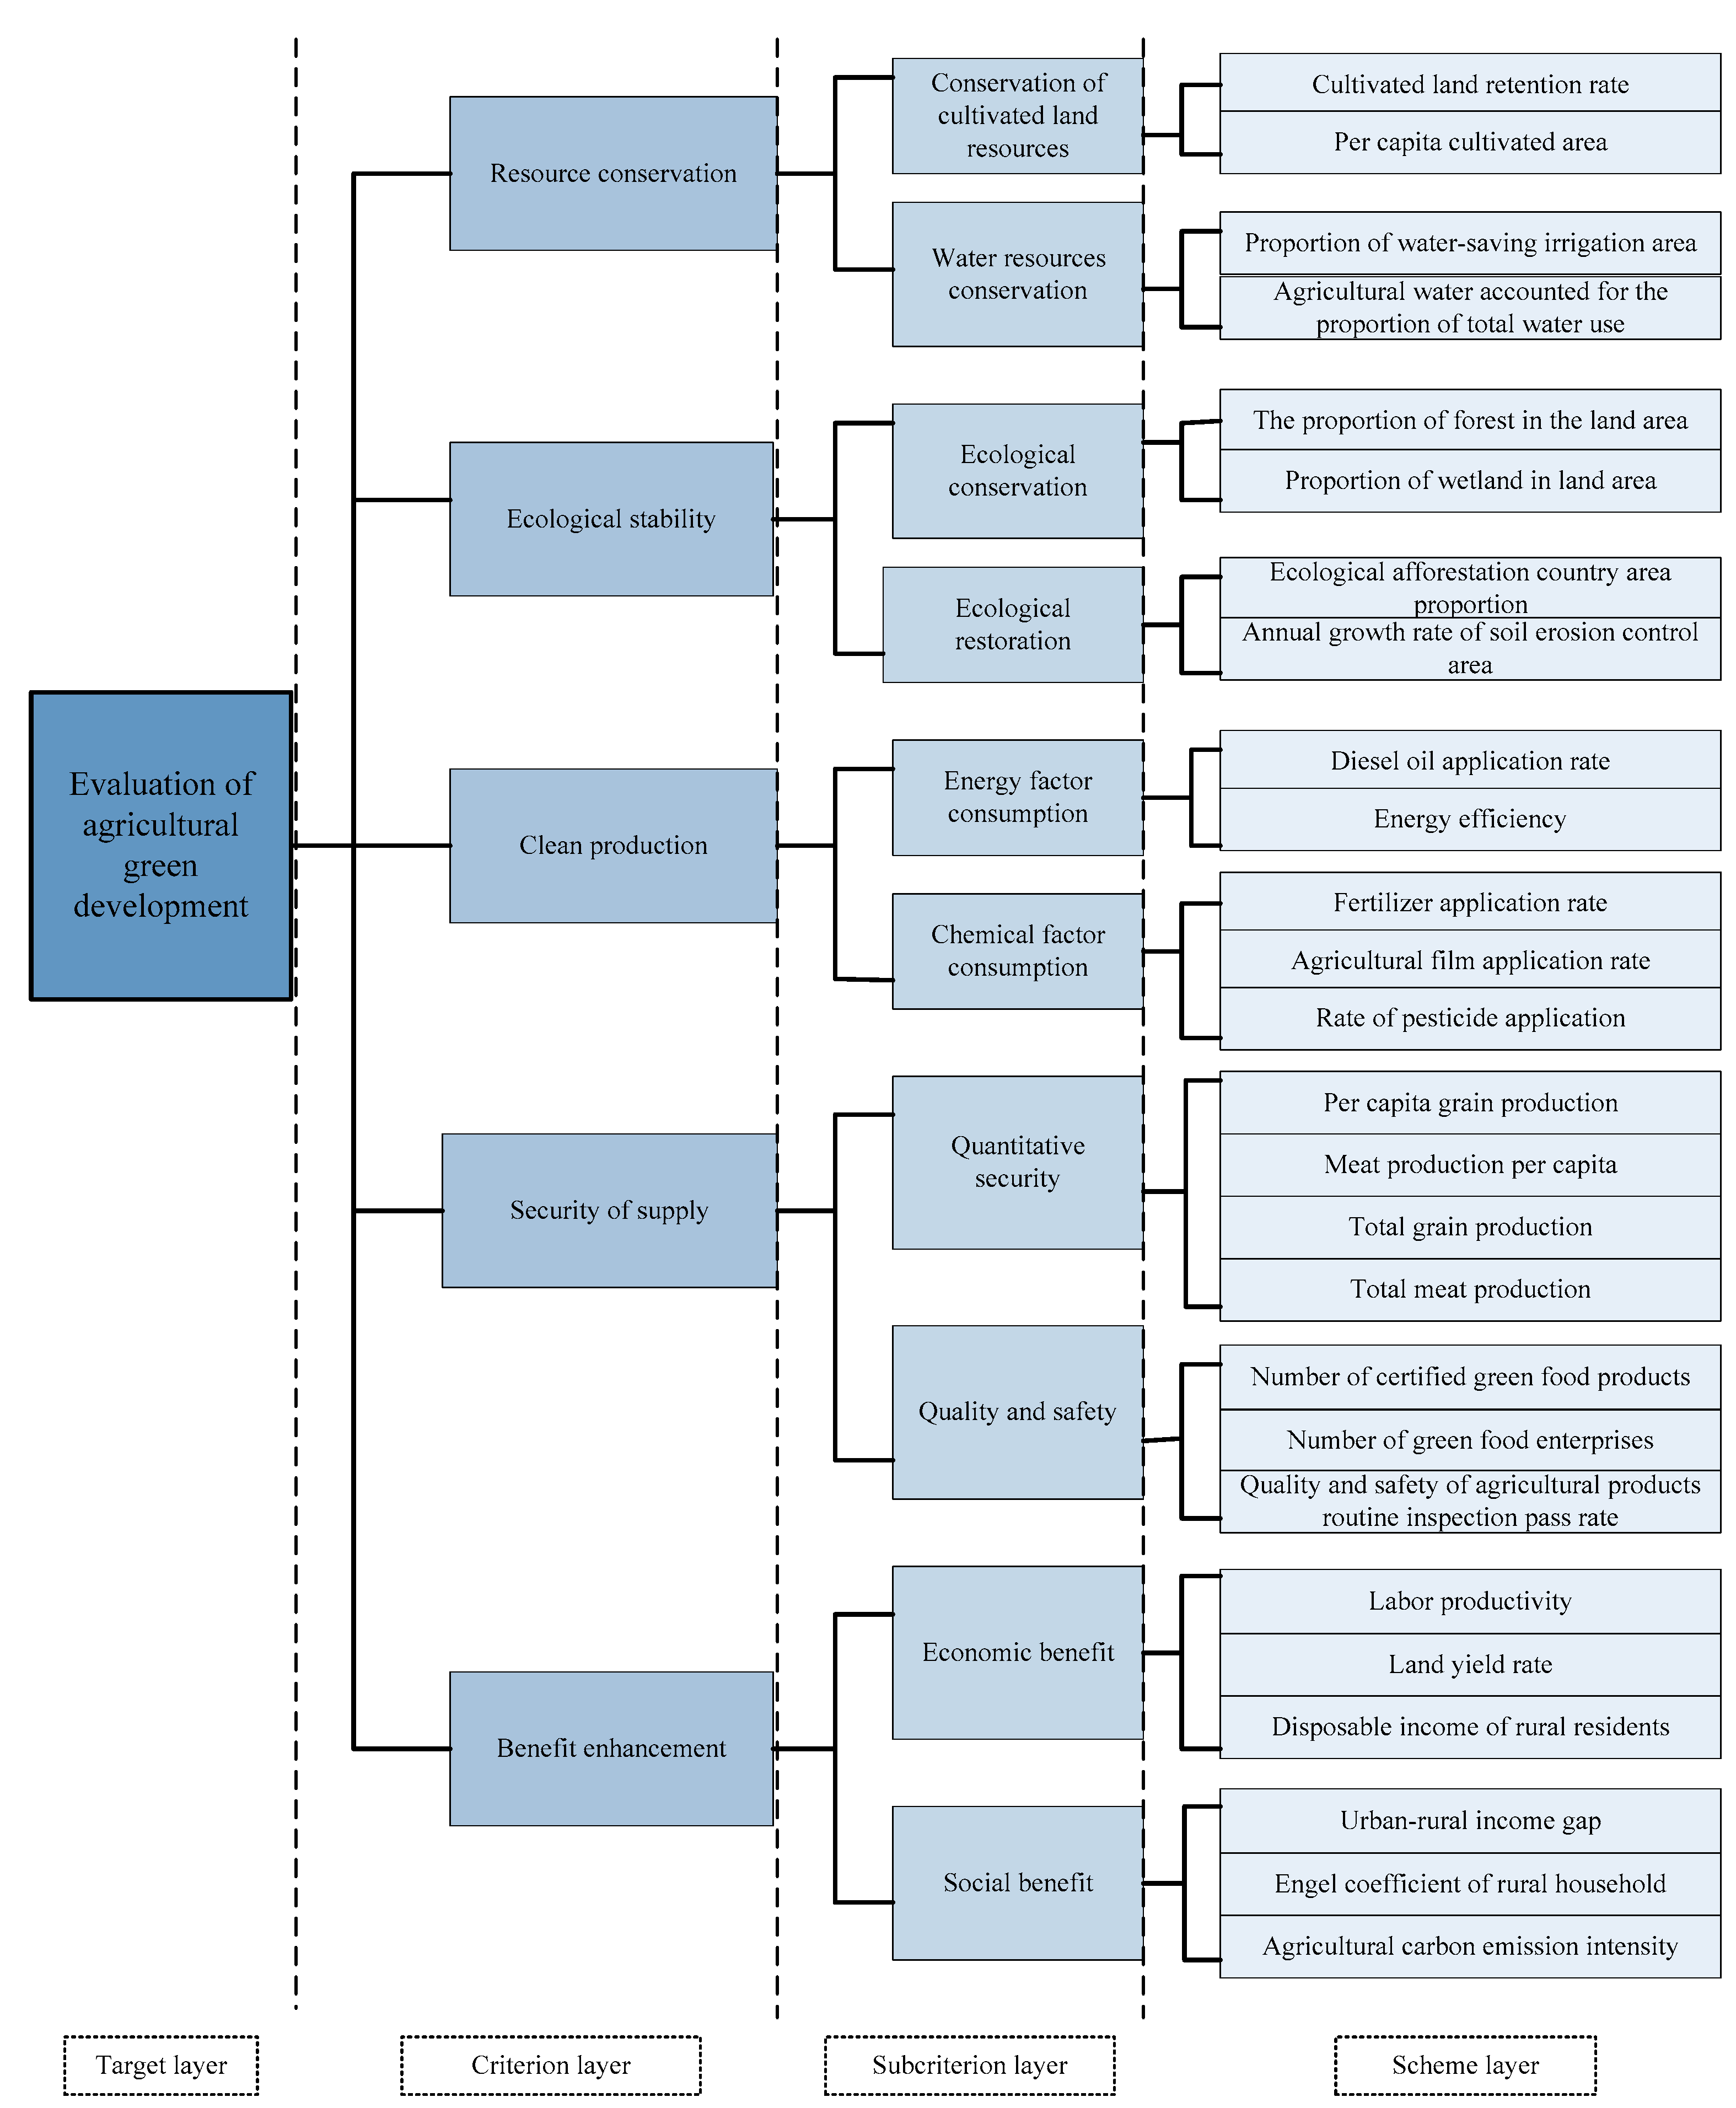
3.2. Construction of Agricultural Green Development Indicator System

Drawing upon the principles of scientific rigor, representativeness, and comparability, we constructed an evaluation framework for agricultural green development based on the theory of sustainable development. This framework encompasses five dimensions, namely resource conservation, ecological stability, clean production, supply security, and efficiency enhancement, comprising a total of 26 specific indicators (Figure 2). The selection process and rationale for these specific indicators are outlined below.
(1) Selection of Resource Conservation Evaluation Indicators: The conservation of land and water resources constitutes the core elements influencing agricultural development. These resources play a crucial role in agricultural production and directly impact the sustainability of agriculture and food security. Among them, arable land serves as the foundation of agricultural production, playing a vital role in ensuring food security and the supply of agricultural products. Sufficient arable land can support agricultural expansion and development, providing ample land for farmers to cultivate [78]. However, global arable land resources face challenges such as continual reduction, degradation, and urbanization. Therefore, it is of paramount importance to protect, efficiently utilize, and scientifically manage arable land resources. Water is an indispensable element in agricultural production, exerting a significant influence on plant growth and crop yield. Currently, the world is confronted with issues of water scarcity and water pollution, posing challenges to agricultural green development. Thus, the scientific and efficient utilization of water resources, improvement in irrigation efficiency, protection of water sources and water quality, are key measures for achieving sustainable agricultural development and food security [79]. The rational utilization and protection of arable land and water resources hold crucial significance in realizing sustainable agricultural development. Based on the aforementioned analysis, this study selects two indicators, namely arable land retention rate and per capita arable land area, to measure the conservation of arable land resources. A higher proportion of water-saving irrigation area implies greater efficiency in utilizing agricultural irrigation water, enabling the reduction in water consumption while ensuring crop growth and yield [80]. Conversely, a higher proportion of agricultural water usage indicates lower efficiency in water resource utilization, necessitating a greater amount of water to meet agricultural production needs, which is detrimental to sustainable agricultural development [81]. Based on the aforementioned analysis, this study adopts the indicators of water-saving irrigation area proportion and the ratio of agricultural water usage to total water usage to measure the conservation of water resources in agriculture.
(2) Selection of Ecological Stability Evaluation Indicators: There exists a close and intricate relationship between agricultural development and the natural ecological environment. Agricultural production relies on the natural environment, while agricultural activities also impact the natural environment. The precondition for promoting agricultural green development is to maintain a stable and balanced ecological environment. Forests, through the water absorption of trees and the water-holding capacity of soil, can effectively store and release water, maintaining a stable supply of groundwater and rivers [82]. Wetland systems, encompassing lakes, rivers, marshes, and coastal wetlands have the ability to absorb and store a significant amount of water, reducing the occurrence of floods and regulating the water supply for agricultural use during drought periods [83]. Forests and wetland systems, as the main components of terrestrial ecosystems, possess multiple ecological functions such as water conservation, climate regulation, soil preservation, and natural disaster prevention. Considering their fundamental strategic roles in maintaining global ecological security, promoting sustainable development, and safeguarding human well-being, this study selects the forest coverage rate and the proportion of wetland area as indicators to measure the preservation of ecosystems. Additionally, a higher proportion of ecological afforestation area signifies more land dedicated to ecological restoration and forest conservation, contributing to the improvement of the ecological environment [84]. A higher average annual growth rate indicates the widespread adoption and significant effectiveness of governance measures, capable of reducing soil erosion and protecting soil and water resources [85]. Hence, this study selects the proportion of ecological afforestation area and the average annual growth rate of the soil erosion control area as indicators to assess ecological restoration.
(3) Selection of Clean Production Evaluation Indicators: Agricultural green development emphasizes environmental friendliness, efficient resource utilization, and ecosystem protection in the agricultural production process. Clean production requires minimizing the negative impact of agriculture on the environment, including reducing the use of pesticides and fertilizers, and controlling agricultural non-point source pollution. The goal of clean production is to minimize the environmental impact of agricultural activities while maximizing resource efficiency and sustainability. Adopting clean production practices can reduce pollution, protect biodiversity, and safeguard human health [86]. Clean agricultural production involves two aspects: reducing the use of chemical inputs and improving the efficiency of energy resources. Reducing the use of chemical inputs requires scientific means to minimize the use of pesticides, fertilizers, and agricultural films, thereby addressing ecological issues such as excessive pesticide and fertilizer use leading to pesticide residues exceeding standards, soil compaction, and water pollution [87]. In this study, indicators such as fertilizer use intensity, pesticide use intensity, and agricultural film use intensity are selected to measure the utilization of chemical resources [88]. Electricity resources and diesel fuel resources have significant impacts on agricultural production. Currently, in China, the dominant source of electricity generation is coal-fired power plants, accounting for over 70% of the total electricity generation, which requires a substantial consumption of coal resources and leads to severe air pollution and ecological issues [89]. Diesel fuel is an important energy resource in agricultural production, but excessive diesel use can cause serious soil and air pollution [90]. Therefore, this study selects indicators such as diesel fuel consumption intensity per unit of agricultural output value and electricity consumption intensity per unit of agricultural output value to measure the utilization of energy resources in agriculture.
(4) Selection of Supply Security Evaluation Indicators: Food supply security issues impact national security and social stability, and ensuring food security is a fundamental strategic goal of agricultural development in China [91]. Among these indicators, per capita grain production reflects the relationship between agricultural production capacity and population demand and is an important indicator for assessing food supply. A higher per capita grain production indicates that each individual can access sufficient food supply, contributing to ensuring food security and meeting basic living needs [92]. Grain production serves as a critical indicator for evaluating food supply capacity and agricultural production levels. Higher grain production signifies strong agricultural production capacity and sufficient food supply, beneficial for meeting national grain demands and ensuring food security for the population [93]. The per capita production of pork, beef, and mutton reflects the relationship between meat supply and population demand. A higher per capita meat production indicates that each individual can access sufficient meat supply, helping to meet the population’s demand for animal protein and ensuring dietary balance and nutritional security [94]. Meat production reflects meat supply capacity and livestock production levels. Higher meat production implies a well-developed livestock industry that can meet people’s demand for meat, ensuring dietary diversity and nutritional balance [95]. Therefore, this study selects indicators such as per capita grain production, per capita production of pork, beef, and mutton, grain production, and meat production to measure the quantity and security of agricultural product supply.
China is committed to improving the quality and safety of agricultural products to ensure food security and the health of its people. Achieving a high-quality supply of agricultural products is of significant importance for promoting agricultural green development, enhancing the competitiveness of agricultural products, and meeting the demand for high-quality food from the population. Green certification assesses whether agricultural products meet environmentally friendly and pollution-free standards during the production process. A higher number of certified green food products indicates that more agricultural products meet the criteria for green certification, demonstrating higher levels of environmental friendliness and safety [96]. A higher number of green food enterprises implies that more enterprises in the agricultural supply chain adhere to green production and business principles, providing consumers with a greater selection of green food choices [97]. The qualification rate of routine inspections for agricultural product quality and safety refers to the proportion of qualified products in routine inspections conducted on agricultural products. This inspection typically includes testing for pesticide residues, heavy metal content, microbial contamination, and other factors to ensure that agricultural products meet quality and safety standards. A higher qualification rate indicates the good quality control of agricultural products and the ability to guarantee food safety [98]. This study selects indicators such as the number of certified green food products, the number of green food enterprises, and the qualification rate of routine inspections for the agricultural product quality to measure the quality of agricultural products.
(5) Selection of Efficiency Enhancement Evaluation Indicators: The benefits of agricultural green development include both economic and social aspects. Agricultural labor productivity efficiency reflects the level of labor utilization efficiency in agricultural production. A higher agricultural labor productivity efficiency means higher agricultural output with the same labor input, resulting in improved labor productivity for farmers [99]. This is an important economic benefit indicator of agricultural green development. Agricultural land output efficiency reflects the utilization efficiency of land resources in agricultural production. A higher agricultural land output efficiency means higher agricultural output with limited land resources [100]. This is of significant importance for achieving agricultural green development. Rural per capita disposable income reflects the economic living standards and purchasing power of rural residents. A higher rural per capita disposable income signifies an increase in farmers’ income levels, allowing them to achieve a better quality of life and higher consumption capacity [101]. This is also an important economic benefit indicator of agricultural green development, demonstrating the impact of agricultural green development on farmers’ economic well-being. This study selects indicators such as agricultural labor productivity efficiency, agricultural land output efficiency, and rural per capita disposable income to measure the economic benefits of agricultural green development.
Agricultural green development aims to maximize social benefits by adopting sustainable agricultural production methods and technologies that prioritize ecological environment protection, efficient resource utilization, and social equity. Furthermore, it emphasizes the protection of rural social equity and farmers’ rights, promoting rural social stability and harmony. Additionally, agricultural green development focuses on promoting environmentally friendly agricultural production methods to reduce the negative impact of agriculture on the environment. In the process of selecting evaluation indicators, a narrowing urban–rural income gap indicates a relatively higher income level for rural residents, leading to a more balanced urban–rural income distribution. This reflects the social benefits of agricultural green development in terms of reducing urban–rural economic disparities, promoting social equity, and improving farmers’ living conditions [102]. The rural Engel coefficient is an indicator that measures the consumption structure of rural households. A lower rural Engel coefficient means that the proportion of food expenditure in total consumption for rural residents is relatively low, indicating a shift in their consumption structure towards non-food items and an improvement in living standards [103] A lower agricultural carbon emission intensity means that, under the same agricultural output, agriculture generates fewer carbon emissions, thereby reducing its impact on climate change [104]. Therefore, this study selects indicators such as the urban–rural income gap, rural Engel coefficient, and agricultural carbon emission intensity to measure the social benefits of agricultural green development.

4. Materials and Methods

4.1. Research Methods

4.1.1. Entropy Method and Weighted TOPSIS Method

The entropy method and weighted TOPSIS approach are statistical analysis methods based on mathematical models, known for their high objectivity. They utilize the actual numerical data of indicators for calculations and analysis, remaining unaffected by subjective factors. Consequently, these methods can provide relatively objective indicator weights and scores. Additionally, the utilization of the entropy method and weighted TOPSIS model for measuring indicator weights and scores offers advantages such as comprehensiveness, flexibility, interpretability, and wide applicability. They can provide effective decision support and evaluation outcomes, enabling decision makers to better understand and analyze issues, facilitating informed decision making. Therefore, this study adopts the entropy method and weighted TOPSIS approach to assess the level of agricultural green development in China [105]. The specific procedural steps involved: initially, determining the weights of each indicator based on the degree of variation among their values within the indicator system; subsequently, evaluating the proximity of the targets to the “positive ideal solution” and “negative ideal solution” using the approximation principle of the TOPSIS method; ultimately, selecting the solution that is closest to the positive ideal solution. The specific steps are as follows:
The data matrix is constructed using the raw data of the indicators
X ij = ( X i j ) m × n
The raw data undergo dimensionless quantification
Y ij = { X i j min ( X i j ) max ( X i j ) min ( X i j ) + 0.0001 X ij   positive   indicators   max ( X i j ) X i j max ( X i j ) min ( X i j ) + 0.0001 X ij   negative   indicators
The weight matrix of the indicators is calculated:
P ij = Y i j i = 1 m Y i j
The entropy values of each indicator are computed
e j = k i = 1 m P ij ln P ij k = 1 ln m
The coefficients of the differentiation items are calculated:
g j = 1 e j
The weights of the indicators are determined.
w j = g j j = 1 n g i
The weighted normalization matrix is constructed.
R = ( r i j ) m × n r i j = w j × Y i j ( 1 i m , 1 j n )
The optimal solution and worst solution are determined.
Z j + = max ( r i j ) ,   Z j = min ( r i j )
The distance between each evaluation object and the optimal solution as well as the worst solution is calculated.
D i + = j = 1 n ( Z j + r i j ) 2 , D i = j = 1 n ( Z j r i j ) 2
The relative closeness of each evaluation object is computed.
N i = D i ( D i + + D i ) ,   0 N i 1
Among them, a higher value indicates a higher level of agricultural green development in the region.

4.1.2. Gini Coefficient and Decomposition Method

The Gini coefficient method is an intuitive statistical approach, known for its simplicity, high sensitivity, comparative nature, wide applicability, and minimal data requirements. It provides a visual representation of the level of inequality in regional development. The Gini coefficient values range from 0 to 1, with values closer to 1 indicating higher levels of inequality and values closer to 0 indicating lower levels of inequality. This characteristic allows for direct comparisons between different regions. In this study, the Gini coefficient and decomposition method are employed to analyze and assess the disparities in agricultural green development across various regions in China [106]. The overall differences (G) include within-region differences (Gw), between-region differences (Gnb), and over-density differences (Gt). The relationship between these three factors can be calculated using the following specific formula:
G = j = 1 k h = 1 k i = 1 n j r = 1 n h | y j i y h r | 2 n 2 y ¯
G jj = i = 1 n j r = 1 n j | y j i y i r | 2 n j 2 y j ¯
G jh = i = 1 n j r = 1 n h | y j i y h r | n j n h ( y j ¯ + y h ¯ )
G w = j = 1 k G j j p j s j
G nb = j = 2 k h = 1 j 1 G j h ( p j s h + p h s j ) D j h
G t = j = 2 k h = 1 j 1 G j h ( p j s h + p h s j ) ( 1 D j h )
d j h = 0 d F j ( y ) 0 y ( y x ) d F h ( x )
p j h = 0 d F h ( y ) 0 y ( y x ) d F j ( x )
G = G w + G nb + G t

4.1.3. Kernel Density Estimation Method

The Kernel density estimation (KDE) method is a non-parametric approach that does not require any assumptions about the data distribution. This makes it suitable for various types of data, including continuous, discrete, and mixed data, and it has found wide application in academic research. Furthermore, the KDE method can capture both global and local patterns in the data. It provides information about the overall distribution within a region, aiding in the identification of overall trends and clustering phenomena. Simultaneously, it can also capture local spatial variations and anomalies, enabling researchers to gain a comprehensive understanding of the dynamic characteristics of a region [107]. Lastly, the KDE method allows for parameter settings and analysis plan selection based on research requirements. It also produces intuitive visualizations, such as heatmaps or contour plots, to illustrate the patterns and trends in regional dynamics, making the results more accessible for interpretation and understanding. Therefore, in this study, the KDE method is employed to dynamically fit and analyze the evolving characteristics of agricultural green development in the eight major economic regions of China. The specific calculation formula is as follows:
f ( x ) = 1 N h i = 1 N K ( X i x ¯ h )
k ( x ) = 1 2 π exp ( x 2 2 )
where N represents the number of provinces in the region, Xi represents the independently and identically distributed observed values, x represents the mean value, K(.) represents the kernel density function, and h represents the bandwidth.

4.1.4. Spatial Auto Correlation Analysis Method

Moran’s I index is a method used to analyze spatial auto correlation and distribution characteristics in geographic spatial data. It combines techniques from spatial statistics and econometrics and can reveal spatial dependence and heterogeneity in geographic phenomena. It helps determine whether there is spatial auto correlation, which refers to the similarity or dissimilarity of neighboring areas in terms of a geographic phenomenon. By measuring the spatial correlation between variables, it can identify whether there is clustering or dispersion in the geographic phenomenon. This aids in understanding the spatial distribution patterns of geographic phenomena and the underlying spatial influencing factors [108]. The calculation formula for the global Moran’s I index is as follows:
Moran s   I = n i = 1 n j = 1 n W i j ( x i x ¯ ) ( x j x ¯ ) i = 1 n j = 1 n W i j i = 1 n ( x i x ¯ ) 2
where xi and xj represent the agricultural green development levels of the provinces, x represents the average level of agricultural green development, Wij is the spatial weight matrix, and n is the number of sample provinces. The global Moran’s I index ranges from −1 to 1, where the absolute value indicates the strength of spatial correlation. The larger the absolute value, the stronger the spatial correlation. To further study the spatial distribution characteristics of agricultural green development levels among the 31 provinces in China, this study utilizes the local Moran’s I index to explore the clustering degree and categories of individual samples. The specific calculation formula for the local Moran’s I index is as follows:
Moran s   I i = n 2 i = 1 n ( x i x ¯ ) 2 ( x i x ¯ ) i = 1 n j = 1 n W i j ( x j x ¯ ) i = 1 n j = 1 n W i j

4.1.5. Markov Chain Method

The Markov chain method is a mathematical model used to describe stochastic processes as well as simulate and describe changes in space. By defining a state space and transition probabilities, a Markov chain model can be established to simulate the spatial evolution of geographic phenomena, revealing their spatial dynamic characteristics. By observing the transition probabilities of states in the Markov chain model, we can understand the trends and probabilities of a geographic phenomenon transitioning from one spatial state to another. This helps us comprehend the spatial evolution patterns, trends, and transformation rules of the geographic phenomenon. In this study, the Markov chain method is employed, incorporating a transition probability matrix, to analyze the dynamic evolution process of agricultural green development in China. This analysis reflects the probabilities of future upward or downward transitions in the agricultural green development levels across different regions in China [109]. The specific formula for the Markov chain is as follows:
P { X ( t ) / X t 1 = i t 1 , X t 2 = i t 2 , X 0 = i 0 } = P { X ( t ) = j / X t 1 = i t 1 } = P i j
Among them, t corresponds to the different periods of the study. The value of X(t) depends on the number of states in the state space. Pij represents the probability of transition from state i in period t to state j in period t + 1 for a specific province in terms of agricultural green development evaluation values. Pij is calculated as nij/ni, where nij is the number of transitions from state i to state j in period t + 1, and ni is the number of provinces in state i. The agricultural green development level in China is divided into four state types using the quartile method, and the Markov transition probability matrix M is constructed (Table 1). Considering the spatial lag effect, temporal lag effect, and spatial interaction between regions to compensate for the traditional Markov chain’s lack of consideration for geographic neighbors’ spatial interaction, this study further decomposes the k × k Markov matrix into k conditional transition probability matrices using the spatial Markov chain. The spatial lag values involved in this analysis are spatially weighted averages of agricultural green development in neighboring areas, with the spatial matrix represented by the spatial weight matrix.

4.2. Data Sources

The data used in this study were sourced from various publications, including the “China Statistical Yearbook”, “China Rural Statistical Yearbook”, “China Environmental Statistical Yearbook”, and Green Food Network. Additionally, the provincial and municipal statistical yearbooks and statistical bulletins of China were consulted. The sample data covers the time span from 2003 to 2020. In cases where there were missing data points for certain regions, interpolation methods were employed to fill in the gaps.

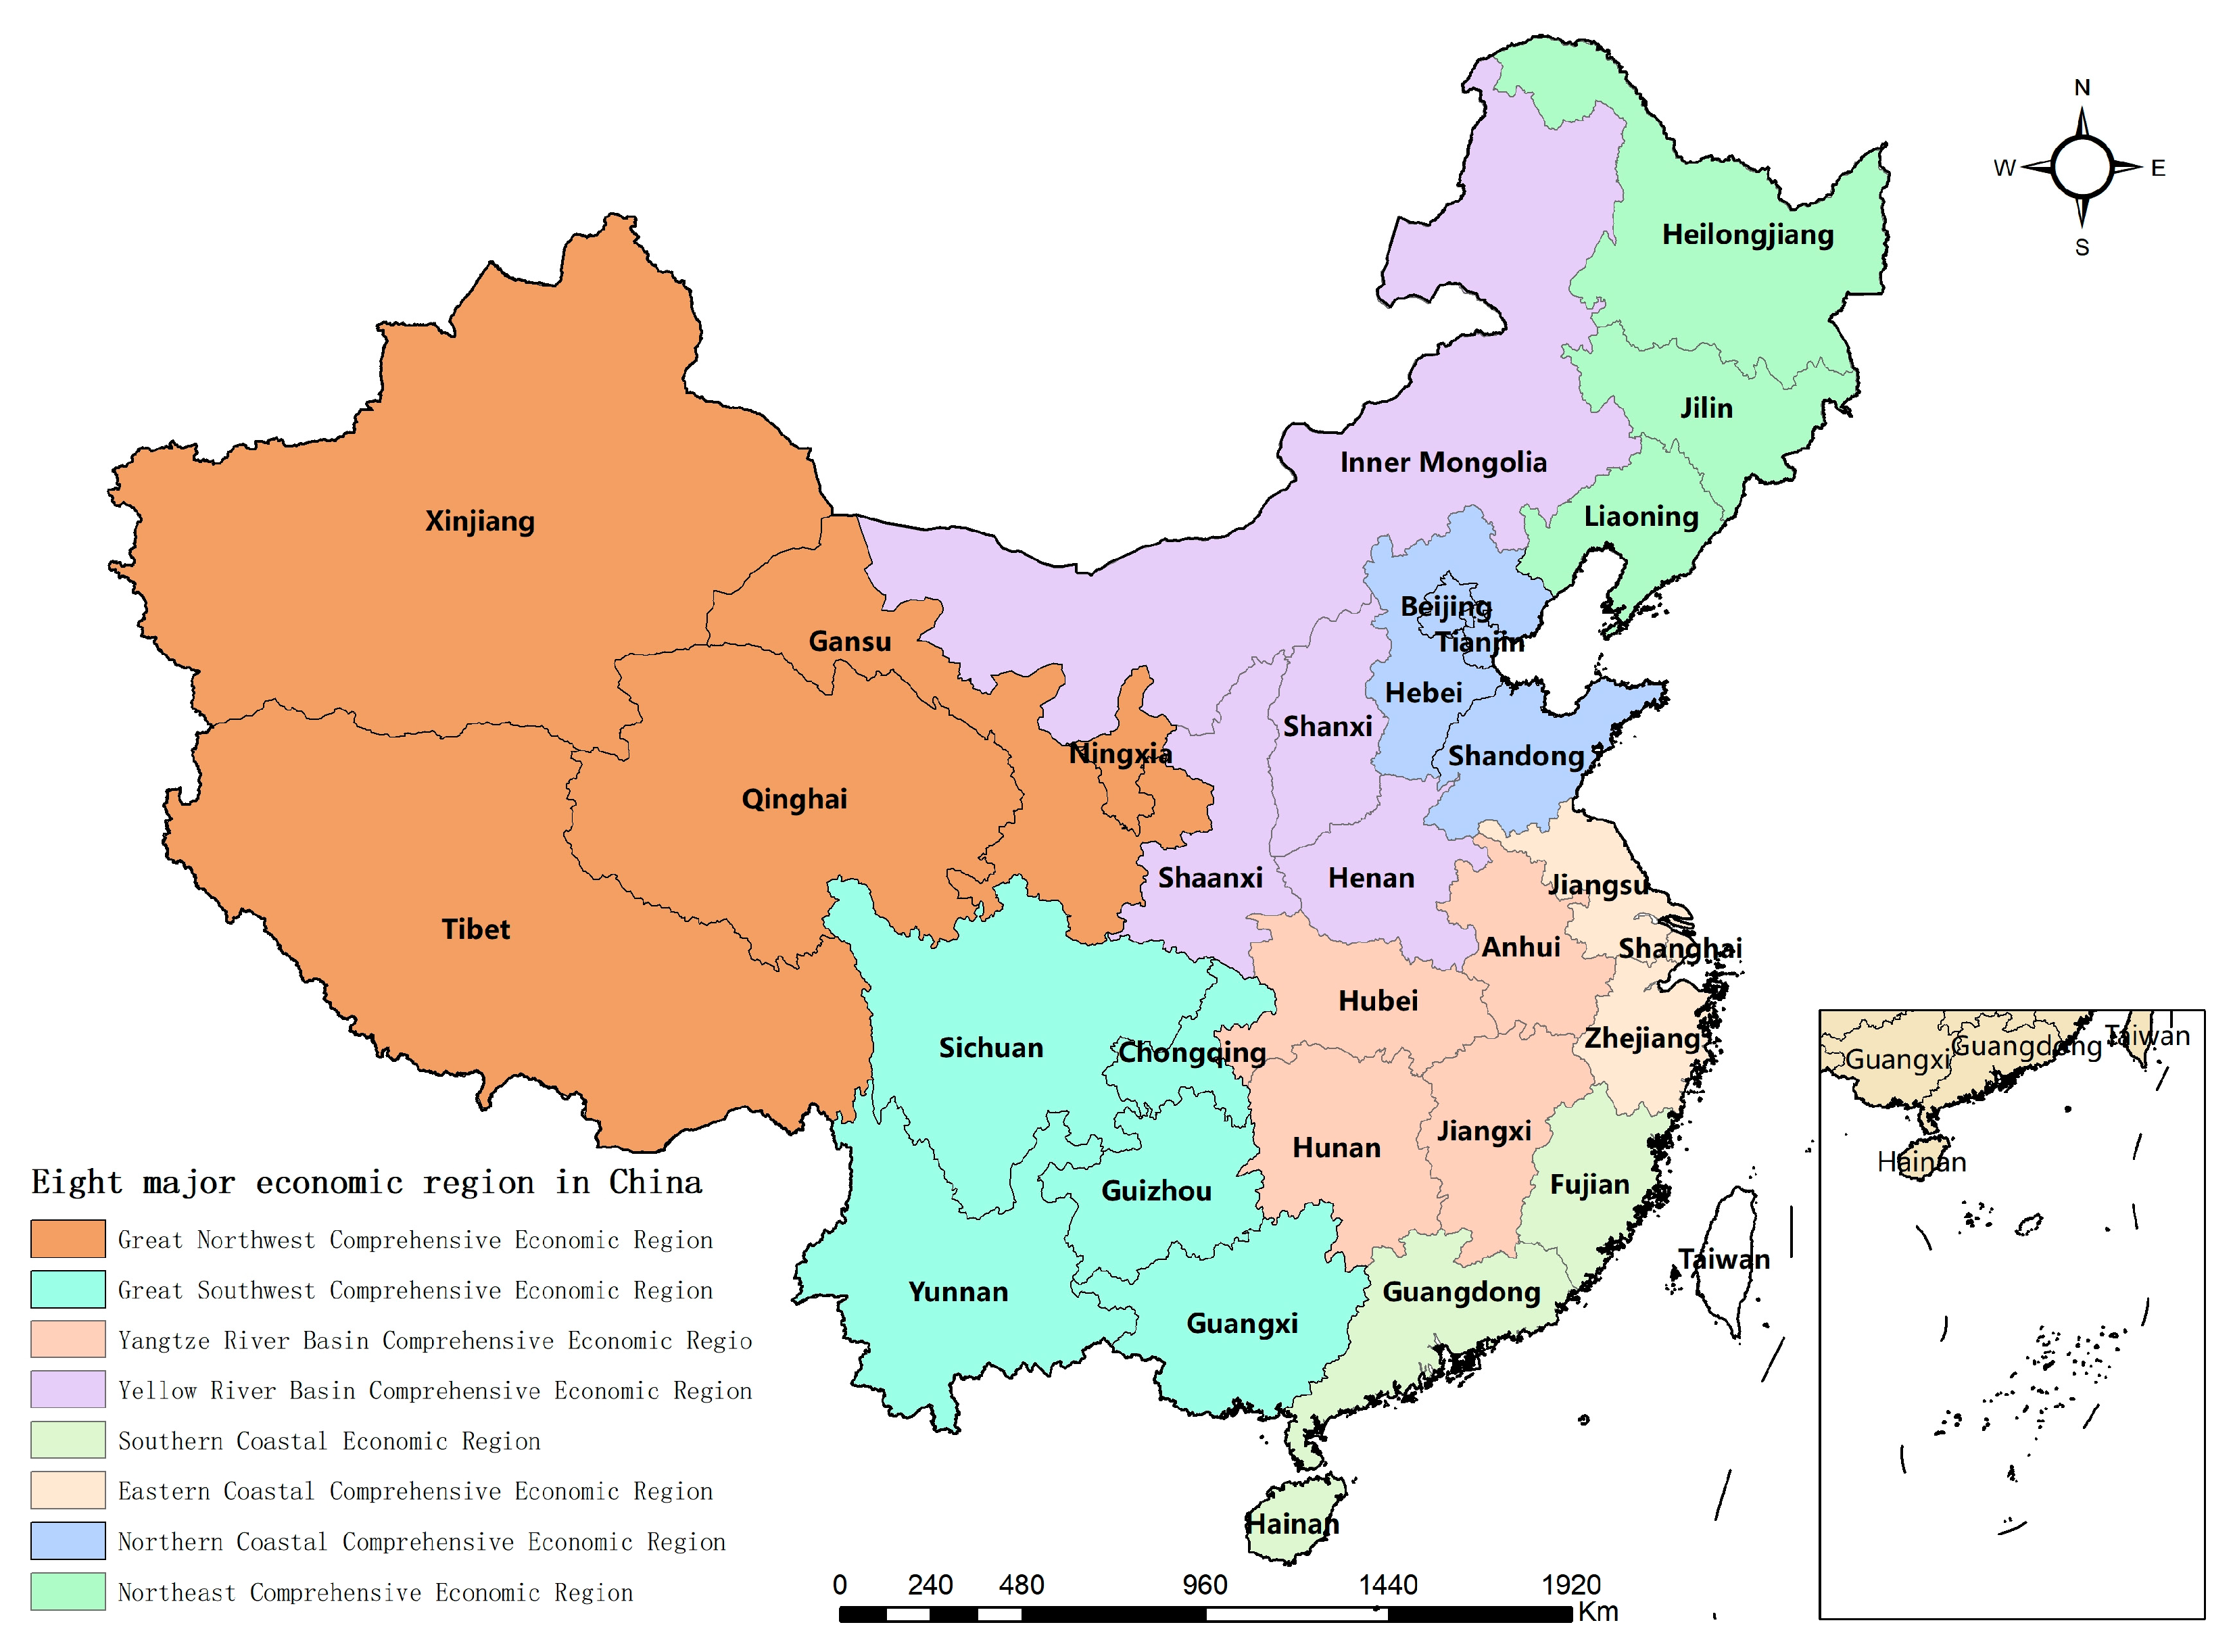
4.3. Regional Division

Based on the regional division criteria outlined in the report “Strategies and Policies for Regional Coordinated Development” by the Development Research Center of the State Council of China, the research subjects in this study are divided into eight major economic development regions. Due to data availability, this study does not include Taiwan Province, Hong Kong, and Macau in the research scope. The specific coverage of the eight major economic regions is shown in Table 2 and Figure 3.

5. Results and Analysis

5.1. Measurement and Analysis of China’s Agricultural Green Development Level

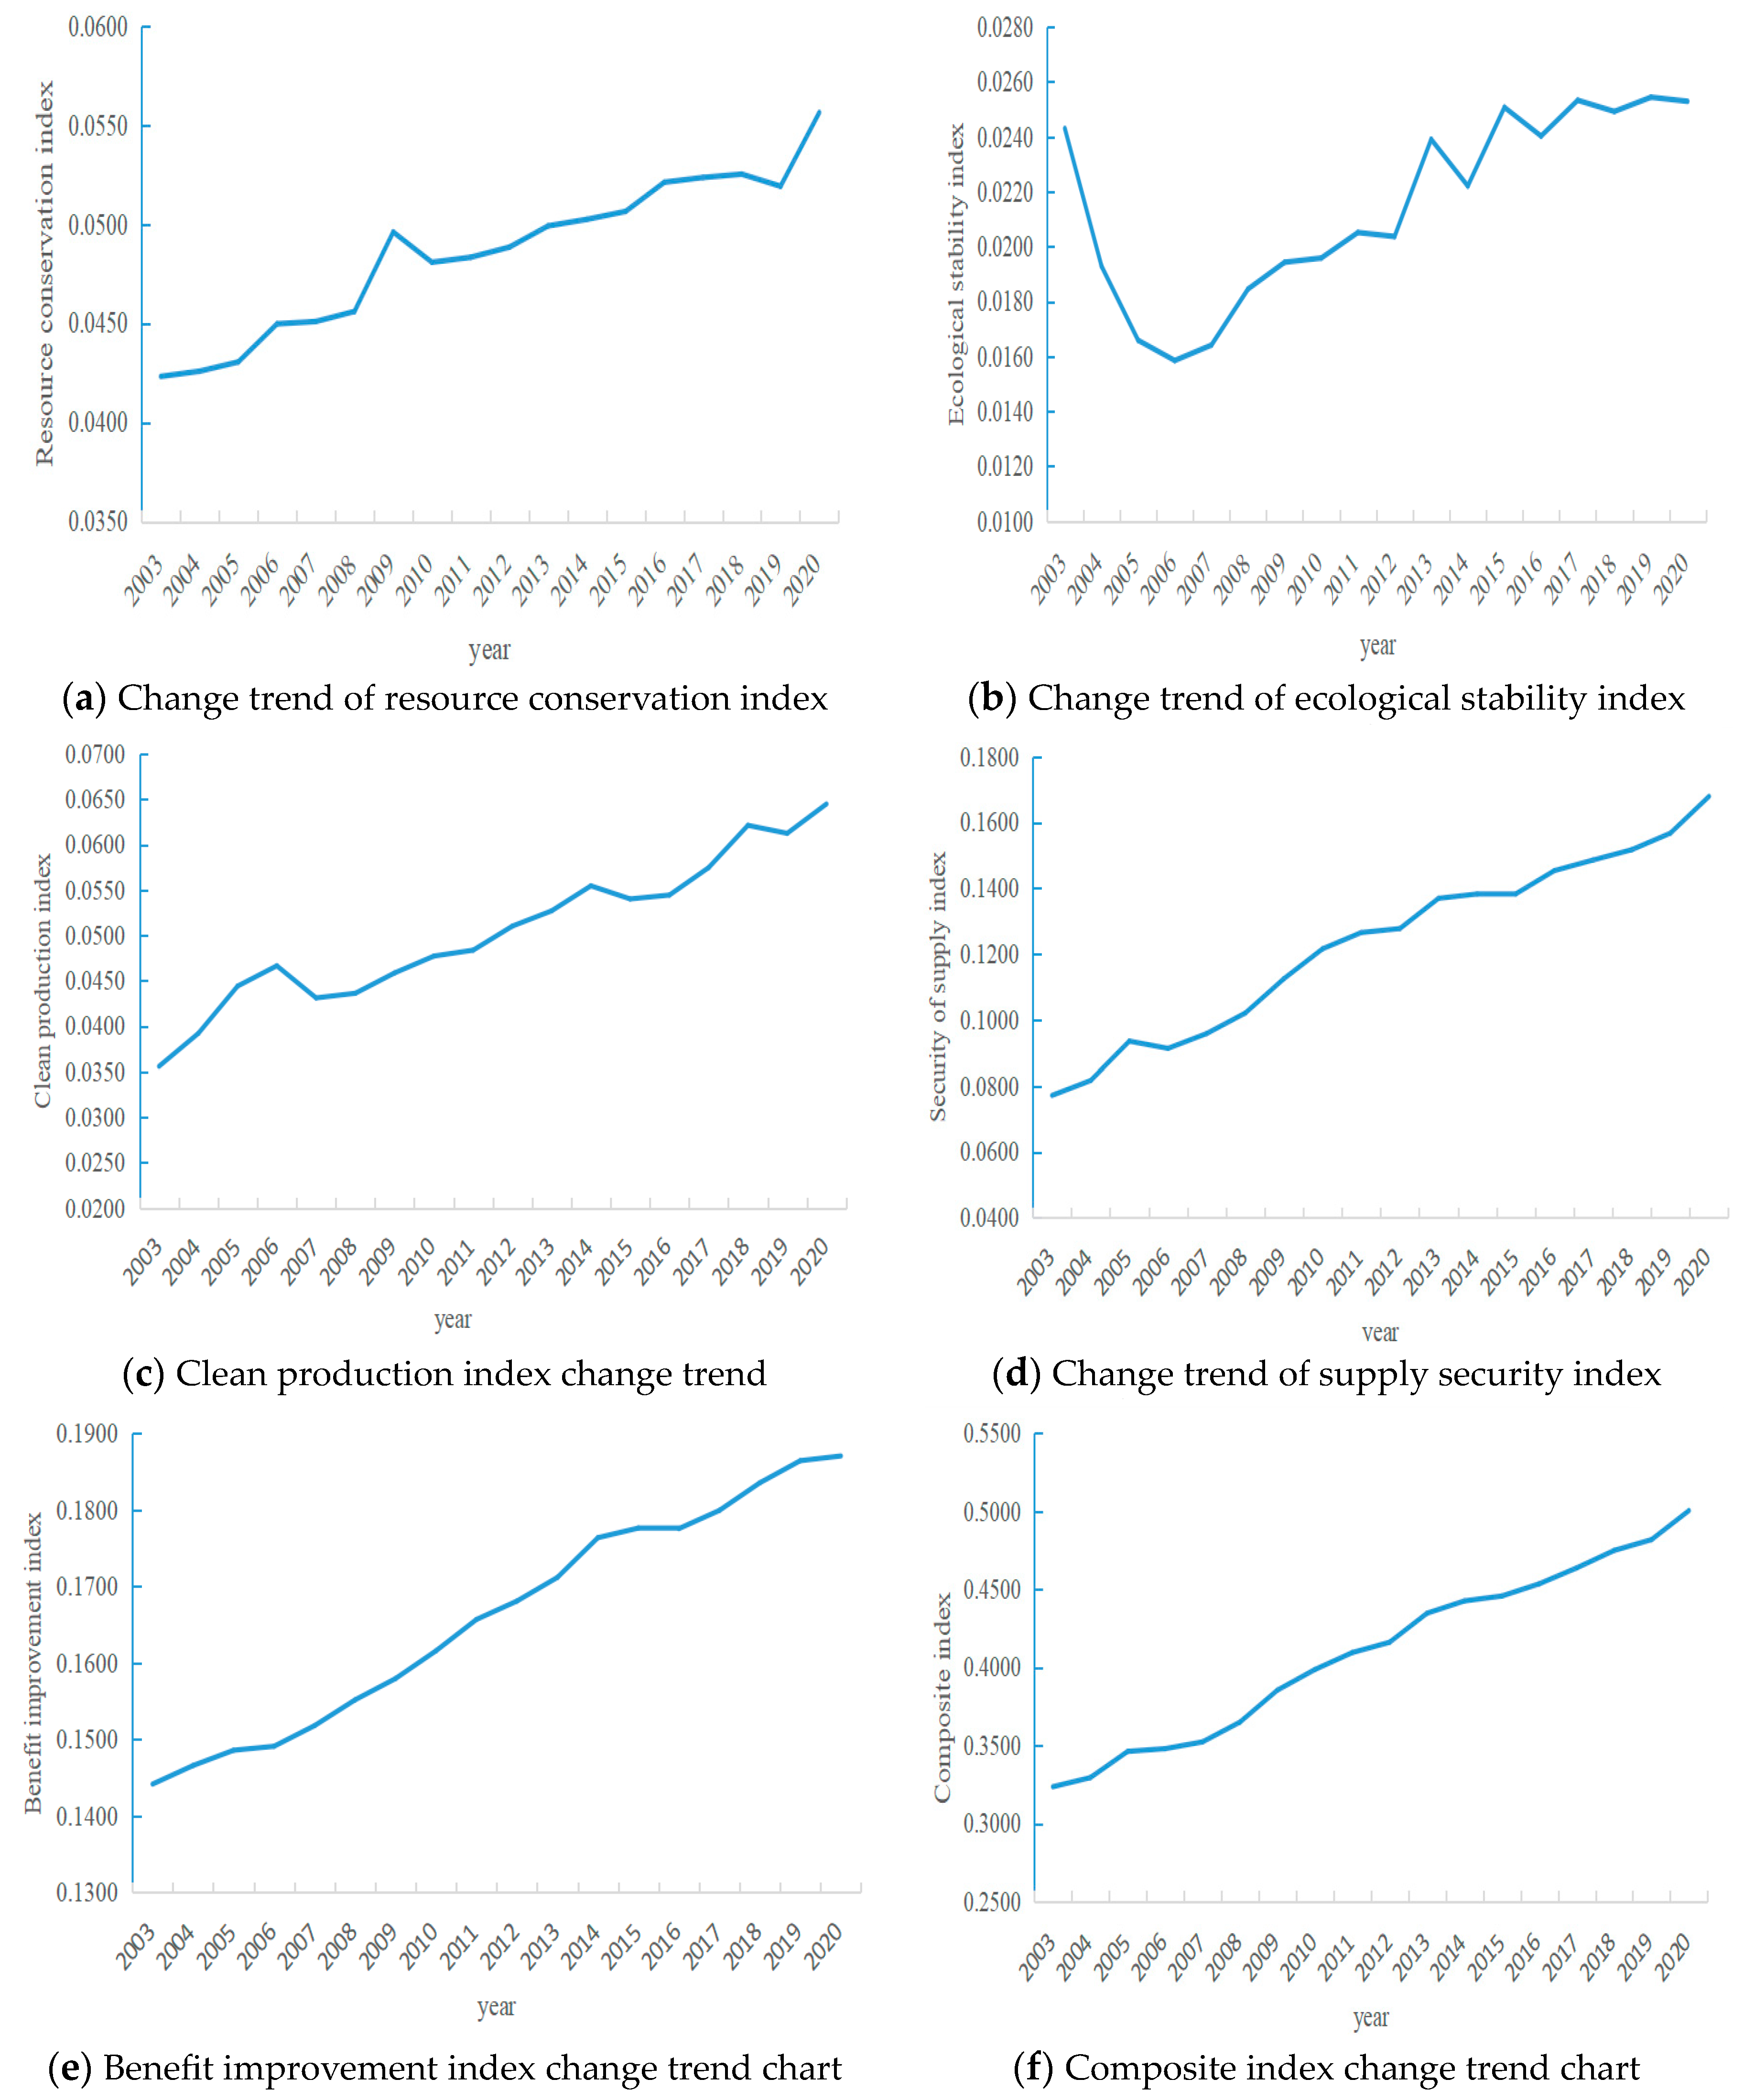
5.1.1. Analysis of the Overall Level of Agricultural Green Development in China

This article is based on the theory of sustainable development to construct an evaluation index system for agricultural green development. The entropy method and TOPSIS method are utilized to calculate the weights of the evaluation indicators for agricultural green development, as shown in Table 3. This study will employ the constructed evaluation system for agricultural green development to measure the level of agricultural green development in China from three dimensions: the overall perspective, the eight major economic regions, and the provinces. Furthermore, it will analyze the trends in the resource conservation index, ecological stability index, production cleanliness index, supply security index, efficiency improvement index, and overall development index for agricultural green development in China.
According to Table 4, it is evident that the comprehensive index of agricultural green development in China has steadily increased from 0.3236 in 2003 to 0.5004 in 2020, indicating an overall improvement in the level of agricultural green development. By examining the index values across the five dimensions of evaluation, it can be observed that the indicators for resource conservation, ecological stability, and production cleanliness have relatively low scores, while the dimensions of supply security and efficiency improvement have higher scores. This suggests that China’s agricultural green development is still at a relatively low level overall, with significant potential for improvement in the future.
Furthermore, by analyzing the trend chart (Figure 4) for the agricultural green development index in China, the resource conservation index shows a fluctuating upward trend, with minor decreases observed during the periods 2009–2010 and 2018–2019. The ecological stability index exhibits a U-shaped pattern, which can be attributed to the frequent natural disasters that occurred in China from 2003 to 2006, resulting in significant losses to economic and agricultural production. In 2003, China experienced an unusually severe year for natural disasters, including serious floods in some regions, as well as a rainfall deficit of 50–80% in parts of north China, northeast China, and southwest China, accompanied by prolonged high temperatures and severe drought conditions. Other regions also experienced severe disasters such as hailstorms, landslides, and mudslides. As a result, the total affected area of crops in China reached 60.02 million hectares, with 9.14 million hectares experiencing complete crop failure. Similarly, 2006 was the most severe year for natural disasters in China since 1998, with the frequent occurrences of typhoons, floods, and droughts, posing a significant threat to the stability of China’s agricultural and ecological environment.
On the other hand, the indexes for production economy, supply security, and efficiency improvement show a steady upward trend. Supply security and efficiency improvement are identified as the main factors influencing the changes in the comprehensive index of agricultural green development. As the government attaches increasing importance to food security and implements various measures, the supply security index for agricultural green development in China has improved rapidly, and the dimension of agricultural production efficiency has also shown significant and steady improvement.

5.1.2. Analysis of Agricultural Green Development in Eight Major Economic Regions

In terms of the comprehensive index of agricultural green development in the eight major economic regions, there were significant differences and changes in rankings from 2003 to 2020. The specific changes in the agricultural green development index for each of the eight major economic regions are presented in Table 5. The Northern Coastal Economic Region refers to the economic development region located in the northern coastal areas of China, including provinces such as Beijing, Hebei, Tianjin, and Shandong. This region possesses abundant water resources, including marine resources and river water sources. This provides important water sources for agricultural green development, benefiting crop growth and irrigation. The Northern Coastal Economic Region also benefits from fertile land and high-quality arable land, providing favorable conditions for crop cultivation. Moreover, compared to the inland regions of China, the Northern Coastal Economic Region has a relatively developed agricultural infrastructure. It has modern irrigation systems, agricultural machinery, and agro-processing facilities, which contribute to higher efficiency and yields in agricultural production. However, challenges such as limited land resources, water resource utilization and management, geographical constraints, and market competition pressure pose certain constraints on agricultural green development in the Northern Coastal Economic Region. From 2003 to 2020, the comprehensive index of agricultural green development in the Northern Coastal Economic Region increased from 0.3850 in 2003 to 0.5048 in 2020. The ranking changed from the second position to the fourth position.
The Northeast Comprehensive Economic Region of China refers to the economic development region located in the northeastern part of the country, including provinces such as Liaoning, Jilin, and Heilongjiang. This region possesses vast arable land and abundant agricultural resources, providing a solid foundation for agricultural green development. It is conducive to diversified crop cultivation and the development of the livestock industry. The Northeast Comprehensive Economic Region is also abundant in lakes, rivers, and reservoirs, ensuring ample water resources. This reliable water source benefits the stability and expansion of agricultural green production. Due to the cold climate conditions and rich agricultural resources, the Northeast Comprehensive Economic Region has nurtured a range of high-quality green agricultural products that enjoy a good reputation in domestic and international markets. From 2003 to 2020, the comprehensive index of agricultural green development in the Northeast Comprehensive Economic Region increased from 0.3755 in 2003 to 0.5232 in 2020. The ranking changed from the fourth position to the first position.
The Eastern Coastal Economic Region of China refers to the economic development region located along the eastern coast of the country, including provinces such as Jiangsu, Shanghai, and Zhejiang. This region is endowed with abundant water resources and high-quality soil conditions. The Eastern Coastal Economic Region is relatively advanced in agricultural technology and management, benefiting from advanced agricultural technologies and management practices. It has favorable social and economic conditions for agricultural green development. Additionally, the Eastern Coastal Economic Region has a well-established market and supply chain system, ensuring close integration between agricultural production and sales processes. This facilitates the market promotion and sales of green agricultural products, contributing to higher overall income levels for farmers in the region. From 2003 to 2020, the comprehensive index of agricultural green development in the Eastern Coastal Economic Region was 0.3863, with the index reaching 0.521 in 2020. The ranking changed from the first position to the second position.
The Southern Coastal Economic Region of China refers to the economic development region located along the southern coast of the country, including provinces such as Guangdong, Hainan, and Fujian. The Southern Coastal Economic Region is endowed with abundant water resources, including marine resources and river water sources. Due to suitable climate conditions and rich land resources, the region can cultivate a variety of crops, including rice, fruits, and vegetables. This diversified crop cultivation contributes to agricultural green development. However, the Southern Coastal Economic Region faces limitations in land resources. Rapid urbanization has led to a significant reduction in agricultural land area, resulting in a large urban–rural income gap, which severely restricts the foundation for agricultural green development. The region is also prone to natural disasters such as typhoons, floods, and wind disasters throughout the year, posing risks and challenges to agricultural green development in the area. Additionally, issues such as the excessive use of pesticides and fertilizers, soil erosion, and water pollution exert pressure on agricultural production and ecological environment in the region. From 2003 to 2020, the comprehensive index of agricultural green development in the Southern Coastal Economic Region was 0.3782 in 2003 and 0.4891 in 2020. The overall development progress has been relatively slow, and the ranking for agricultural green development has dropped from the third position to the sixth position.
The Yellow River Basin Economic Region refers to the economic development region located in the middle reaches of the Yellow River in China, including provinces such as Henan, Shaanxi, Shanxi, and Inner Mongolia. The Yellow River Basin Economic Region is mainly characterized by plains, with vast and fertile land, providing favorable conditions for large-scale agricultural production. The region has diverse climate conditions suitable for growing a variety of crops. For example, crops such as wheat, corn, soybeans, and cotton are widely cultivated in the area, providing a solid foundation for agricultural green development. Additionally, the Yellow River Basin Economic Region has relatively well-developed agricultural infrastructure, including irrigation systems, agricultural machinery, and processing facilities. This contributes to improving the efficiency and quality of agricultural production. However, the region faces challenges due to its dry climate and relatively low precipitation, resulting in water scarcity. This poses limitations on agricultural green development, especially during periods of water shortage when crop growth and irrigation face significant difficulties. Moreover, due to its geographical location, the Yellow River Basin Economic Region faces issues of land desertification and soil erosion, which significantly impact agricultural green development. With the advancement of economic development and urbanization processes, the region faces pressure to adjust its agricultural structure. The traditional agricultural model needs to undergo transformation and upgrading, requiring an accelerated pace of agricultural green development. From 2003 to 2020, the comprehensive index of agricultural green development in the Yellow River Basin Economic Region was 0.3545 in 2003 and 0.4842 in 2020, with the ranking remaining at the seventh position. Overall, agricultural green development in the region is still at a relatively low level.
The Yangtze River Basin Economic Region refers to the economic development region located in the middle reaches of the Yangtze River in China, including provinces such as Hubei, Hunan, Jiangxi, and Anhui. The Yangtze River Basin Economic Region is situated in the Yangtze River Basin, with abundant water resources. This provides a reliable irrigation water source for agricultural production, benefiting crop growth and development. The region has fertile land and high soil quality. In particular, the sediment brought by the Yangtze River and its tributaries provides rich nutrients for agriculture, contributing to higher crop yields and quality. The Yangtze River Basin Economic Region has diverse climate conditions suitable for growing various crops. For example, crops such as rice, wheat, rapeseed, and tea are widely cultivated in the area, establishing a solid foundation for agricultural green development. The region also boasts abundant agricultural resources and ecological environments. Natural resources such as lakes, wetlands, and mountains provide certain support and guarantees for agricultural green development. However, the Yangtze River Basin Economic Region also faces some environmental and sustainable development issues in agricultural production. The excessive use of pesticides and fertilizers, as well as soil erosion, exert pressure on the ecological environment. With rapid progress in agricultural production technology and management levels, the overall agricultural productivity and quality in the Yangtze River Basin Economic Region have improved significantly. From 2003 to 2020, the comprehensive index of agricultural green development in the region was 0.3602 in 2003 and 0.5167 in 2020, with the ranking rising from the sixth position to the third position.
The Southwest Economic Region refers to the economic development region located in the southwestern mainland of China, including provinces such as Sichuan, Yunnan, Guizhou, Chongqing, and Guangxi. The region boasts abundant water resources, including numerous rivers and lakes. This provides a reliable irrigation water source for agricultural production, benefiting crop growth and development. The region encompasses various topographical features such as high mountains, basins, and plains, with diverse climate conditions that provide favorable conditions for the production of different crops. Additionally, the Southwest Economic Region is home to many natural reserves and ecological landscapes, boasting a favorable natural ecological environment. This is conducive to the development of ecological agriculture and organic farming, making the agricultural products in the region characterized by their green and organic qualities, meeting the market demand for green agricultural products. However, although the region has a vast land area, arable land resources are limited. The utilization rate of land is relatively low, and the rational utilization and protection of land resources become important considerations for agricultural green development in the region. Furthermore, The Southwest Economic Region faces the risk of natural disasters such as floods, landslides, and earthquakes throughout the year, which also pose risks and uncertainties to agricultural green development in the region. From 2003 to 2020, the comprehensive index of agricultural green development in the region was 0.3630 in 2003 and 0.4909 in 2020, with the ranking remaining unchanged at the fifth position. The level of agricultural green development in the region still requires improvement.
The Northwest Economic Region refers to the economic development region located in the northwestern mainland of China, including provinces such as Tibet, Gansu, Qinghai, Ningxia, and Xinjiang. The Northwest Economic Region boasts abundant natural resources, including vast grasslands, rich mineral resources, and unique geographical environments. The region has an arid and cold climate, with suitable agricultural production conditions in certain areas. It possesses extensive grasslands and mountainous areas, with relatively good ecological environments, providing a solid foundation for agricultural green development. However, the Northwest Economic Region is located in an arid region with relatively scarce water resources. The lack of reliable irrigation water sources imposes limitations on agricultural production, posing challenges to agricultural green development due to water scarcity. The region also suffers from poor soil fertility and low soil nutrient content. Additionally, due to the arid climate and human activities, desertification is a serious issue in the region. Agricultural technology and management levels are relatively lagging, lacking advanced agricultural techniques and modern agricultural management experience, which restricts the improvement of agricultural production efficiency and quality. As a result, the level of agricultural green development in the region remains relatively low. From 2003 to 2020, the comprehensive index of agricultural green development in the Northwest Economic Region was 0.3256 in 2003 and 0.4386 in 2020, consistently ranking at the lowest position among the eight major economic regions.

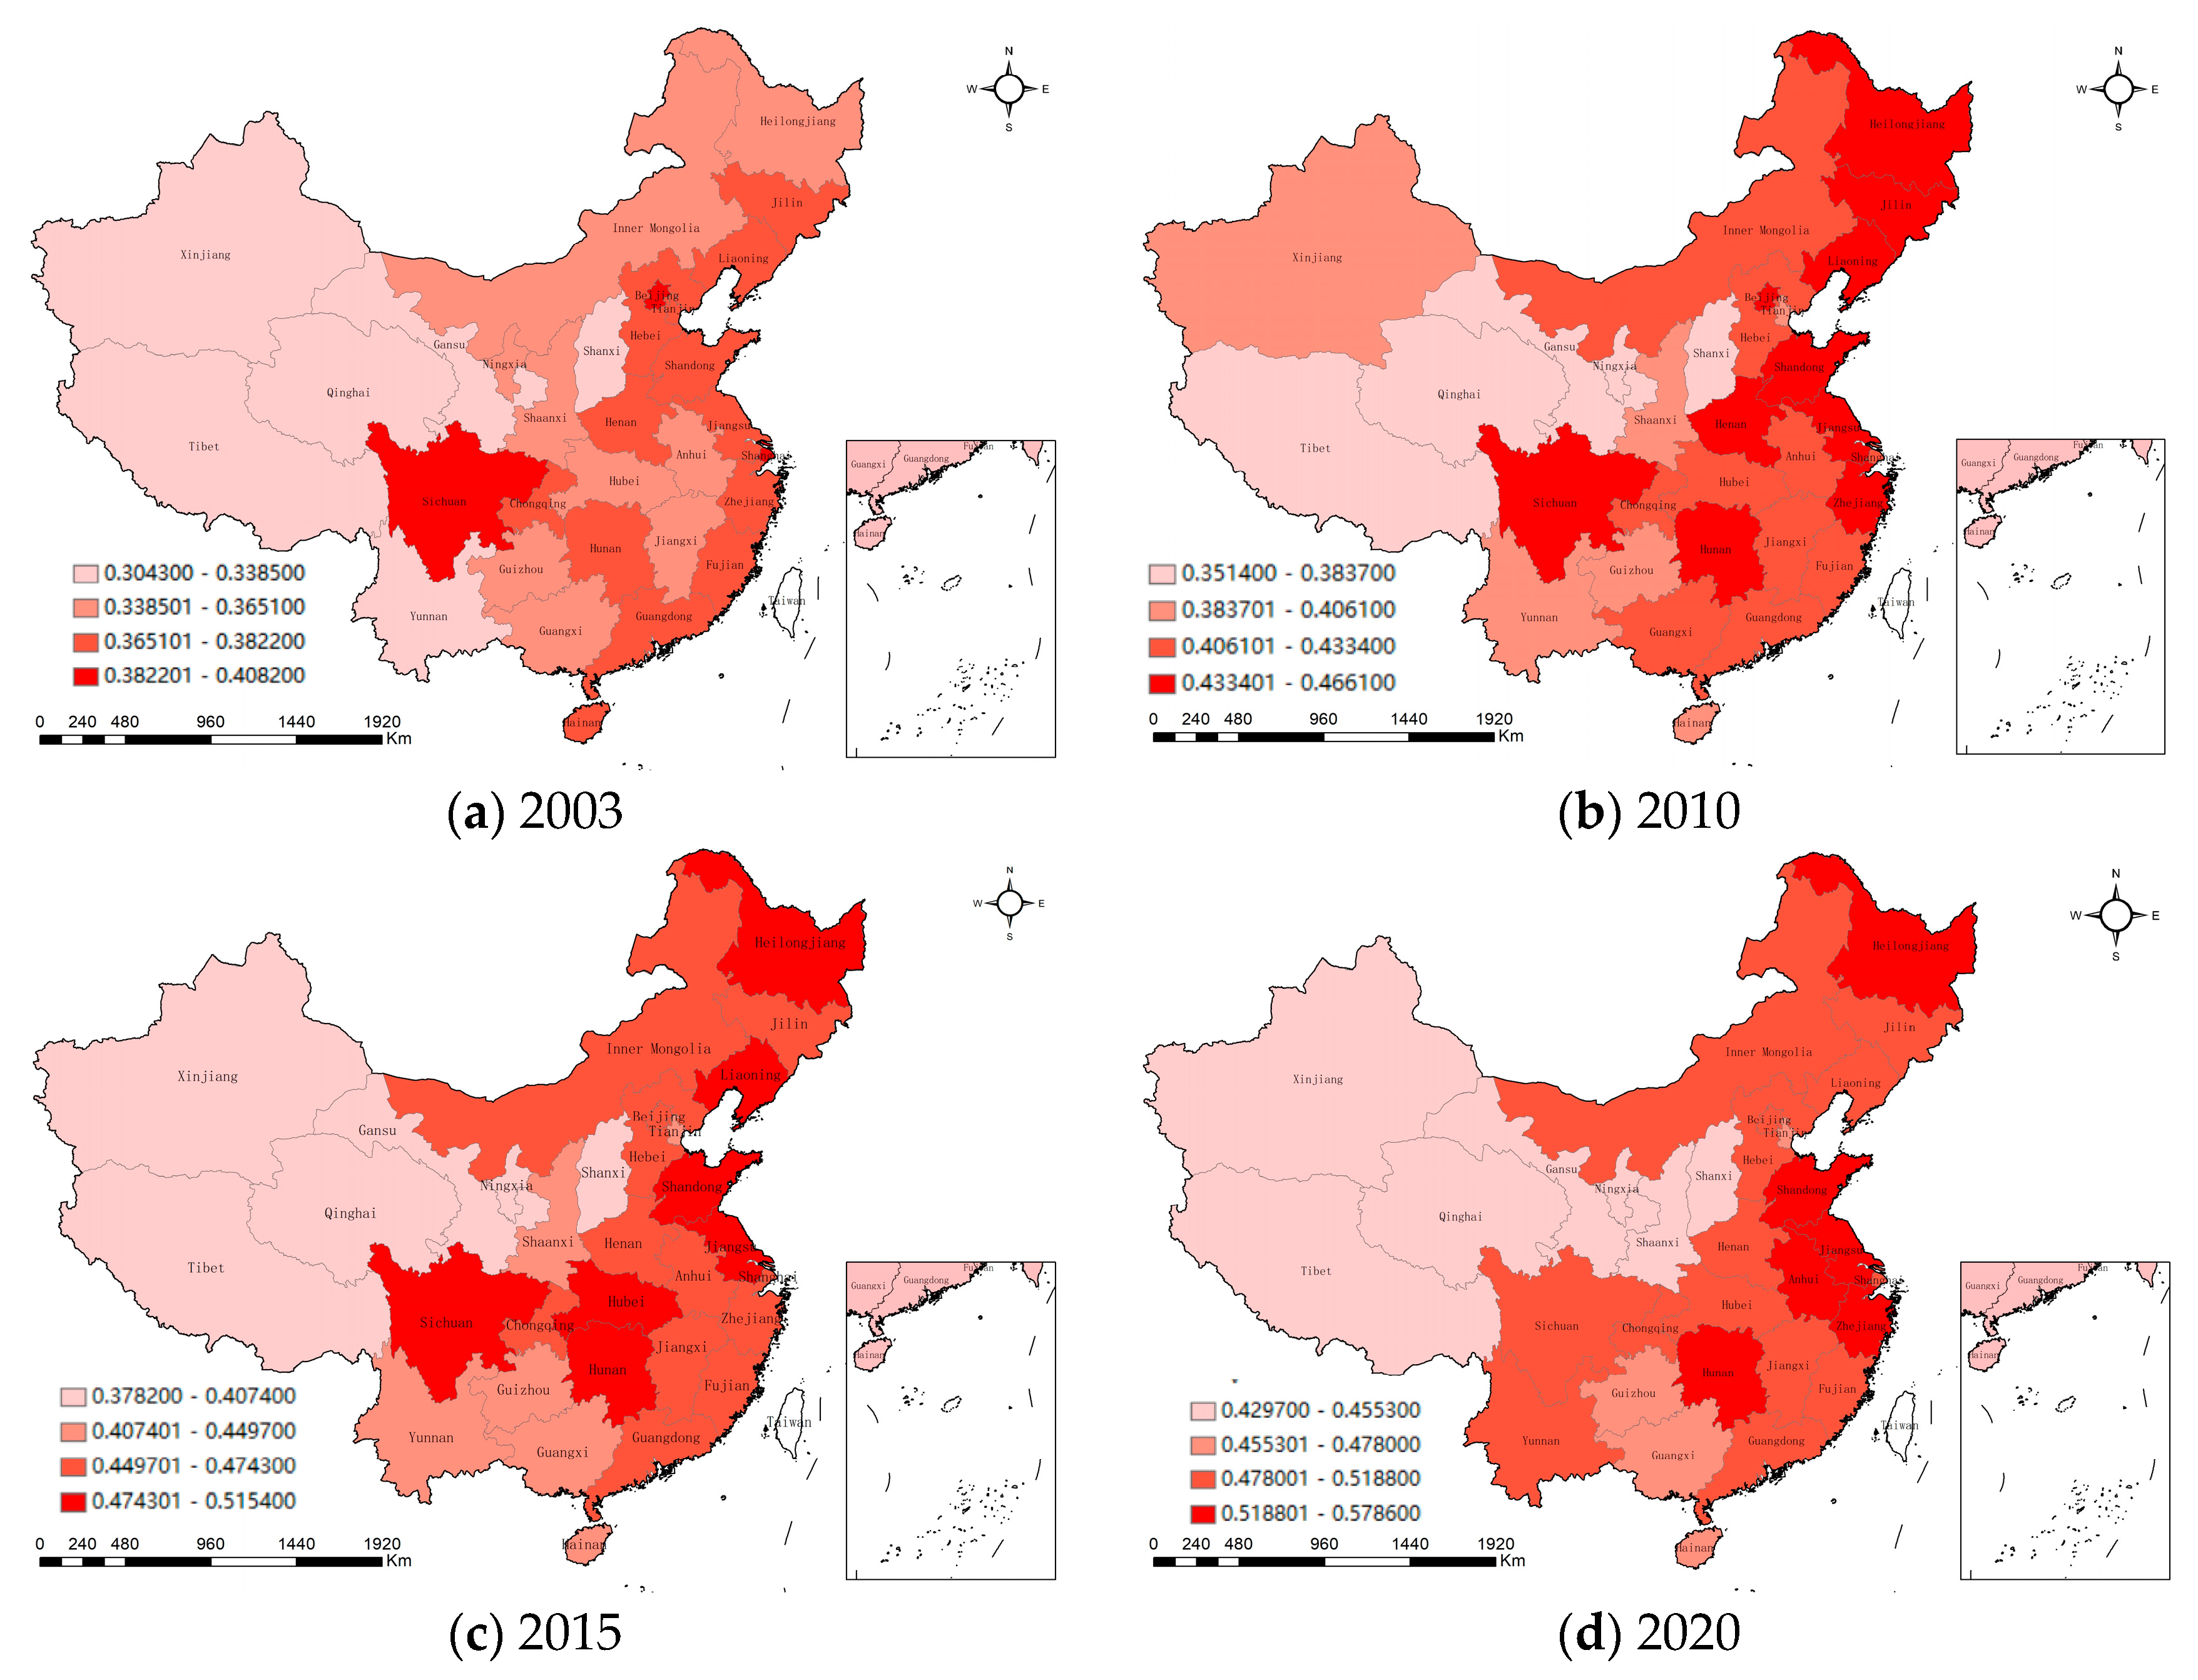
5.1.3. Analysis of Agricultural Green Development at the Provincial Level

From the perspective of provincial measurements in China, steady progress has been made in the agricultural green development of all 31 provinces. According to Table 6, the composite index of agricultural green development in 2020 reveals that the top five provinces in terms of agricultural green development are Heilongjiang, Shandong, Hunan, Jiangsu, and Anhui, respectively. Among them, Heilongjiang province possesses vast expanses of arable land with fertile soil, providing an excellent foundation for agricultural green development. This advantageous soil base facilitates the implementation of efficient agricultural practices and the promotion of organic and ecological farming methods. As a result, Heilongjiang province excels in key indicators such as per capita arable land area, agricultural land preservation, proportion of water-saving irrigation area, per capita grain production, and the number of certified green food products. Consequently, the province ranks at the forefront of agricultural green development nationwide. Similarly, Shandong province boasts extensive arable land and fertile soil, making it highly suitable for crop cultivation. The province also possesses a strong advantage in agricultural product processing and logistics. It is home to numerous large-scale agricultural processing enterprises and food factories capable of processing, packaging, and selling agricultural products. Additionally, Shandong province is enriched with multiple agricultural universities, research institutions, and agricultural technology demonstration parks, providing robust technical and talent support for agricultural green development. Consequently, the province achieves high scores in indicators such as pesticide, fertilizer, and plastic film application intensity, positioning itself as a leader in the dimension of clean production. Furthermore, Shandong province ranks prominently in terms of supply security and efficiency improvement indices, solidifying its comprehensive level of agricultural green development as second only to Heilongjiang province.
As one of China’s 13 major grain-producing regions, Hunan province boasts abundant forests, lakes, and natural reserves within its borders. The stable ecological environment provides invaluable support for agricultural green development in Hunan province. The region is home to several agricultural universities and research institutions dedicated to agricultural technology innovation and dissemination. Hunan province holds a certain advantage in terms of per capita grain yield, energy consumption per unit of output value, and exhibits a relatively small urban–rural income gap. As a result, its comprehensive index for agricultural green development ranks third. Jiangsu province possesses fertile land resources and favorable climatic conditions. It has a well-developed system for agricultural product processing and marketing, including food processing enterprises, agricultural wholesale markets, and e-commerce platforms, which contribute to the enhancement of the added value and market expansion of agricultural products. The agricultural industry chain is relatively complete, encompassing various sectors such as crop cultivation, livestock farming, and aquaculture. Thanks to the diversification of agricultural development and the refinement of the industry chain in Jiangsu province, adjustments to the rural economic structure and the extension of the agricultural industry chain enable rural residents to participate in more agricultural value-added processes, thereby increasing their sources of income. Jiangsu province exhibits comparative advantages in terms of labor productivity, land output rate, and rural residents’ disposable income, highlighting its economic benefits in agricultural green development. Consequently, the province ranks fourth in the comprehensive index of agricultural green development.
Anhui province, as a major agricultural province in central China, possesses vast farmland and abundant agricultural resources. Its primary agricultural products include rice, wheat, corn, vegetables, fruits, and tea, forming a solid foundation for agricultural green development. Moreover, Anhui province places great importance on local ecological environment protection and actively promotes the ecological development of agriculture. Through the promotion of organic farming, ecological agriculture, and circular agriculture models, as well as the strengthening of construction efforts for farmland water conservancy facilities and the prevention of agricultural non-point source pollution, the province strives to protect the ecological environment of farmland and enhance the quality and safety of agricultural products. Anhui province has made significant progress in reducing the use of chemical substances such as fertilizers and pesticides, as well as improving the efficiency of energy sources like diesel fuel. It also demonstrates comparative advantages in terms of per capita grain and meat production and total output. With relatively high values for clean agricultural production and supply security indices, Anhui province stands at the forefront of national agricultural green development.
In accordance with the comprehensive index of agricultural green development in 2020, the bottom five provinces are Shanxi, Qinghai, Ningxia, Tibet, and Gansu. Shanxi province, being the largest coal mining and deep processing base in China, is located inland with relatively limited water resources. The ecological environment for agricultural development is fragile, and the agricultural production model still heavily relies on high input factors. The intensive use of pesticides and fertilizers has led to land degradation and soil pollution in certain areas of Shanxi province. Long-term irrational agricultural practices and excessive use of agrochemicals have resulted in soil quality decline and contamination, thereby affecting agricultural production and the quality of agricultural products. Additionally, with low rates of arable land retention and per capita arable land, Shanxi province ranks 27th in the comprehensive index of agricultural green development nationwide. Qinghai, Ningxia, Tibet, and Gansu are all located in the inland arid regions of China, where water resources are relatively scarce. The arid climate and water scarcity have severely impacted agricultural irrigation and crop growth, limiting agricultural green development in these provinces. Furthermore, long-term irrational agricultural practices, excessive grazing, and the overexploitation of land resources have led to soil degradation, land desertification, and the expansion of desert areas, posing challenges to agricultural production. These regions face serious ecological issues in agriculture due to long-standing irrational agricultural practices, excessive grazing, soil quality decline, land degradation, and desert expansion. Qinghai, Ningxia, Tibet, and Gansu provinces lag behind in terms of agricultural technology and technical levels. The lack of advanced agricultural technology and support from research institutions constrains the improvement of agricultural productivity and product quality in these provinces. Moreover, the completeness of the local agricultural industry chain is relatively low, with a relatively incomplete agricultural product processing and marketing system, resulting in low added value of agricultural products, limited income growth for farmers, and low scores in the indicators of agricultural green development benefits. Shanxi, Qinghai, Ningxia, Tibet, and Gansu provinces represent the most vulnerable regions in terms of agricultural development in China.

5.2. Spatial Differences and Sources of China’s Agricultural Green Development Level

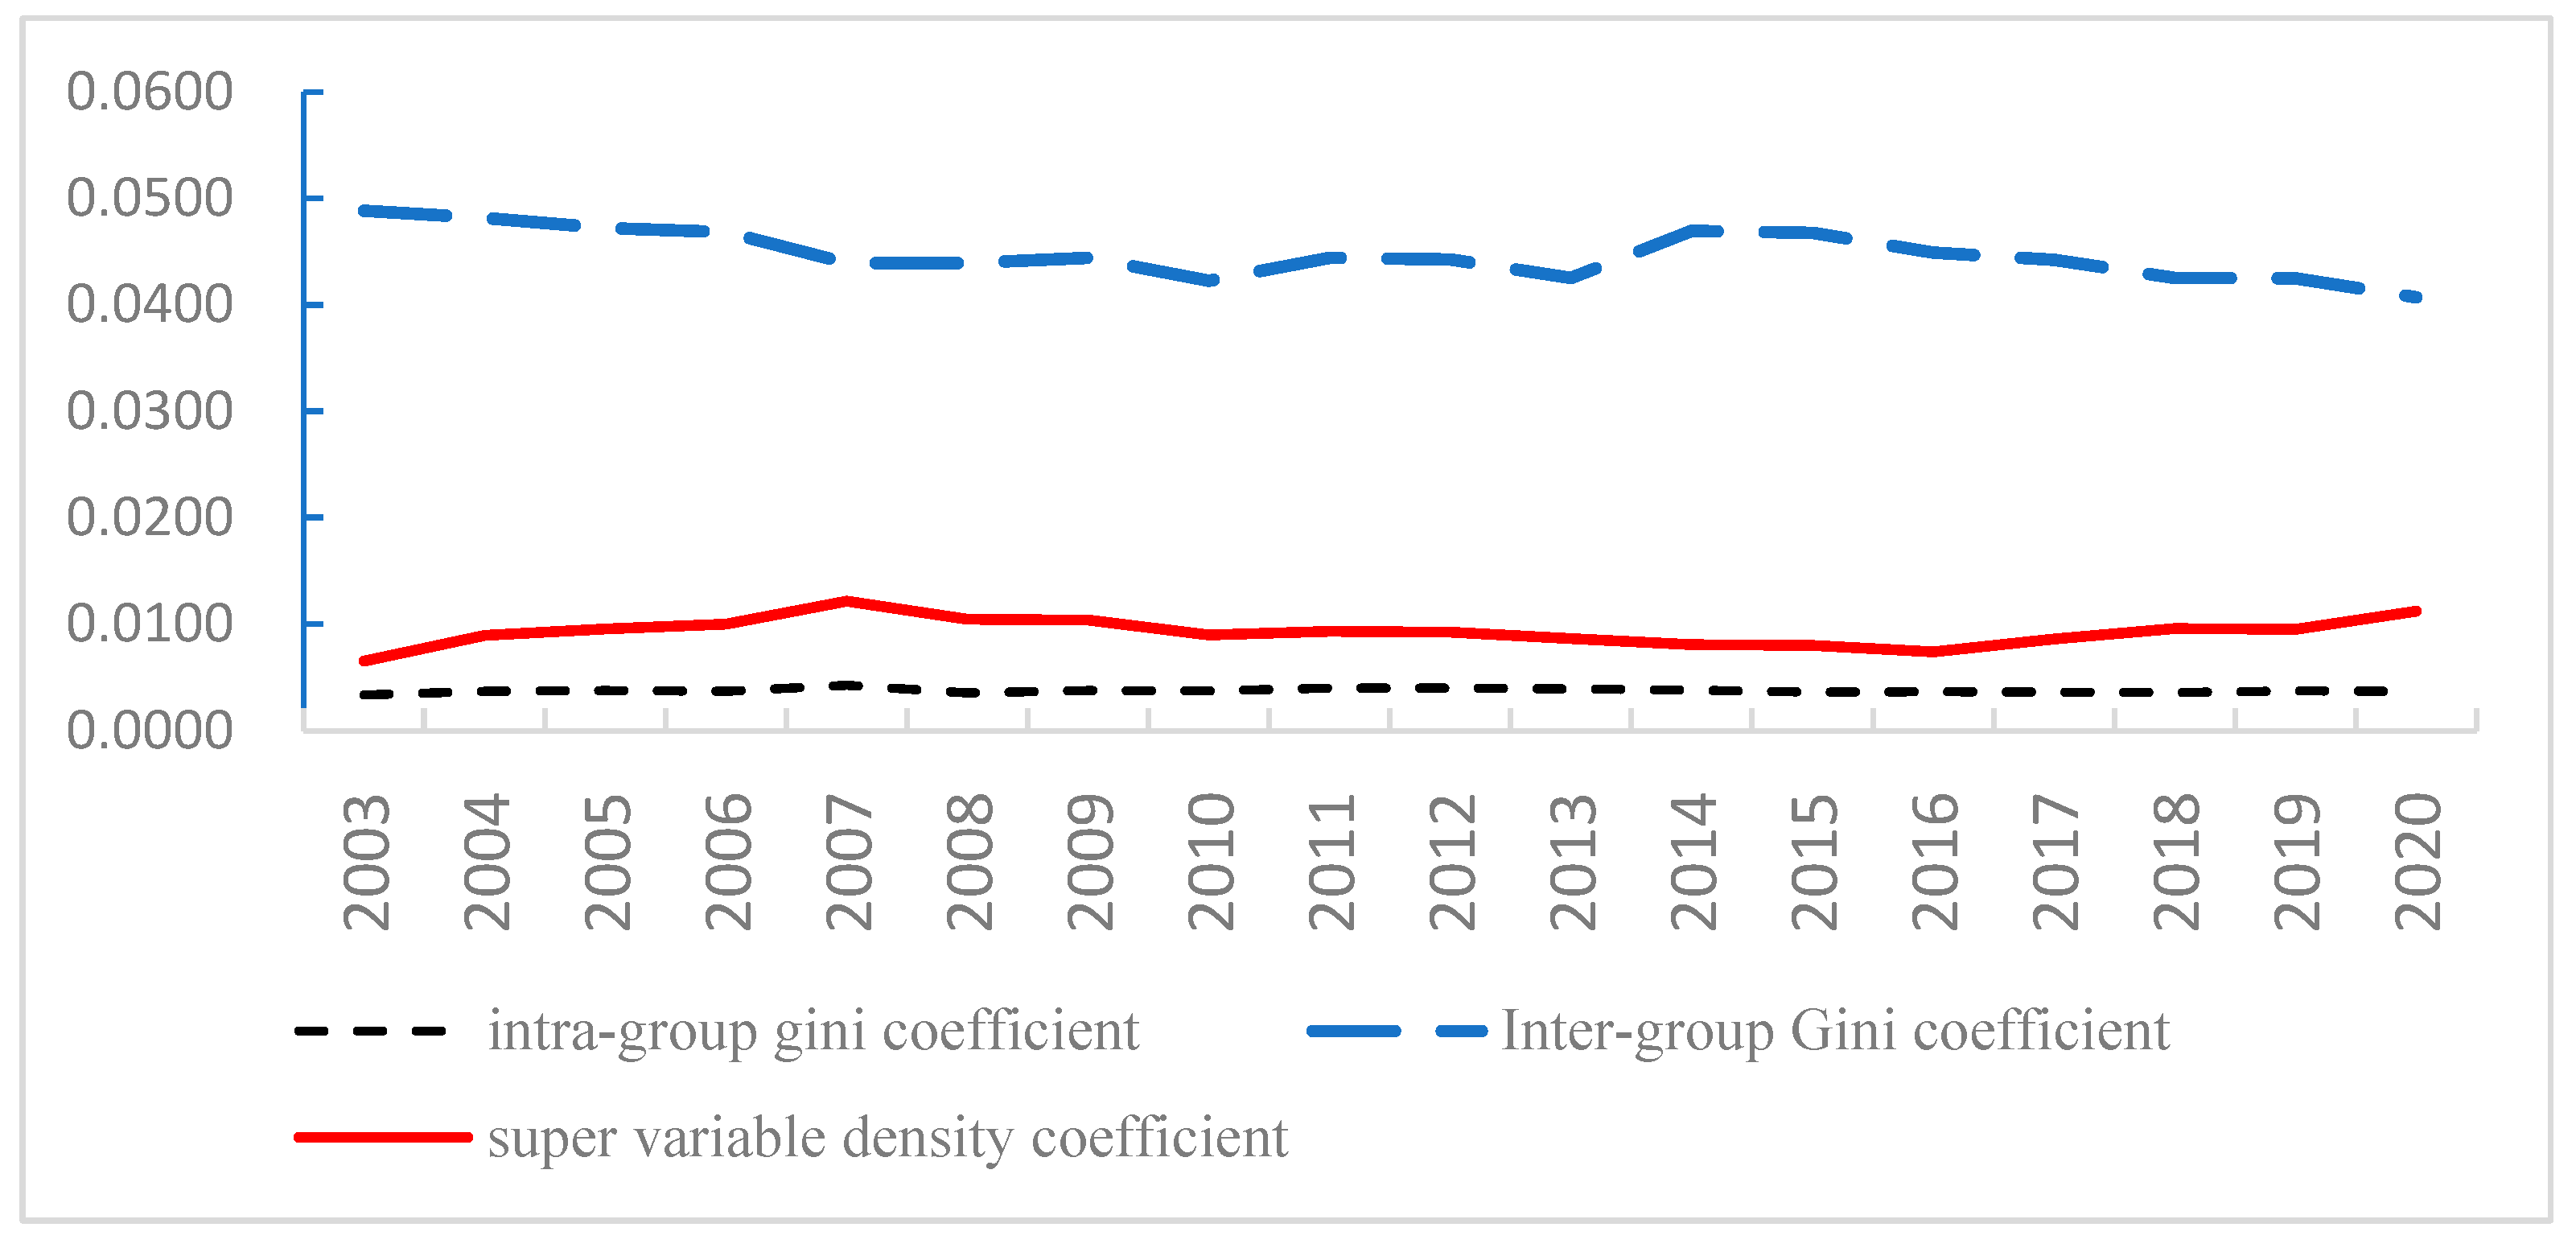
5.2.1. Decomposition of Sources of Disparities in Agricultural Green Development

The changes in China’s overall and regional agricultural green development indices from 2003 to 2020 were calculated using the Gini coefficient decomposition method, as shown in Table 7 and Figure 5. From the perspective of China as a whole, the average Gini coefficient for the total population was 0.0577, the average between-group Gini coefficient was 0.0447, and the average within-group Gini coefficient was 0.0037 during this period. In terms of the contribution of disparity sources, the between-group disparity contribution rate was 77.45%, the super-variable density contribution rate was 16%, and the within-group disparity contribution rate was 6.45%. This indicates that the main sources of disparities in China’s agricultural green development are regional differences and super-variable density, while within-group disparities contribute the least. The main reason for this is that the provinces within China’s eight comprehensive economic regions have a certain degree of similarity in terms of natural geographical environment, agricultural resource endowment, and socio-economic conditions, with relatively small differences in economic and social development levels and natural resource environments. However, there are significant differences in the economic and social development levels and natural resource environments among the eight comprehensive economic regions. Therefore, the relative disparities in China’s agricultural green development mainly stem from inter-regional differences.
In terms of the trend of disparity sources, the largest variation in inter-regional disparities during the study period was 0.0081, followed by super-variable density with a variation of 0.0056, and the smallest variation was within-group disparities with 0.0009. Furthermore, inter-regional disparities showed a fluctuating downward trend, while super-variable density exhibited a fluctuating upward trend. The overall contributions of inter-regional disparities and super-variable density demonstrated a counter-fluctuation trend, while within-group disparities remained relatively stable. This reflects that the relative disparities in China’s agricultural green development among regions are gradually narrowing. Additionally, during the observation period, the contribution rate of inter-regional disparities reached its highest value of 83% in 2003, while the contribution rate of super-variable density reached its lowest value of 11%. In 2007, the contribution rate of the inter-regional disparities reached its lowest value of 72.80%, while the contribution rate of super-variable density reached its highest value of 20%. These two factors exhibited a reverse relationship in terms of their changing patterns.

5.2.2. Analysis of Overall Agricultural Green Development and Regional Disparities

From Table 8, it can be observed that the Gini coefficients of agricultural green development levels within China’s eight economic regions exhibit a distinct hierarchical pattern, and the variations in agricultural green development disparities within each region show significant heterogeneity. Among them, the northern coastal economic region experiences the largest variation in disparities, with the regional disparity value reaching its minimum of 0.0068 in 2006 and rising to 0.0479 in 2020, indicating a variation amplitude of 0.0411. On the other hand, the variation in disparities is the smallest in the northwest economic region, decreasing from its maximum value of 0.0306 in 2016 to 0.0116 in 2020, with a variation amplitude of only 0.0190. The main reason for this disparity is the significantly higher pace of agricultural green development in Shandong province within the northern coastal economic region compared to Hebei province, leading to an increasing development gap within the region. In the northwest economic region, the provinces share similar natural environments and socio-economic development conditions, facing challenges such as water scarcity and poor soil fertility. The agricultural green transformation in Ningxia within the region is constrained by resource and environmental limitations, narrowing the disparities in agricultural green development compared to other provinces within the same region. From the perspective of mean values, the Gini coefficients of agricultural green development within the Yellow River middle economic region, Yangtze River middle economic region, and the southwest economic region are all higher than the national average. This is mainly attributed to the significantly higher levels of agricultural green development in Inner Mongolia and Henan province in the Yellow River middle economic region, Hunan province, and Anhui province in the Yangtze River middle economic region, and Chongqing and Sichuan province in the southwest economic region, resulting in large disparities in agricultural green development within these regions.

5.2.3. Analysis of Regional Disparities in Agricultural Green Development

From Table 9, during the period from 2003 to 2020, the mean values of the disparity coefficients for agricultural green development in China’s eight economic regions ranged from 0.0271 to 0.1414. Among them, the northern coastal economic region and the northeast comprehensive economic region, as regions with relatively high levels of agricultural green development in China, both had a mean disparity value of 0.0271, indicating a high degree of coordination in agricultural green development. The northern coastal economic region is rich in agricultural development resources and exhibits a higher level of agricultural green development, placing it among the regions with high levels of agricultural green development in China. On the other hand, the northwest economic region has limited agricultural green development resources and a lower level of agricultural green development, making it one of the regions with lower levels of agricultural green development in China. Both of these regions had mean disparity values of agricultural green development of 0.1414, indicating the poorest coordination in agricultural green development between the two regions. Regions with Gini coefficients ranging from 0.01 to 0.05 can be considered regions with high coordination in terms of agricultural green development, including the Northeast Comprehensive Economic Region, Northern Coastal Economic Region, Eastern Coastal Economic Region, Southern Coastal Economic Region, and the Yangtze River Middle Economic Region. These regions are also the most developed agricultural and economic regions in China, characterized by abundant resource endowments, good agricultural ecological environments, and socio-economic development. Regions with Gini coefficients ranging from 0.05 to 0.1 can be considered regions with relatively lower coordination in terms of agricultural green development, including the Yellow River Middle Economic Region and the Southwest Economic Region in relation to the Eastern Coastal Economic Region and the Northern Coastal Economic Region. Among these, the Southwest Economic Region has advantages such as geographical diversity, superior ecological environment, abundant species resources, and unique advantages in specialty agricultural products. However, it also faces challenges such as limited land resources, lagging infrastructure, frequent natural disasters, and inconvenient transportation, which pose constraints on agricultural green development.
The Yellow River Middle Economic Region benefits from favorable natural irrigation conditions and a wide variety of agricultural products, but it also faces challenges such as water scarcity, soil erosion, land degradation, and pollution, resulting in an overall lower level of agricultural green development. Both regions exhibit significantly greater Gini coefficient differences compared to the developed regions in terms of green development, indicating lower levels of coordination in agricultural green development. Regions with Gini coefficients exceeding 0.1 can be considered regions with the poorest coordination in terms of agricultural green development, including the Northwest Economic Region in relation to the Northeast Comprehensive Economic Region, Northern Coastal Economic Region, and Eastern Coastal Economic Region. The Northwest Economic Region is mainly located in inland arid areas with relatively limited water resources. The arid climate and water scarcity severely affect agricultural irrigation and crop growth, limiting agricultural development and production scale. Additionally, the region faces issues of soil degradation and desertification. Long-term unsustainable agricultural practices, excessive grazing, and the excessive utilization of land resources have led to a decline in soil quality, land degradation, and desert expansion, posing challenges to agricultural green development in the Northwest Economic Region. Therefore, the disparities between the Northwest Economic Region and regions with high levels of agricultural green development such as the Northern Coastal Economic Region and the Eastern Coastal Economic Region are significant, resulting in the lowest level of coordination in agricultural green development compared to other regions.

5.3. Distribution and Dynamic Evolution of Agricultural Green Development in China

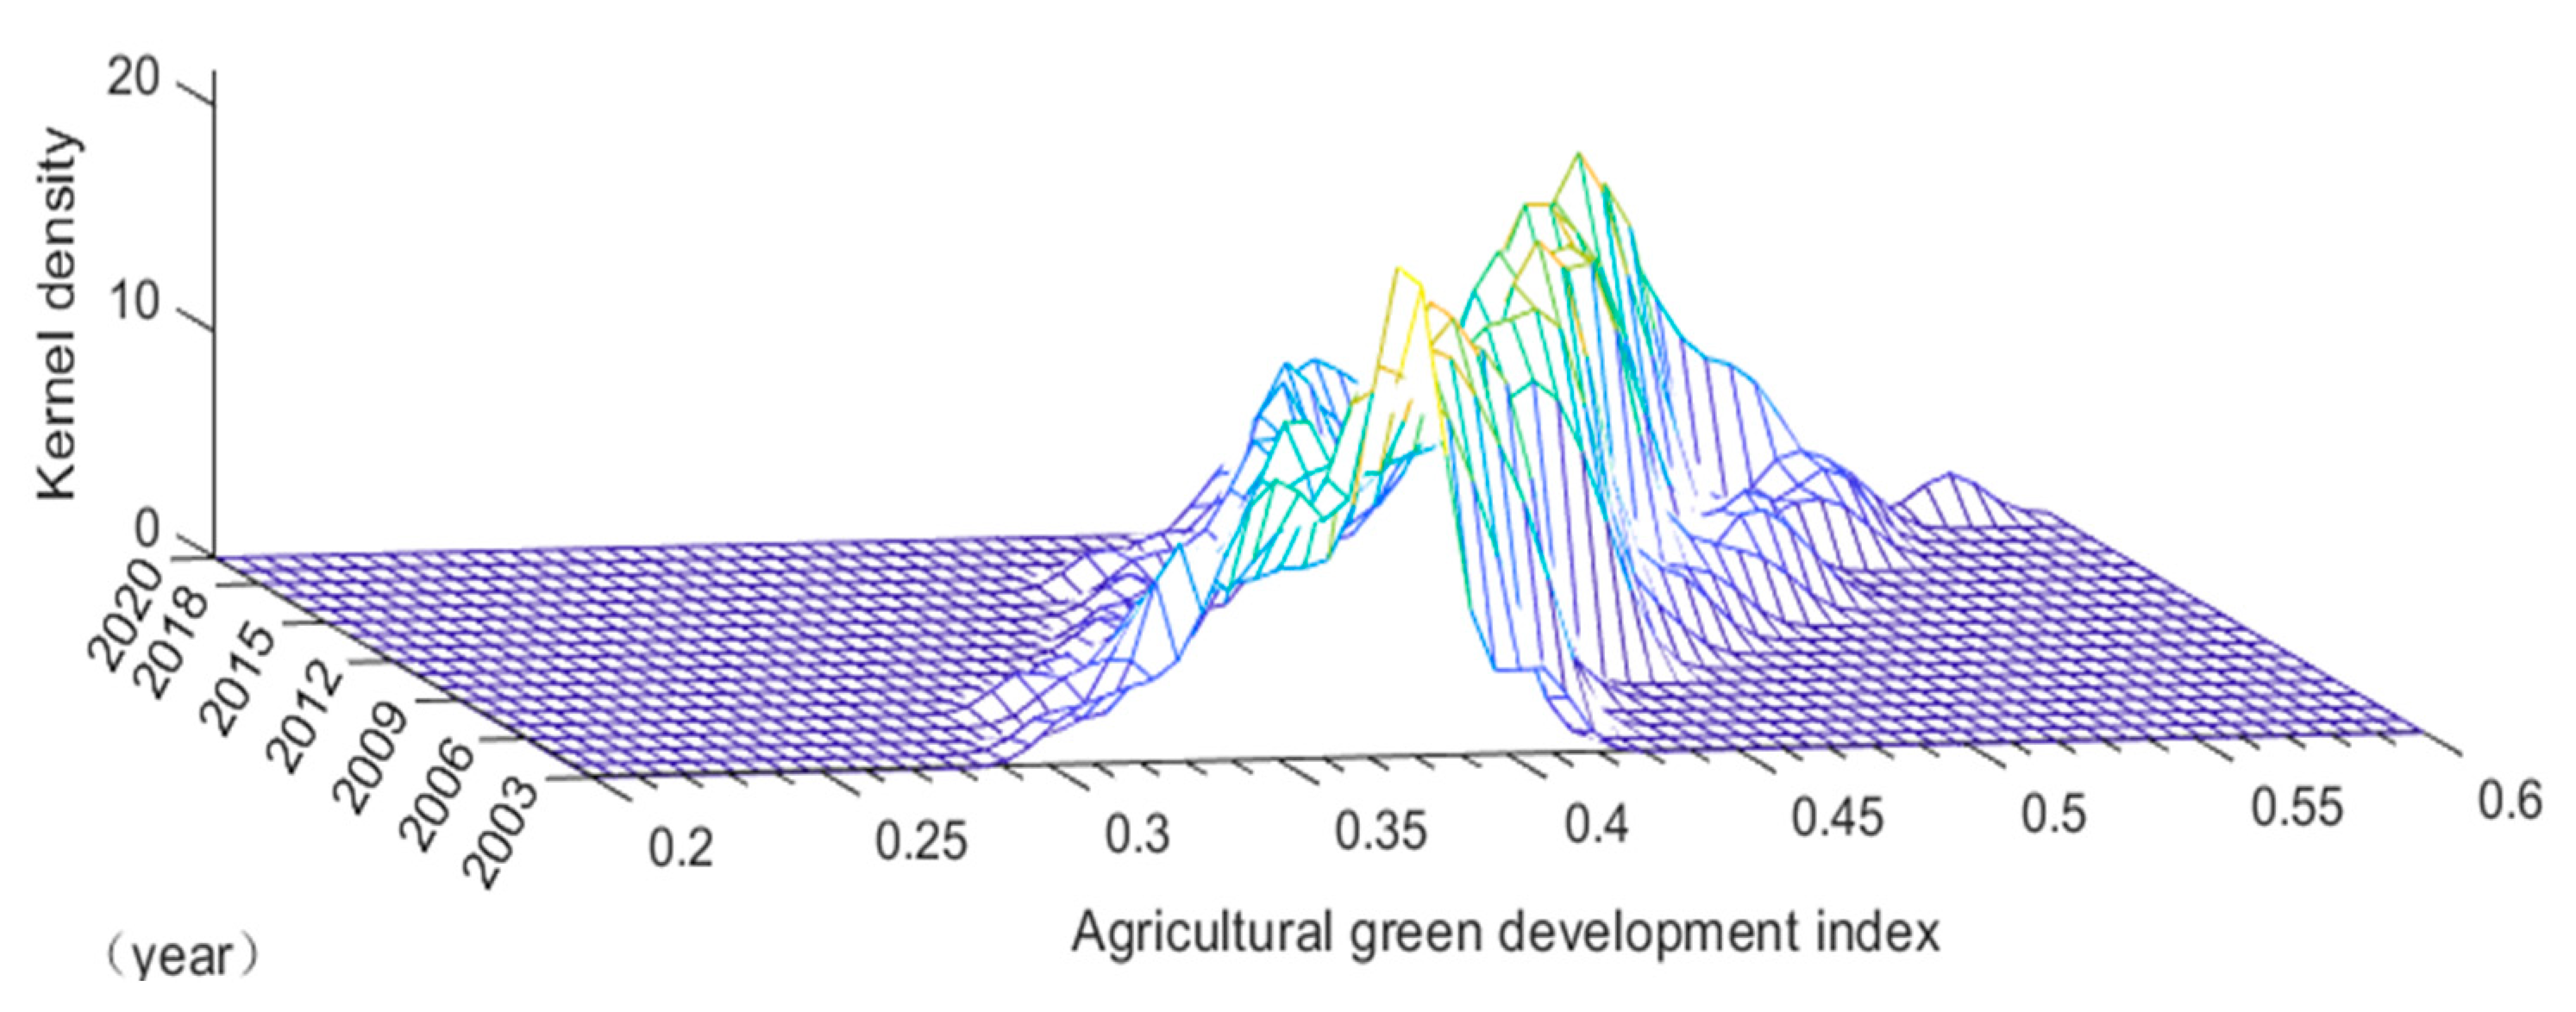
5.3.1. Temporal Evolution Trends Based on Kernel Density Estimation

The temporal evolution trends of agricultural green development in China can be effectively analyzed using kernel density estimation. This method provides insights into the changing distribution characteristics over time. By examining the position, number, morphology, and extension of density curves, we can gain a deeper understanding of the dynamic evolution of agricultural green development in China.
  • Overall Dynamic Evolution of Agricultural Green Development in China
From Figure 6, we can observe the evolving trends of agricultural green development in China from 2003 to 2020. In terms of distribution position, the curve shifts towards the right, indicating a continuous improvement in agricultural green development in China. Regarding the number of peaks, the transition from a bimodal distribution to a multi-modal distribution suggests an increased polarization in agricultural green development across the country, with significant disparities between secondary peaks and the main peak. In relation to the distribution shape, the height of the main peak gradually increases, and the width exhibits a widening trend, reflecting the expanding absolute disparities in agricultural green development across China. In terms of distribution extension, the distribution of agricultural green development shows a right-skewed tail, with an elongation of the tail over time. This indicates an expansion of the absolute disparities in agricultural green development among the different provinces. These changes can be attributed, in part, to the heterogeneous environmental resources and socio-economic conditions for agricultural green development across provinces and regions. While agricultural green development has progressed to varying degrees nationwide, the absolute disparities between leading and lagging regions have somewhat widened due to these heterogeneities.
2.
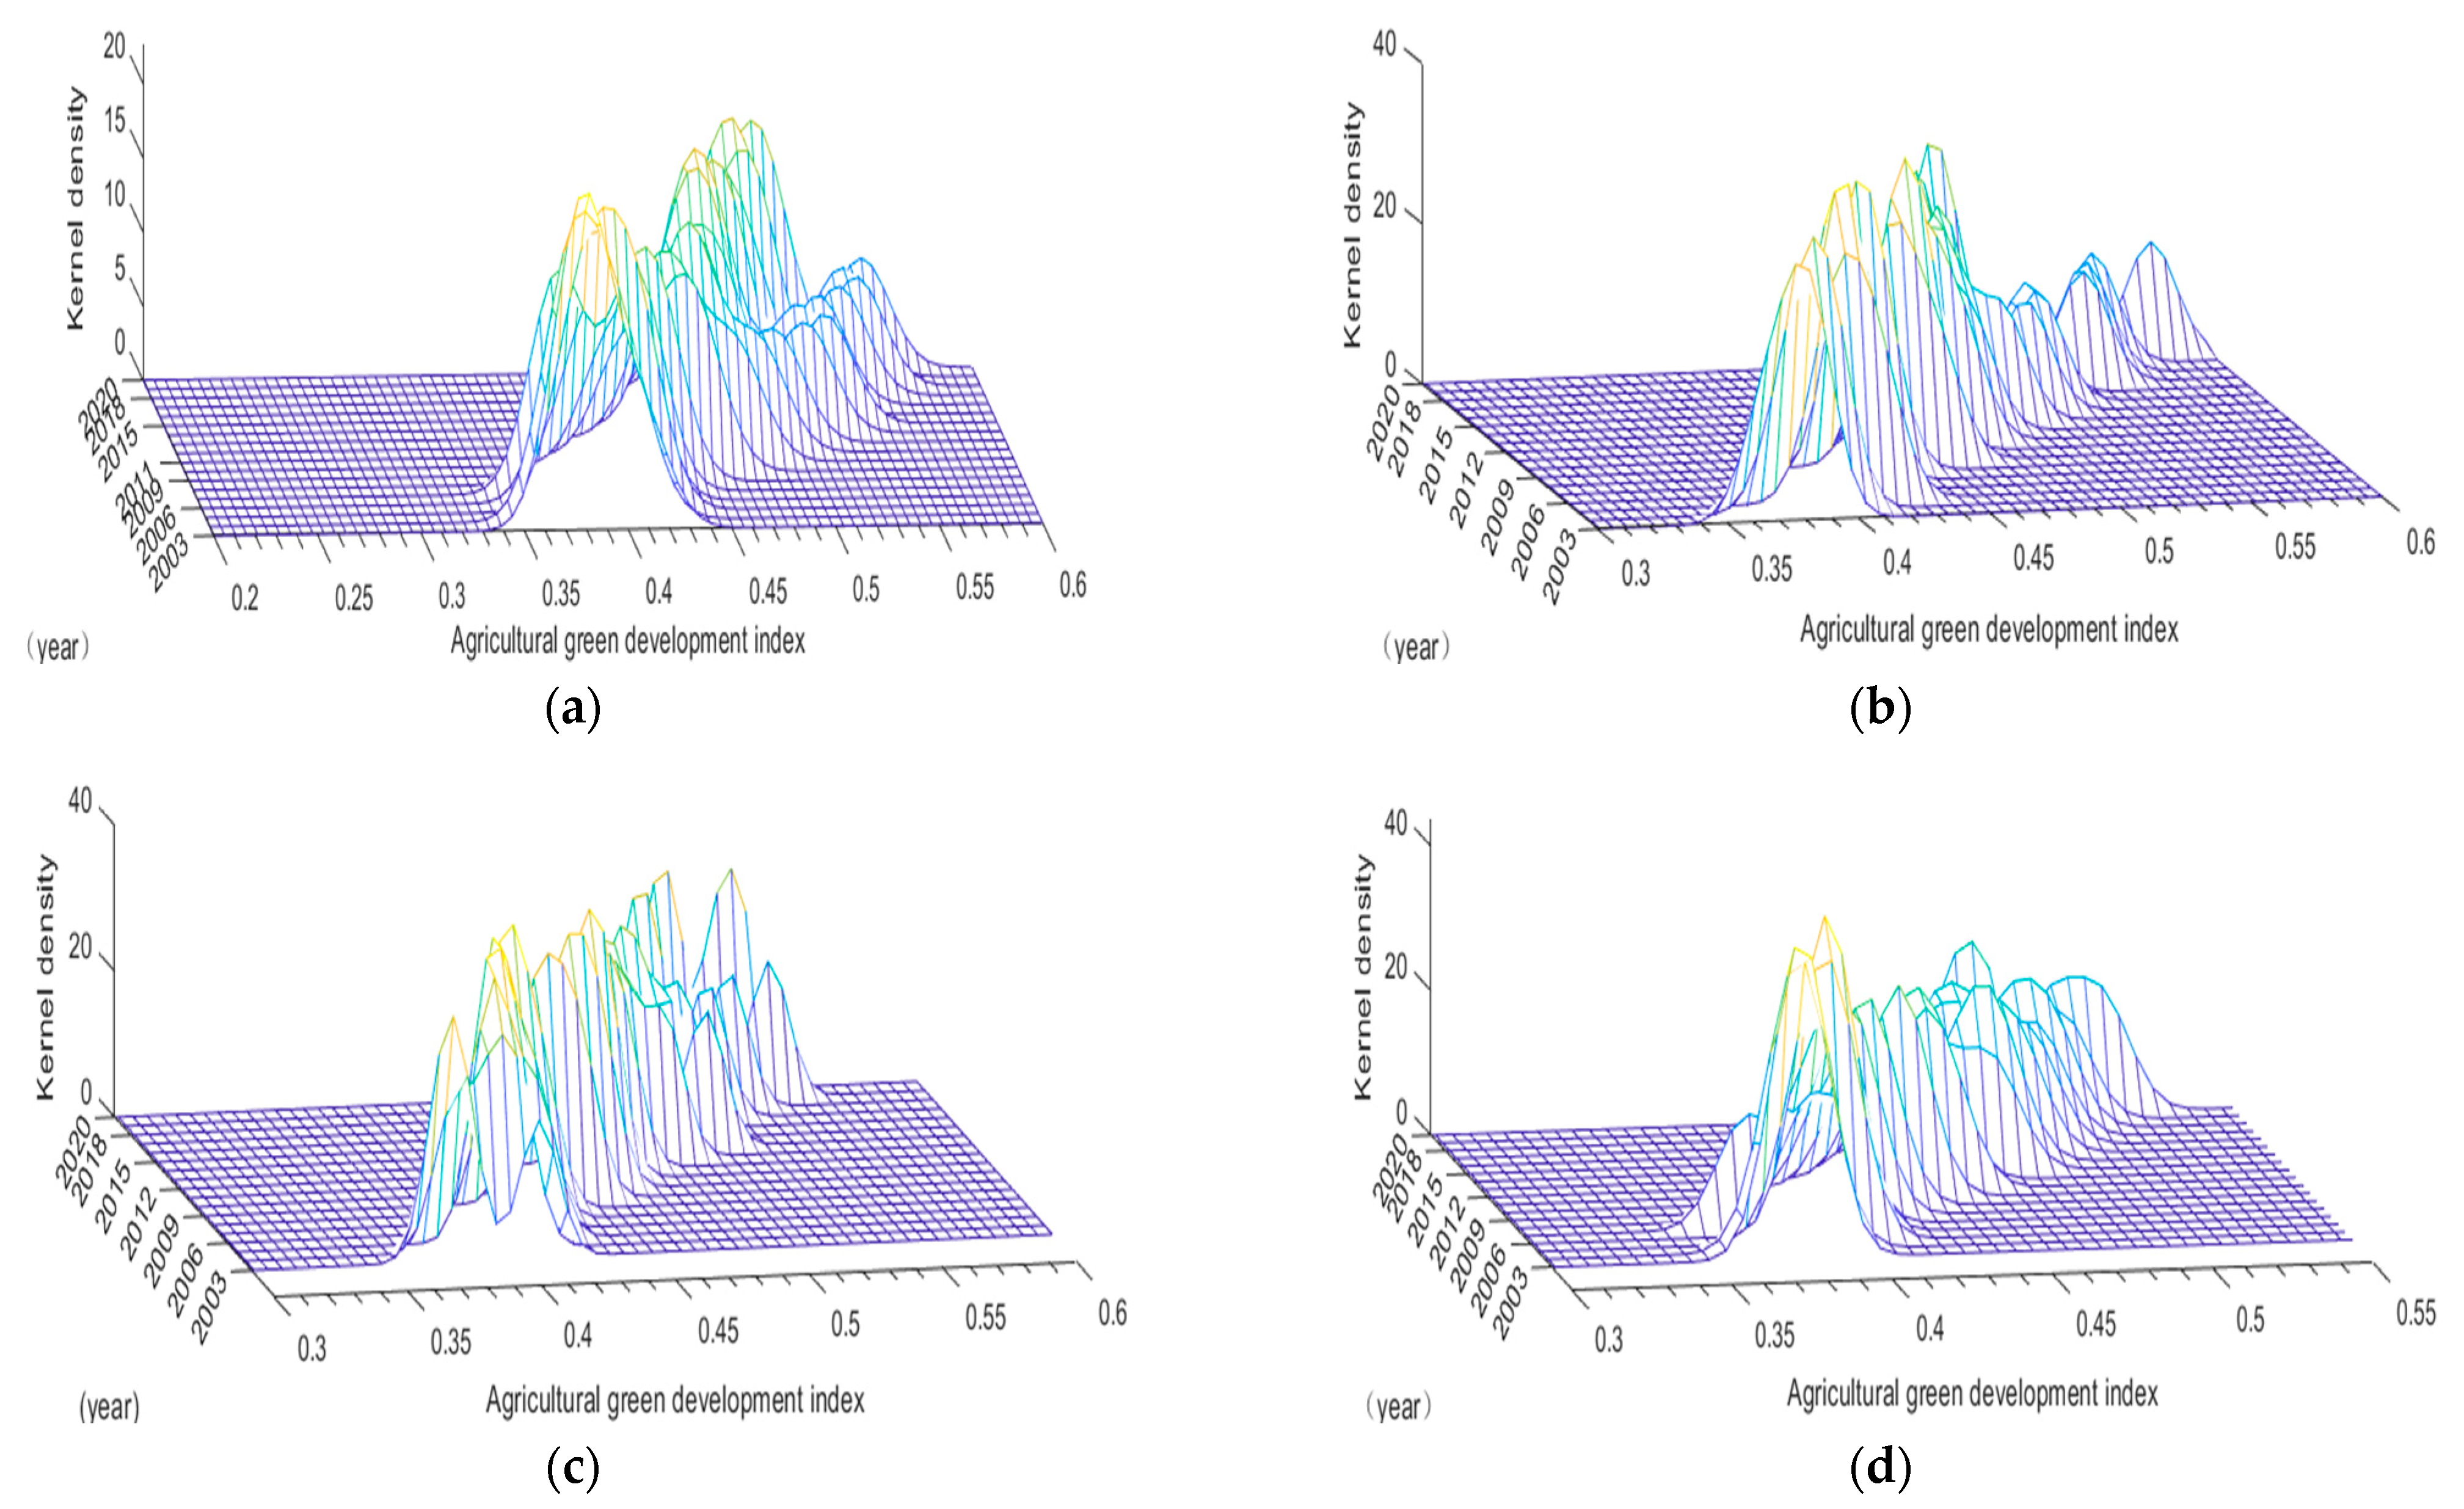
The spatial evolution of agricultural green development disparities in China’s eight major economic regions.
Based on Figure 7, the analysis of regional disparities and dynamic trends in the agricultural green development of China’s eight major economic regions is as follows: the changing distribution patterns revealed by the shifting positions in the kernel density estimation curves of the eight economic regions indicate varying degrees of rightward shifts. This reflects an overall upward trend in the agricultural green development levels across these regions. In other words, progress has been made in the agricultural green development of all eight economic regions, with the Northeast Comprehensive Economic Region showing the greatest magnitude of rightward shift. This suggests that, over time, the Northeast Comprehensive Economic Region has experienced the most significant improvement in its agricultural green development level. From the perspectives of distribution patterns and the number of peaks, the distribution curve in the northern coastal region demonstrates a transition from a unimodal to a bimodal pattern. The distance between the primary peak and the secondary peak is not significant, and the fluctuation of the primary peak’s height exhibits a decreasing-then-increasing trend. Furthermore, the curve width gradually widens, indicating an overall trend of contraction and expansion in the absolute differences of agricultural green development within the northern coastal region. This implies the existence of a certain degree of spatial polarization in the agricultural green development within this region, which is related to the strengthening polarization between Shandong Province and Beijing.
In the distribution curve of the Northeast Comprehensive Economic Region, there is an increasing trend in the fluctuation of the primary peak’s height, a widening trend in curve width, and a gradual evolution from a unimodal to a bimodal state. The distance between the primary peak and the secondary peak gradually increases. These observations indicate a pronounced spatial polarization in the agricultural green development within the Northeast Comprehensive Economic Region, with an expanding trend in the absolute differences of agricultural green development within the region. This phenomenon is related to the strengthened status of Heilongjiang Province within the region. The distribution curve in the Eastern Coastal Region exhibits a stable number of peaks, a relatively short distance and diminishing height difference between the primary peak and the secondary peak, and a gradual narrowing of the curve width. This suggests an overall trend of reduction in the absolute differences of agricultural green development within the Eastern Coastal Region and a weakening of the spatial polarization phenomenon in the internal agricultural green development. In the Southern Coastal Economic Region, the distribution curve shows a transition from a unimodal to a bimodal state, with an increasing distance between the primary peak and the secondary peak. The height of the primary peak demonstrates a downward trend, and the curve width gradually widens. These observations indicate a gradual emergence of spatial polarization in the agricultural green development within the Southern Coastal Economic Region, with a weak expanding trend in the absolute differences of agricultural green development within the region.
The distribution curve in the middle reaches of the Yellow River Economic Region demonstrates a gradual transition from unimodal to bimodal state, with an increasing distance between the primary and secondary peaks. The height of the primary peak exhibits a slow downward trend, while the curve width significantly widens. These observations indicate a gradual spatial polarization phenomenon in the agricultural green development within the middle reaches of the Yellow River Economic Region, accompanied by an overall expanding trend in the absolute differences of agricultural green development. This is further correlated with the intensified polarization status of Inner Mongolia within the region. In the distribution curve of the middle reaches of the Yangtze River Economic Region, there is a gradual transition from bimodal to unimodal state. The height of the primary peak demonstrates an ascending-then-descending trend, while the curve width varies between widening and narrowing. This suggests a weakening of the spatial polarization phenomenon in the agricultural green development within the middle reaches of the Yangtze River Economic Region, along with an overall trend of reduction in the absolute differences of the agricultural green development.
The distribution curve in the Southwestern Economic Region shows a gradual transition from bimodal to unimodal state. The height of the primary peak exhibits an ascending trend, while the curve width also varies between widening and narrowing. This indicates a weakening of the spatial polarization phenomenon in the agricultural green development within the Southwestern Economic Region, accompanied by an overall trend of reduction in the absolute differences of agricultural green development. This is correlated with the weakened polarization status of Sichuan and Chongqing within the region. In the distribution curve of the Northwestern Economic Region, there is a gradual transition from multimodal to unimodal state. The height of the primary peak demonstrates an ascending trend, while the curve width also varies between widening and narrowing. This signifies a weakening of the spatial polarization phenomenon in the agricultural green development within the northwestern economic region, along with an overall trend of reduction in the absolute differences of agricultural green development. This is correlated with the weakened polarization status of Ning xia within the region.
Overall, the agricultural green development levels in the eight regions exhibit a widespread phenomenon of polarization. Therefore, relevant departments in the future need to take measures to promote the balanced agricultural green development among provinces in different regions.

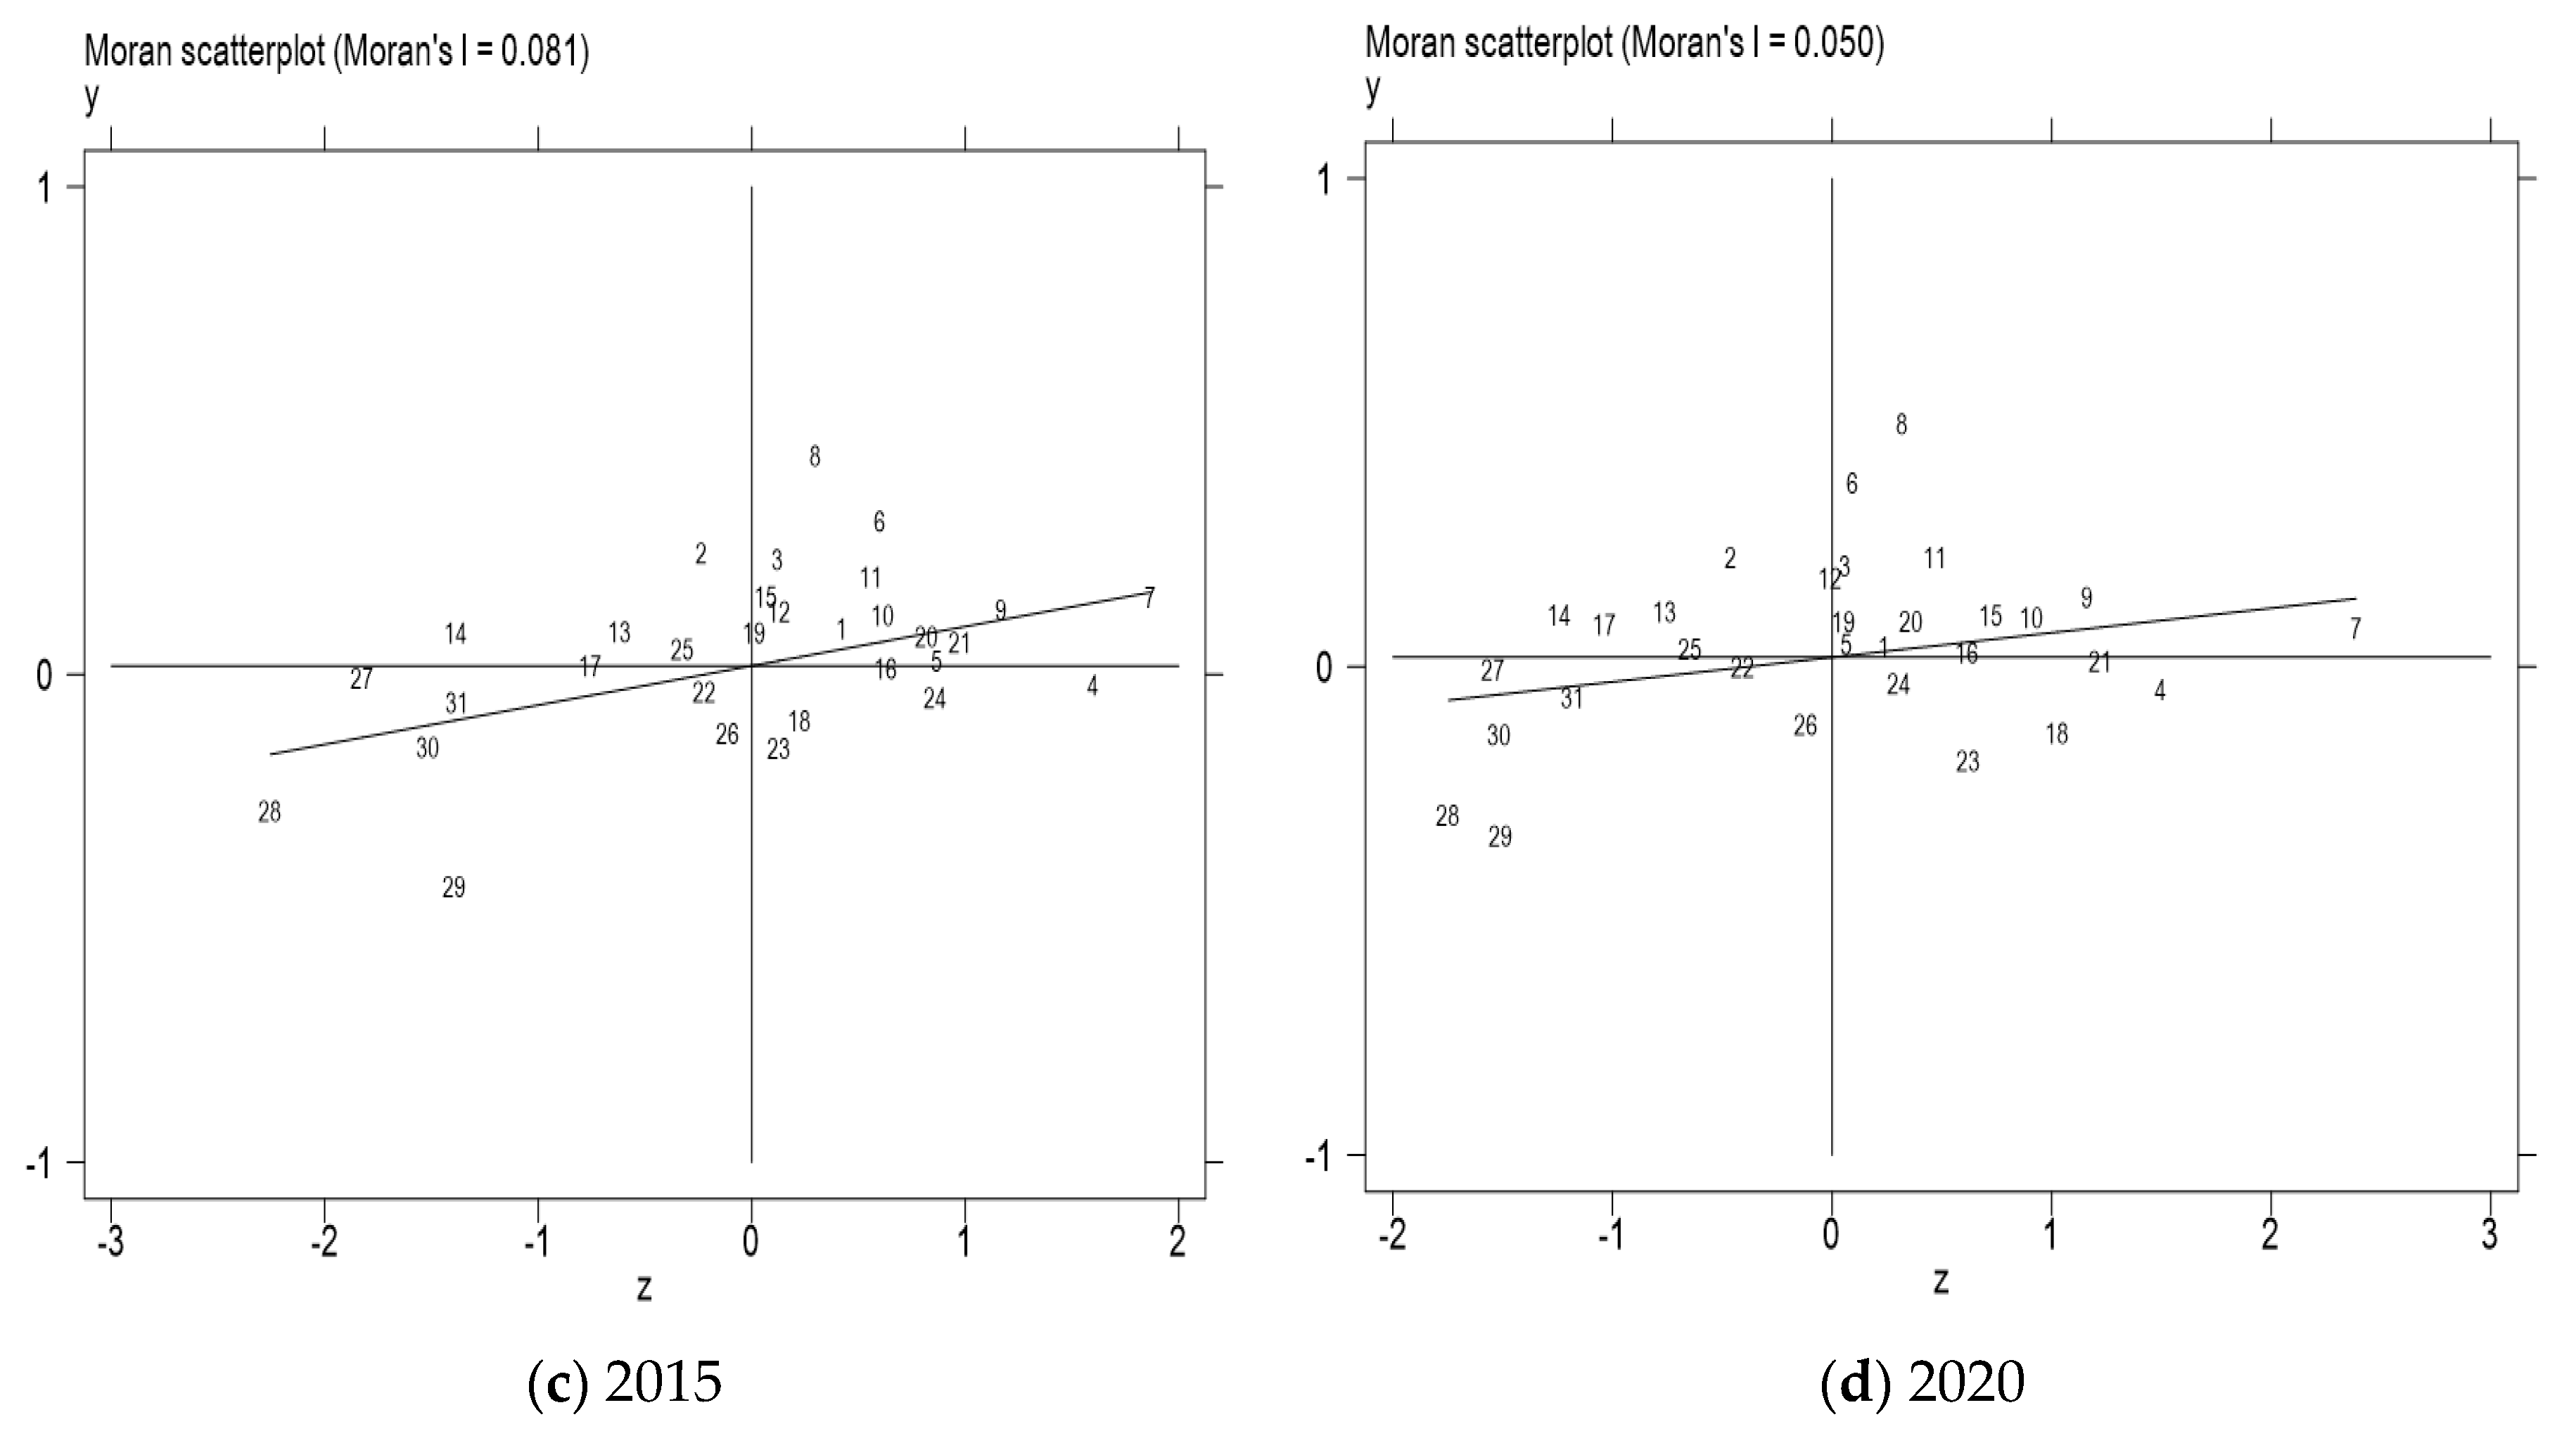
5.3.2. Spatial Evolution Trends Based on Moran’s I Index

1.
Global Spatial Correlation Analysis
To further investigate the spatial correlation of agricultural green development in China, a spatial adjacency matrix was used to analyze the regional spatial correlation degree of agricultural green development levels among 31 provinces from 2003 to 2020 (Table 10). It can be observed that the global Moran’s I index values for agricultural green development levels are all greater than 0.25, with p-values less than 0.01. This indicates a significant positive spatial correlation feature among provincial agricultural green development in China.
2.
Local Spatial Correlation Analysis
By utilizing the global Moran’s I index, we can obtain research results on the spatial correlation of agricultural green development. However, it fails to reflect the spatial correlation and its variations among provinces. Therefore, this study further employs the local Moran’s I index to investigate the spatial correlation of agricultural green development among the 31 provinces in China and presents a scatter plot of Moran’s I index for provincial-level agricultural green development (Figure 8). Additionally, to better illustrate the spatial clustering and distribution of agricultural green development levels across Chinese provinces, this study utilizes the spatial distribution maps of agricultural green development levels for the selected years (Figure 9). From Figure 8 and Figure 9, it is evident that the majority of Chinese provinces exhibit agglomeration in the first and third quadrants, indicating a “high–high” (H-H) and “low–low” (L-L) agglomeration pattern. Provinces such as Heilongjiang, Zhejiang, Shandong, and Shanghai are clustered in the first quadrant, primarily located in the Eastern Coastal and Northeastern Economic Regions, where the level of agricultural green development is relatively high. Simultaneously, Qinghai, Gansu, Ningxia, Xinjiang, and Tibet are clustered in the third quadrant, representing provinces with a low level of agricultural green development, mainly situated in the Northwestern Economic Region. As time progresses, the spatial clustering of provinces in China’s Eastern Coastal Economic Region and Northeastern Comprehensive Economic Region, characterized by high-level agricultural green development (H-H), becomes increasingly conspicuous.

5.4. State Evolution Trends Based on Markov Chain Analysis

To further analyze the dynamic evolution and steady-state distribution characteristics of agricultural green development in China, this study employs Markov chain analysis to investigate the direction and transition probabilities of agricultural green development. Firstly, the agricultural green development level is classified into four categories using the graded ratio method. Within these categories, the first 25% represents a low level, the range of 26%–50% represents a medium-low level, 51%–75% represents a medium-high level, and anything above 75% represents a high level. Matlab software was utilized to simulate the transition probability matrix for agricultural green development in China during different periods, ranging from 1 year to 4 years (Table 11). The diagonal values in the matrix represent the probability of agricultural green development in China remaining unchanged after t + 1 years, while the off-diagonal values represent the probability of transition in agricultural green development.

5.4.1. Traditional Markov Chain Analysis

From Table 11, it can be observed that, during periods ranging from 1 year to 2 years, the values on the diagonal are higher than the off-diagonal elements. Specifically, the lowest probability value on the diagonal for a 1-year period is 0.7698, while for a 2-year period, it is 0.5547. This indicates that during a 2-year period, agricultural green development in China exhibits a certain path dependence and steady-state characteristics. Furthermore, as the time period increases, the values on the diagonal become smaller than the elements in the upper triangle. When the period extends to 3–4 years, the diagonal elements become smaller than the upper triangular elements, suggesting that regions with different levels of agricultural green development can progress and ascend, but the time span for different regions to cross over varies. Specifically, the medium-high level-regions can achieve upward advancement within a 3-year period, while the medium-low and low-level regions require 4 years to accomplish the same. Additionally, within the next 1–4 years, except for the high-level regions, the stable probabilities of agricultural green development in the four categorized levels gradually decrease. The low-level region declines from 0.7929 to 0.3857, the medium-low-level region declines from 0.7698 to 0.1953, and the medium-high-level region declines from 0.8195 to 0.3. Meanwhile, the probabilities of upward advancement in agricultural green development gradually increase. The probability of transitioning from the low-level region to the medium-low-level rises from 0.2071 to 0.5429, the probability of transitioning from the medium-low-level to the medium-high-level increases from 0.2230 to 0.7578, and the probability of transitioning from the medium-high level to the high level rises from 0.1805 to 0.7. The high-level region remains stable. This indicates that, over time, the probability of transitioning from lower-level regions to adjacent higher-level regions increases significantly. There is no occurrence of transitions between non-adjacent states.

5.4.2. Spatial Markov Chain Analysis

Although traditional Markov chain analysis can reflect the transition probabilities of agricultural green development in China, it overlooks the spatial correlation effects to some extent. Given that the agricultural green development levels of different provinces and regions in China exhibit spatial correlation, a spatial Markov chain model is constructed by incorporating a spatial adjacency matrix to obtain the spatial transition probability matrix for agricultural green development during time periods of 1–4 years (Table 12). This allows for a deeper investigation of the spatial impact of neighboring regions’ agricultural green development levels on the focal region’s agricultural green development.
Firstly, during the same time period but within different spatial lag environments, the probabilities of maintenance, upward transition, and downward transition of agricultural green development levels exhibit variations within the same type of region, indicating clear spatial dependence. For example, taking the low-level agricultural green development region as an example, when the neighboring environments are low level, medium-low level, and medium-high level, the probabilities of maintenance in the low-level region are 0.8298, 0.75, and 0.6, respectively, while the probabilities of upward transition are 0.1702, 0.25, and 0.4, respectively. This suggests that, in the presence of neighboring environments with low level and medium-high levels, the agricultural green development status of the low-level region can be improved through spatial diffusion effects. However, when the neighboring environment is also low level, it further reinforces the path dependence of agricultural green development in the low-level region.
Secondly, during the same time period, different peripheral environments have distinct influences on the transition probabilities of different level regions. Using the 1-year period as an example, the probabilities of maintenance for the medium-low-level region under four different peripheral environmental conditions are 0.9444, 0.6731, 0.8049, and 0.5, respectively, while the probabilities of maintenance for the medium-high-level region are 1, 0.95, 0.8171, and 0.7333, respectively. From the perspective of probability variance, the medium-low-level region exhibits larger variations.
Lastly, under the same peripheral environmental conditions, as the time period increases, except for the high-level- and medium-high-level regions, the probabilities of maintaining the agricultural green development status for other regions gradually decrease, while the probabilities of upward transition show an increasing trend. Taking the low-level peripheral environment as an example, as the time period increases, the probabilities of maintenance for the low-level region are 0.8298, 0.6809, 0.5957, and 0.4894, respectively, while the probabilities of upward transition are 0.1702, 0.3191, 0.3936, and 0.4574, respectively. For the medium-low-level region, the probabilities of maintenance are 0.9444, 0.7778, 0.5556, and 0.3056, respectively, while the probabilities of upward transition are 0.0278, 0.1944, 0.3889, and 0.6389, respectively. The magnitude of the decline in maintenance rates and the increase in upward transition probabilities varies across different regions, and the conclusions are consistent with the results of traditional Markov chain analysis.

6. Discussion

To study the level of agricultural green development in China, regional disparities, and their evolution, this study constructs an evaluation framework for agricultural green development based on the theory of sustainable development. The evaluation system includes five dimensions: resource conservation, ecological stability, clean production, supply security, and efficiency improvement. The entropy-TOPSIS method is used to measure the level of agricultural green development in China from 2003 to 2020. The analysis is conducted at the national level, including eight economic regions, and provincial levels to examine the situation of agricultural green development in China. The Dagum Gini coefficient and its decomposition method are employed to measure and analyze the regional disparities in agricultural green development in China. The sources of regional disparities in agricultural green development are identified. This study also utilizes kernel density estimation, Moran’s I index, and Markov chains to explore the temporal, spatial, and transition probability aspects of agricultural green development distribution dynamics and evolution.
Firstly, the overall agricultural green development level in China, as well as in the 8 economic regions and 31 provinces, is steadily improving. The indicators of resource conservation, ecological stability, and clean production in agricultural green development generally have lower scores, while the dimensions of supply security and efficiency improvement have higher scores. However, the comprehensive index of agricultural green development is still relatively low, indicating room for improvement. From a regional perspective, there are significant differences in agricultural green development among the eight economic regions. The Northeast Comprehensive Economic Region, the Eastern Coastal Economic Region, the Yangtze River Middle Economic Region, and the Northern Coastal Economic Region are relatively advanced in agricultural green development, while the Northwest Economic Region has the lowest level of agricultural green development. At the provincial level, all 31 provinces in China have made steady progress in agricultural green development. The top-ranking provinces in terms of agricultural green development in 2020 are Heilongjiang, Shandong, Hunan, and Jiangsu, while the provinces ranking lower include Shanxi, Qinghai, Ningxia, Tibet, and Gansu.
Moreover, in relation to the disparities in China’s agricultural green development, the period from 2003 to 2020 witnessed a fluctuating downward trend characterized by an initial ascent, followed by a descent, and then another ascent and descent. When examining the sources of these disparities, it becomes evident that inter-regional differences and the density of exceptional variations play a significant role in shaping the discrepancies in agricultural green development. Particularly, inter-regional differences emerge as the central factor contributing to the overall disparities, exerting the highest influence on the total differences. Furthermore, while inter-regional disparities exhibit a decline in volatility, the density of exceptional variations experiences an upward fluctuation, thereby displaying an inverse relationship between the two. The Gini coefficients of agricultural green development within China’s eight major economic regions demonstrate distinct stratification, although the Gini coefficients within each region undergo substantial changes during the observation period. Notably, the Northern Coastal Economic Region displays the most substantial magnitude of variations, whereas the Northwestern Economic Region exhibits the smallest magnitude of variations. In terms of inter-regional disparities, significant differences exist between the Northwestern Economic Region and the Northeastern Comprehensive Economic Region, as well as the Northern Coastal and Eastern Coastal Economic Regions, which are regions characterized by advanced agricultural green development.
Furthermore, in terms of the temporal dynamics of agricultural green development in China, the period from 2003 to 2020 witnessed an extension towards the right and an increase in the width of the kernel density estimation curve, indicating a continuous enhancement in the level of agricultural green development in China. Simultaneously, this extension highlights the widening absolute disparities among different provinces within each economic region. Additionally, the central positions and variation ranges of the kernel density estimation curves within China’s eight major economic regions exhibit varying degrees of rightward shift, reflecting an overall upward trend in agricultural green development across these regions. Particularly, the Northeastern Comprehensive Economic Region demonstrates the most significant magnitude of rightward shift, indicating the largest improvement in agricultural green development within this region over time. Moreover, the distribution patterns, extent of distribution spread, and the number of peaks in the kernel density estimation curves vary across the eight major economic regions, indicating different degrees of polarization in terms of agricultural green development.
Lastly, in terms of the spatial dynamics of agricultural green development in China, from 2003 to 2020, there is a clear spatial positive correlation in the level of agricultural green development. The majority of provinces exhibit clustering in the first and third quadrants, indicating a pattern of “high–high” (H-H) and “low–low” (L-L) agglomeration. Provinces with relatively high levels of agricultural green development, such as Heilongjiang, Zhejiang, Shandong, and Shanghai, are clustered in the first quadrant, representing regions with high levels of agricultural green development primarily located in the Eastern Coastal and Northeastern Economic Regions. Meanwhile, provinces like Qinghai, Gansu, Ningxia, Xinjiang, and Tibet are clustered in the third quadrant, indicating a pattern of low agricultural green development concentration in the provinces of the Northwest Economic Region. The Markov chain analysis reveals that the level of agricultural green development in China exhibits a certain degree of stability. Over time, the probability of transition from lower-level regions to neighboring higher-level regions increases. However, there is no occurrence of cross-state transitions. Notably, the probability and magnitude of upward transitions from the medium-low level to the medium-high level are the highest. This indicates that the surrounding environment influences the spatial transition probability of agricultural green development, highlighting the evident spatial dependence of agricultural green development in China.
In this study, a comprehensive analysis of the level of agricultural green development, regional disparities, and dynamic evolution in China was conducted by constructing an evaluation framework based on the perspective of sustainable development. Due to the close economic connections and the flow of agricultural products between different regions in China, agricultural production and supply are often transregional. The state of agricultural green development in one region may have an impact on other regions. Therefore, it is necessary to study the spatial correlation of agricultural green development between the different regions in future research. On one hand, studying the spatial correlation of agricultural green development can contribute to optimizing the circulation and supply chain of agricultural products, thereby improving the overall level of agricultural green development. On the other hand, different regions may have variations in agricultural green development policies and development goals. By studying the spatial correlation of agricultural green development between different regions, policymakers can gain insights into promoting policy coordination and cooperation among regions, leading to synergistic effects in overall agricultural green development. Therefore, investigating the spatial correlation of agricultural green development is a key direction for future research, enabling a better understanding of the interdependence and interaction among regions.
Furthermore, due to limitations in data availability, this study examines the levels of agricultural green development, spatial disparities, and dynamic evolution in China from three dimensions: national, eight major economic regions, and provincial. China’s prefecture-level cities and counties serve as the specific implementing units for agricultural policies. Conducting research at the level of prefecture-level cities or counties can provide decision-making support and policy recommendations to local governments, facilitating the transition of agriculture towards green and sustainable development. Exploring agricultural green development from the perspective of prefecture-level cities and counties enables a better adaptation to local agricultural production conditions and environmental characteristics, leading to the formulation of practical and actionable strategies and measures for green development. Thus, focusing on prefecture-level cities and counties becomes a key direction and content for future research on agricultural green development.

7. Conclusions and Policy Recommendations

This study develops a comprehensive evaluation framework for agricultural green development in China based on the principles of sustainable development. Findings of this study include the following: the overall level of green development in Chinese agriculture has steadily improved. There are significant differences in the level of agricultural green development among the eight major economic regions, showing a fluctuating downward trend characterized by an initial rise, subsequent decline, and subsequent rise again. The regional variations are the main cause of the overall differences in agricultural green development in China. The eight major economic regions in China have experienced steady development in terms of agricultural green development. However, there are disparities in the speed of agricultural green development among these regions, indicating varying degrees of polarization. There is a noticeable spatial positive correlation in the level of agricultural green development in China. Most provinces are concentrated in the first and third quadrants, demonstrating a pattern of “high–high” (H-H) agglomeration and “low–low” (L-L) agglomeration. The level of agricultural green development in China exhibits a certain degree of stability. Over time, the probability of transitioning from lower-level regions to adjacent higher-level regions increases. However, there is no phenomenon of transitioning across states. The level of agricultural green development in neighboring regions can affect the spatial transition probability of agricultural green development in a given region, indicating a significant spatial dependency in agricultural green development.
Based on the conclusions of this study, the following measures can be taken to further promote agricultural green development in China: firstly, it is crucial to strengthen top-level design and enhance the governance system for agricultural green development. As the promotion of agricultural green development in China requires a systematic approach, relevant government departments should undertake effective top-level design and formulate feasible plans for agricultural green development. Tailored policies and measures should be developed based on local conditions to enhance policy implementation and relevance. By improving the mechanism of interest coordination and establishing paired assistance mechanisms, synergistic development can be strengthened. Exploring the establishment of paired assistance mechanisms can facilitate overall improvements in China’s agricultural green development by leveraging the expertise of advanced regions to support the development of less advanced regions.
Secondly, it is important to strengthen the protection of water and land resources to ensure supply security. Arable land resources are the foundation and prerequisite for food security, as the quantity and quality of arable land fundamentally determine agricultural production. Similarly, water resources directly affect agricultural production capacity. Therefore, water and land resources, as fundamental resources for agricultural green development, have a direct impact on the level of agricultural green development. Establishing mechanisms for the protection and restoration of soil fertility, improving fallow and crop rotation systems, and achieving a balance between land use and conservation are crucial for preserving the quantity and quality of arable land. It is important to expedite the construction of high-standard farmland and establish and strengthen water-saving irrigation projects for farmland. This includes increasing investments in the construction and upgrading of agricultural water conservancy infrastructure. Gradually transitioning from canal irrigation to pipeline water supply can significantly improve agricultural water use efficiency.
Thirdly, technological innovation must be strengthened to enhance the intrinsic driving force of agricultural green development. Technological innovation in agriculture is the core driving force for promoting agricultural green development and a key element supporting sustainable agricultural development. Under the influence of the law of diminishing returns, the marginal output of agricultural labor and land, among other production factors, will decrease. Agricultural technological innovation and progress not only effectively offset the negative impact of the law of diminishing returns on agricultural economic growth but also contribute to the effective management of agricultural ecological environmental issues, promoting agricultural green and sustainable development.

Author Contributions

Conceptualization, F.Z.; methodology, F.Z.; software, F.Z.; validation, F.Z.; formal analysis, F.Z.; investigation, F.Z.; resources, F.Z.; data curation, F.Z.; writing—original draft preparation, F.Z.; writing—review and editing, F.Z.; visualization, F.Z.; supervision, C.W. All authors have read and agreed to the published version of the manuscript.

Funding

This research was supported by Project of Suzhou University (2021yzd11) “Research on problems and countermeasures of local colleges and universities serving rural revitalization”, Scientific Research Project of Hunan Provincial Department of Education (19B277), Project Approved by Hunan Provincial Philosophy and Social Science Achievement Evaluation Committee (XSP20ZDI006), China National Social Science Foundation Project (20AJY012) “Research on the Mechanism and Policy System of Promoting the High-quality Development of Grain Economy in Main Production Areas from a Three-Dimensional Perspective”.

Data Availability Statement

All data used in this paper were collected from the China Statistical Yearbook, China Rural Statistical Yearbook, China Agricultural Statistical Yearbook, China Environmental Statistical Yearbook, China Energy Statistical Yearbook, China Agricultural Machinery Industry Yearbook, China Science and Technology Statistical Yearbook, China Population and Employment Statistical Yearbook, and Chinese provincial statistical yearbooks. The original contributions presented in this study are included in the article, further inquiries can be directed to the corresponding author.

Acknowledgments

YaJie Wang contributed to the writing, empirical analysis, and revision of the manuscript.

Conflicts of Interest

The author declares that the research was conducted in the absence of any commercial or financial relationships that could be construed as a potential conflict of interest.

Abbreviations

The following abbreviations are used in this manuscript: NCER (Northeast Comprehensive Economic Region); NCCER (Northern Coastal Comprehensive Economic Region; ECCER (Eastern Coastal Comprehensive Economic Region); SCER (Southern Coastal Economic Region); YRCER (Yellow River Basin Comprehensive Economic Region); YRBCE (Yangtze River Basin Comprehensive Economic Region); GSCER (Great Southwest Comprehensive Economic Region); GNCER (Great Northwest Comprehensive Economic Region). Province numbers: Liaoning (6), Jilin (7), Heilongjiang (8), Beijing (1), Tianjin (2), Hebei (3), Shandong (15), Shanghai (9), Jiangsu (10), Zhejiang (11), Fujian (13), Guangdong (19), Hainan (21), Shaanxi (27), Shanxi (4), Henan (16), Inner Mongolia (5), Hubei (17), Hunan (18), Jiangxi (14), Anhui (12), Yunnan (25), Guizhou (24), Sichuan (23), Chongqing (22), Guangxi (20), Gansu (28), Qinghai (29), Ningxia (30), Tibet (26), Xinjiang (31).

References

  1. Call, M.; Gray, C. Climate anomalies, land degradation and rural out-migration in Uganda. Popul. Environ. 2020, 41, 507–528. [Google Scholar] [CrossRef] [PubMed]
  2. Wang, X.; Song, C.; Cheng, C.; Ye, S.; Shen, S. Cross-national Perspectives on Using Sustainable Development Goals (SDGs) Indicators for Monitoring Sustainable Development: A Database and Analysis. Chin. Geogr. Sci. 2021, 31, 600–610. [Google Scholar] [CrossRef]
  3. Van de Graaf, T. Obsolete or resurgent? The International Energy Agency in a changing global landscape. Energy Policy 2012, 48, 233–241. [Google Scholar] [CrossRef]
  4. Yang, M.; Li, M.; Luo, X. 50 Years of Agricultural Mechanization in China. Ama-Agric. Mech. Asia Afr. Lat. Am. 2020, 51, 86–92. [Google Scholar]
  5. Chou, L.; Dai, J.; Qian, X.; Karimipour, A.; Zheng, X. Achieving sustainable soil and water protection: The perspective of agricultural water price regulation on environmental protection. Agric. Water Manag. 2021, 245, 106583. [Google Scholar] [CrossRef]
  6. Li, Z.; Jin, M.; Cheng, J. Economic growth of green agriculture and its influencing factors in china: Based on emergy theory and spatial econometric model. Environ. Dev. Sustain. 2021, 23, 15494–15512. [Google Scholar] [CrossRef]
  7. Jiang, S.; Qiu, S.; Zhou, J. Re-Examination of the Relationship between Agricultural Economic Growth and Non-Point Source Pollution in China: Evidence from the Threshold Model of Financial Development. Water 2020, 12, 2609. [Google Scholar] [CrossRef]
  8. Chen, Y.; Miao, J.; Zhu, Z. Measuring green total factor productivity of China’s agricultural sector: A three-stage SBM-DEA model with non-point source pollution and CO2 emissions. J. Clean. Prod. 2021, 318, 128543. [Google Scholar] [CrossRef]
  9. Huang, X.; Feng, C.; Qin, J.; Wang, X.; Zhang, T. Measuring China’s agricultural green total factor productivity and its drivers during 1998–2019. Sci. Total Environ. 2022, 829, 154477. [Google Scholar] [CrossRef]
  10. Wang, F.; Du, L.; Tian, M. Does Agricultural Credit Input Promote Agricultural Green Total Factor Productivity? Evidence from Spatial Panel Data of 30 Provinces in China. Int. J. Environ. Res. Public Health 2023, 20, 529. [Google Scholar] [CrossRef]
  11. Shan, T.; Xia, Y.; Hu, C.; Zhang, S.; Zhang, J.; Xiao, Y.; Dan, F. Analysis of regional agricultural carbon emission efficiency and influencing factors: Case study of Hubei Province in China. PLoS ONE 2022, 17, e0266172. [Google Scholar] [CrossRef] [PubMed]
  12. Wang, G.; Liao, M.; Jiang, J. Research on Agricultural Carbon Emissions and Regional Carbon Emissions Reduction Strategies in China. Sustainability 2020, 12, 2627. [Google Scholar] [CrossRef] [Green Version]
  13. Yi, Y.; Gu, C. Impact of structure and organization of smallholders on agricultural carbon emissions. Front. Environ. Sci. 2022, 10, 2567. [Google Scholar] [CrossRef]
  14. Chen, Z.; Li, X.; Xia, X. Measurement and spatial convergence analysis of China’s agricultural green development index. Environ. Sci. Pollut. Res. 2021, 28, 19694–19709. [Google Scholar] [CrossRef]
  15. Guo, H.; Xu, S.; Pan, C. Measurement of the Spatial Complexity and Its Influencing Factors of Agricultural Green Development in China. Sustainability 2020, 12, 9259. [Google Scholar] [CrossRef]
  16. Wan, M.; Kuang, H.; Yang, Y.; He, B.; Zhao, S.; Wang, Y.; Huo, J. Evaluation of Agricultural Green Development Based on Gini Coefficient and Hesitation Fuzzy Multi-Attribute Decision-Making: The Case of China. Agriculture 2023, 13, 699. [Google Scholar] [CrossRef]
  17. Kansanga, M.; Andersen, P.; Kpienbaareh, D.; Mason-Renton, S.; Atuoye, K.; Sano, Y.; Antabe, R.; Luginaah, I. Traditional agriculture in transition: Examining the impacts of agricultural modernization on smallholder farming in Ghana under the new Green Revolution. Int. J. Sustain. Dev. World Ecol. 2019, 26, 11–24. [Google Scholar] [CrossRef]
  18. Alsanius, B.W.; Karlsson, M.; Rosberg, A.K.; Dorais, M.; Naznin, M.T.; Khalil, S.; Bergstrand, K.-J. Light and Microbial Lifestyle: The Impact of Light Quality on Plant-Microbe Interactions in Horticultural Production Systems—A Review. Horticulturae 2019, 5, 41. [Google Scholar] [CrossRef] [Green Version]
  19. Gargano, G.; Licciardo, F.; Verrascina, M.; Zanetti, B. The Agroecological Approach as a Model for Multifunctional Agriculture and Farming towards the European Green Deal 2030-Some Evidence from the Italian Experience. Sustainability 2021, 13, 2215. [Google Scholar] [CrossRef]
  20. Huang, T.; Xiong, B. Space Comparison of Agricultural Green Growth in Agricultural Modernization: Scale and Quality. Agriculture 2022, 12, 1067. [Google Scholar] [CrossRef]
  21. Liu, Y.; Wang, X. Promoting Competitiveness of Green Brand of Agricultural Products Based on Agricultural Industry Cluster. Wirel. Commun. Mob. Comput. 2022, 2022, 7824638. [Google Scholar] [CrossRef]
  22. Zhang, X.; Chen, H. agricultural green development Based on Information Communication Technology and the Panel Space Measurement Model. Sustainability 2021, 13, 1147. [Google Scholar] [CrossRef]
  23. Wang, G.; Yang, D.; Xiong, C. Dynamic Evaluation and Spatial Distribution Characteristics of Agricultural Green Development Level in Restricted Development Areas: A Case Study of Yili River Valley, China. Pol. J. Environ. Stud. 2021, 30, 4255–4266. [Google Scholar] [CrossRef]
  24. Hou, D.; Wang, X. Measurement of Agricultural Green Development Level in the Three Provinces of Northeast China Under the Background of Rural Vitalization Strategy. Front. Public Health 2022, 10, 824202. [Google Scholar] [CrossRef] [PubMed]
  25. Luo, J.; Huang, M.; Hu, M.; Bai, Y. How does agricultural production agglomeration affect green total factor productivity?: Empirical evidence from China. Environ. Sci. Pollut. Res. 2023, 30, 67865–67879. [Google Scholar] [CrossRef]
  26. Saghaian, S.; Mohammadi, H.; Mohammadi, M. The Effects of Agricultural Product Exports on Environmental Quality. Sustainability 2022, 14, 13857. [Google Scholar] [CrossRef]
  27. Xu, X.; Zhang, N.; Zhao, D.; Liu, C. The effect of trade openness on the relationship between agricultural technology inputs and carbon emissions: Evidence from a panel threshold model. Environ. Sci. Pollut. Res. 2021, 28, 9991–10004. [Google Scholar] [CrossRef]
  28. Ge, P.; Liu, T.; Wu, X.; Huang, X. Heterogenous Urbanization and Agricultural Green Development Efficiency: Evidence from China. Sustainability 2023, 15, 5682. [Google Scholar] [CrossRef]
  29. Ben Jebli, M.; Ben Youssef, S. Renewable energy consumption and agriculture: Evidence for cointegration and Granger causality for Tunisian economy. Int. J. Sustain. Dev. World Ecol. 2017, 24, 149–158. [Google Scholar] [CrossRef] [Green Version]
  30. Weinzettel, J.; Wood, R. Environmental Footprints of Agriculture Embodied in International Trade: Sensitivity of Harvested Area Footprint of Chinese Exports. Ecol. Econ. 2018, 145, 323–330. [Google Scholar] [CrossRef]
  31. Du, Y.; Liu, H.; Huang, H.; Li, X. The carbon emission reduction effect of agricultural policy--Evidence from China. J. Clean. Prod. 2023, 406, 137005. [Google Scholar] [CrossRef]
  32. Sun, Y. Environmental regulation, agricultural green technology innovation, and agricultural green total factor productivity. Front. Environ. Sci. 2022, 10, 955954. [Google Scholar] [CrossRef]
  33. Wang, W.; Li, K.; Liu, Y.; Lian, J.; Hong, S. A system dynamics model analysis for policy impacts on green agriculture development: A case of the Sichuan Tibetan Area. J. Clean. Prod. 2022, 371, 133562. [Google Scholar] [CrossRef]
  34. Xu, L.; Jiang, J.; Du, J. The Dual Effects of Environmental Regulation and Financial Support for Agriculture on Agricultural Green Development: Spatial Spillover Effects and Spatio-Temporal Heterogeneity. Appl. Sci. 2022, 12, 11609. [Google Scholar] [CrossRef]
  35. Lin, Y.; Li, C. Towards sustainable development: Research on the green growth effect of digital agriculture in China. Environ. Sci. Pollut. Res. Int. 2023, 38, 36–47. [Google Scholar] [CrossRef] [PubMed]
  36. Zhu, Y.; Zhang, Y.; Piao, H. Does Agricultural Mechanization Improve the Green Total Factor Productivity of China’s Planting Industry? Energies 2022, 15, 940. [Google Scholar] [CrossRef]
  37. Zhang, F.; Wang, F.; Hao, R.; Wu, L. Agricultural Science and Technology Innovation, Spatial Spillover and Agricultural Green Development-Taking 30 Provinces in China as the Research Object. Appl. Sci. 2022, 12, 845. [Google Scholar] [CrossRef]
  38. Gao, Q.; Cheng, C.; Sun, G.; Li, J. The Impact of Digital Inclusive Finance on Agricultural Green Total Factor Productivity: Evidence From China. Front. Ecol. Evol. 2022, 10, 905644. [Google Scholar] [CrossRef]
  39. Hou, D.; Wang, X. Inhibition or Promotion?-The Effect of Agricultural Insurance on Agricultural Green Development. Front. Public Health 2022, 10, 910534. [Google Scholar] [CrossRef]
  40. Fang, L.; Hu, R.; Mao, H.; Chen, S. How crop insurance influences agricultural green total factor productivity: Evidence from Chinese farmers. J. Clean. Prod. 2021, 321, 128977. [Google Scholar] [CrossRef]
  41. Mei, B.; Khan, A.A.; Khan, S.U.; Ali, M.A.S.; Luo, J. An Estimation of the Effect of Green Financial Policies and Constraints on Agriculture Investment: Evidences of Sustainable Development Achievement in Northwest China. Front. Public Health 2022, 10, 903431. [Google Scholar] [CrossRef]
  42. Jiang, Y.; Li, K.; Chen, S.; Fu, X.; Feng, S.; Zhuang, Z. A sustainable agricultural supply chain considering substituting organic manure for chemical fertilizer. Sustain. Prod. Consum. 2022, 29, 432–446. [Google Scholar] [CrossRef]
  43. Xiuling, D.; Qian, L.; Lipeng, L.; Sarkar, A. The Impact of Technical Training on Farmers Adopting Water-Saving Irrigation Technology: An Empirical Evidence from China. Agriculture 2023, 13, 956. [Google Scholar] [CrossRef]
  44. Tan, H.; Qi, X. Synergistic Interconstruction of the Green Development Concept in Chinese Rural Ecological Agriculture. Sustainability 2023, 15, 3961. [Google Scholar] [CrossRef]
  45. Luo, M.; Liu, F.; Chen, J. Data-Driven Evaluation and Optimization of Agricultural Sustainable Development Capability: A Case Study of Northern Anhui. Processes 2021, 9, 2036. [Google Scholar] [CrossRef]
  46. Qian, F.; Lal, R.; Wang, Q. Land evaluation and site assessment for the basic farmland protection in Lingyuan County, Northeast China. J. Clean. Prod. 2021, 314, 128097. [Google Scholar] [CrossRef]
  47. Zou, F.; Li, T. The Impact of Agricultural Ecological Capital Investment on the Development of Green Circular Economy. Agriculture 2022, 12, 461. [Google Scholar] [CrossRef]
  48. Lei, S.; Yang, X.; Qin, J. Does agricultural factor misallocation hinder agricultural green production efficiency? Evidence from China. Sci. Total Environ. 2023, 891, 164466. [Google Scholar] [CrossRef]
  49. Liu, D.; Zhu, X.; Wang, Y. China’s agricultural green total factor productivity based on carbon emission: An analysis of evolution trend and influencing factors. J. Clean. Prod. 2021, 278, 123692. [Google Scholar] [CrossRef]
  50. Jiang, Q.; Li, J.; Si, H.; Su, Y. The Impact of the Digital Economy on Agricultural Green Development: Evidence from China. Agriculture 2022, 12, 1107. [Google Scholar] [CrossRef]
  51. Mo, Y.; Sun, D.; Zhang, Y. Green Finance Assists Agricultural Sustainable Development: Evidence from China. Sustainability 2023, 15, 2056. [Google Scholar] [CrossRef]
  52. Ahmed, N.; Hamid, Z.; Mahboob, F.; Rehman, K.U.; Ali, M.S.E.; Senkus, P.; Wysokinska-Senkus, A.; Sieminski, P.; Skrzypek, A. Causal Linkage among Agricultural Insurance, Air Pollution, and Agricultural Green Total Factor Productivity in United States: Pairwise Granger Causality Approach. Agriculture 2022, 12, 1320. [Google Scholar] [CrossRef]
  53. Deng, H.; Zheng, W.; Shen, Z.; Streimikiene, D. Does fiscal expenditure promote green agricultural productivity gains: An investigation on corn production. Appl. Energy 2023, 334, 120666. [Google Scholar] [CrossRef]
  54. Li, G.; Jia, X.; Khan, A.A.; Khan, S.U.; Ali, M.A.S.; Luo, J. Does green finance promote agricultural green total factor productivity? Considering green credit, green investment, green securities, and carbon finance in China. Environ. Sci. Pollut. Res. 2022, 30, 36663–36679. [Google Scholar] [CrossRef] [PubMed]
  55. Li, H.; Tang, M.; Cao, A.; Guo, L. Assessing the relationship between air pollution, agricultural insurance, and agricultural green total factor productivity: Evidence from China. Environ. Sci. Pollut. Res. 2022, 29, 78381–78395. [Google Scholar] [CrossRef]
  56. Xing, X.; Zhang, Q.; Ye, A.; Zeng, G. Mechanism and Empirical Test of the Impact of Consumption Upgrading on Agricultural Green Total Factor Productivity in China. Agriculture 2023, 13, 151. [Google Scholar] [CrossRef]
  57. He, H.; Ding, R. Spatiotemporal heterogeneity effect of technological progress and agricultural centrality on agricultural carbon emissions in China. Front. Environ. Sci. 2023, 10, 1078357. [Google Scholar] [CrossRef]
  58. Huang, X.; Xu, X.; Wang, Q.; Zhang, L.; Gao, X.; Chen, L. Assessment of Agricultural Carbon Emissions and Their Spatiotemporal Changes in China, 1997–2016. Int. J. Environ. Res. Public Health 2019, 16, 3105. [Google Scholar] [CrossRef] [Green Version]
  59. Li, J.; Huang, X.; Yang, T.; Su, M.; Guo, L. Reducing the carbon emission from agricultural production in China: Do land transfer and urbanization matter? Environ. Sci. Pollut. Res. 2023, 30, 68339–68355. [Google Scholar] [CrossRef] [PubMed]
  60. Li, S.; Wang, Z. The Effects of Agricultural Technology Progress on Agricultural Carbon Emission and Carbon Sink in China. Agriculture 2023, 13, 793. [Google Scholar] [CrossRef]
  61. Qin, L.; Liu, S.; Hou, Y.; Zhang, Y.; Wu, D.; Yan, D. The spatial spillover effect and mediating effect of green credit on agricultural carbon emissions: Evidence from China. Front. Earth Sci. 2023, 10, 1037776. [Google Scholar] [CrossRef]
  62. Shi, H.; Chang, M. How does agricultural industrial structure upgrading affect agricultural carbon emissions? Threshold effects analysis for China. Environ. Sci. Pollut. Res. 2023, 30, 52943–52957. [Google Scholar] [CrossRef]
  63. Wang, R.; Zhang, Y.; Zou, C. How does agricultural specialization affect carbon emissions in China? J. Clean. Prod. 2022, 370, 133463. [Google Scholar] [CrossRef]
  64. Yang, N.; Sun, X.; Qi, Q. Impact of factor quality improvement on agricultural carbon emissions: Evidence from China’s high-standard farmland. Front. Environ. Sci. 2022, 10, 989684. [Google Scholar] [CrossRef]
  65. Chen, C.; Zhang, H. Evaluation of Green Development Level of Mianyang Agriculture, Based on the Entropy Weight Method. Sustainability 2023, 15, 7589. [Google Scholar] [CrossRef]
  66. Liu, Y.; Sun, D.; Wang, H.; Wang, X.; Yu, G.; Zhao, X. An evaluation of China’s agricultural green production: 1978–2017. J. Clean. Prod. 2020, 243, 118483. [Google Scholar] [CrossRef]
  67. Liu, Y.; Feng, C. What drives the fluctuations of “green” productivity in China’s agricultural sector? A weighted Russell directional distance approach. Resour. Conserv. Recycl. 2019, 147, 201–213. [Google Scholar] [CrossRef]
  68. Bare, J.C. Development of impact assessment methodologies for environmental sustainability. Clean Technol. Environ. Policy 2014, 16, 681–690. [Google Scholar] [CrossRef]
  69. Janker, J. Moral conflicts, premises and the social dimension of agricultural sustainability. Agric. Hum. Values 2020, 37, 97–111. [Google Scholar] [CrossRef]
  70. Laurett, R.; Paco, A.; Mainardes, E.W. Sustainable Development in Agriculture and its Antecedents, Barriers and Consequences-An Exploratory Study. Sustain. Prod. Consum. 2021, 27, 298–311. [Google Scholar] [CrossRef]
  71. Chu, S.; Majumdar, A. Opportunities and challenges for a sustainable energy future. Nature 2012, 488, 294–303. [Google Scholar] [CrossRef]
  72. Mader, P.; Fliessbach, A.; Dubois, D.; Gunst, L.; Fried, P.; Niggli, U. Soil fertility and biodiversity in organic farming. Science 2002, 296, 1694–1697. [Google Scholar] [CrossRef] [Green Version]
  73. Wang, Z.; Huang, L.; Yin, L.; Wang, Z.; Zheng, D. Evaluation of Sustainable and Analysis of Influencing Factors for Agriculture Sector: Evidence From Jiangsu Province, China. Front. Environ. Sci. 2022, 10, 836002. [Google Scholar] [CrossRef]
  74. Shen, S.; Li, J.; Xu, R. Agricultural ecological environment protection based on the concept of sustainable development. Acta Agric. Scand. Sect. B Soil Plant Sci. 2021, 71, 920–930. [Google Scholar] [CrossRef]
  75. Yang, B.; Xu, T.; Shi, L. Analysis on sustainable urban development levels and trends in China’s cities. J. Clean. Prod. 2017, 141, 868–880. [Google Scholar] [CrossRef]
  76. Swaminathan, M.S.; Bhavani, R.V. Food production & availability—Essential prerequisites for sustainable food security. Indian J. Med. Res. 2013, 138, 383–391. [Google Scholar] [PubMed] [Green Version]
  77. Mostafa, M.A.; El-Gohary, N.M. Stakeholder-Sensitive Social Welfare-Oriented Benefit Analysis for Sustainable Infrastructure Project Development. J. Constr. Eng. Manag. 2014, 140, 04014038. [Google Scholar] [CrossRef]
  78. Wu, F.; Mo, C.; Dai, X.; Li, H. Spatial Analysis of Cultivated Land Productivity, Site Condition and Cultivated Land Health at County Scale. Int. J. Environ. Res. Public Health 2022, 19, 12266. [Google Scholar] [CrossRef]
  79. Li, P.; Qian, H. Water resources research to support a sustainable China. Int. J. Water Resour. Dev. 2018, 34, 327–336. [Google Scholar] [CrossRef] [Green Version]
  80. Cao, X.; Wu, M.; Zheng, Y.; Guo, X.; Chen, D.; Wang, W. Can China achieve food security through the development of irrigation? Reg. Environ. Chang. 2018, 18, 465–475. [Google Scholar] [CrossRef]
  81. Kang, S.; Hao, X.; Du, T.; Tong, L.; Su, X.; Lu, H.; Li, X.; Huo, Z.; Li, S.; Ding, R. Improving agricultural water productivity to ensure food security in China under changing environment: From research to practice. Agric. Water Manag. 2017, 179, 5–17. [Google Scholar] [CrossRef]
  82. Brockerhoff, E.G.; Barbaro, L.; Castagneyrol, B.; Forrester, D.I.; Gardiner, B.; Ramon Gonzalez-Olabarria, J.; Lyver, P.O.B.; Meurisse, N.; Oxbrough, A.; Taki, H.; et al. Forest biodiversity, ecosystem functioning and the provision of ecosystem services. Biodivers. Conserv. 2017, 26, 3005–3035. [Google Scholar] [CrossRef] [Green Version]
  83. Li, X.; Yu, X.; Jiang, L.; Li, W.; Liu, Y.; Hou, X. How important are the wetlands in the middle-lower Yangtze River region: An ecosystem service valuation approach. Ecosyst. Serv. 2014, 10, 54–60. [Google Scholar] [CrossRef]
  84. Wang, Z.; Xu, D.; Peng, D.; Zhang, Y. Quantifying the influences of natural and human factors on the water footprint of afforestation in desert regions of northern China. Sci. Total Environ. 2021, 780, 146577. [Google Scholar] [CrossRef] [PubMed]
  85. Cao, S.; Lu, C.; Yue, H. Optimal Tree Canopy Cover during Ecological Restoration: A Case Study of Possible Ecological Thresholds in Changting, China. Bioscience 2017, 67, 221–232. [Google Scholar] [CrossRef] [Green Version]
  86. Li, F.; Liang, W.; Zang, D.; Chandio, A.A.; Duan, Y. Does Cleaner Household Energy Promote Agricultural Green Production? Evidence from China. Int. J. Environ. Res. Public Health 2022, 19, 10197. [Google Scholar] [CrossRef] [PubMed]
  87. Luo, L.; Wang, Y.; Qin, L. Incentives for promoting agricultural clean production technologies in China. J. Clean. Prod. 2014, 74, 54–61. [Google Scholar] [CrossRef]
  88. Du, S.; Liu, J.; Fu, Z. The Impact of Village Rules and Formal Environmental Regulations on Farmers’ Cleaner Production Behavior: New Evidence from China. Int. J. Environ. Res. Public Health 2021, 18, 7311. [Google Scholar] [CrossRef]
  89. Zhu, W.-K.; Wang, C.-Y.; Wang, L.-S.; Wu, X.-H.; Yue, Q. Analysis of energy-saving and environmental benefits from power structure adjustment in China: A comparative study from 2020 to 2060. Sustain. Prod. Consum. 2022, 31, 750–761. [Google Scholar] [CrossRef]
  90. Brondani, M.; Hoffmann, R.; Mayer, F.D.; Kleinert, J.S. Environmental and energy analysis of biodiesel production in Rio Grande do Sul, Brazil. Clean Technol. Environ. Policy 2015, 17, 129–143. [Google Scholar] [CrossRef]
  91. Zhang, X.; Wang, Y.; Bao, J.; Wei, T.; Xu, S. A Research on the Evaluation of China’s Food Security under the Perspective of Sustainable Development-Based on an Entropy Weight TOPSIS Model. Agriculture 2022, 12, 1926. [Google Scholar] [CrossRef]
  92. Xu, H.; Ma, B.; Gao, Q. Assessing the Environmental Efficiency of Grain Production and Their Spatial Effects: Case Study of Major Grain Production Areas in China. Front. Environ. Sci. 2021, 9, 774343. [Google Scholar] [CrossRef]
  93. Sun, M.; Chou, J.; Xu, Y.; Yang, F.; Li, J. Study on the thresholds of grain production risk from climate change in China’s main grain-producing areas. Phys. Chem. Earth 2020, 116, 102837. [Google Scholar] [CrossRef]
  94. Mykhaylenko, M.; Belaya, V. Market research Demand will Benefit exporters China established itself as a major Producer and Consumer of Meat at the same time. Fleischwirtschaft 2011, 91, 22–24. [Google Scholar]
  95. Windhorst, H.-W. Meat production regional concentration is increasing structures and dynamics of the poultry meat production and poultry meat trade in the EU. Fleischwirtschaft 2011, 91, 42–46. [Google Scholar]
  96. Delmas, M.A.; Gergaud, O. Sustainable practices and product quality: Is there value in eco-label certification? The case of wine. Ecol. Econ. 2021, 183, 106953. [Google Scholar] [CrossRef]
  97. Liu, R.; Gao, Z.; Yan, G.; Ma, H. Why Should We Protect the Interests of "Green Food" Certified Product Growers? Evidence from Kiwifruit Production in China. Sustainability 2018, 10, 4797. [Google Scholar] [CrossRef] [Green Version]
  98. Yang, Y.; Wei, L.; Pei, J. Application of Bayesian modelling to assess food quality & safety status and identify risky food in China market. Food Control 2019, 100, 111–116. [Google Scholar] [CrossRef]
  99. Balezentis, T.; Li, T.; Chen, X. Has agricultural labor restructuring improved agricultural labor productivity in China? A decomposition approach. Socio-Econ. Plan. Sci. 2021, 76, 100967. [Google Scholar] [CrossRef]
  100. Lin, H.-C.; Huelsbergen, K.-J. A new method for analyzing agricultural land-use efficiency, and its application in organic and conventional farming systems in southern Germany. Eur. J. Agron. 2017, 83, 15–27. [Google Scholar] [CrossRef]
  101. Jin, S.; Mei, Z.; Duan, K. Coupling Coordination of China’s Agricultural Environment and Economy under the New Economic Background. Agriculture 2022, 12, 1147. [Google Scholar] [CrossRef]
  102. Yu, N.; Wang, Y. Can Digital Inclusive Finance Narrow the Chinese Urban-Rural Income Gap? The Perspective of the Regional Urban-Rural Income Structure. Sustainability 2021, 13, 6427. [Google Scholar] [CrossRef]
  103. Xie, Q.; Yi, F.; Tian, X. Disparate changes of living standard in China: Perspective from Engel’s coefficient. China Agric. Econ. Rev. 2022, 34, 154–178. [Google Scholar] [CrossRef]
  104. Zhang, Z.; Chen, Y.-H.; Tian, Y. Effect of agricultural fiscal expenditures on agricultural carbon intensity in China. Environ. Sci. Pollut. Res. 2023, 21, 1–15. [Google Scholar] [CrossRef] [PubMed]
  105. Cao, J.; Xu, F. Entropy-Based Fuzzy TOPSIS Method for Investment Decision Optimization of Large-Scale Projects. Comput. Intell. Neurosci. 2022, 2022, 4381293. [Google Scholar] [CrossRef]
  106. Chen, J.; Wu, Y.; Song, M.; Dong, Y. The residential coal consumption: Disparity in urban-rural China. Resour. Conserv. Recycl. 2018, 130, 60–69. [Google Scholar] [CrossRef] [Green Version]
  107. Dai, J.; Liu, Y.; Chen, J.; Liu, X. Fast feature selection for interval-valued data through kernel density estimation entropy. Int. J. Mach. Learn. Cybern. 2020, 11, 2607–2624. [Google Scholar] [CrossRef]
  108. Chen, Y. An analytical process of spatial autocorrelation functions based on Moran’s index. PLoS ONE 2021, 16, e0249589. [Google Scholar] [CrossRef]
  109. Kuroda, M.; Hashiguchi, H.; Nakagawa, S. Computing p-values in conditional independence models for a contingency table. Comput. Stat. 2010, 25, 57–70. [Google Scholar] [CrossRef]
Figure 1. The evaluation framework for agricultural green development.
Agriculture 13 01441 g001
Figure 2. Evaluation indicator system for agricultural green development.
Agriculture 13 01441 g002
Figure 3. Geographical spatial distribution of China’s eight major economic zones.
Agriculture 13 01441 g003
Figure 4. Trend chart of the agricultural green development index in China.
Agriculture 13 01441 g004
Figure 5. Trend of sources of overall disparities in agricultural green development.
Agriculture 13 01441 g005
Figure 6. Dynamic evolution of agricultural green development distribution in China.
Agriculture 13 01441 g006
Figure 7. The dynamic evolution of distribution in China’s eight major economic regions. (a) Northern Coastal Comprehensive Economic Region (NCCER); (b) Northeast Comprehensive Economic Region (NCER); (c) Eastern Coastal Comprehensive Economic Region (ECCER); (d) Southern Coastal Economic Region (SCER); (e) Yellow River Basin Comprehensive Economic Region (YRCER); (f) Yangtze River Basin Comprehensive Economic Region (YRBCE); (g) Great Southwest Comprehensive Economic Region (GSCER); (h) Great Northwest Comprehensive Economic Region (GNCER).
Agriculture 13 01441 g007aAgriculture 13 01441 g007b
Figure 8. Scatter plot of local Moran’s I index for agricultural green development levels at selected time points.
Agriculture 13 01441 g008aAgriculture 13 01441 g008b
Figure 9. The inter–provincial spatial distribution of agricultural green development levels in China.
Agriculture 13 01441 g009
Table 1. Markov transition probability matrix.
t/t + 11234
1P11P12P13P14
2P21P22P23P24
3P31P32P33P34
4P41P42P43P44
Table 2. Division of China’s eight major economic regions.
Economic RegionCoverage (Province Numbers)
Northeast Comprehensive
Economic Region (NCER)
Liaoning (6), Jilin (7)
Heilongjiang (8)
Northern Coastal
Comprehensive Economic Region (NCCER)
Beijing (1), Tianjin (2)
Hebei (3), Shandong (15)
Eastern Coastal Comprehensive
Economic Region (ECCER)
Shanghai (9), Jiangsu (10)
Zhejiang (11)
Southern Coastal Economic
Region (SCER)
Fujian (13), Guangdong (19)
Hainan (21)
Yellow River Basin
Comprehensive Economic Region (YRCER)
Shaanxi (27), Shanxi (4)
Henan (16), Inner Mongolia (5)
Yangtze River Basin
Comprehensive Economic Region (YRBCE)
Hubei (17), Hunan (18), Jiangxi (14), Anhui (12)
Great Southwest Comprehensive
Economic Region (GSCER)
Yunnan (25), Guizhou (24), Sichuan (23), Chongqing (22) Guangxi (20)
Great Northwest Comprehensive
Economic Region (GNCER)
Gansu (28), Qinghai (29), Ningxia (30), Tibet (26), Xinjiang (31)
Table 3. Evaluation system for agricultural green development.
Criterion
Layer
ValueSub-Criteria
Layer
ValueScheme LayerValue
Resource
conservation
0.1540 Conservation of cultivated land resources0.0761 Cultivated land retention rate (%)0.0370
Per capita cultivated area (hm2)0.0391
Water resources conservation0.0779 Proportion of water-saving
irrigation area (%)
0.0382
Agricultural water accounted for the proportion of total water use (%)0.0397
Ecological
stability
0.1568 Ecological conservation0.0811 The proportion of forest
in the land area (%)
0.0417
Proportion of wetland in land area (%)0.0394
Ecological restoration0.0758 Ecological afforestation country
area proportion (%)
0.0371
Annual growth rate of soil erosion control area (%)0.0386
Clean
production
0.1995 Energy factor consumption0.0782 Diesel oil application rate (kg/CNY 10,000)0.0377
Energy efficiency (kW·h/CNY 10,000)0.0405
Chemical factor consumption0.1213 Fertilizer application rate (kg/CNY 10,000)0.0395
Agricultural film application rate (kg/CNY 10,000)0.0410
Rate of pesticide application (kg/CNY 10,000)0.0408
Secure
supply
0.2668 Quantitative security0.1545 Per capita grain production (kg)0.0377
Meat production per capita (kg)0.0387
Total grain production (10,000 t)0.0388
Total meat production (10,000 t)0.0393
Quality and safety0.1123 Number of certified green food products0.0381
Number of green food enterprises0.0371
Quality and safety of agricultural products routine inspection pass rate (%)0.0371
Benefit
enhancement
0.2229 Economic benefit0.1115 Labor productivity (CNY 10,000)0.0372
Land yield rate (CNY 10,000/hm2)0.0370
Disposable income of rural residents (CNY)0.0373
Social benefit0.1114 Urban–rural income gap0.0371
Engel coefficient of rural household (%)0.0372
Agricultural carbon emission intensity (t/CNY 10,000)0.0370
Table 4. Changes in the agricultural green development index in China.
YearResource ConservationEcological StabilityClean
Production
Security
Supply
Benefit EnhancementComposite Index
20030.0423 0.0243 0.0356 0.0772 0.1442 0.3236
20040.0426 0.0193 0.0392 0.0817 0.1466 0.3294
20050.0430 0.0166 0.0444 0.0936 0.1486 0.3462
20060.0450 0.0159 0.0466 0.0913 0.1491 0.3479
20070.0451 0.0164 0.0431 0.0958 0.1518 0.3523
20080.0456 0.0185 0.0436 0.1021 0.1552 0.3649
20090.0496 0.0194 0.0459 0.1125 0.1580 0.3854
20100.0481 0.0196 0.0477 0.1216 0.1616 0.3985
20110.0483 0.0205 0.0484 0.1265 0.1657 0.4094
20120.0488 0.0204 0.0510 0.1277 0.1681 0.4161
20130.0499 0.0239 0.0527 0.1369 0.1712 0.4346
20140.0502 0.0222 0.0555 0.1382 0.1764 0.4425
20150.0506 0.0251 0.0540 0.1383 0.1777 0.4457
20160.0521 0.0240 0.0544 0.1453 0.1776 0.4535
20170.0524 0.0253 0.0575 0.1486 0.1800 0.4637
20180.0525 0.0249 0.0621 0.1517 0.1836 0.4748
20190.0519 0.0254 0.0612 0.1567 0.1865 0.4818
20200.0556 0.0253 0.0645 0.1679 0.1871 0.5004
Table 5. Agricultural green development in eight major economic region.
YearNCCERNCERECCERSCERYRBCERCYRBCEGSCERGNCER
20030.3850 0.3755 0.3863 0.3782 0.3545 0.3602 0.3630 0.3256
20040.3843 0.3860 0.3917 0.3791 0.3641 0.3690 0.3646 0.3264
20050.3941 0.4055 0.4024 0.3894 0.3705 0.3814 0.3789 0.3381
20060.3932 0.4056 0.4037 0.3927 0.3764 0.3824 0.3772 0.3380
20070.3930 0.4078 0.4080 0.3863 0.3778 0.3921 0.3862 0.3432
20080.4041 0.4207 0.4143 0.3955 0.3918 0.4027 0.3931 0.3484
20090.4191 0.4413 0.4314 0.4037 0.4072 0.4162 0.4113 0.3639
20100.4343 0.4458 0.4424 0.4154 0.4144 0.4263 0.4207 0.3751
20110.4459 0.4577 0.4486 0.4246 0.4216 0.4357 0.4264 0.3787
20120.4514 0.4630 0.4540 0.4282 0.4256 0.4417 0.4296 0.3843
20130.4643 0.4769 0.4707 0.4414 0.4361 0.4556 0.4443 0.3999
20140.4698 0.4836 0.4810 0.4493 0.4407 0.4651 0.4498 0.3963
20150.4692 0.4903 0.4764 0.4541 0.4413 0.4703 0.4555 0.3976
20160.4772 0.4895 0.4855 0.4607 0.4441 0.4753 0.4615 0.4047
20170.4852 0.4976 0.4916 0.4643 0.4517 0.4871 0.4674 0.4136
20180.4949 0.5021 0.5018 0.4699 0.4608 0.4963 0.4761 0.4223
20190.4929 0.5067 0.5153 0.4750 0.4675 0.4987 0.4809 0.4278
20200.5048 0.5232 0.5214 0.4891 0.4842 0.5167 0.4909 0.4386
Table 6. Measurement results of the province for selected years.
Region200320052007200920112013201520172020
Beijing0.4060 0.4087 0.4112 0.4330 0.4448 0.4667 0.4673 0.4851 0.5013
Tianjin0.3814 0.3853 0.3744 0.3908 0.4140 0.4330 0.4455 0.4548 0.4760
Hebei0.3772 0.3800 0.3740 0.4061 0.4461 0.4520 0.4572 0.4714 0.4949
Shandong0.3754 0.4026 0.4122 0.4465 0.4787 0.5056 0.5066 0.5296 0.5467
Liaoning0.3804 0.4157 0.4154 0.4369 0.4552 0.4730 0.4821 0.4777 0.4951
Jilin0.3809 0.4041 0.4068 0.4338 0.4480 0.4637 0.4734 0.4744 0.4960
Heilongjiang0.3651 0.3968 0.4013 0.4532 0.4699 0.4941 0.5154 0.5407 0.5786
Shanghai0.4082 0.3994 0.4022 0.4220 0.4388 0.4580 0.4632 0.4745 0.5043
Jiangsu0.3786 0.4138 0.4182 0.4412 0.4562 0.4848 0.4921 0.5125 0.5345
Zhejiang0.3720 0.3940 0.4036 0.4309 0.4508 0.4692 0.4739 0.4879 0.5254
Fujian0.3763 0.3923 0.3973 0.4141 0.4399 0.4596 0.4719 0.4826 0.5095
Guangdong0.3779 0.3930 0.3922 0.4096 0.4294 0.4408 0.4576 0.4622 0.4925
Hainan0.3803 0.3830 0.3693 0.3875 0.4046 0.4239 0.4327 0.4481 0.4652
Shanxi0.3358 0.3290 0.3353 0.3748 0.3889 0.4046 0.4071 0.4153 0.4480
Inner Mongolia0.3579 0.3905 0.3990 0.4241 0.4386 0.4558 0.4556 0.4726 0.5188
Henan0.3719 0.4077 0.4071 0.4404 0.4484 0.4630 0.4743 0.4810 0.5147
Shaanxi0.3523 0.3547 0.3697 0.3893 0.4104 0.4208 0.4282 0.4381 0.4553
Anhui0.3463 0.3655 0.3778 0.4041 0.4216 0.4454 0.4609 0.4893 0.5297
Jiangxi0.3625 0.3795 0.3913 0.4144 0.4248 0.4405 0.4537 0.4680 0.4945
Hubei0.3512 0.3821 0.3957 0.4163 0.4413 0.4667 0.4807 0.4990 0.5058
Hunan0.3810 0.3986 0.4035 0.4301 0.4551 0.4700 0.4858 0.4921 0.5368
Guangxi0.3484 0.3710 0.3827 0.4083 0.4265 0.4402 0.4460 0.4572 0.4780
Chongqing0.3822 0.3857 0.3821 0.4124 0.4395 0.4521 0.4575 0.4703 0.5150
Sichuan0.3926 0.4169 0.4301 0.4465 0.4541 0.4734 0.4819 0.4910 0.5038
Guizhou0.3552 0.3632 0.3650 0.3894 0.3988 0.4254 0.4425 0.4635 0.4695
Yunan0.3368 0.3579 0.3713 0.3999 0.4133 0.4306 0.4497 0.4550 0.4885
Tibet0.3385 0.3432 0.3576 0.3772 0.3841 0.4145 0.3926 0.4166 0.4370
Gansu0.3043 0.3250 0.3143 0.3465 0.3518 0.3711 0.3782 0.3913 0.4297
Qinghai0.3158 0.3402 0.3533 0.3700 0.3866 0.4047 0.4068 0.4173 0.4382
Ningxia0.3454 0.3348 0.3393 0.3579 0.3798 0.3962 0.4029 0.4182 0.4380
Xinjiang0.3240 0.3475 0.3514 0.3678 0.3915 0.4130 0.4074 0.4245 0.4502
Table 7. Decomposition of spatial sources of overall disparities.
YearGini-
Coefficient
Within-
Group Gini
Coefficient
Between-
Group Gini
Coefficient
Super-
Variation
Density
Within-
Group Differences (%)
Between-
Group Differences (%)
Super-
Variation Density (%)
20030.0587 0.0034 0.0488 0.0065 5.7460 83.1418 11.1124
20040.0608 0.0037 0.0481 0.0089 6.0533 79.2435 14.7034
20050.0605 0.0038 0.0472 0.0095 6.2004 78.0549 15.7459
20060.0605 0.0037 0.0468 0.0100 6.0796 77.4162 16.5038
20070.0603 0.0042 0.0439 0.0122 7.0415 72.7918 20.1654
20080.0579 0.0035 0.0439 0.0104 6.0973 75.8762 18.0281
20090.0585 0.0037 0.0444 0.0104 6.3949 75.8733 17.7317
20100.0550 0.0037 0.0422 0.0090 6.7792 76.8700 16.3511
20110.0577 0.0040 0.0444 0.0093 6.9183 76.9235 16.1586
20120.0575 0.0040 0.0443 0.0092 6.9451 76.9901 16.0650
20130.0551 0.0039 0.0425 0.0086 7.1262 77.1857 15.6887
20140.0588 0.0038 0.0469 0.0081 6.4466 79.8299 13.7231
20150.0584 0.0036 0.0468 0.0080 6.2014 80.0915 13.7068
20160.0559 0.0036 0.0449 0.0074 6.4919 80.3138 13.1951
20170.0565 0.0036 0.0442 0.0086 6.4147 78.3254 15.2601
20180.0557 0.0036 0.0425 0.0096 6.4372 76.3864 17.1769
20190.0557 0.0037 0.0425 0.0095 6.6663 76.2600 17.0726
20200.0556 0.0037 0.0407 0.0112 6.6223 73.2294 20.1485
Mean0.0577 0.0037 0.0447 0.0092 6.4812 77.4891 16.0298
Table 8. Disparities in Gini coefficients across China’s eight major economic regions.
YearChinaNCCERNCERECCERSCERYRBCERCYRBCEGSCERGNCER
20030.0235 0.0177 0.0286 0.0131 0.0041 0.0420 0.0225 0.0317 0.0286
20040.0257 0.0174 0.0110 0.0249 0.0135 0.0231 0.0478 0.0438 0.0241
20050.0269 0.0143 0.0193 0.0217 0.0135 0.0204 0.0425 0.0644 0.0188
20060.0252 0.0068 0.0176 0.0275 0.0030 0.0211 0.0620 0.0422 0.0214
20070.0306 0.0118 0.0204 0.0163 0.0374 0.0453 0.0276 0.0572 0.0283
20080.0256 0.0082 0.0185 0.0347 0.0069 0.0246 0.0394 0.0549 0.0175
20090.0277 0.0128 0.0199 0.0412 0.0154 0.0363 0.0530 0.0261 0.0167
20100.0268 0.0074 0.0171 0.0397 0.0184 0.0364 0.0459 0.0256 0.0240
20110.0292 0.0138 0.0163 0.0407 0.0230 0.0379 0.0306 0.0453 0.0259
20120.0291 0.0167 0.0206 0.0435 0.0220 0.0355 0.0218 0.0456 0.0275
20130.0294 0.0185 0.0212 0.0427 0.0212 0.0315 0.0288 0.0438 0.0277
20140.0292 0.0236 0.0273 0.0426 0.0179 0.0272 0.0261 0.0432 0.0260
20150.0282 0.0242 0.0215 0.0210 0.0353 0.0293 0.0261 0.0473 0.0210
20160.0280 0.0279 0.0193 0.0156 0.0380 0.0230 0.0252 0.0443 0.0306
20170.0293 0.0388 0.0251 0.0168 0.0417 0.0209 0.0258 0.0456 0.0197
20180.0292 0.0406 0.0228 0.0156 0.0402 0.0247 0.0300 0.0475 0.0126
20190.0298 0.0247 0.0420 0.0173 0.0364 0.0253 0.0247 0.0488 0.0194
20200.0300 0.0479 0.0168 0.0227 0.0364 0.0262 0.0310 0.0474 0.0116
Mean0.0280 0.0207 0.0214 0.0276 0.0236 0.0295 0.0339 0.0447 0.0223
Table 9. (a) Disparities in Gini coefficients among China’s eight major economic regions. (b) Disparities in Gini coefficients among China’s eight major economic regions. (c) Disparities in Gini coefficients among China’s eight major economic regions.
(a)
YearNCCER/NCERNCCER/ECCERNCCER/SCERNCCER/
YRCER
NCCER/YRBCENCCE/GSCERNCCER/GNCERNCER/
ECCER
NCER/
SCER
20030.0265 0.0212 0.0237 0.0541 0.0475 0.0637 0.1473 0.0253 0.0283
20040.0178 0.0256 0.0335 0.0450 0.0570 0.0639 0.1509 0.0234 0.0300
20050.0248 0.0303 0.0460 0.0479 0.0651 0.0726 0.1531 0.0281 0.0316
20060.0193 0.0305 0.0376 0.0456 0.0628 0.0681 0.1510 0.0307 0.0281
20070.0193 0.0307 0.0379 0.0615 0.0516 0.0616 0.1427 0.0274 0.0393
20080.0201 0.0342 0.0318 0.0527 0.0594 0.0580 0.1491 0.0311 0.0194
20090.0248 0.0441 0.0412 0.0595 0.0622 0.0735 0.1493 0.0366 0.0254
20100.0157 0.0362 0.0327 0.0487 0.0555 0.0591 0.1347 0.0342 0.0269
20110.0209 0.0360 0.0360 0.0552 0.0591 0.0611 0.1444 0.0336 0.0263
20120.0242 0.0384 0.0348 0.0574 0.0602 0.0623 0.1415 0.0376 0.0267
20130.0241 0.0397 0.0330 0.0539 0.0582 0.0640 0.1317 0.0372 0.0267
20140.0279 0.0442 0.0300 0.0536 0.0546 0.0665 0.1465 0.0420 0.0282
20150.0307 0.0327 0.0446 0.0555 0.0574 0.0744 0.1522 0.0235 0.0335
20160.0264 0.0277 0.0388 0.0460 0.0479 0.0693 0.1386 0.0206 0.0350
20170.0384 0.0374 0.0455 0.0495 0.0541 0.0694 0.1335 0.0237 0.0378
20180.0375 0.0382 0.0435 0.0455 0.0530 0.0674 0.1239 0.0245 0.0363
20190.0422 0.0278 0.0447 0.0469 0.0565 0.0665 0.1305 0.0398 0.0448
20200.0465 0.0451 0.0499 0.0537 0.0569 0.0717 0.1243 0.0214 0.0370
Mean0.0271 0.0344 0.0381 0.0518 0.0566 0.0663 0.1414 0.0300 0.0312
(b)
YearNCER/
YRCER
NCER/
YRBCE
NCER/
GSCER
NCER/
GNCER
ECCER/
SCER
ECCER/YRCERECCER/YRBCEECCER/
GSCER
ECCER/
GNCER
20030.0562 0.0500 0.0644 0.1467 0.0177 0.0474 0.0402 0.0545 0.1373
20040.0418 0.0539 0.0628 0.1491 0.0285 0.0373 0.0505 0.0572 0.1393
20050.0361 0.0563 0.0649 0.1389 0.0265 0.0285 0.0480 0.0594 0.1258
20060.0395 0.0601 0.0635 0.1417 0.0248 0.0287 0.0566 0.0519 0.1230
20070.0580 0.0454 0.0594 0.1366 0.0341 0.0443 0.0285 0.0484 0.1128
20080.0382 0.0506 0.0523 0.1345 0.0280 0.0381 0.0459 0.0516 0.1191
20090.0458 0.0523 0.0530 0.1291 0.0338 0.0439 0.0532 0.0471 0.1117
20100.0432 0.0499 0.0490 0.1248 0.0352 0.0455 0.0520 0.0488 0.1138
20110.0424 0.0433 0.0490 0.1272 0.0377 0.0492 0.0501 0.0545 0.1236
20120.0450 0.0442 0.0519 0.1249 0.0389 0.0514 0.0507 0.0569 0.1214
20130.0445 0.0477 0.0552 0.1192 0.0368 0.0464 0.0484 0.0570 0.1114
20140.0481 0.0486 0.0616 0.1392 0.0363 0.0432 0.0434 0.0570 0.1246
20150.0373 0.0398 0.0558 0.1301 0.0327 0.0353 0.0360 0.0533 0.1252
20160.0383 0.0397 0.0610 0.1303 0.0321 0.0301 0.0311 0.0512 0.1192
20170.0377 0.0435 0.0597 0.1225 0.0360 0.0333 0.0395 0.0561 0.1189
20180.0381 0.0472 0.0593 0.1209 0.0363 0.0335 0.0433 0.0562 0.1150
20190.0468 0.0530 0.0683 0.1214 0.0358 0.0317 0.0391 0.0515 0.1091
20200.0423 0.0462 0.0553 0.1201 0.0351 0.0380 0.0415 0.0531 0.1130
Mean0.0433 0.0484 0.0581 0.1310 0.0326 0.0392 0.0443 0.0537 0.1202
(c)
YearSCER/
YRCER
SCER/
YRBCE
SCER/
GSCER
SCER/
GNCER
YRCER/YRBCEYRCER/GSCERYRCER/GNCERYRBCE/GSCERYRBCE/GNCRGSCER/GNCER
20030.0403 0.0301 0.0408 0.1241 0.0373 0.0412 0.1011 0.0317 0.1010 0.0845
20040.0248 0.0407 0.0461 0.1196 0.0414 0.0426 0.1104 0.0504 0.0992 0.0950
20050.0194 0.0396 0.0536 0.1078 0.0393 0.0553 0.1059 0.0604 0.0936 0.0864
20060.0213 0.0521 0.0467 0.1141 0.0540 0.0424 0.1061 0.0591 0.0925 0.0876
20070.0479 0.0426 0.0563 0.1124 0.0438 0.0597 0.0945 0.0496 0.0918 0.0876
20080.0223 0.0410 0.0460 0.1178 0.0392 0.0473 0.0971 0.0528 0.0940 0.0939
20090.0343 0.0469 0.0334 0.1088 0.0512 0.0359 0.0942 0.0497 0.0894 0.0766
20100.0332 0.0418 0.0314 0.1029 0.0447 0.0363 0.0884 0.0426 0.0809 0.0762
20110.0358 0.0353 0.0441 0.1106 0.0367 0.0444 0.0907 0.0420 0.0860 0.0846
20120.0365 0.0320 0.0450 0.1093 0.0317 0.0439 0.0854 0.0404 0.0819 0.0811
20130.0340 0.0352 0.0458 0.1015 0.0325 0.0435 0.0801 0.0399 0.0741 0.0703
20140.0334 0.0333 0.0471 0.1208 0.0298 0.0408 0.0947 0.0389 0.0926 0.0812
20150.0388 0.0380 0.0553 0.1207 0.0319 0.0430 0.0976 0.0443 0.0971 0.0793
20160.0381 0.0394 0.0573 0.1190 0.0277 0.0441 0.0971 0.0422 0.0936 0.0732
20170.0392 0.0437 0.0595 0.1149 0.0263 0.0435 0.0900 0.0418 0.0829 0.0684
20180.0395 0.0470 0.0595 0.1126 0.0308 0.0454 0.0868 0.0434 0.0752 0.0660
20190.0353 0.0391 0.0566 0.1004 0.0278 0.0461 0.0845 0.0456 0.0745 0.0689
20200.0359 0.0400 0.0540 0.0990 0.0310 0.0453 0.0805 0.0453 0.0765 0.0715
Mean0.0339 0.0399 0.0488 0.1120 0.0365 0.0445 0.0936 0.0456 0.0876 0.0796
Table 10. Moran’s I index for the level of agricultural green development in China.
YearI ValueZ Valuep Value
20030.368 3.386 0.000
20040.381 3.479 0.000
20050.330 3.030 0.001
20060.371 3.386 0.000
20070.293 2.754 0.003
20080.373 3.418 0.000
20090.346 3.171 0.001
20100.338 3.120 0.001
20110.356 3.281 0.001
20120.331 3.070 0.001
20130.346 3.200 0.001
20140.343 3.178 0.001
20150.347 3.197 0.001
20160.345 3.210 0.001
20170.324 3.020 0.001
20180.279 2.619 0.004
20190.273 2.570 0.005
20200.252 2.401 0.008
Table 11. Transition probability matrix for traditional Markov chain analysis.
PeriodStatus Low Level Medium-Low Level Medium-High LevelHigh Level
1 yearLow level 0.7929 0.2071 00
1 yearMedium-low 0.0072 0.7698 0.2230 0
1 yearMedium-high000.8195 0.1805
1 yearHigh level0001
2 yearLow level 0.6143 0.3857 00
2 yearMedium-low 0.0073 0.5547 0.4307 0.0073
2 yearMedium-high000.6480 0.3520
2 yearHigh level0001
3 yearLow level 0.4929 0.4857 0.0214 0
3 yearMedium-low 0.0075 0.3609 0.6165 0.0150
3 yearMedium-high000.4661 0.5339
3 yearHigh level0001
4 yearLow level 0.3857 0.5429 0.0714 0
4 yearMedium-low 00.1953 0.7578 0.0469
4 yearMedium-high000.30.7
4 year High level0001
Table 12. (a) Spatial Markov chain transition probability matrix. (b) Spatial Markov chain transition probability matrix.
(a)
Spatial
Lag Term
Statet = 1t = 2
Low
level
Low level0.8298 0.1702 000.68090.319100
Medium-low level0.0278 0.9444 0.0278 00.02780.77780.19440
Medium-high level00100010
High level00000000
Medium-low levelLow level0.750.25000.52780.472200
Medium-low level00.6731 0.3269 000.40380.57690.0192
Medium-high level000.950.05000.850.15
High level00010001
Medium-high levelLow level0.60.4000.30.700
Medium-low level00.8049 0.1951 000.60980.39020
Medium-high level000.8171 0.1829 000.63410.3659
High level00010001
HighlevelLow level00000000
Medium-low level00.50.5000.250.750
Medium-high level000.7333 0.2667 000.50.5
High-level00010001
(b)
t = 3t = 4
Low levelLow
level
0.59570.39360.010600.48940.45740.05320
Medium-low level0.02780.55560.38890.027800.30560.63890.0556
Medium-high level00100010
High level00000000
Medium-low levelLow level0.30560.63890.055600.19440.69440.11110
Medium-low level00.19230.78850.019200.03850.88460.0769
Medium-high level000.50.5000.150.85
High level00010001
Medium-high levelLow level0.20.8000.10.80.10
Medium-low level00.43900.5610000.30770.69230
Medium-high level000.48780.5122000.35370.6463
High level00010001
High levelLow level00000000
Medium–
low level
00100010
Medium-high level000.26670.73330001
High level00010001
Disclaimer/Publisher’s Note: The statements, opinions and data contained in all publications are solely those of the individual author(s) and contributor(s) and not of MDPI and/or the editor(s). MDPI and/or the editor(s) disclaim responsibility for any injury to people or property resulting from any ideas, methods, instructions or products referred to in the content.

