Article

Effects of the Broken Kernel on Heat and Moisture Transfer in Fixed-Bed Corn Drying Using Particle-Resolved CFD Model

1
College of Civil Engineering, Henan University of Technology, Zhengzhou 450001, China
2
Henan International Joint Laboratory of Modern Green Ecological Storage System, Zhengzhou 450001, China
3
Henan Key Laboratory of Grain Storage Facility and Safety, Zhengzhou 450001, China
*
Author to whom correspondence should be addressed.
Agriculture 2023, 13(8), 1470; https://doi.org/10.3390/agriculture13081470
Submission received: 3 July 2023 / Revised: 15 July 2023 / Accepted: 23 July 2023 / Published: 25 July 2023
(This article belongs to the Section Agricultural Product Quality and Safety)

Abstract

:
To investigate the pore structure distribution and the coupled heat and moisture transfer during the drying process of the grains, this study focuses on fixed-bed corn drying with varying levels of broken kernel rate. A model of internal flow and conjugate heat and mass transfer was established for the drying process. Random packing models of whole and half corn kernels with different proportions were generated using rigid body dynamics (RBD), and the porosity, airflow distribution, and coupling of temperature and moisture transfer in fixed beds with different levels of broken kernel rate were analyzed. A fixed-bed corn drying device was developed, and the effects of broken particle contents of 0%, 10%, 20%, and 30% on drying characteristics were studied. The research findings reveal that the radial porosity in the fixed bed exhibits an oscillating distribution, with the localized porosity decreasing as the broken kernel rate increases. Increasing the broken kernel rate intensifies the curvature of the airflow paths within the fixed bed, increasing the pressure drop in the bed. The broken kernels fill the gaps between the whole kernels, improving the uniformity of the velocity distribution within the fixed bed. Under various packing models, the average discrepancy between pressure drop obtained from Particle-resolved Computational Fluid Dynamics (PRCFD) simulations with experimental remains below 15%. The increase in broken kernel rate within the fixed bed enlarges the heat transfer area, resulting in an elevation of the transient heat transfer characteristic parameters during drying. Simultaneously, the broken kernel rate increases the surface area of mass transfer, thereby enhancing the moisture transfer rate within the fixed bed. Compared to the fixed bed without broken kernels (0%), which requires 560 min to dry the corn pile to a safe moisture of 14% (d.b.), the drying time is reduced by 60 min, 100 min, and 130 min for the respective broken kernel contents of 10%, 20%, and 30%, respectively. The PRCFD method successfully simulates the processes of convective heat and mass transfer in the fluid phase and thermal and mass diffusion in the solid phase, exhibiting a strong correlation with experimental data.

1. Introduction

During grain storage, local heat and mildew often occur inside the granary [1,2,3]. Local temperature and moisture in the grain pile exhibit significant variations with the external environment, making stored grain unsafe [4,5]. Despite the continuous increase in global grain production, improper post-harvest storage and management result in approximately 9% loss of grain each year, imposing higher requirements on storage management [6]. Grain drying is the process of removing moisture from freshly harvested grains to facilitate safe storage [7]. It essentially involves the complex heat and mass transfer in a particle packing bed under the influence of a drying medium. Fixed-bed drying has been widely applied in agriculture, chemical reactions, and nuclear reactors [8,9]. Ensuring a uniform temperature distribution within the grain bed, achieving uniform drying, and maximizing the efficiency of heat and mass transfer between the fixed bed and the drying medium are important aspects worth exploring.
The porosity of the grain pile is a crucial parameter that affects heat transfer and moisture migration during the drying process. Breakage and segmentation phenomena during the grain loading process result in a complex packing structure [10]. Under grain load, shear stress on grain contact surfaces overcomes friction between grains, leading to mutual slip and displacement along the contact surfaces, resulting in different forms of particle distribution [11]. Due to the differences in size, shape, density, and surface roughness between whole corn kernels and broken kernels, along with various segregation effects such as trajectory, fluidization, movement, and impact, the grain pile exhibits a more complex and heterogeneous pore structure [12]. During the drying process, the porosity significantly influences the flow and heat transfer processes in fixed beds. Additionally, broken kernels are more susceptible to insect and mold infestation, leading to localized heating within the grain pile.
Current research primarily employs experimental methods and the assumption of continuum media to investigate heat and mass transfer phenomena in porous media. Mandas et al. [13] used the finite element method to simulate the deep-bed drying of barley, achieving satisfactory agreement between the simulation and the experimental results. Naghavi et al. [14] proposed a non-equilibrium model for the drying and predicted the temperature and moisture content at different heights. Zare et al. [15,16] developed a thermal equilibrium model for rough rice and used Fortran 95 programming software to simulate variations in grain temperature and moisture content under different ventilation velocities and humidity conditions. Souza et al. [17] developed a two-phase model to investigate unevenness along the bed height during drying. The aforementioned models suffer from a major shortcoming because they overlook the intricate pore structure within the porous medium and its profound influence on the heat and mass transfer processes. By treating the porosity of the entire grain pile as a constant value, these models do not account for the impact of the shape of the grains’ particles on the heat and mass transfer, thus limiting their ability to explain such effects.
The discrete element method (DEM) and rigid body dynamics (RBD) method have been widely employed to simulate the random packing of particles in fixed beds, capturing the intricate surfaces and interactions of various irregular particles. The application of the PRCFD method to simulate heat and mass transfer processes in porous media has found extensive use in catalyst reactions and the cooling of nuclear materials [18,19,20]. It has also been applied in agricultural fields such as stacked apple cooling and radio frequency drying of corn [21,22,23,24]. During mechanical harvesting, transport, storage, and discharge of corn, corn kernels can break [25]. The presence of a mixture of whole and broken kernels in localized regions during drying can lead to uneven distribution of airflow resistance, thereby affecting the drying quality of the corn. Numerous researchers have conducted experimental and simulation studies on fixed-bed drying of different agricultural products, investigating various factors such as moisture content, drying medium temperature, and velocity, and proposing heat and moisture transfer models [26,27]. However, the effect of broken kernel content on the heat and moisture transfer performance in fixed-bed corn drying remains unexplored.
Therefore, the goal of the study is to investigate the effect of different broken particle contents on heat transfer and moisture transfer in fixed-bed corn drying. The RBD method was utilized to simulate four different grain packing structures with broken kernel rates of 0%, 10%, 20%, and 30%, establishing a conjugate transfer model for the fixed bed drying process. A detailed PRCFD model was used to study the flow field, pressure drop, and heat and moisture transfer processes within the fixed bed with varying broken kernel rates. The pressure drop and local flow patterns within the fixed bed were analyzed, exploring the influence of the broken kernel rate on the heat and mass transfer parameters during the drying process. Experimental data of pressure drop, temperature, and moisture content in different operating conditions are compared with simulation results, thus verifying the accuracy of the proposed model.

2. Materials and Methods
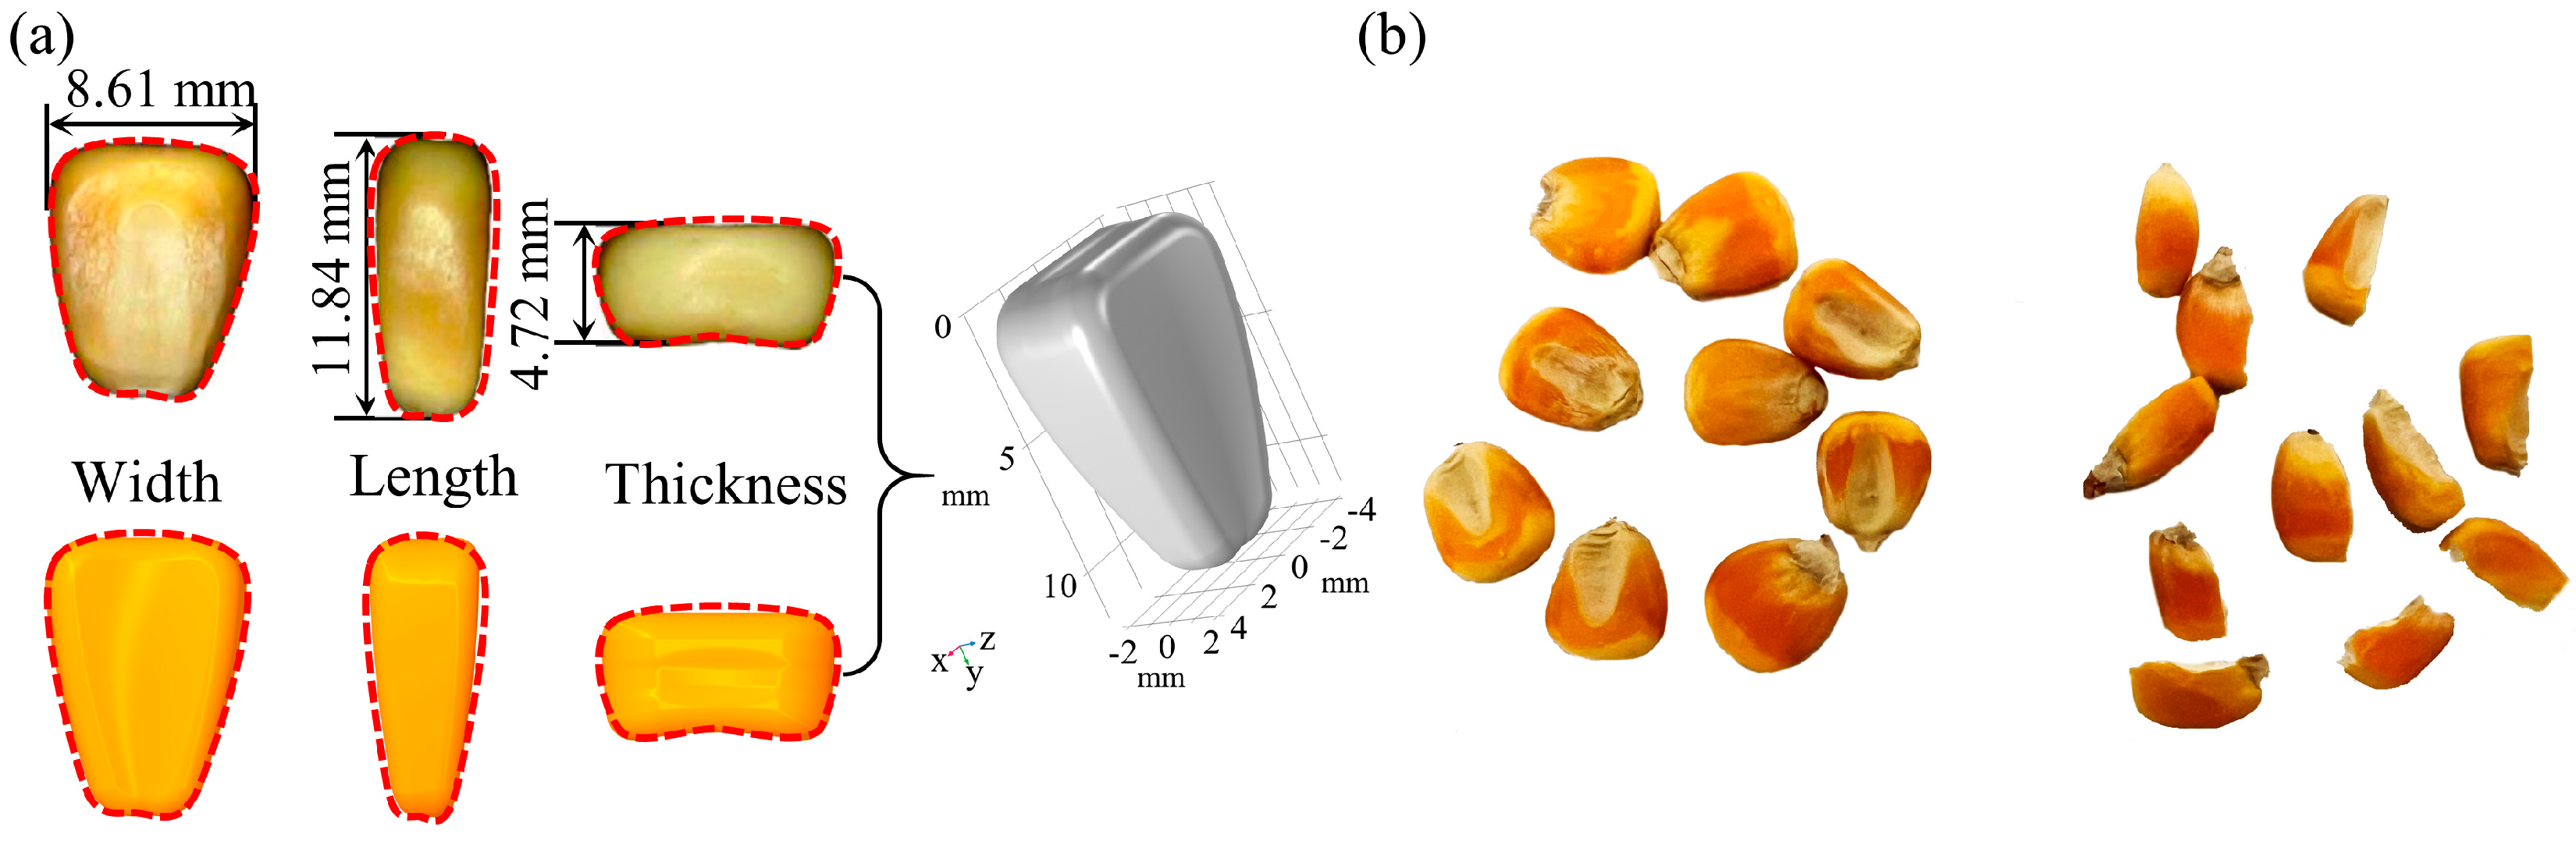
2.1. Materials

The corn samples used in the experiment were collected directly from a concrete silo (Henan, China). The local area is in a temperate monsoon climate. Randomly selected corn kernels from the filtered samples were cut along the central axis to obtain broken kernels. At the beginning of the experiment, a 30 g sample was placed in an electric hot air drying oven (Model DHG-101, Yongguangming Medical Instrument Co., Ltd. Beijing, China) and dried at 103 °C for 72 h. The initial moisture content of corn was obtained through three repeated measurements, which yielded an average value of 9.41 ± 0.03% (d.b.) [28]. Considering that this study focuses on the effect of the broken kernel rate on heat and moisture transfer during corn drying, only the broken form of half the kernels was investigated. Before the experiment, distilled water was added to the corn samples and thoroughly mixed to increase the moisture content. Conditioned corn samples were sealed in polyethylene bags and stored at a low temperature of 4 °C until the beginning of the experiment to achieve moisture equilibrium [29]. The final moisture content of the corn was 28.04 ± 0.06% (d.b.). One hundred whole corn kernels were randomly selected, and their average length, width, and thickness were measured using a digital caliper. Based on the three-dimensional dimensions of the corn kernels and the observed surface characteristics, a solid model of the corn kernels was constructed using SolidWorks 2021 software. The constructed model accurately represented the size and surface contour information of the kernels, with half the kernels being the whole kernels divided along the central axis. Figure 1 illustrates the geometric model of the corn kernel.

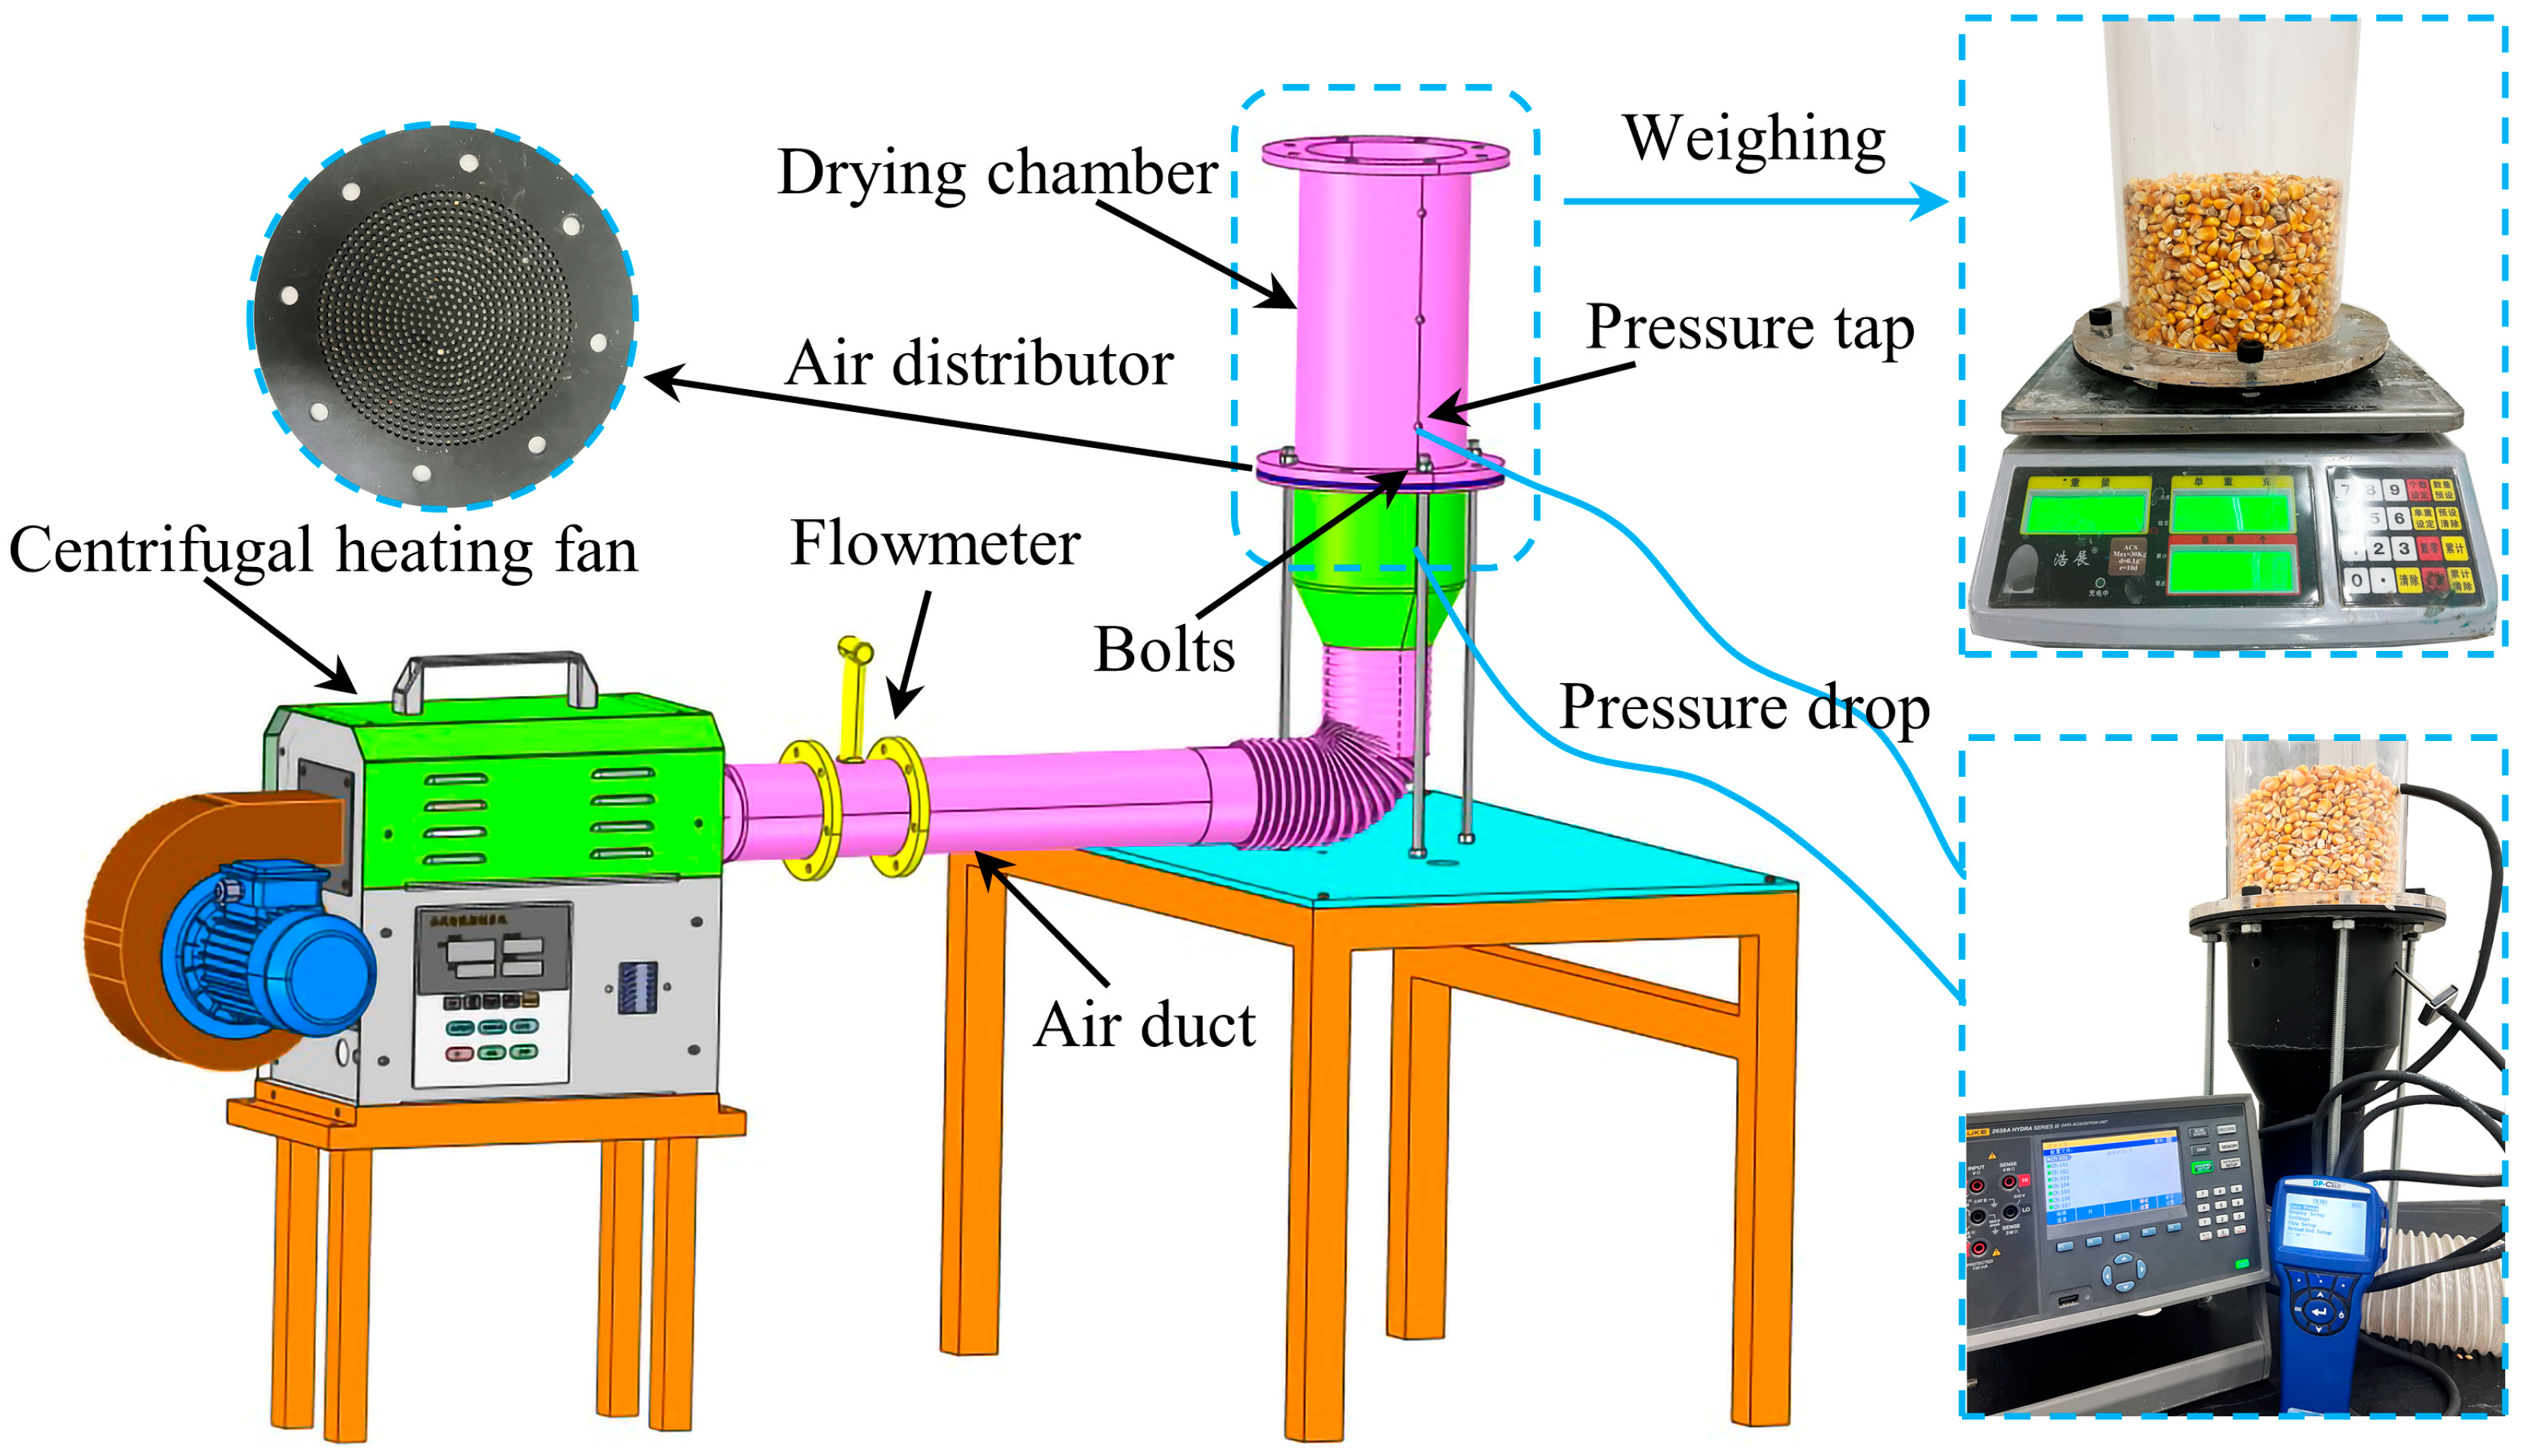
2.2. Experimental Apparatus

Figure 2 illustrates the experimental setup for fixed-bed corn drying, designed to investigate the pressure drop and heat-moisture transfer processes on a laboratory scale. The entire drying system consists of a hot air ventilation system, a drying chamber, and a data acquisition system. Ambient air is heated by a centrifugal heating fan (Model TSN-Z-20-B, Zhejiang Shengneng Machinery Equipment Co., Ltd., Hangzhou, China) and directed into the drying chamber through air ducts. Within the drying chamber, the heated air comes into contact with the corn kernels, facilitating the transfer of heat, while moisture within the corn undergoes evaporation and escapes the chamber due to heat absorption. The airflow rate can be adjusted using the frequency converter of the centrifugal heating fan, thereby controlling the air velocity at the entrance of the drying chamber. The velocity at the inlet is measured using an anemometer, while the flow rate within the ducts is monitored using a flowmeter (Model LUGB-DN75, Anhui Xinyu Automation Co., Ltd., Hefei, China). The temperature of the outlet air is regulated by adjusting the power of the heating unit on the centrifugal heating fan. The drying experiments are conducted in a relatively enclosed space, with the relative humidity of the surrounding air controlled by an industrial humidifier (Model AS-06CSB, Qingdao Wetwell Electric Co., Ltd., Qingdao, China). The drying chamber, a transparent organic glass cylinder, has a diameter of 100 mm and a height of 250 mm. It is securely connected to an air distributor using bolts to form a cohesive unit, which is then placed on a drying platform. The perforations on the air distributor, with an aperture rate of 40%, are smaller than the grain particles. At regular intervals, the drying chamber, along with the air distributor and the corn pile, is moved to a digital balance to measure and record the instantaneous moisture content of the corn pile. Pressure taps are alternately placed at 5 mm on the drying chamber, allowing the pressure differential across the corn pile to be measured using a digital micromanometer (Model DP-5815, TSI, Shoreview, MN, USA). T-type thermocouples (Model Pt-100, Nanjing Yi Yang Technology Co., Ltd., Nanjing, China) are sequentially placed within the corn pile, and their temperature readings are continuously recorded by the data acquisition system in real-time.

2.3. Experimental Procedure

To assess the impact of the broken kernel content on the transfer of heat and moisture during fixed bed drying, this study conducted experiments on samples with four different levels of broken kernel rates (0%, 10%, 20%, and 30%). The sample with a rate of 0% broken kernels was placed in the drying chamber during the experiments with a pile height of Hp = 100 mm. The corn, along with the combined mass of the drying chamber and the air distributor, was weighed to determine the mass of the grain sample. To ensure the comparability of results, samples with different levels of broken kernel content were adjusted to have the same total mass. The corn samples were filled into the drying chamber using free-fall and adjusted the frequency converter to achieve 16 different inlet air velocities (ranging from 0.05 m/s to 0.8 m/s). A digital micromanometer was used to measure the pressure variations through the corn pile at different velocities. In order to ensure uniform corn temperature, the corn was left at ambient temperature for 24 h, the room temperature was 298.15 K. The temperature control panel of the hot air blower was adjusted, setting the inlet air temperature to 323.15 K. T-type thermocouples were placed at 25 mm intervals on the surface of the corn pile to measure the temperature changes within the bed. To determine the moisture content changes during grain drying, the drying chamber, along with the air distributor, was moved to a digital balance every 60 min from the start of the experiment. After the mass was recorded, the apparatus was quickly moved to the drying platform to minimize disturbance to the corn pile, allowing the calculation of the instantaneous moisture content through continuous weighing. Once a drying cycle was completed under a specific operating condition, the heat and moisture transfer measurements were performed for samples with different levels of broken kernel content following the same procedure. To ensure the precision of the experimental results, three replicates were conducted for each condition.

3. Numerical Simulation Models and Methods

3.1. Rigid Body Dynamics Modeling

The RBD method provides a means to calculate the contact dynamics of particles. Unlike the force-displacement model in the DEM, the RBD method employs a pulse-based model to handle contact interactions. This model is particularly suitable for scenarios where contact patterns vary repeatedly or involve a large number of collisions [30]. Blender 3.5 software, equipped with the Bullet Physics Library, allows for the incorporation of rigid body motion models into particles, enabling the packing of complex-shaped particles and providing visual control over the packing process.
In this study, the STL models of corn particles were loaded into Blender 3.5 software to generate a three-dimensional packed bed model within a cylinder with R = 100 mm diameter. While the fragmented morphology of grain also plays a significant role in the packing structure, our focus was primarily on investigating the impact of broken kernel rate [31]. In this simulation, the corn particles included two forms: whole kernels and half kernels. We constructed a series of packed models with different proportions of broken kernel content, specifically 0%, 10%, 20%, and 30%. Table 1 presents the particle property parameters required for the RBD simulation. With an equal total weight (volume) of particles, the number of whole kernels (Nw) and half kernels (Nb) varied as follows for different packing models: Nw = 1448 Nb = 0 (0%); Nw = 1300 Nb = 296 (10%); Nw = 1156 Nb = 584 (20%); Nw = 1012 Nb = 872 (30%). Figure 3 illustrates the fixed-bed packing structure with various broken kernel content.

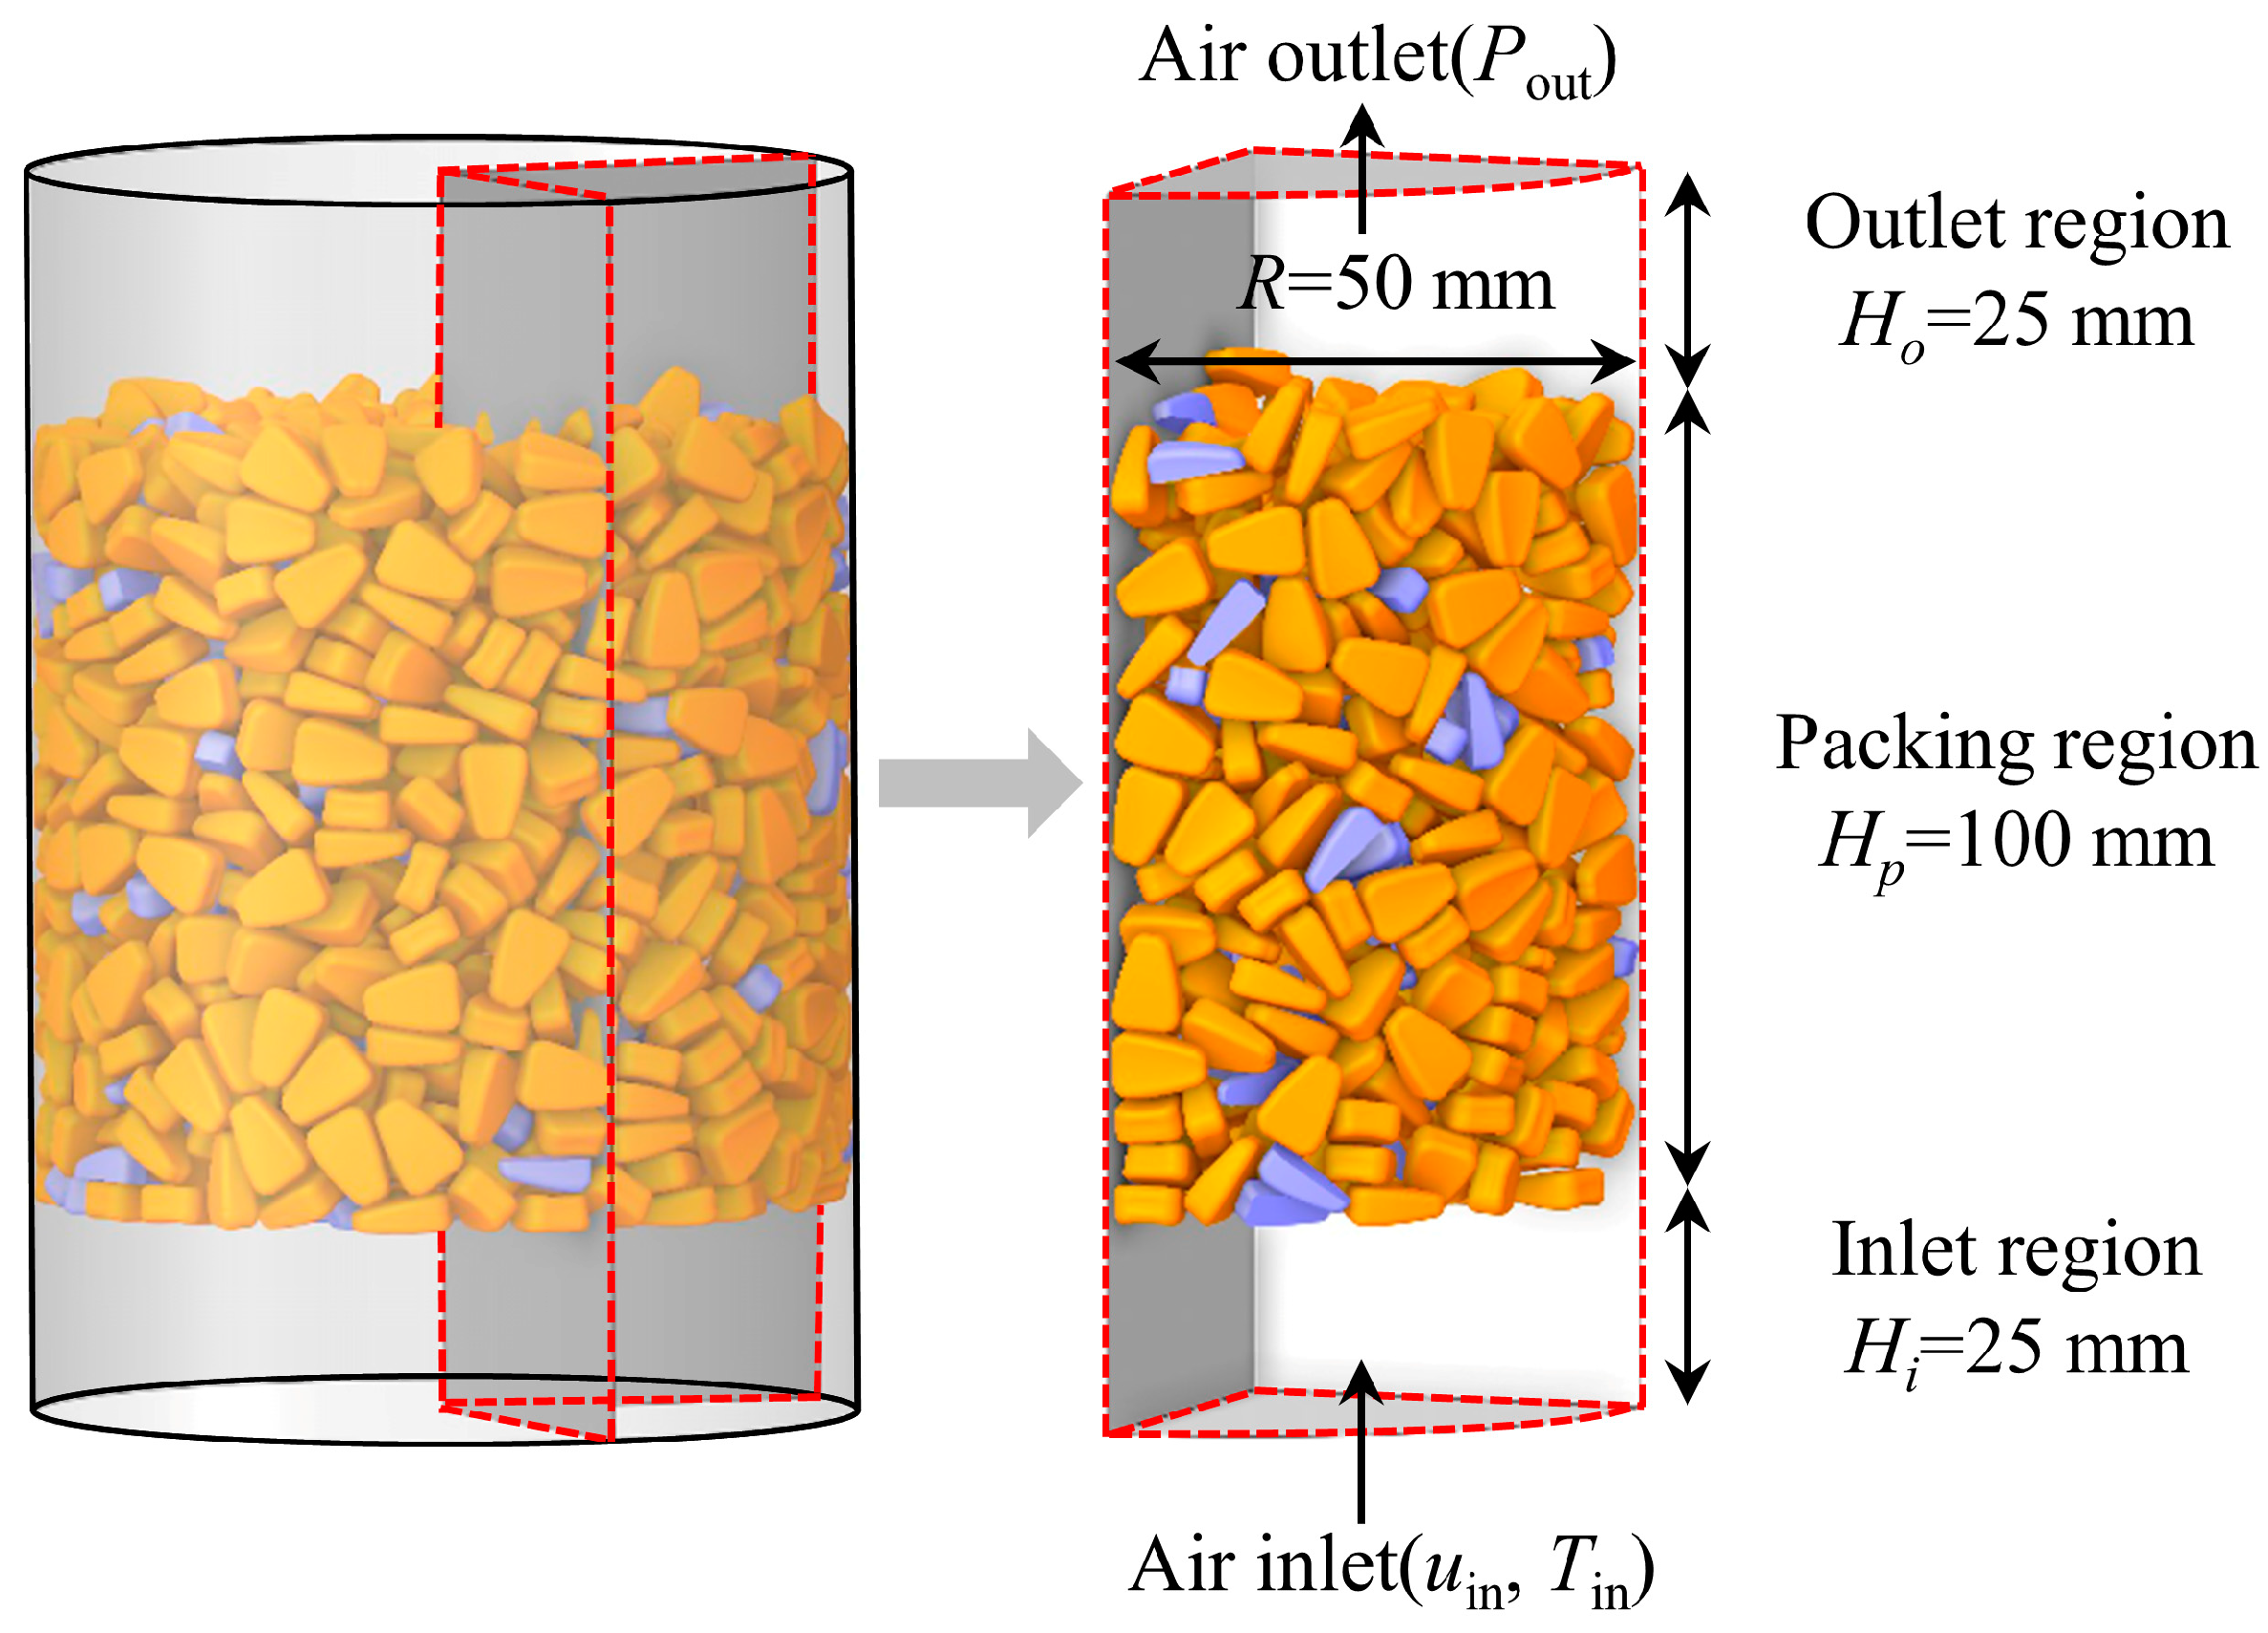
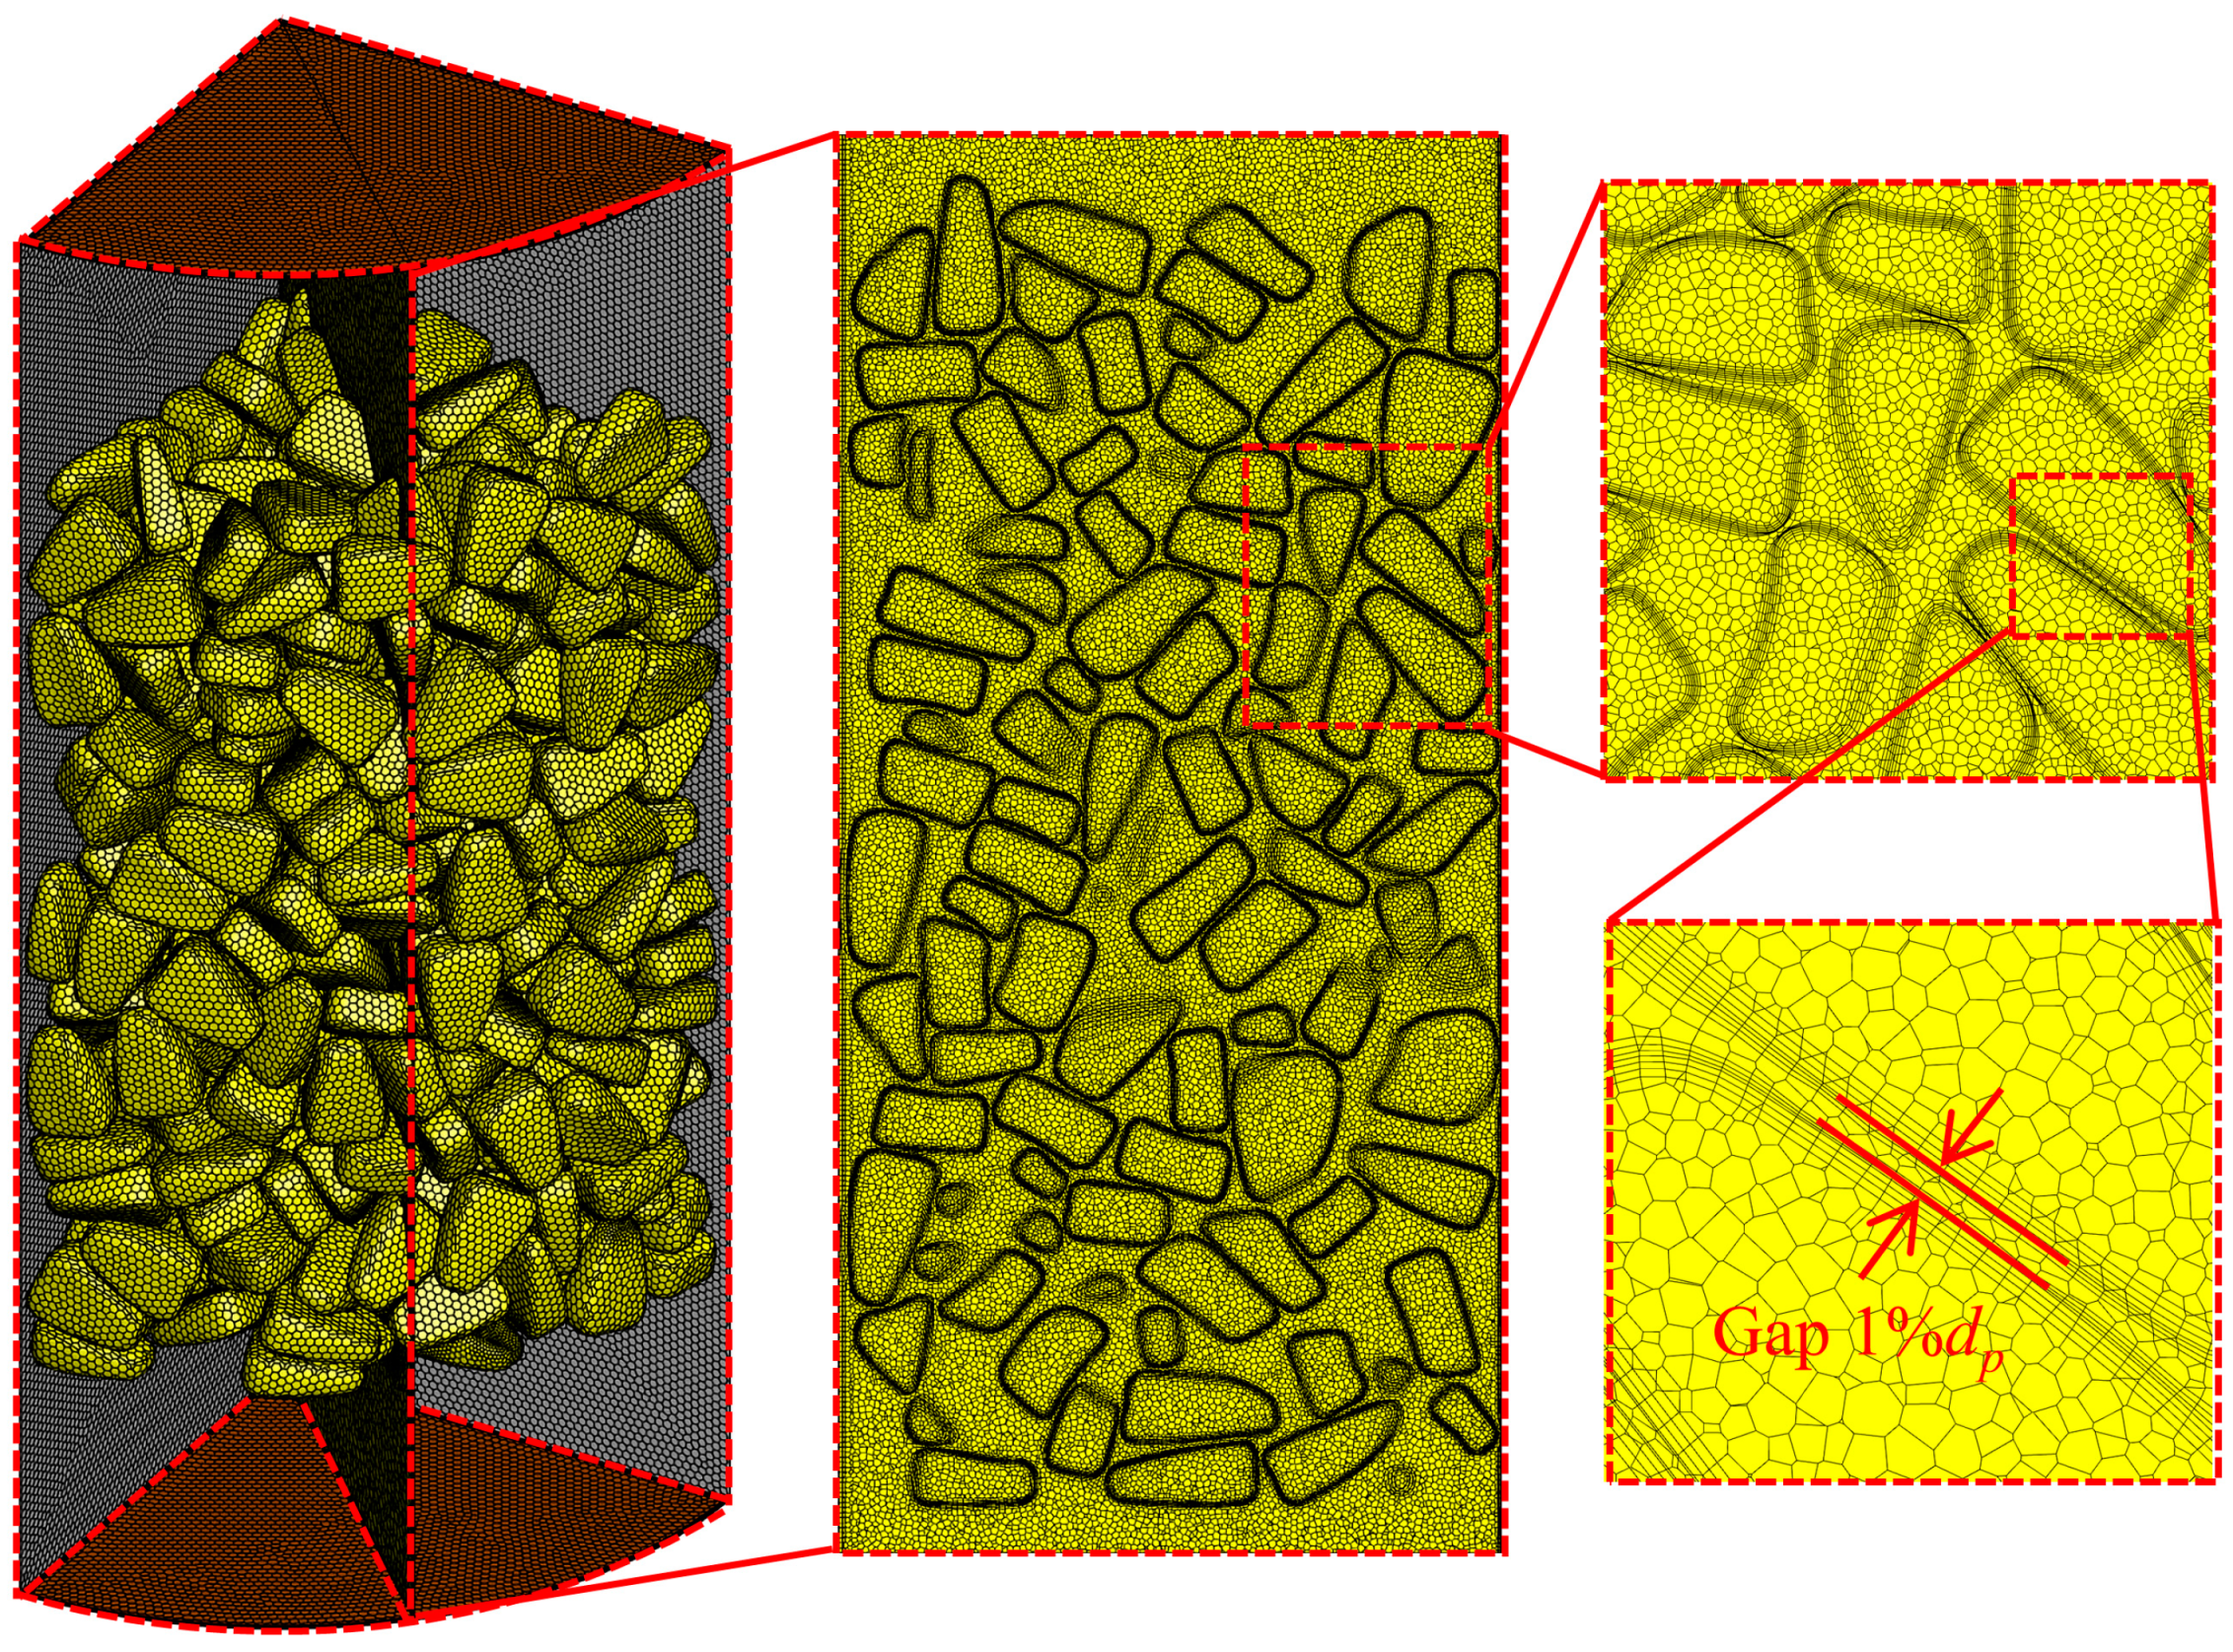
3.2. Computational Domain and Mesh Generation

Using a self-developed Python code, the centroid coordinates of the particles and the node information of all surface facets within the packing structure generated by the RBD method were extracted. Based on this coordinate information, a script program was written to generate a log file for automated modeling in Gambit 2.4.6 software. Subsequently, using Gambit software, CAD models of particles and cylindrical wall surfaces were reconstructed in batches. As the corn particle bed is randomly generated, it exhibits periodic axial characteristics in space. To ensure computational accuracy and cost-effectiveness, it is reasonable to simplify the fixed-bed packing model [32]. In this study, the range of 0° to 90° of the packed particles is used for meshing and numerical solution. Considering the influence of the broken kernel content, the actual heights (Hp) of the fixed-bed packing region were determined to be 100 mm, 98.2 mm, 97.1 mm, and 96.4 mm for the broken kernel contents of 0%, 10%, 20%, and 30%, respectively. The inlet region has a length of Hi = 25 mm, and the outlet region has a length of Ho = 25 mm. Figure 4 provides a schematic of the geometric model for the corn packing structure.
Due to the intricate shape of the corn particles, there are both point and surface contacts between the particles within the constructed bed, resulting in gradually decreasing gaps and the presence of narrow interstices in the contact regions. To ensure computational stability during mesh generation, the grids in this area must be small, which significantly increases the grid count and decreases computational efficiency [33]. Even with adequately small grids, there remains the issue of significant skewness, which severely affects the convergence and accuracy of the simulation results. Currently, there are four methods to solve contact points: overlaps, gaps, bridges, and caps [34]. Dixon et al. [35] found that reducing the diameter of the particles by 0.5% dp had a minimal impact on the pressure drop and the flow behavior. Similarly, Bai et al. [36] applied the gap method with a 0.5% dp reduction in particle diameter and experimentally and numerically studied fluid flow between spherical and cylindrical particles, achieving good agreement between the simulated and experimental pressure drop in the bed. We have previously published relevant work exploring meshing techniques for both spherical and non-spherical grains [37]. In this study, the gap method is used to handle the contact between corn particles and the contact between the particles and the wall. The diameter of all corn particles is reduced by 0.5% dp, allowing for a more accurate depiction of the flow and temperature distribution. Given the complexity of particle shapes and bed structures, the ANSYS Fluent meshing is employed to generate hexahedral grids for both the air and particle regions. The grid size is 1/20 dp, and the number of boundary layers of the particles and the outer surface of the fixed bed is six, with a growth factor of 0.42 in the normal direction for each layer. Figure 5 illustrates the contact processing and mesh generation.

3.3. Governing Equations

During the fixed-bed drying process, air flows through the pores, while heat and moisture exchange occurs on the surface of the corn particles. The internal transfer of heat and moisture within the corn primarily takes the form of diffusion. The heat and mass transfer between the bed particles and fluids in the pores presents a typical conjugate transfer problem, which requires the solution of the Navier–Stokes equation for airflow region and diffusion equations for heat and mass transfer within the corn solids. The continuous solution is obtained by coupling fluid–solid interfaces [38]. The following assumptions are made for the model: (1) The size and shape of the corn particles remain constant during the drying process; (2) There is only convective heat and mass transfer between the surface of the particles and the air; (3) There is an unstable heat conduction and moisture diffusion process within the particles; (4) Corn particles do not generate heat.
Based on these assumptions, the governing equations for airflow and heat and mass transfer in the air region during the fixed-bed corn drying are derived as shown in Equations (1)–(4).
ρ f t + ρ f u j x j = 0
ρ f u i t + x j ρ f u i u j + p δ i j μ f u i x j = ρ f g i
ρ f c f T f t + x j ρ f c f u j T f k f T f x j = 0
ρ f Y f , db t + x j ρ f u j Y f , db D f Y f , db x j = 0
where ρf, kf, cf, are the density, thermal conductivity, and specific heat of the fluid, kg/m3, W/(m∙K), J/(kg∙K); µf is the dynamic viscosity of the fluid, kg/(m∙s); Tf is the temperature of the fluid, K; Yf,db is the moisture content of the fluid, % (d.b.); Df is the moisture diffusion coefficient of the fluid, kg/(m∙s).
As the fluid cannot pass through the particle, the energy and mass transfer equations in the particle region during the fixed-bed corn drying can be simplified to thermal diffusion and mass diffusion equations, respectively. These simplified equations are represented by Equations (5) and (6).
ρ s c s T s t + x j k s T s x j = 0
ρ s Y s , db t + x j D s Y s , db x j = 0
where ρs, ks, and cs, are the density, thermal conductivity, and specific heat of the particle, kg/m3, W/(m∙K), J/(kg∙K); Ts is the temperature of the particle, K; Ys,db is the moisture content of particle, % (d.b.); Ds is the moisture diffusion coefficient of the particle, kg/(m∙s).
To address the interface between corn particles and air, a coupling boundary is used for the solution. The boundary conditions at the coupled wall interface, as well as the initial conditions, are described by Equations (7)–(11).
k f T f n = h s ( T f T s )
k s T s n = h s ( T s T f )
D f Y f , wb n = h m ( Y f , db Y s , db )
D s Y s , wb n = h m ( Y s , db Y f , db )
t = 0 ; T s = T f = T 0 ; Y s , db = Y s 0 ; Y f 0 = M e
where hs is the heat transfer coefficient, W/(m2∙K); hm is the mass transfer coefficient, m/s; T0 and Ys0 are the initial temperatures and moisture of corn, respectively, K, %(d.b.); Me is the initial moisture of the air, %(d.b.).

3.4. Data Processing Methods

Regarding the internal flow characteristics and convective transfer performance in the fixed-bed corn drying process, the following equations are used to process the data:
The theoretical value of pressure drop is calculated using Ergun and Reichelt equations [39,40], as illustrated by Equations (12)–(14).
Δ p L = 150 μ ( 1 ε ) 2 ε 3 u d p 2 + 1.75 ρ ( 1 ε ) ε 3 u 2 d p
Δ p L = 154 A w 2 μ u d p 2 ( 1 ε ) 2 ε 3 + A w ρ u 2 B w ( 1 ε ) d p
A w = 1 + 2 3 D / d p ( 1 ε ) ; B w = 1.15 d p / D 2 + 0.87 2
p is the pressure drop, pa/m; L is the height of the packing structure, m; ε is the porosity of the packed bed; Aw and Bw are the dimensionless coefficients.
The equivalent diameter of the particles with different broken kernel contents is calculated using Equation (15) [41].
d p = 6 p = 1 N p V p / p = 1 N p A p
where Vp is the volume of the particles, mm3; Ap is the area of the particles, mm2.
To characterize the drying performance of the corn fixed bed, the following equations are employed:
The total energy in the fixed bed of corn is calculated using Equation (16).
E st = 0 t m c f T in T out d t
The heat transfer power, denoted as P, representing the ratio of total energy to heating time, is calculated using Equation (17).
P s t = 0 t m c f T in T out   d t t
The heat transfer coefficient of fixed-bed corn drying can be determined using Equation (18).
h s = Q A Δ T = 1 2 cell 2 cell 3 ρ f c f A in u T out T in d A A s T s T ¯ f
where m is the mass flow rate, kg/m3; Tin and Tout is the temperature of the inlet and outlet, K; T ¯ is the average temperature of heat exchange fluid, K. As is the total heat transfer surfaces of particles, mm2.

3.5. Boundary Conditions and Related Parameters

The heat and moisture transfer in fixed-bed corn drying with different levels of broken kernel content was simulated using the commercial computational fluid dynamics software ANSYS Fluent 2022 R2. The initial temperature of the corn in different packed beds was 298.15 K, and the moisture content was 28% (d.b.). The hot air temperature was maintained at 323.15 K with a relative humidity of 23% (RH). The bottom of the fixed bed was set as the velocity inlet boundary, and the simulation was carried out with 16 different levels of inlet air velocity ranging from 0.05 to 0.8 m/s. Table 2 shows the parameter settings for corn and air in the simulation. The top of the fixed bed was set as the boundary of the pressure outlet with an outlet pressure of 0 Pa. The outer cylindrical surface of the fixed bed was treated as a nonslip adiabatic boundary. The surface of the corn particles was set as a nonslip boundary with coupled heat and moisture transfer. Due to the complex and variable internal pore structure of the computational model and the intricate flow patterns within the bed, the ideal k-ε equation from the Reynolds-averaged (359.7~423.2) Navier–Stokes (RANS) turbulence model was used. An enhanced wall function was selected for the simulation. The governing equations were solved using the SIMPLE algorithm, with a second-order upwind scheme used for the discretization of all equations except the pressure equation, which was discretized using a standard scheme to minimize numerical dissipation. To ensure the accuracy of the solution, a time step of 0.1 s was chosen, and the residuals were set to 10−6.

4. Results and Discussion

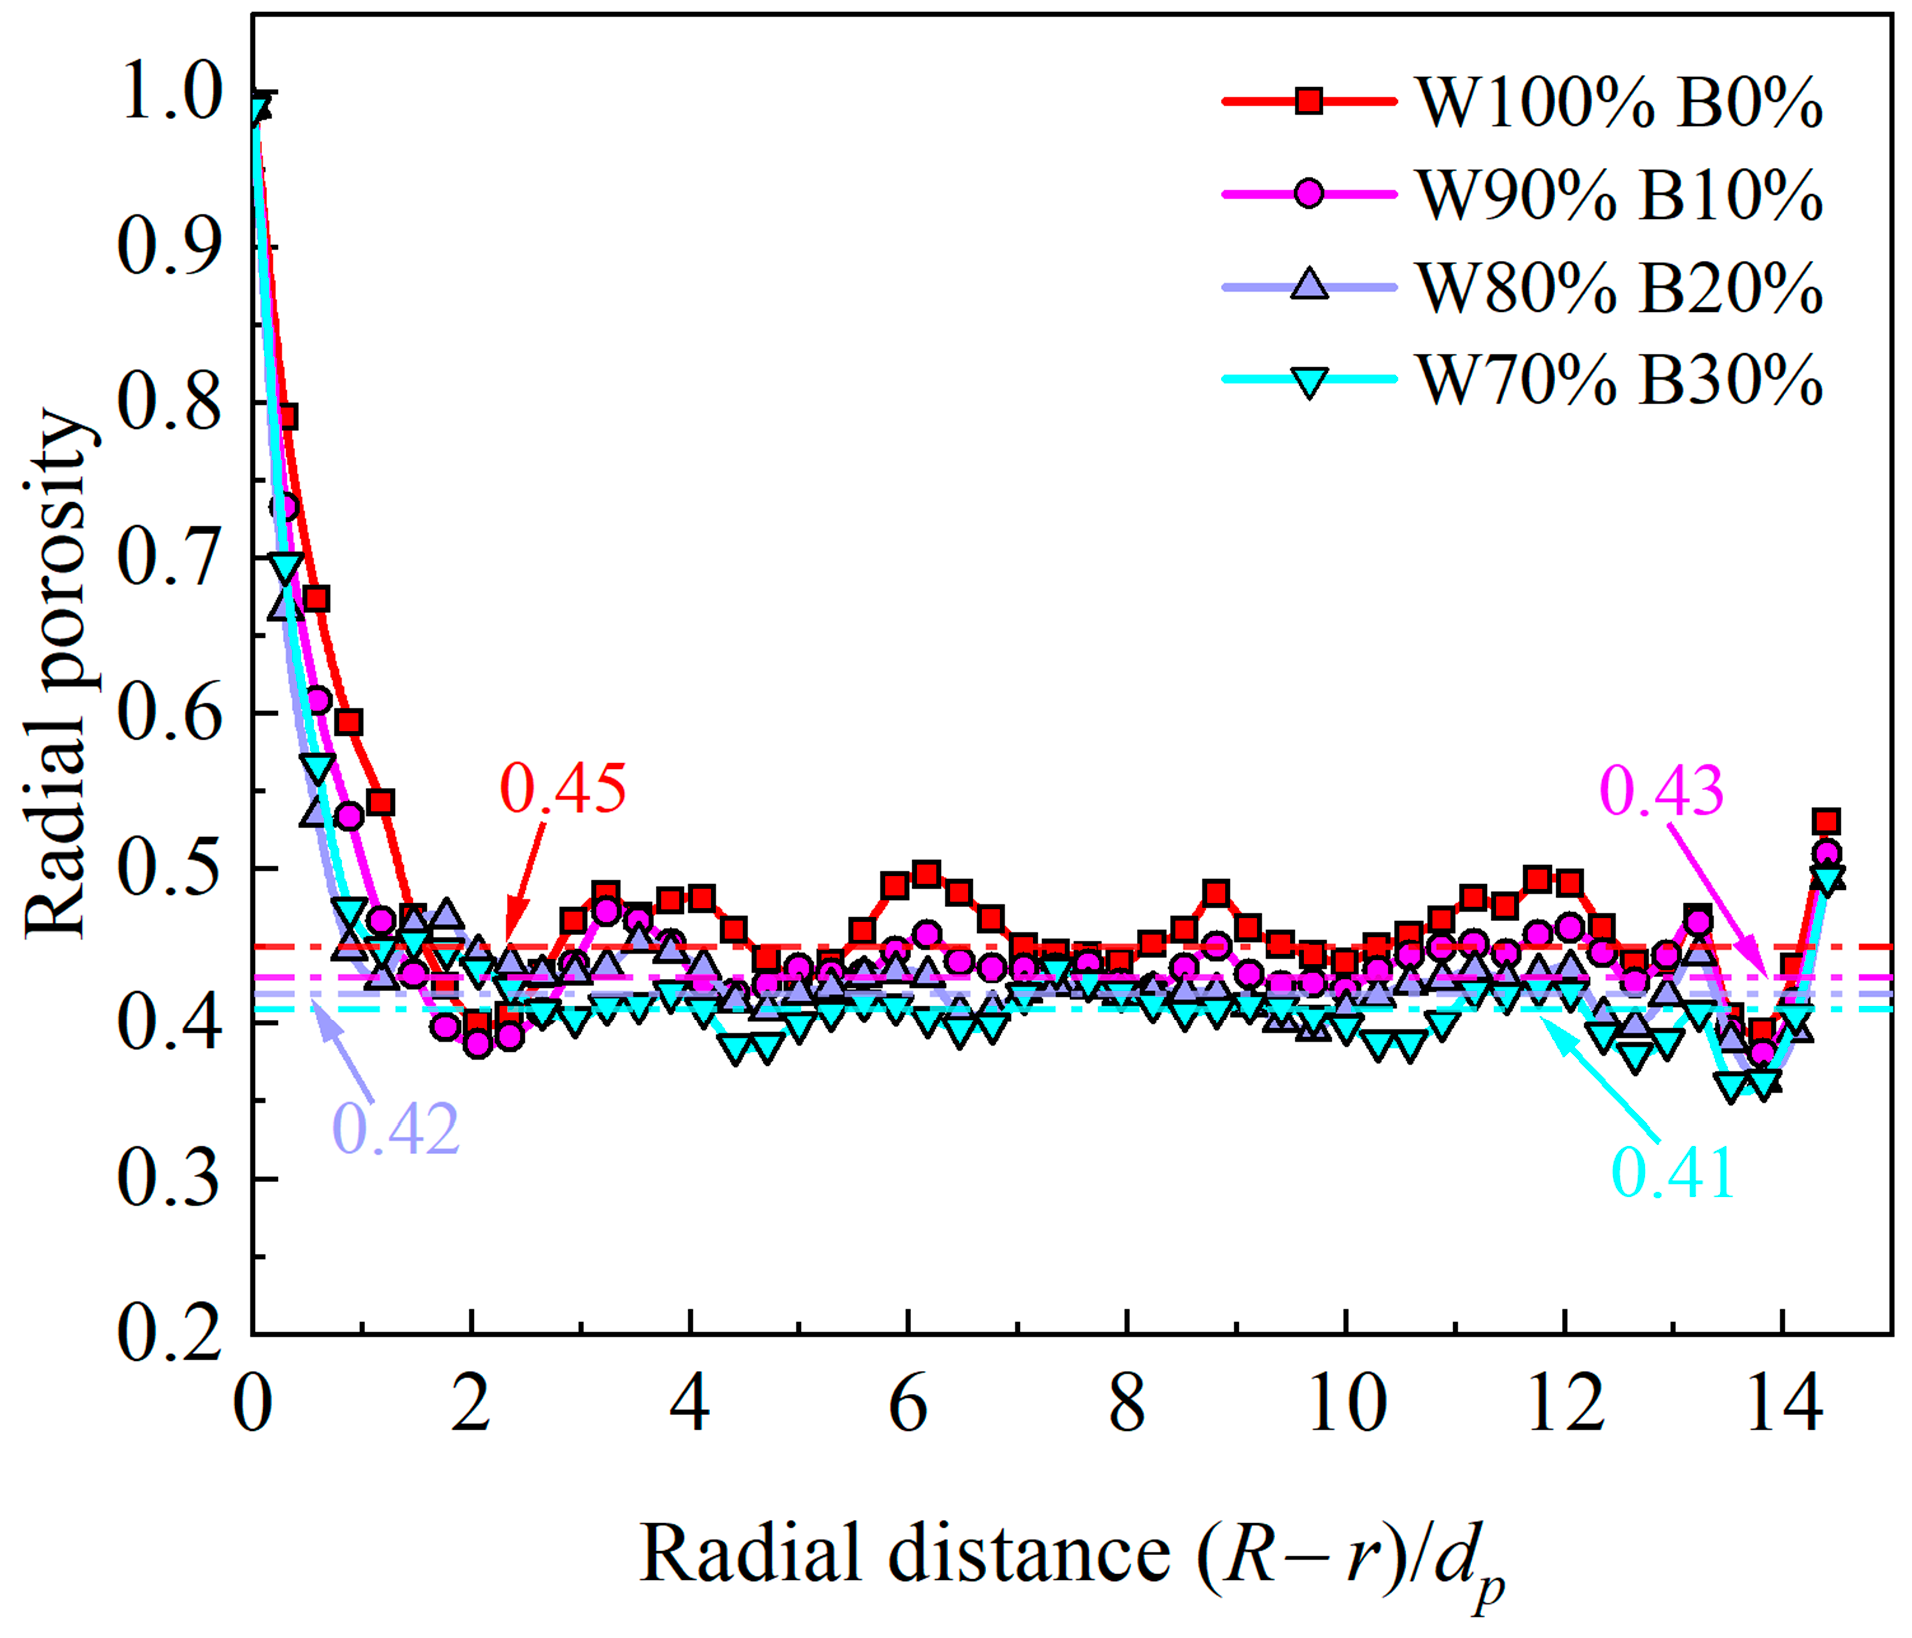
4.1. Radial Porosity Distribution

To ensure the effectiveness of the Computational Fluid Dynamics (CFD) model for the randomly packed bed, it is crucial to validate the constructed geometric model’s ability to represent the actual packing structure. Porosity is one of the key parameters for characterizing the structure of the fixed bed. To examine the rationality of the fixed-bed of corn created using the RBD method in this study, the radial porosity distribution with various broken kernel content, generated by the RBD method, was compared with the empirical formula proposed by deKlery for the radial porosity distribution in packed beds as Equation (19). The accuracy of this formula has been widely recognized and accepted [42].
ε ( r ) = 2.14 n 2 2.53 n + 1 , n 0.637 ε + 0.29 e 0.6 n × cos [ 2.3 π ( n 0.16 ) ] + 0.15 e 0.9 n , n > 0.637
where ε(r) is the radial porosity; ε is the non-constrained porosity; n = (Rr)/dp is the non-dimension distance; r is the distance between the measurement point and the central axis of the fixed bed; R is the radius of the fixed bed.
Firstly, the cylindrical computational domain is divided into 50 equal sections, resulting in multiple coaxial circular cross-sections. Then, these obtained circular cross-section areas are integrated to calculate the individual cross-sectional areas. Finally, the radial porosity distribution is determined by applying Equation (20) to calculate the cross-sectional areas of the cylindrical sections.
ε ( r ) = A fluid   ( r ) A c y l ( r ) = A fluid   ( r ) 2 π r H
Figure 6 illustrates the radial porosity distribution in fixed beds with varying levels of broken kernel content. It can be observed that the radial porosity distribution obtained through the RBD method closely matches the calculated results from the deKlery equation. The radial porosity distribution in fixed beds with different levels of broken kernel content exhibits a similar oscillatory trend. Due to the influence of the cylindrical wall on corn particles, the arrangement of the first layer of particles follows the curvature of the outer wall. Particles in close proximity to the wall approach point contact, resulting in a maximum porosity value of approximately one at the wall surface. As the distance from the cylindrical wall increases, the porosity gradually decreases and rapidly drops to the first minimum value approximately half the particle diameter away from the wall. Subsequently, the radial porosity gradually increased. The second layer of particles establishes close contact with the first layer, and during packing, the particles automatically adapt to the uneven surface of the first layer, resulting in slight overlapping between the two layers of particles. With an increasing dimensionless distance, the compaction level of the fixed bed continuously increases, leading to a decreasing porosity and exhibiting oscillatory attenuation patterns, ultimately approaching the average porosity. The distance between peaks and valleys is approximately 0.5 times the dimensionless wall distance. According to Figure 6, the central porosity of the bed is 0.45 when broken kernel content is 0%. Under the broken kernel content states of 10%, 20%, and 30%, the porosity is 0.43, 0.42, and 0.41. As the broken kernel content increases, the amplitude of the radial porosity oscillation gradually decreases. This can be attributed to the natural loose packing of whole kernels, which results in a higher number of large intergranular voids. When broken kernels are present, smaller broken kernels are more likely to fill the larger voids, thus reducing the local porosity.

4.2. Pressure Drop

4.2.1. Experimental Pressure Drop

Figure 7 shows the pressure drop measured in fixed beds of corn with varying levels of broken kernel content. The pressure drop increases with the inlet velocity and broken kernel content. Within the range of inlet velocities from 0.05 to 0.8 m/s, the pressure drop in corn fixed beds without broken kernels (0%) ranges from 1.27 to 105.39 Pa. The addition of broken kernel content noticeably increased the pressure drop in the corn bed. With a broken kernel content of 10%, the pressure drop in the corn bed extends to a range of 1.65–119.05 Pa. For 20% broken kernel content, it ranges from 2.08 to 137.98 Pa, and for 30% broken kernel content, it ranges from 2.42 to 167.63 Pa. As the broken kernel content increases, the pressure drop experiences an average increase of 16.37%, 31.62%, and 60.59% within the inlet velocity range from 0.05 to 0.8 m/s when compared to beds without broken kernels (0% content).

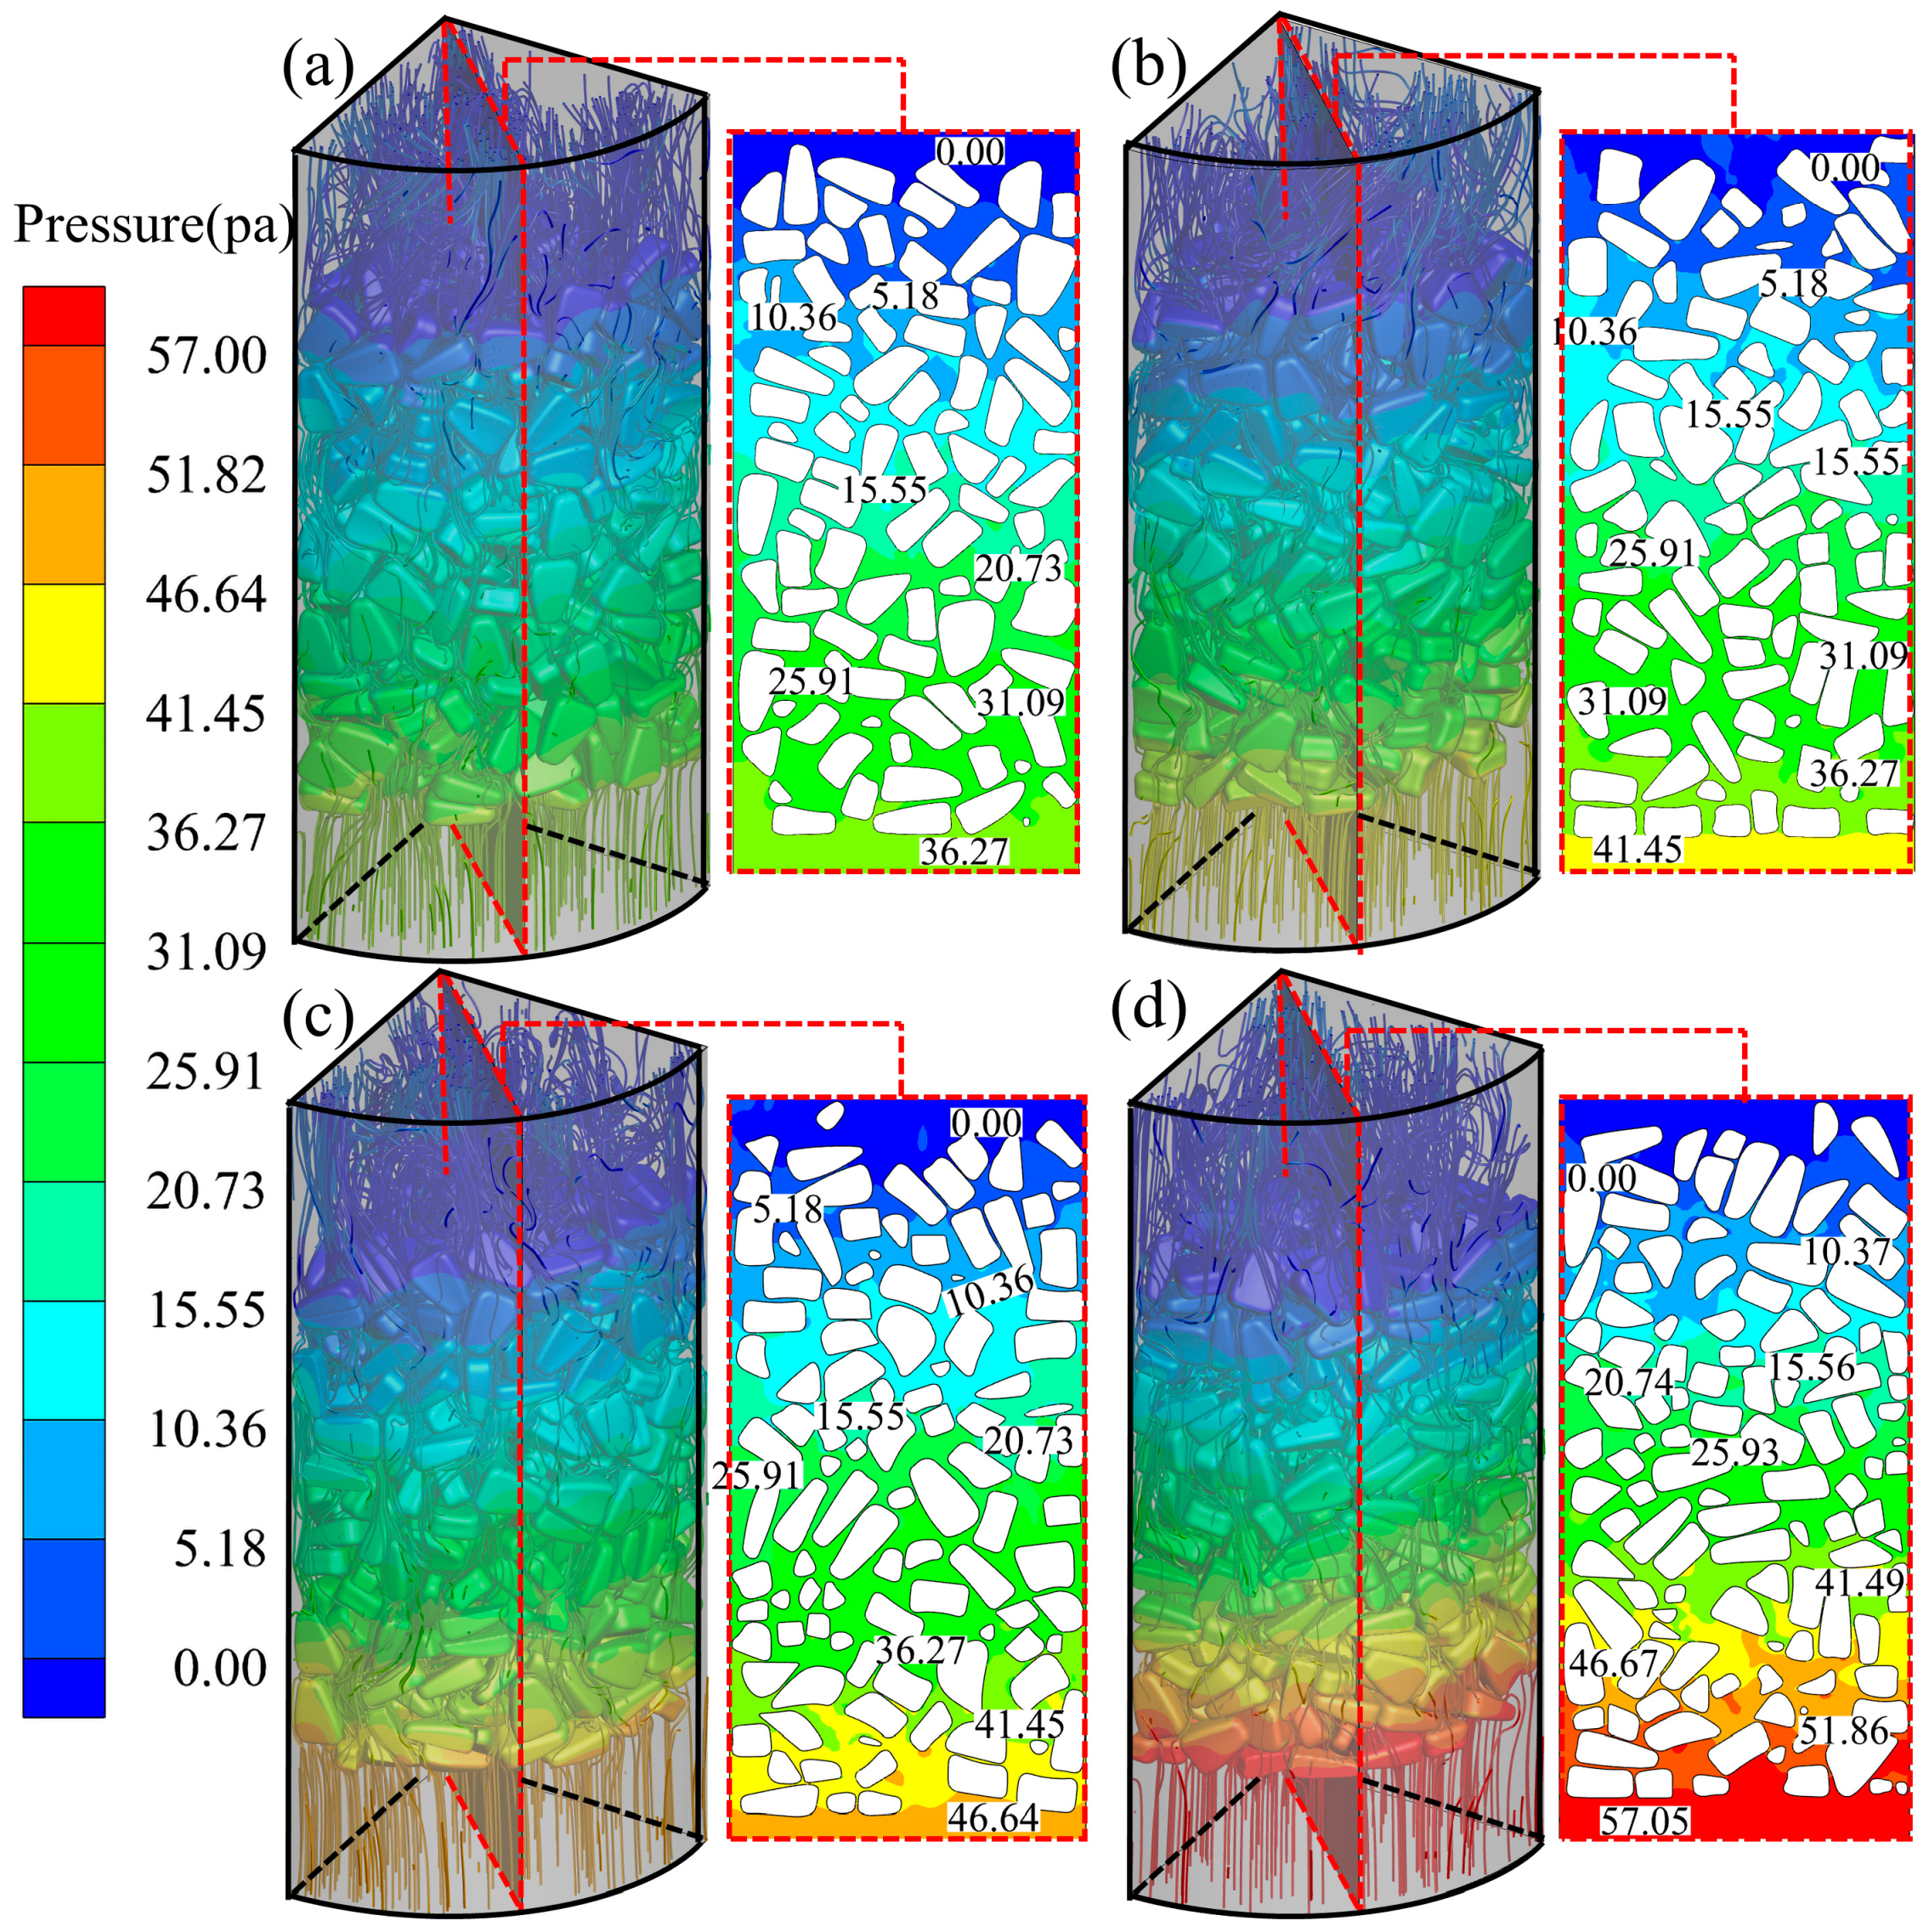
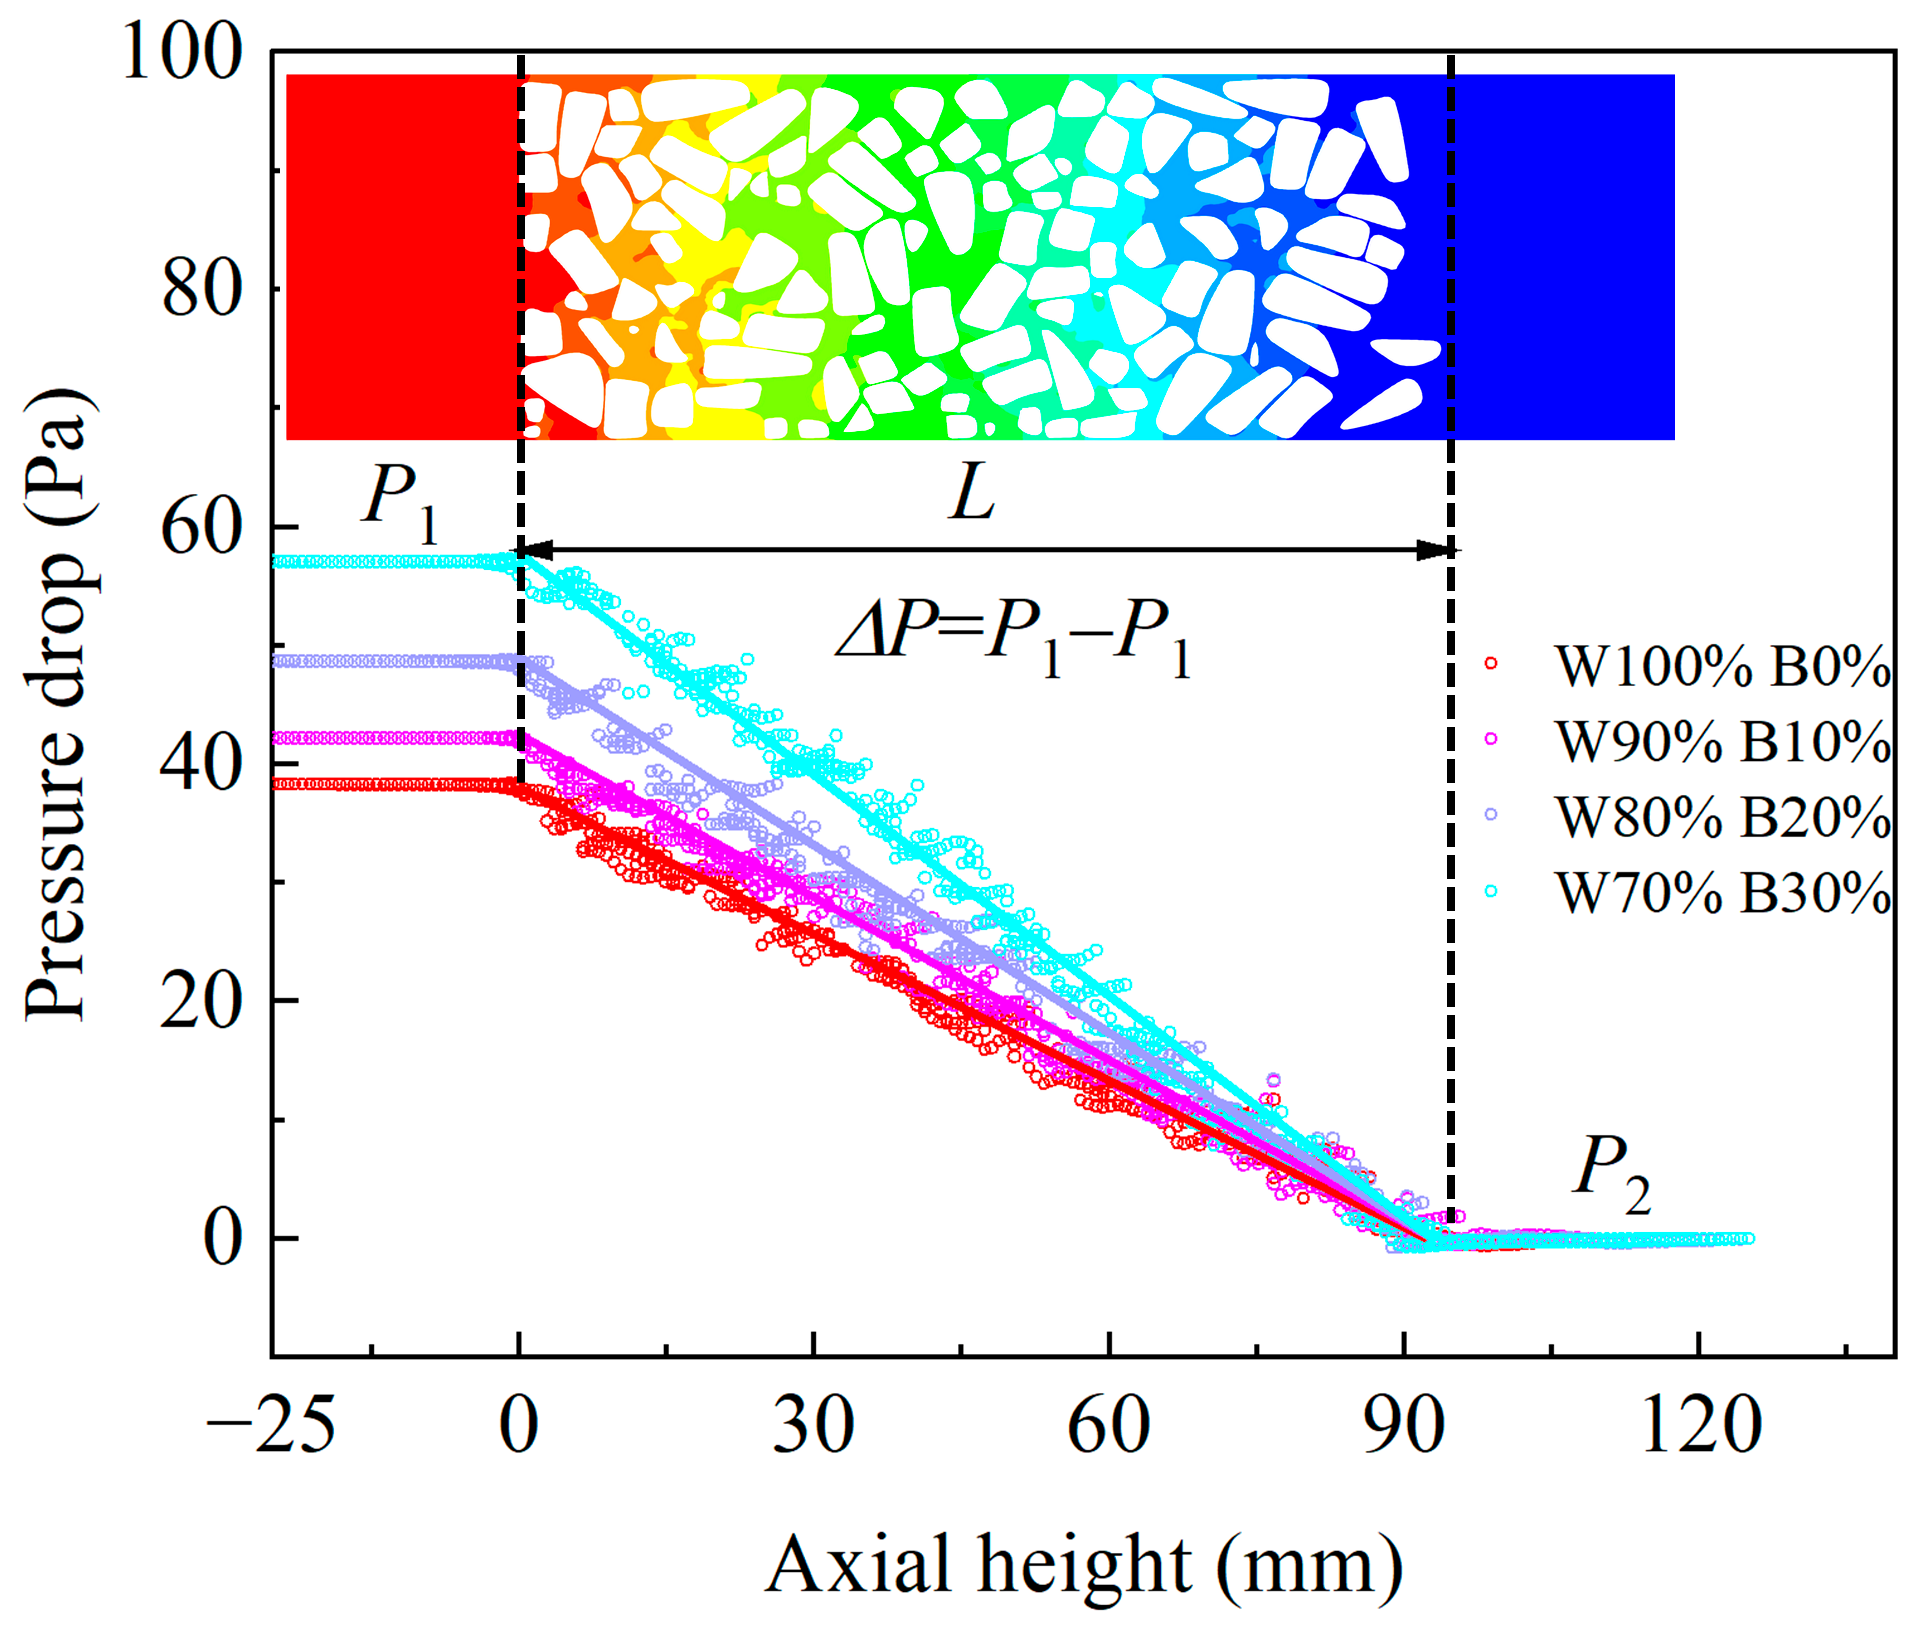
4.2.2. Numerical Simulation of Pressure Drop

The internal airflow resistance characteristics of fixed beds are crucial factors affecting drying uniformity and energy loss. The inlet velocity V0 = 0.5 m/s was chosen for the study. Figure 8 shows the streamlines and pressure drop at the Y = X plane in fixed beds of corn with varying levels of broken kernel content. It can be observed that the airflow paths within the fixed beds are quite complex, and as the broken kernel content increases, the curvature of the airflow paths also increases. The flow reversal at the top becomes more pronounced, providing a visual representation of the increased resistance in the fixed bed [43]. Pressures in the inlet and outlet sections remain almost unchanged, indicating unobstructed fluid flow in these regions. The pressure gradually decreases along the axial direction within the packed bed, exhibiting a stratification phenomenon. In the fixed bed with 30% broken kernel content, the pressure stratification and fluctuation phenomena become more pronounced. The axial pressure distribution at the Y = X plane of fixed beds with different broken kernel contents is illustrated in Figure 9. Each point on the graph corresponds to a specific pressure drop value at a spatial location on the Y = X plane. The pressure drop increases in the inlet section with broken kernel content, while the pressure drop approaches 0 Pa in the outlet section. The fluctuating points on the graph represent local variations in pressure at the cross-section. Maximum fluctuations occur in 30% broken kernel content, consistent with the axial pressure drop contour plot. The pressure drop at the center cross-section of the fixed bed exhibits a linear decrease with increasing height. The slope of the curve increases with higher broken kernel content, indicating an accelerated rate of pressure drop reduction with increasing broken kernel content.
Figure 10 presents experimental and simulated plots that depict the pressure drop with various broken kernel contents at various inlet velocities. The pressure drop increases in a parabolic manner as the inlet velocity increases. As the inlet air velocity increases, the Ergun equation deviates more significantly from the experimental values. The Ergun equation overestimates pressure drop at higher inlet velocities, with an average deviation of 37%. This discrepancy arises from the assumption in the Ergun equation that the interaction between the fluid and particles is uniform, neglecting certain frictional effects within the pipeline and resulting in an overestimation of the pressure drop. The Reichelt equation, incorporating correction factors and empirical parameters to account for different particle sizes and flow regimes, yields good agreement with experimental data in fixed beds with higher inlet velocities and a 30% proportion of broken kernels. The PRCFD simulation method directly captures the bed’s pressure drop, exhibiting an average deviation from experiments below 15% across different packing models. The PRCFD model not only includes the influence of particle characteristics but also takes into account internal fluid friction and the effect of variations in pore structure, providing more accurate pressure drop results [44].

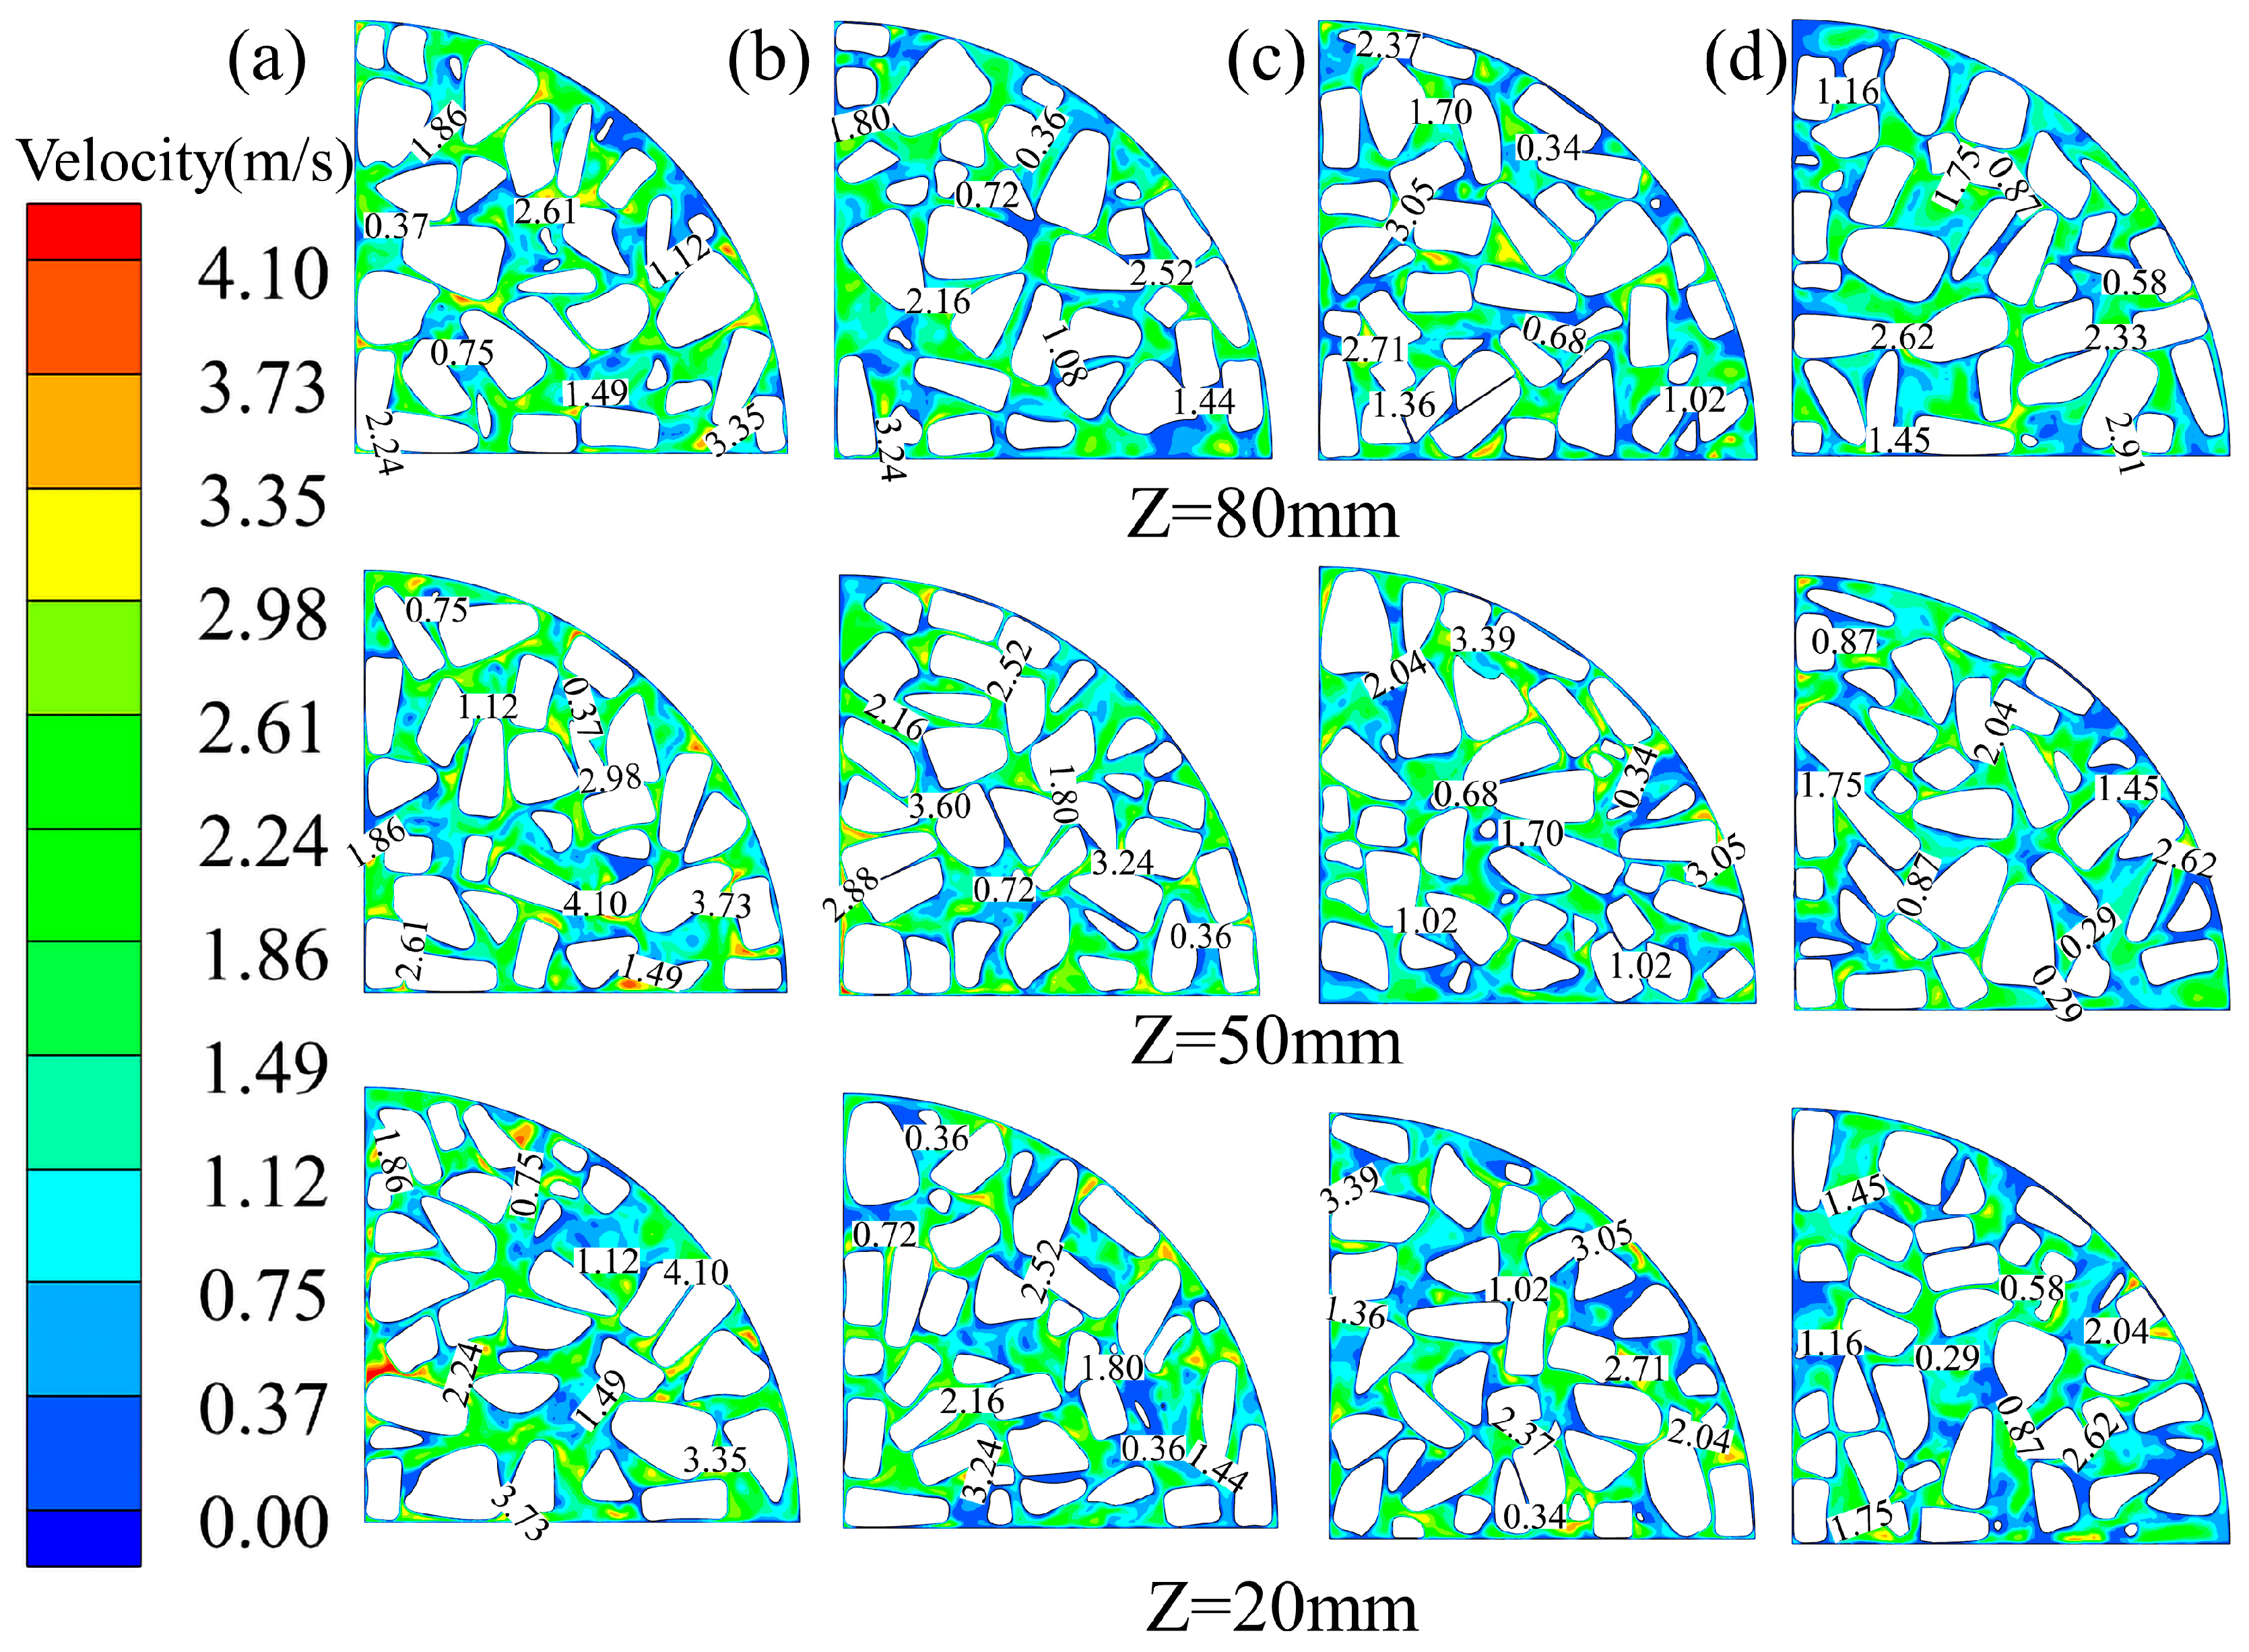
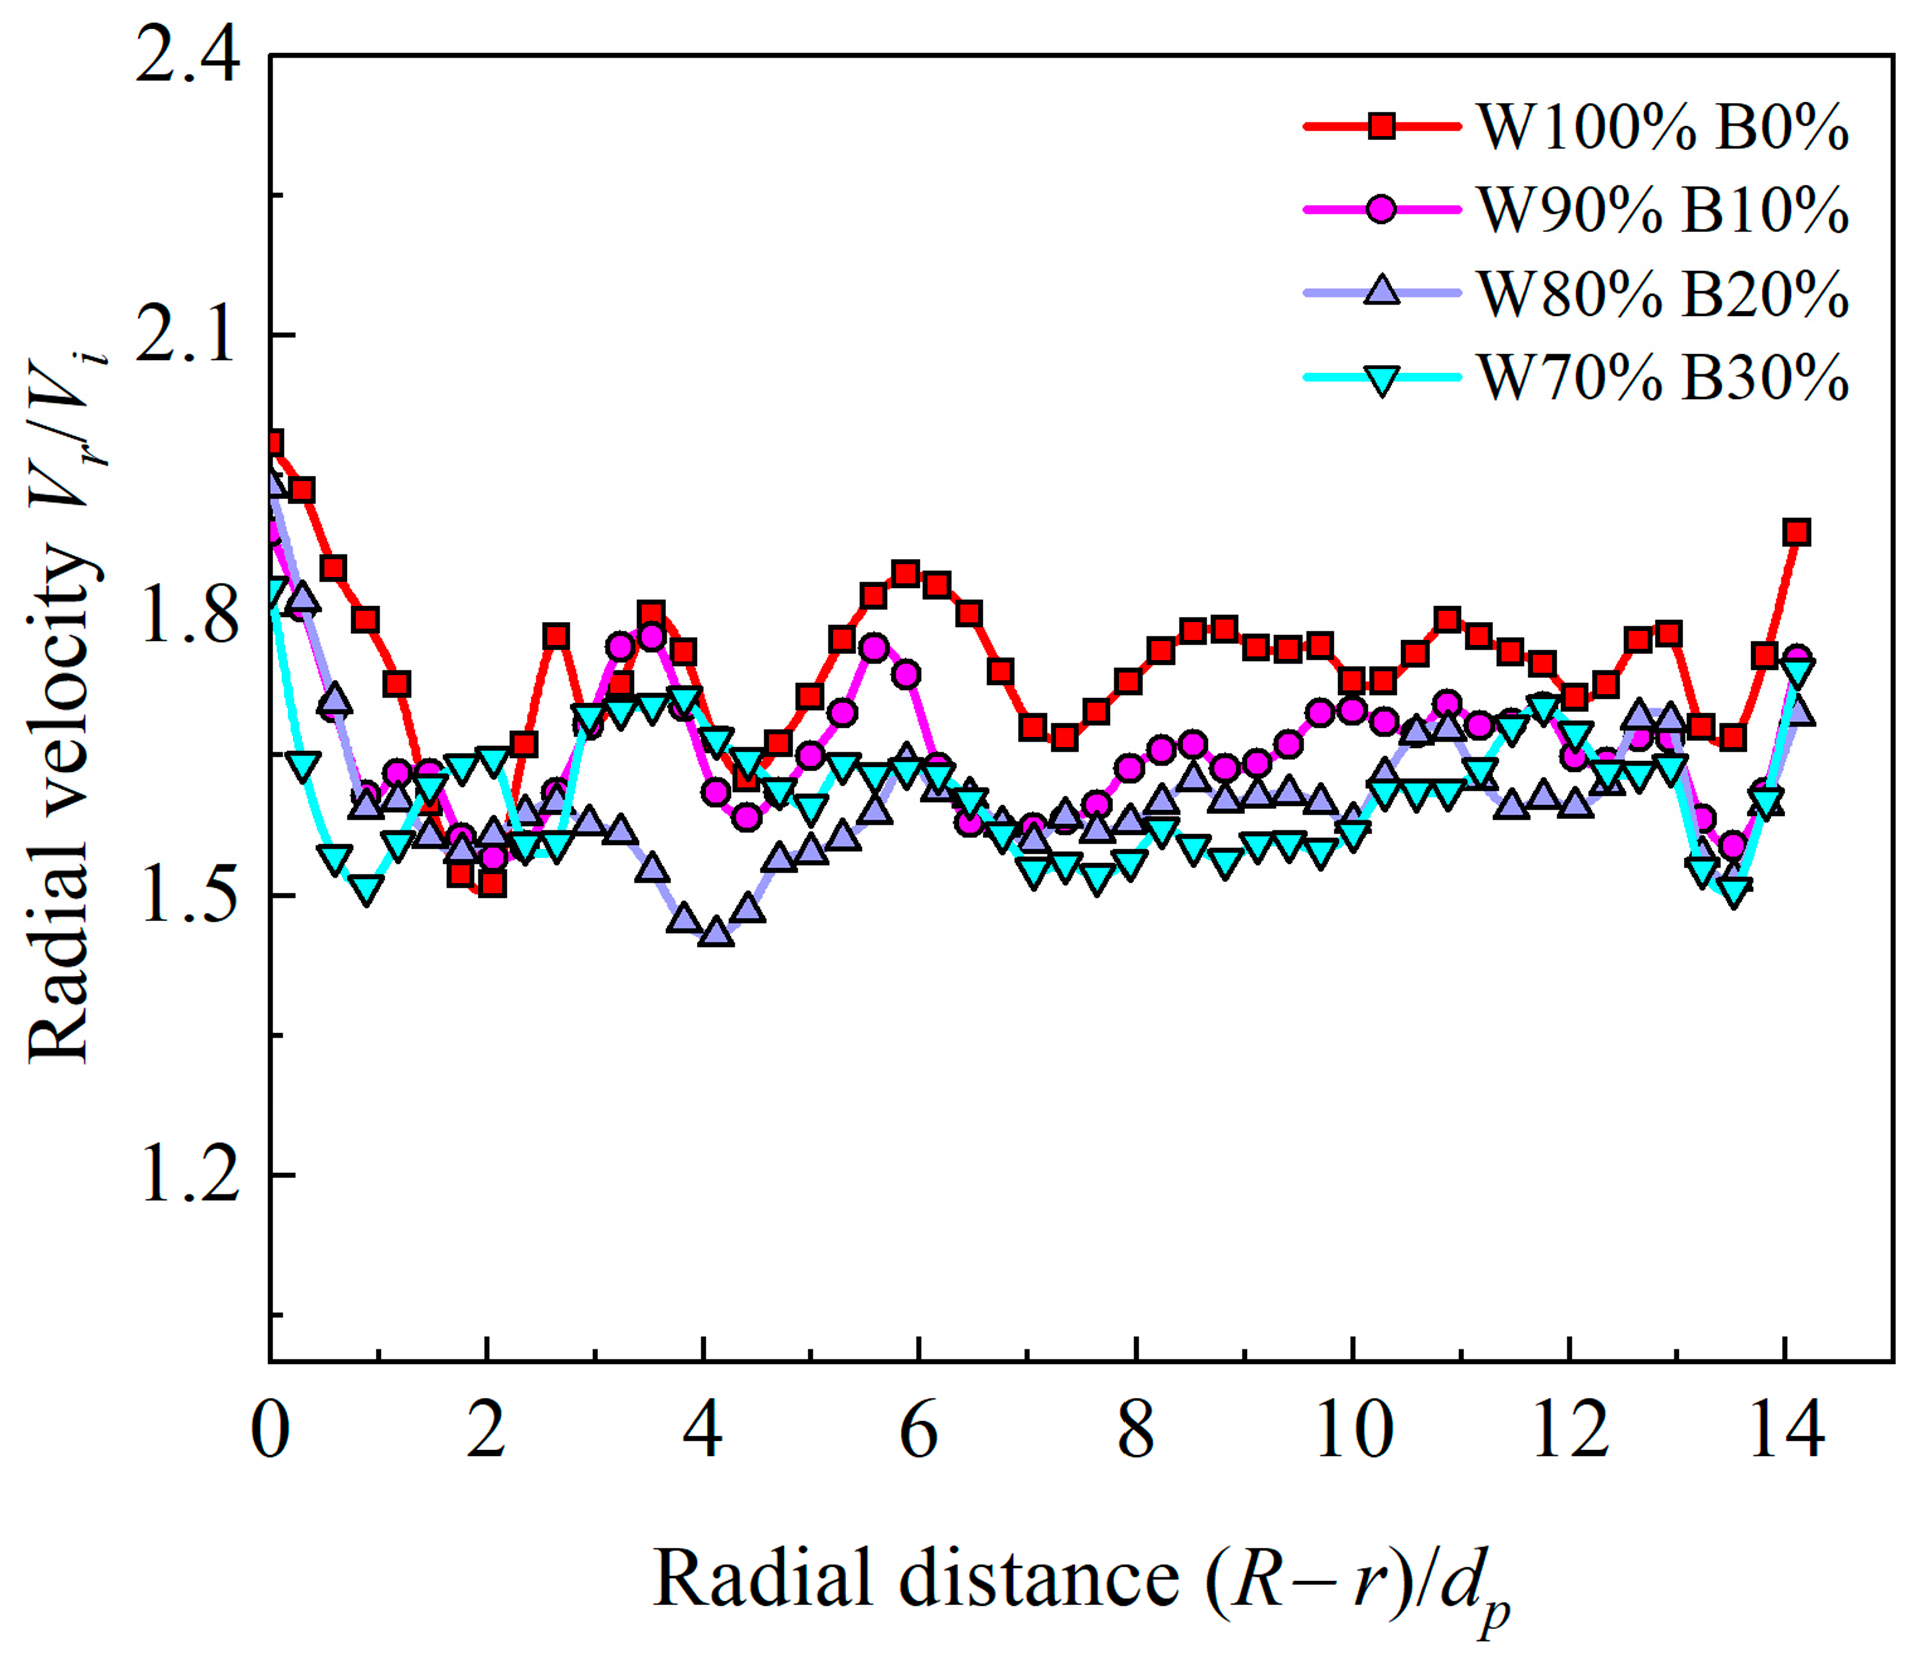
4.3. Velocity Distribution

The airflow velocity distribution within a fixed bed is a critical factor influencing the heat and mass transfer efficiency of the grains. The inlet velocity V0 = 0.5 m/s was selected to investigate velocity fields in different fixed beds. Figure 11 illustrates velocity distribution at plane z = 20 mm, 50 mm, and 80 mm for corn fixed beds with varying levels of broken kernel content. The intricate shape of corn grains contributes to increased randomness in their arrangement, and the presence of irregularly arranged grains with angular orientations or sharp edges leads to more tortuous airflow paths, resulting in an uneven distribution of velocities along the axial direction of the fixed bed. This non-uniformity diminishes as the proportion of broken kernels increases. This can be attributed to the fact that some broken particles fill the gaps between whole grains, making the pore structure of the fixed bed more uniform and reducing the interconnected pathways for airflow, thus improving the uniformity of the velocity distribution within the fixed bed. Simultaneously, the fluid is forced to pass through numerous small pores and channels within the fixed bed, leading to a decrease in overall fluid velocity [45].
The velocity distribution on the Y = X plane of different fixed beds is depicted in Figure 12. The central and wall regions of the fixed bed without broken kernels (0% content) exhibit significantly higher velocities compared to fixed beds with broken kernels. As the proportion of broken kernels increases, the velocity throughout the bed decreases. This decrease in velocity can be attributed to the relatively higher porosity in the contact region between the particles and the wall as well as the interstitial spaces formed between the whole grains. These areas exhibit higher flow rates. Perturbations caused by corn particles generate vortex flows within the bed, leading to a noticeable reduction in velocity, with the occurrence of flow recirculation and stagnation regions at the top of the grain bed [37].
To provide a comprehensive comparison of velocity distribution within fixed beds, the radial distribution of dimensionless average velocity (V(r)/V0) for different fixed bed configurations is illustrated in Figure 13. The horizontal axis represents the radial dimensionless distance from the wall, facilitating comparison with the porosity distribution, while the vertical axis represents the dimensionless ratio of the radial sectional average velocity to the inlet velocity. The radial dimensionless velocity exhibits similar periodic oscillations as the porosity distribution. The velocity is notably higher near the fixed bed wall, and as the proportion of broken kernels increases, the local maximum velocity gradually decreases to 1.98, 1.93, 1.88, and 1.82 times higher than the inlet velocity. Fluctuations become smoother with increasing broken kernel content. The average velocity decreases with increasing broken kernel content. Under conditions of 0%, 10%, 20%, and 30% broken kernel content, the average flow velocities are 0.85 m/s, 0.83 m/s, 0.79 m/s, and 0.75 m/s, respectively. Figure 14 presents the axial distribution of dimensionless average velocity (V(z)/V0) and porosity for different fixed bed configurations. The horizontal axis represents the dimensionless axial distance from the wall. It can be observed that the axial dimensionless velocity follows a pattern similar to the radial dimensionless velocity distribution, with the only difference being the opposing trends in velocity magnitude at the two sides. This distinction arises because the contact area between the particles at the bottom in the fixed bed and the Z = 0 plane is relatively large. Specifically, the particle area extracted from the horizontal cross-section exceeds that of the cylindrical radial section. Consequently, the axial average velocity is lower at the inlet and outlet sections. In the vertical direction of the fixed bed, the axial dimensionless velocity also decreases with increasing broken kernel content and exhibits smoother fluctuations, similar to the axial porosity distribution.

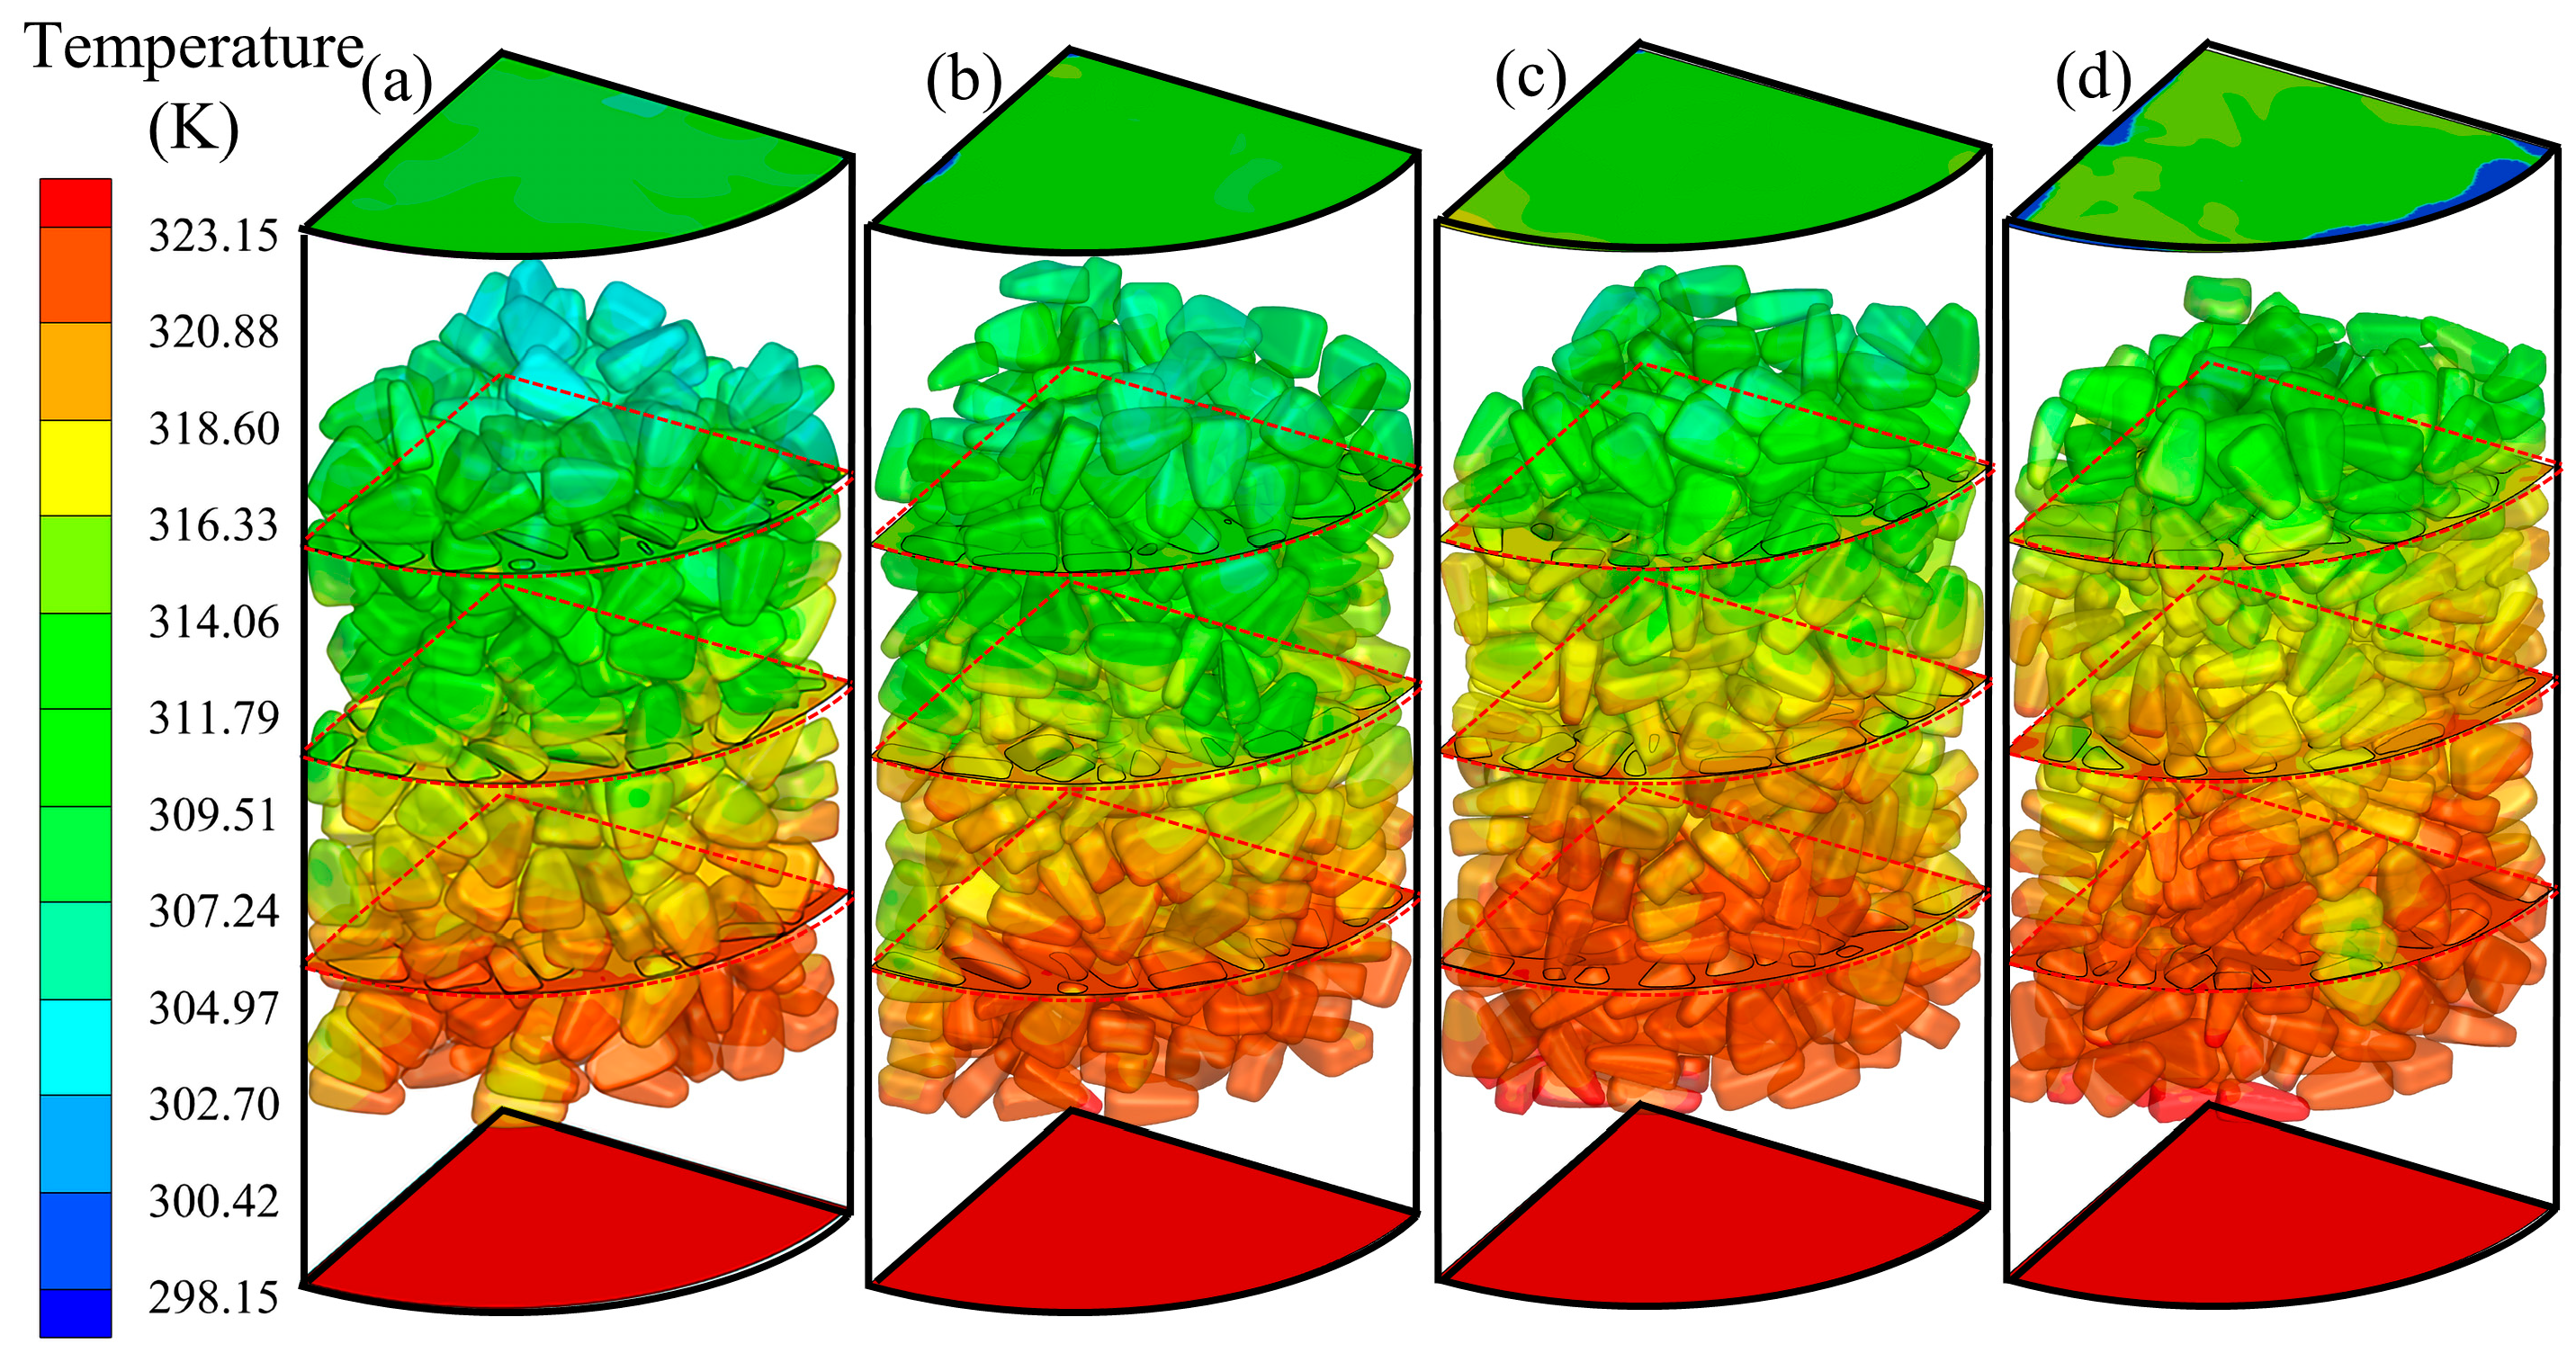
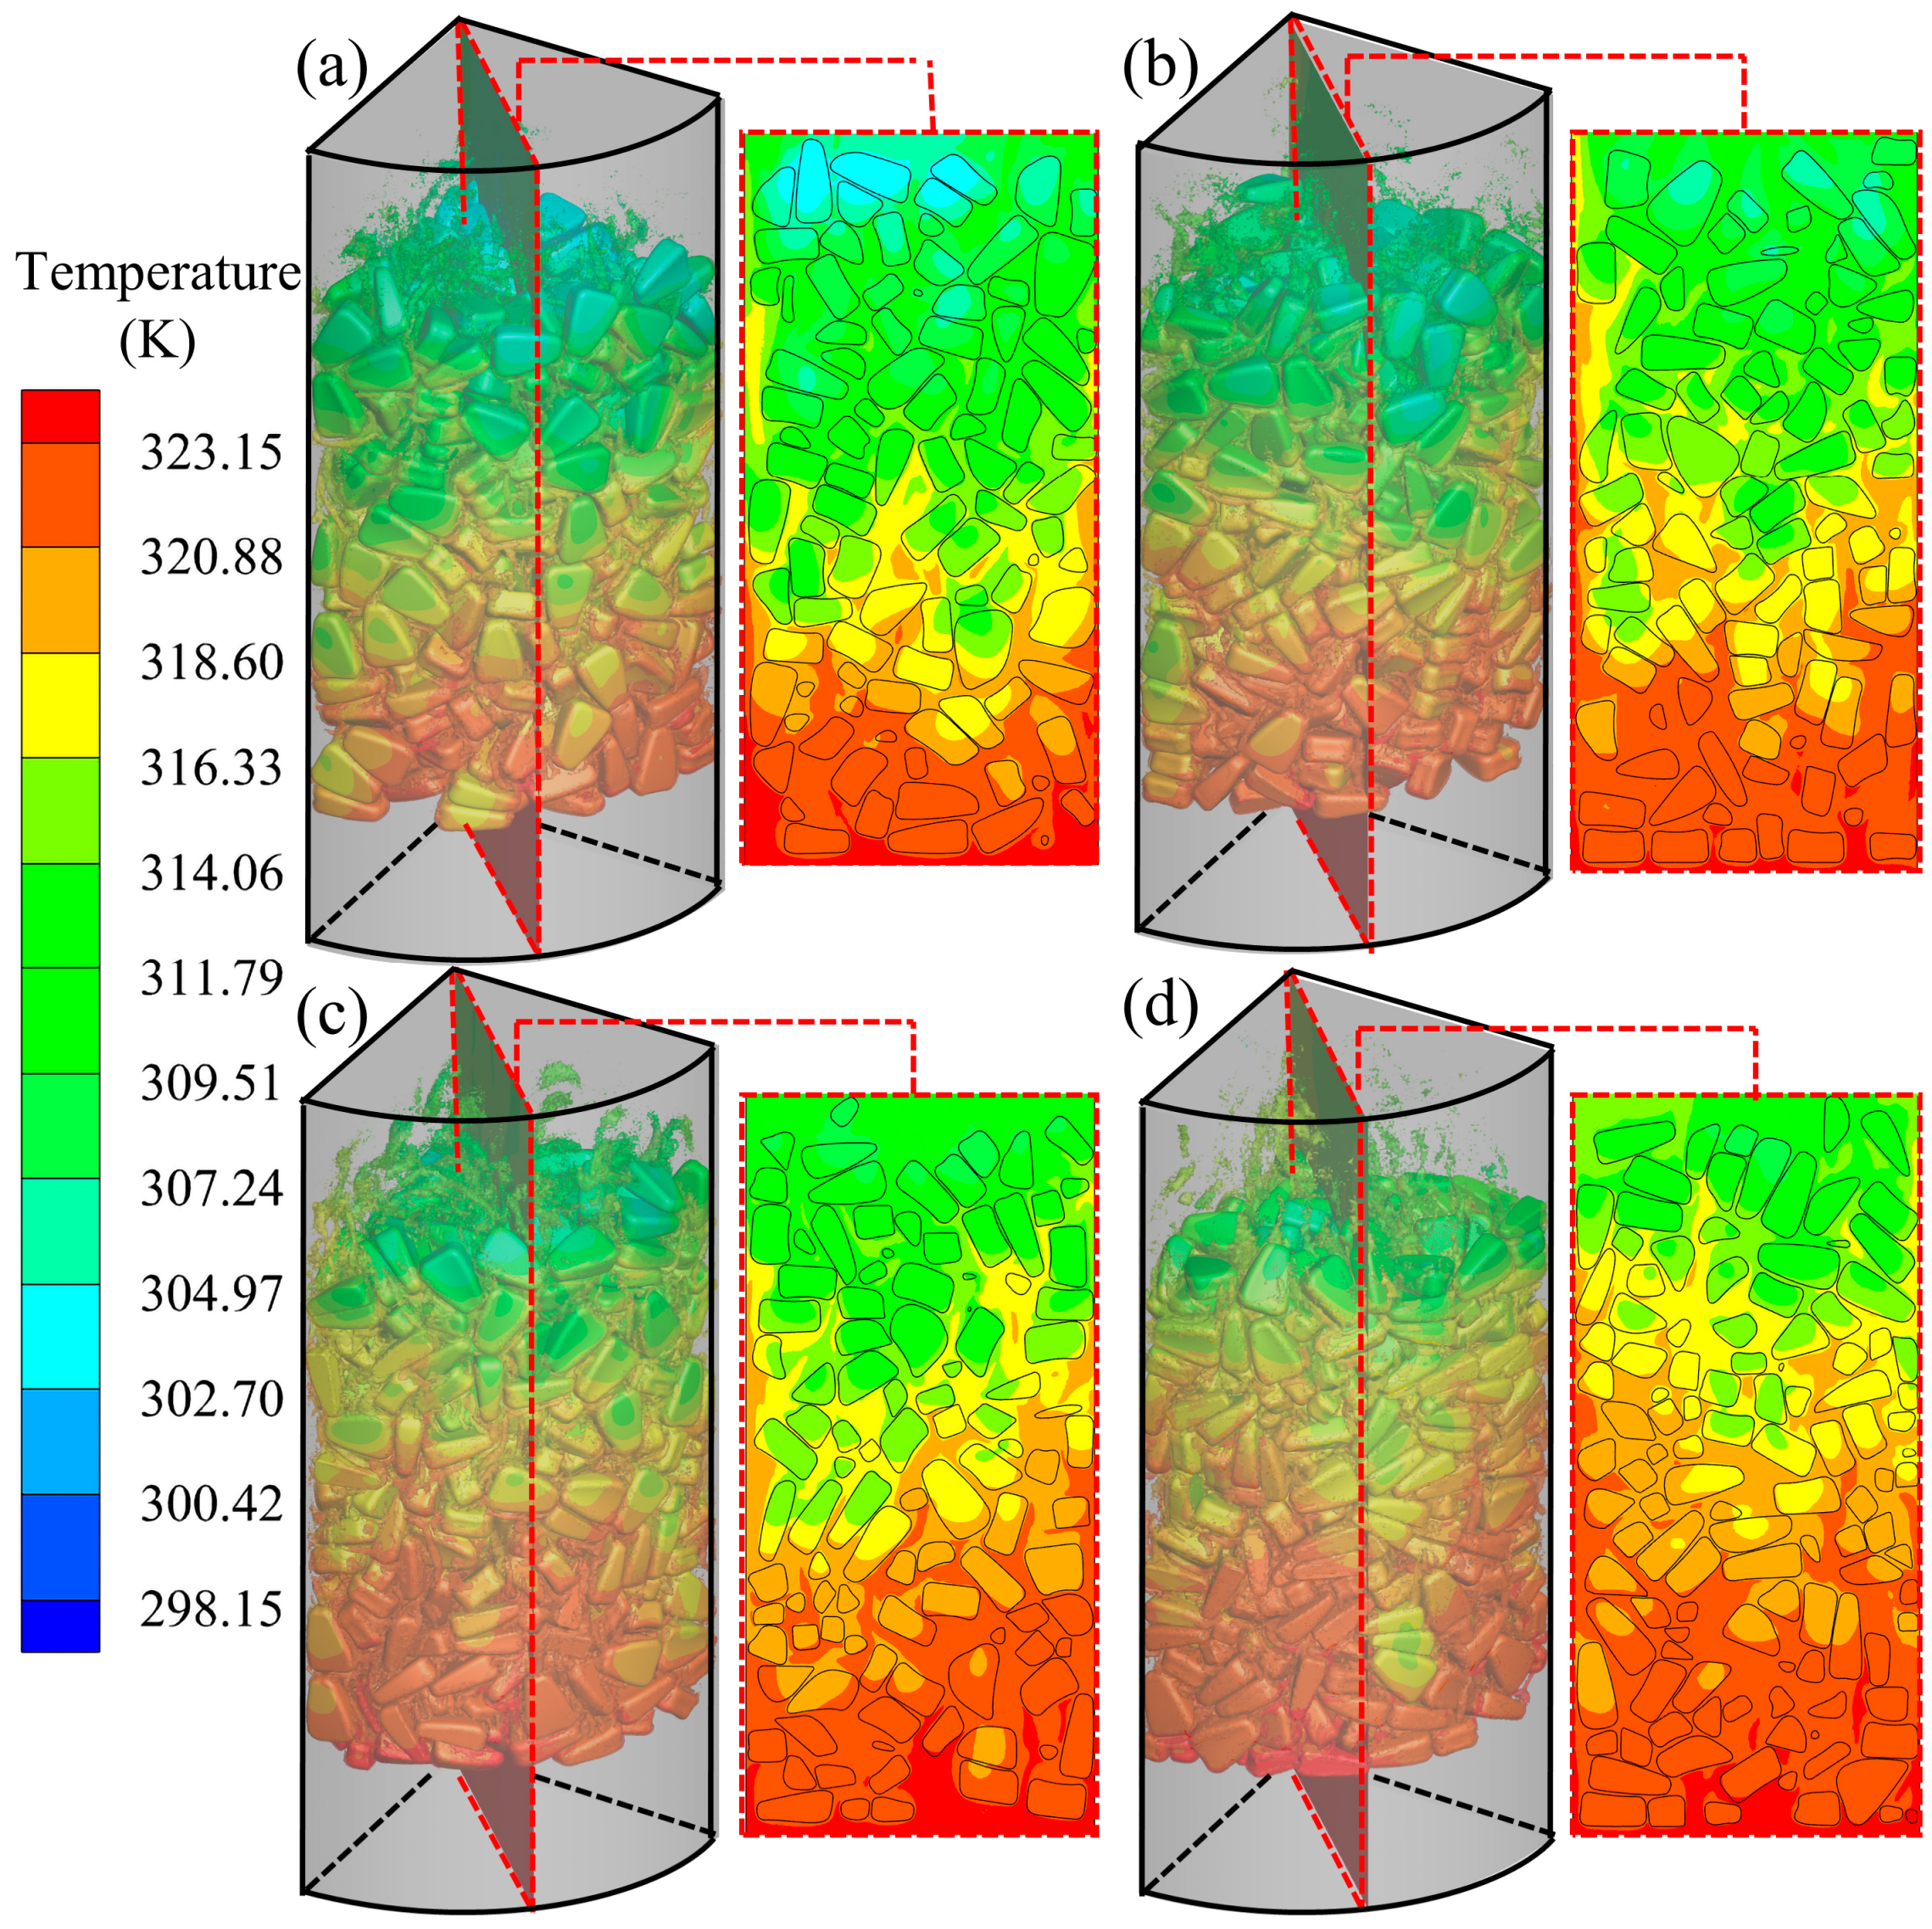
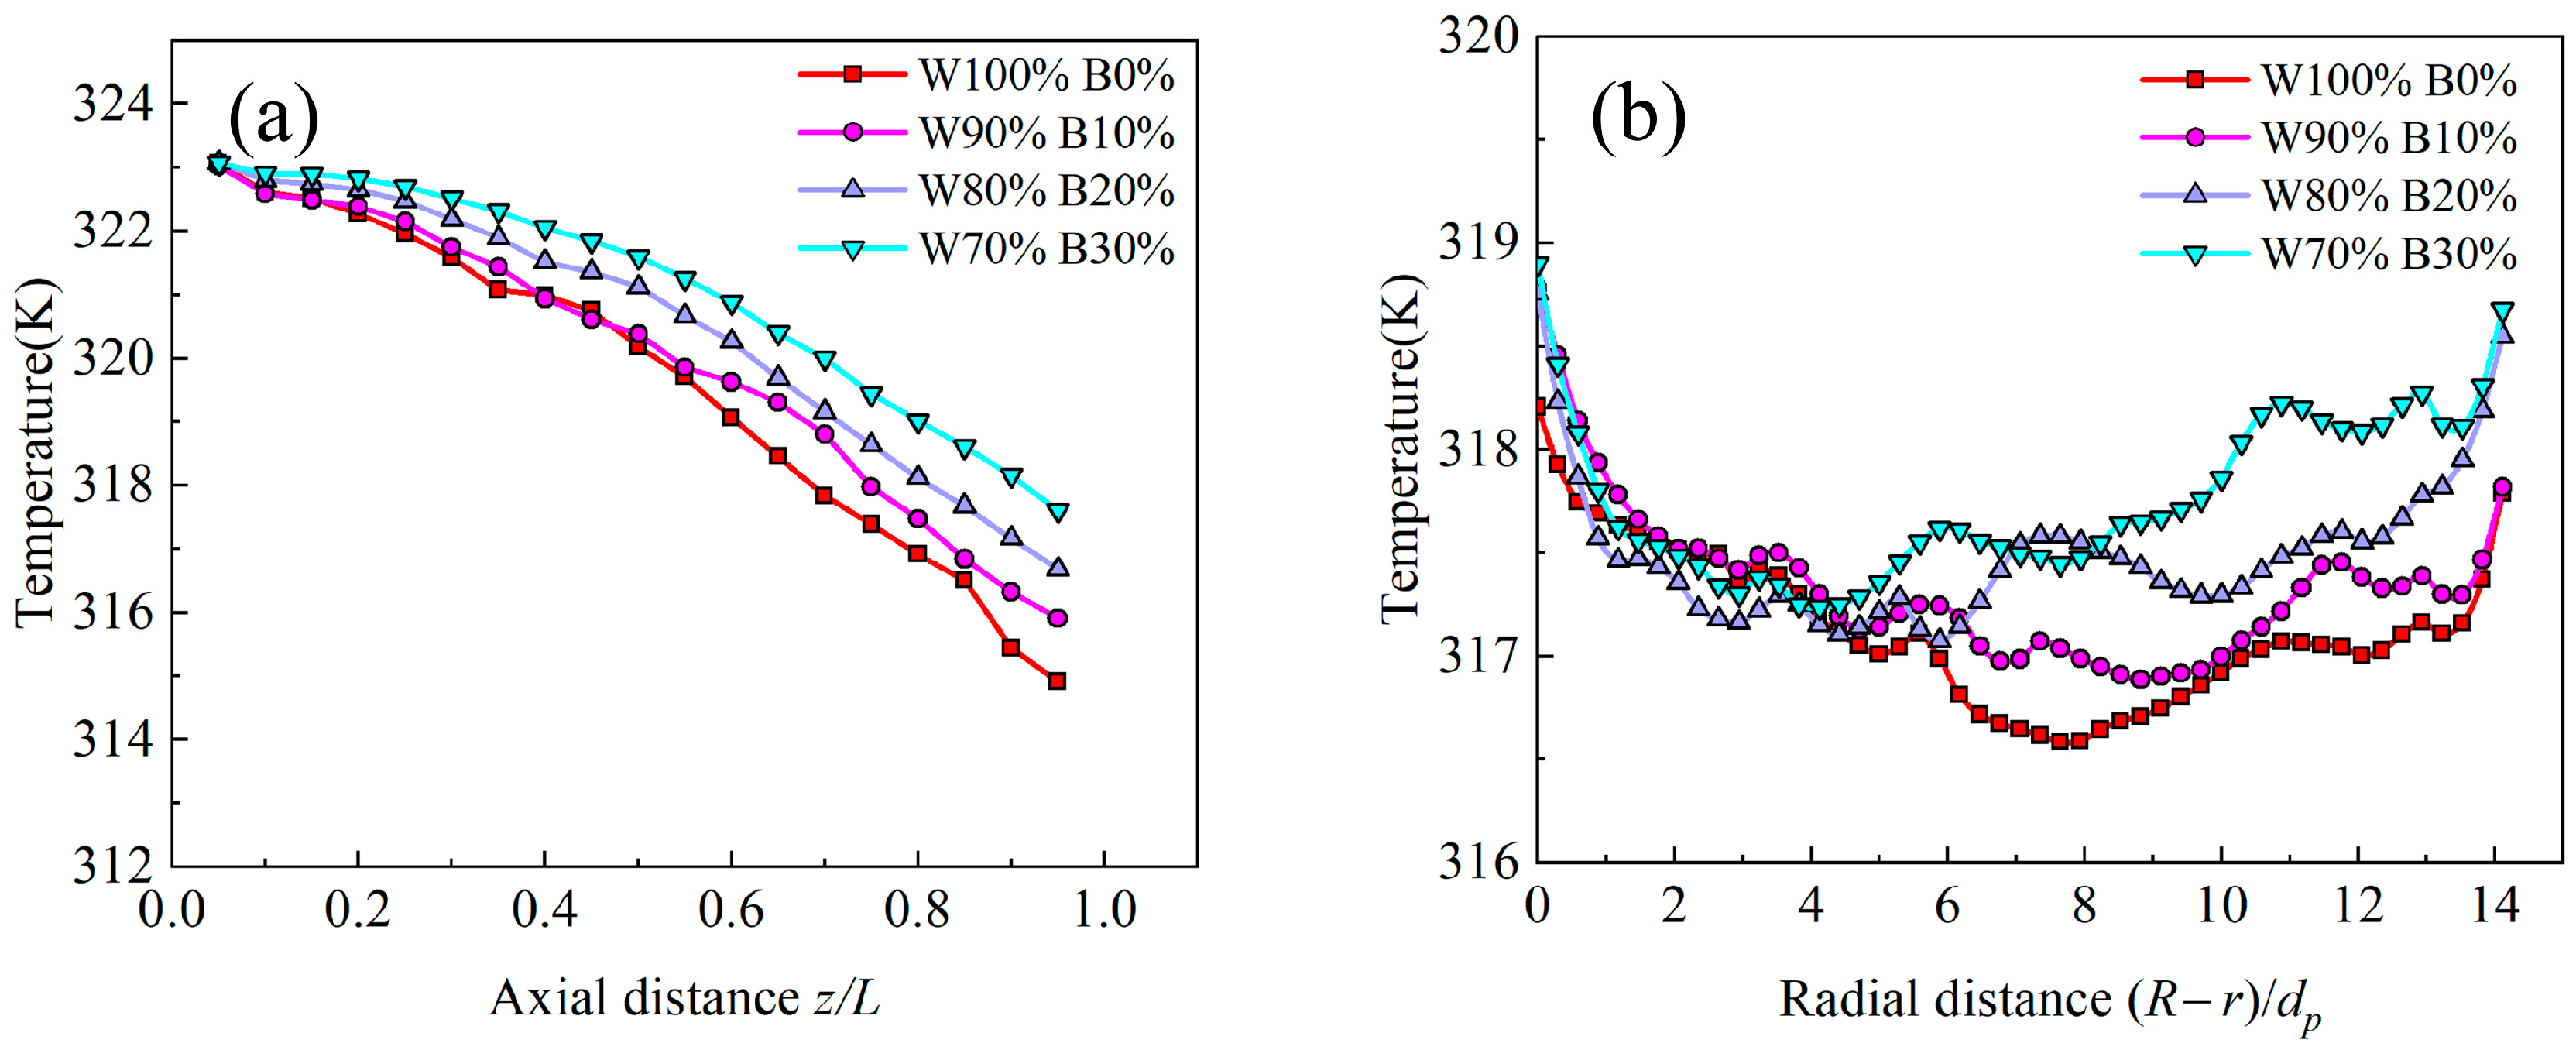
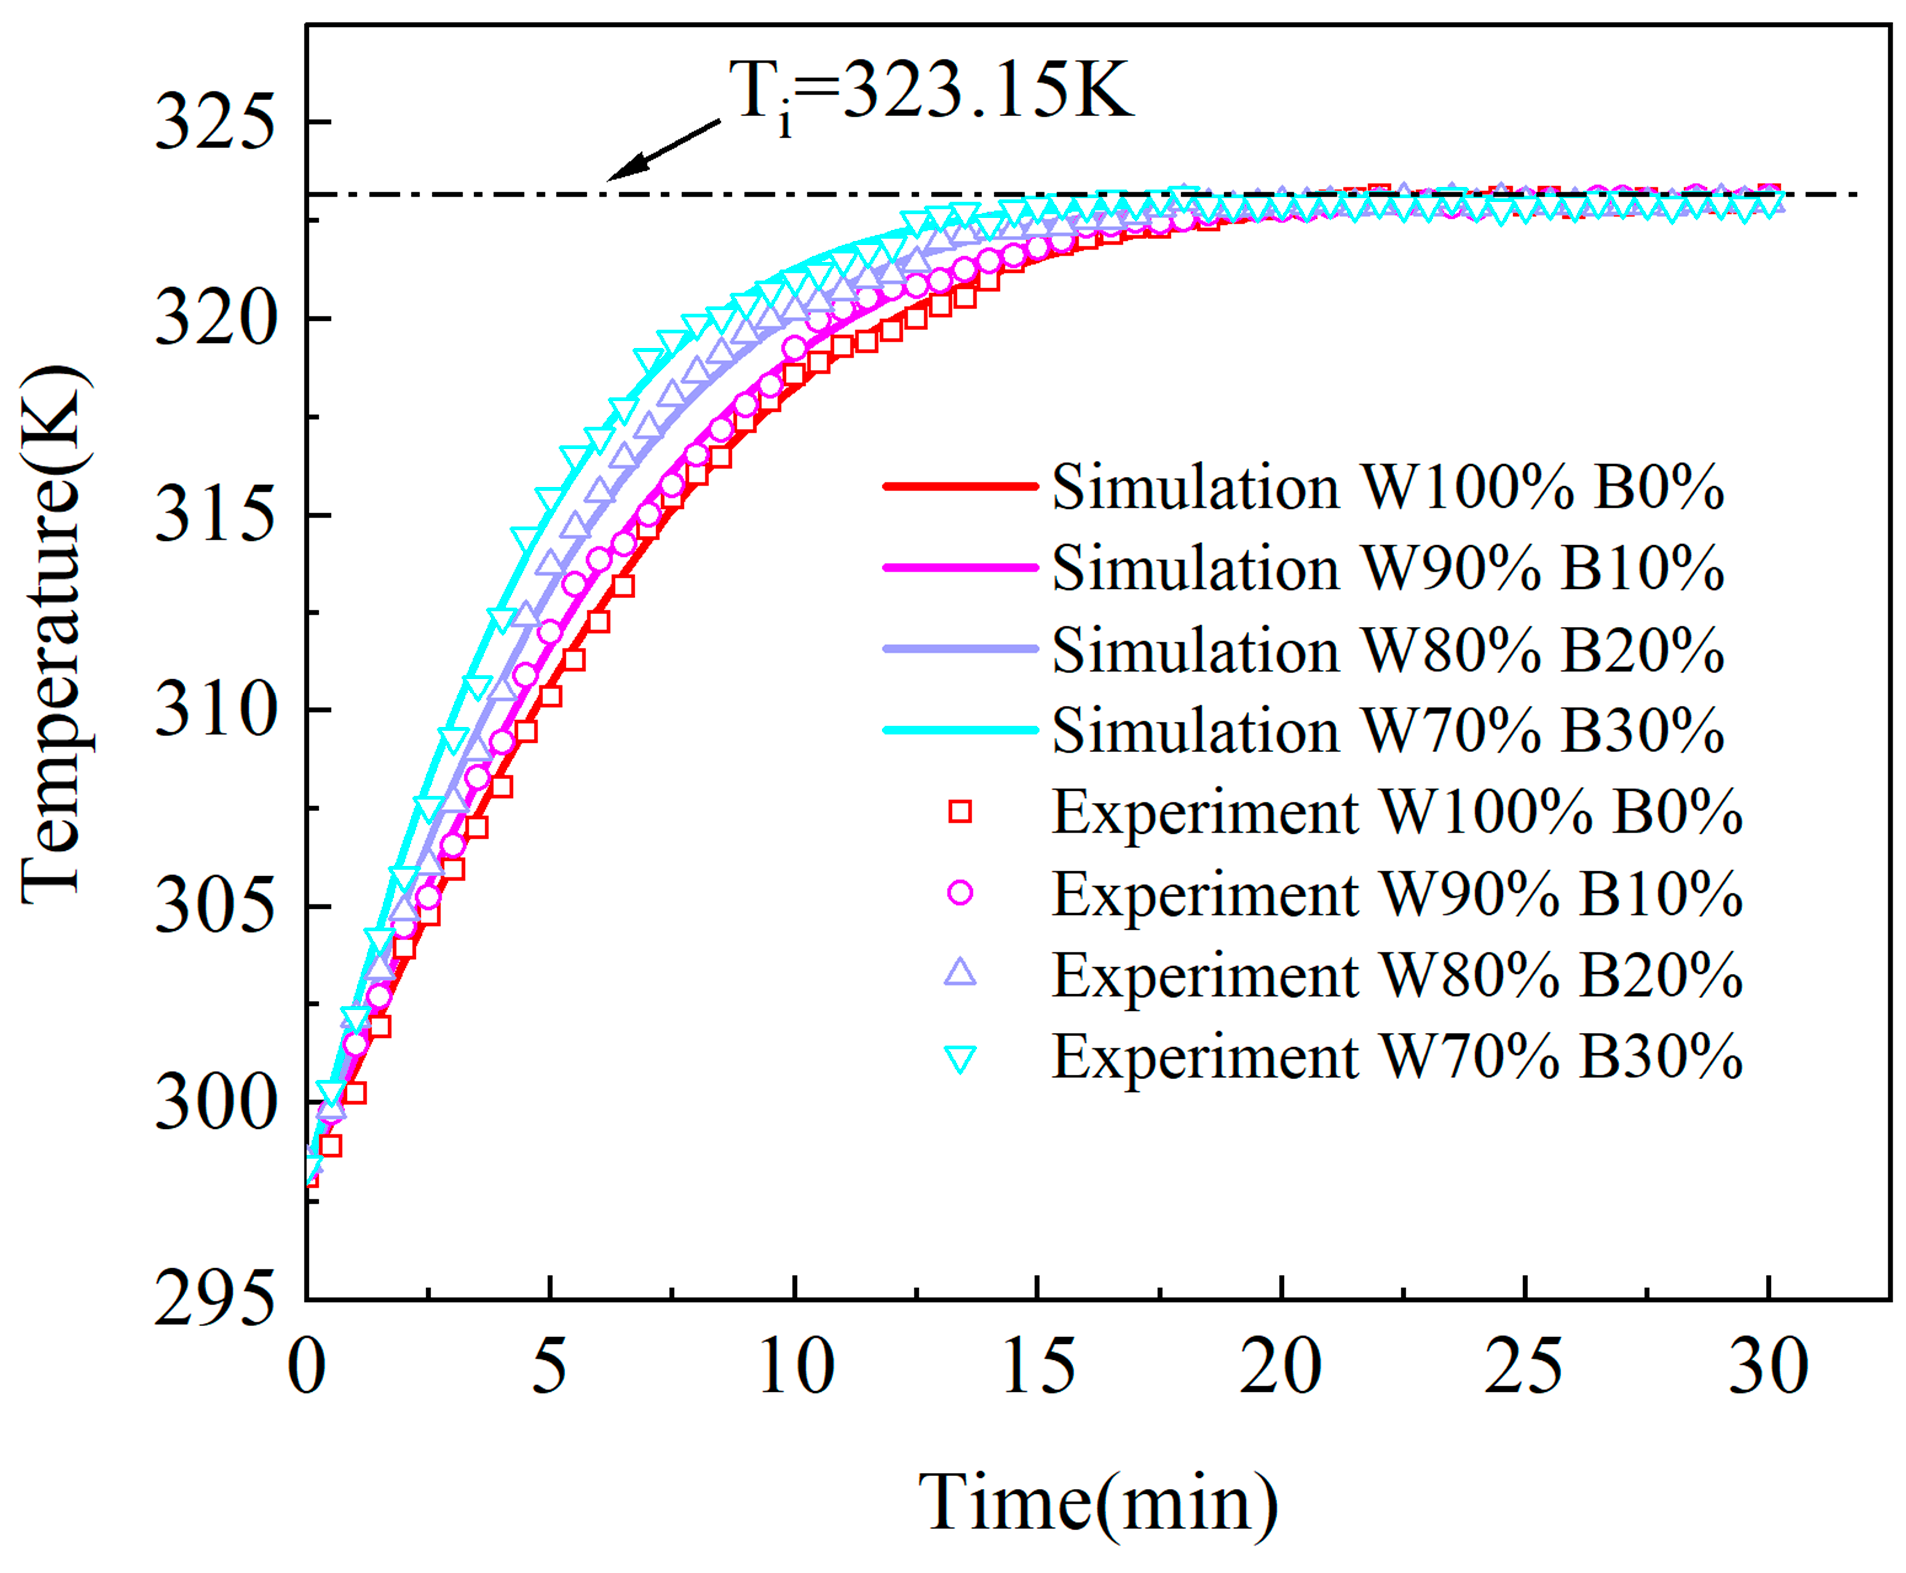
4.4. Temperature Distribution

By selecting an inlet velocity of V0 = 0.5 m/s and a drying temperature of Ti = 328.15 K, we investigated the distribution pattern of temperature fields in fixed beds. The initial temperature of the corn pile was set at 298.15 K. Figure 15 shows the temperature contour at the plane of Z = 20 mm, 50 mm, and 80 mm in fixed beds after 7 min of drying. There is a noticeable stratification of the temperature along the axial direction of the fixed bed, with the bottom of the bed exhibiting higher temperatures compared to the top. The hot air, upon entering the fixed bed, interacts with the particles at the bottom, causing its temperature to increase rapidly. However, in the upper regions of the fixed bed, hot air undergoes heat transfer to the low-temperature particles in addition to complex pore paths, resulting in a slower temperature increase. This leads to a distinct temperature stratification within the bed, characterized by axial temperature gradients. Figure 16 presents the temperature distribution contour map at the Y = X plane after 7 min of drying, considering different levels of broken kernel contents. Along the radial direction within the various fixed bed configurations, there is an uneven distribution of temperature between the fluid and solid particles. This uneven distribution arises from the non-uniform packing structure and fluid velocity distribution, causing the temperature at the wall surface to be higher than in the central region. This corresponds to the position at the higher value of the velocity field.
For further study temperature distribution within the fixed bed, the axial and radial average temperature profiles within the fixed bed were obtained, as shown in Figure 17. Figure 17a illustrates that the maximum axial temperature difference in the fixed bed without broken kernels (0%) is 8.16 K, while the minimum axial temperature difference in the fixed bed with a 30% broken kernel content is 5.47 K. This indicates that the phenomenon of axial temperature stratification decreases with an increase in the broken kernel content. This observation suggests that an increase in broken kernel content can enhance the temperature transfer rate within the particulate fixed bed. The underlying reason is that as the broken kernel content increases, the specific surface area of the particles increases, thus enlarging the contact area between the heat transfer medium and the particles, leading to an enhancement of the heat transfer process [46]. Additionally, the packed bed with higher broken kernel content exhibits more small-scale pores, facilitating the formation of turbulence within the packed bed, thus enhancing the heat transfer rate. Figure 17b shows that the average temperature in the radial direction at the center of the fixed bed increases with an increase in the broken kernel content. This indicates that the fixed bed with a 30% broken kernel content achieves the highest radial heat transfer efficiency, while the non-uniformity of radial temperatures decreases with an increase in the broken kernel content.
The average temperature of the particles in the fixed bed at different times, for different broken kernel contents, is presented in Figure 18. The fixed bed with a 30% broken kernel content exhibits the fastest change in the overall temperature of the corn particles, with the highest rate of temperature increase. It reaches the steady-state phase at an earlier stage. Once again, this phenomenon highlights the fact that an increase in broken kernel content can enhance the temperature transfer rate within the particle-fixed bed. In the fixed bed without any broken kernels (0% content), the smaller specific surface area of the particles leads to an increase in thermal resistance at the heat transfer interface, subsequently reducing the overall heat transfer rate. The PRCFD simulation results align well with the experimental data, demonstrating good agreement. The PRCFD model integrates both convective heat transfer in the fluid phase and thermal diffusion in the solid phase, without simplifying any specific models or heat transfer mechanisms. Furthermore, it accurately captures the realistic pore structure within the particles, which gives an excellent correlation between the calculated and experimental data [37].
In this study, the heat transfer coefficient, Nusser number, heat transfer power, and total energy are used to fully characterize the heat transfer characteristics of the fixed bed. Figure 19 illustrates the characteristic parameters of the transient heat transfer for different drying stages of the fixed bed. With increasing drying time, the heat transfer coefficient, Nusser number, and heat transfer power initially increase rapidly to reach their peak values before gradually decreasing, while the total heat increases with time. The former can be attributed to the fact that it takes a certain amount of time for the hot air to pass through the packed section. As the hot air medium comes into sufficient contact with the grain particles, the heat transfer coefficient, Nusser number, and heat storage power gradually increase until the hot air and grain particles are in complete contact, corresponding to the peak parameter values. Subsequently, as the temperature difference between the grain particles and the hot air decreases, the parameter values gradually decrease until they reach zero [47]. When comparing the heat transfer coefficient, Nusser number, and heating power of fixed beds with different broken kernel contents, it can be observed that under conditions of 0%, 10%, 20%, and 30% broken kernel contents, the maximum heat transfer coefficients of the fixed bed are 50.34 W/(m2∙K), 52.71 W/(m2∙K), 54.50 W/(m2∙K), and 59.72 W/(m2∙K), respectively. The corresponding peak Nu values are 14.52, 15.28, 15.56, and 17.31, while the peak heating transfer powers are 18.52 W, 21.75 W, 23.93 W, and 25.86 W. The transient heat transfer characteristic parameters of the fixed bed during drying increase with an increase in broken kernel content.

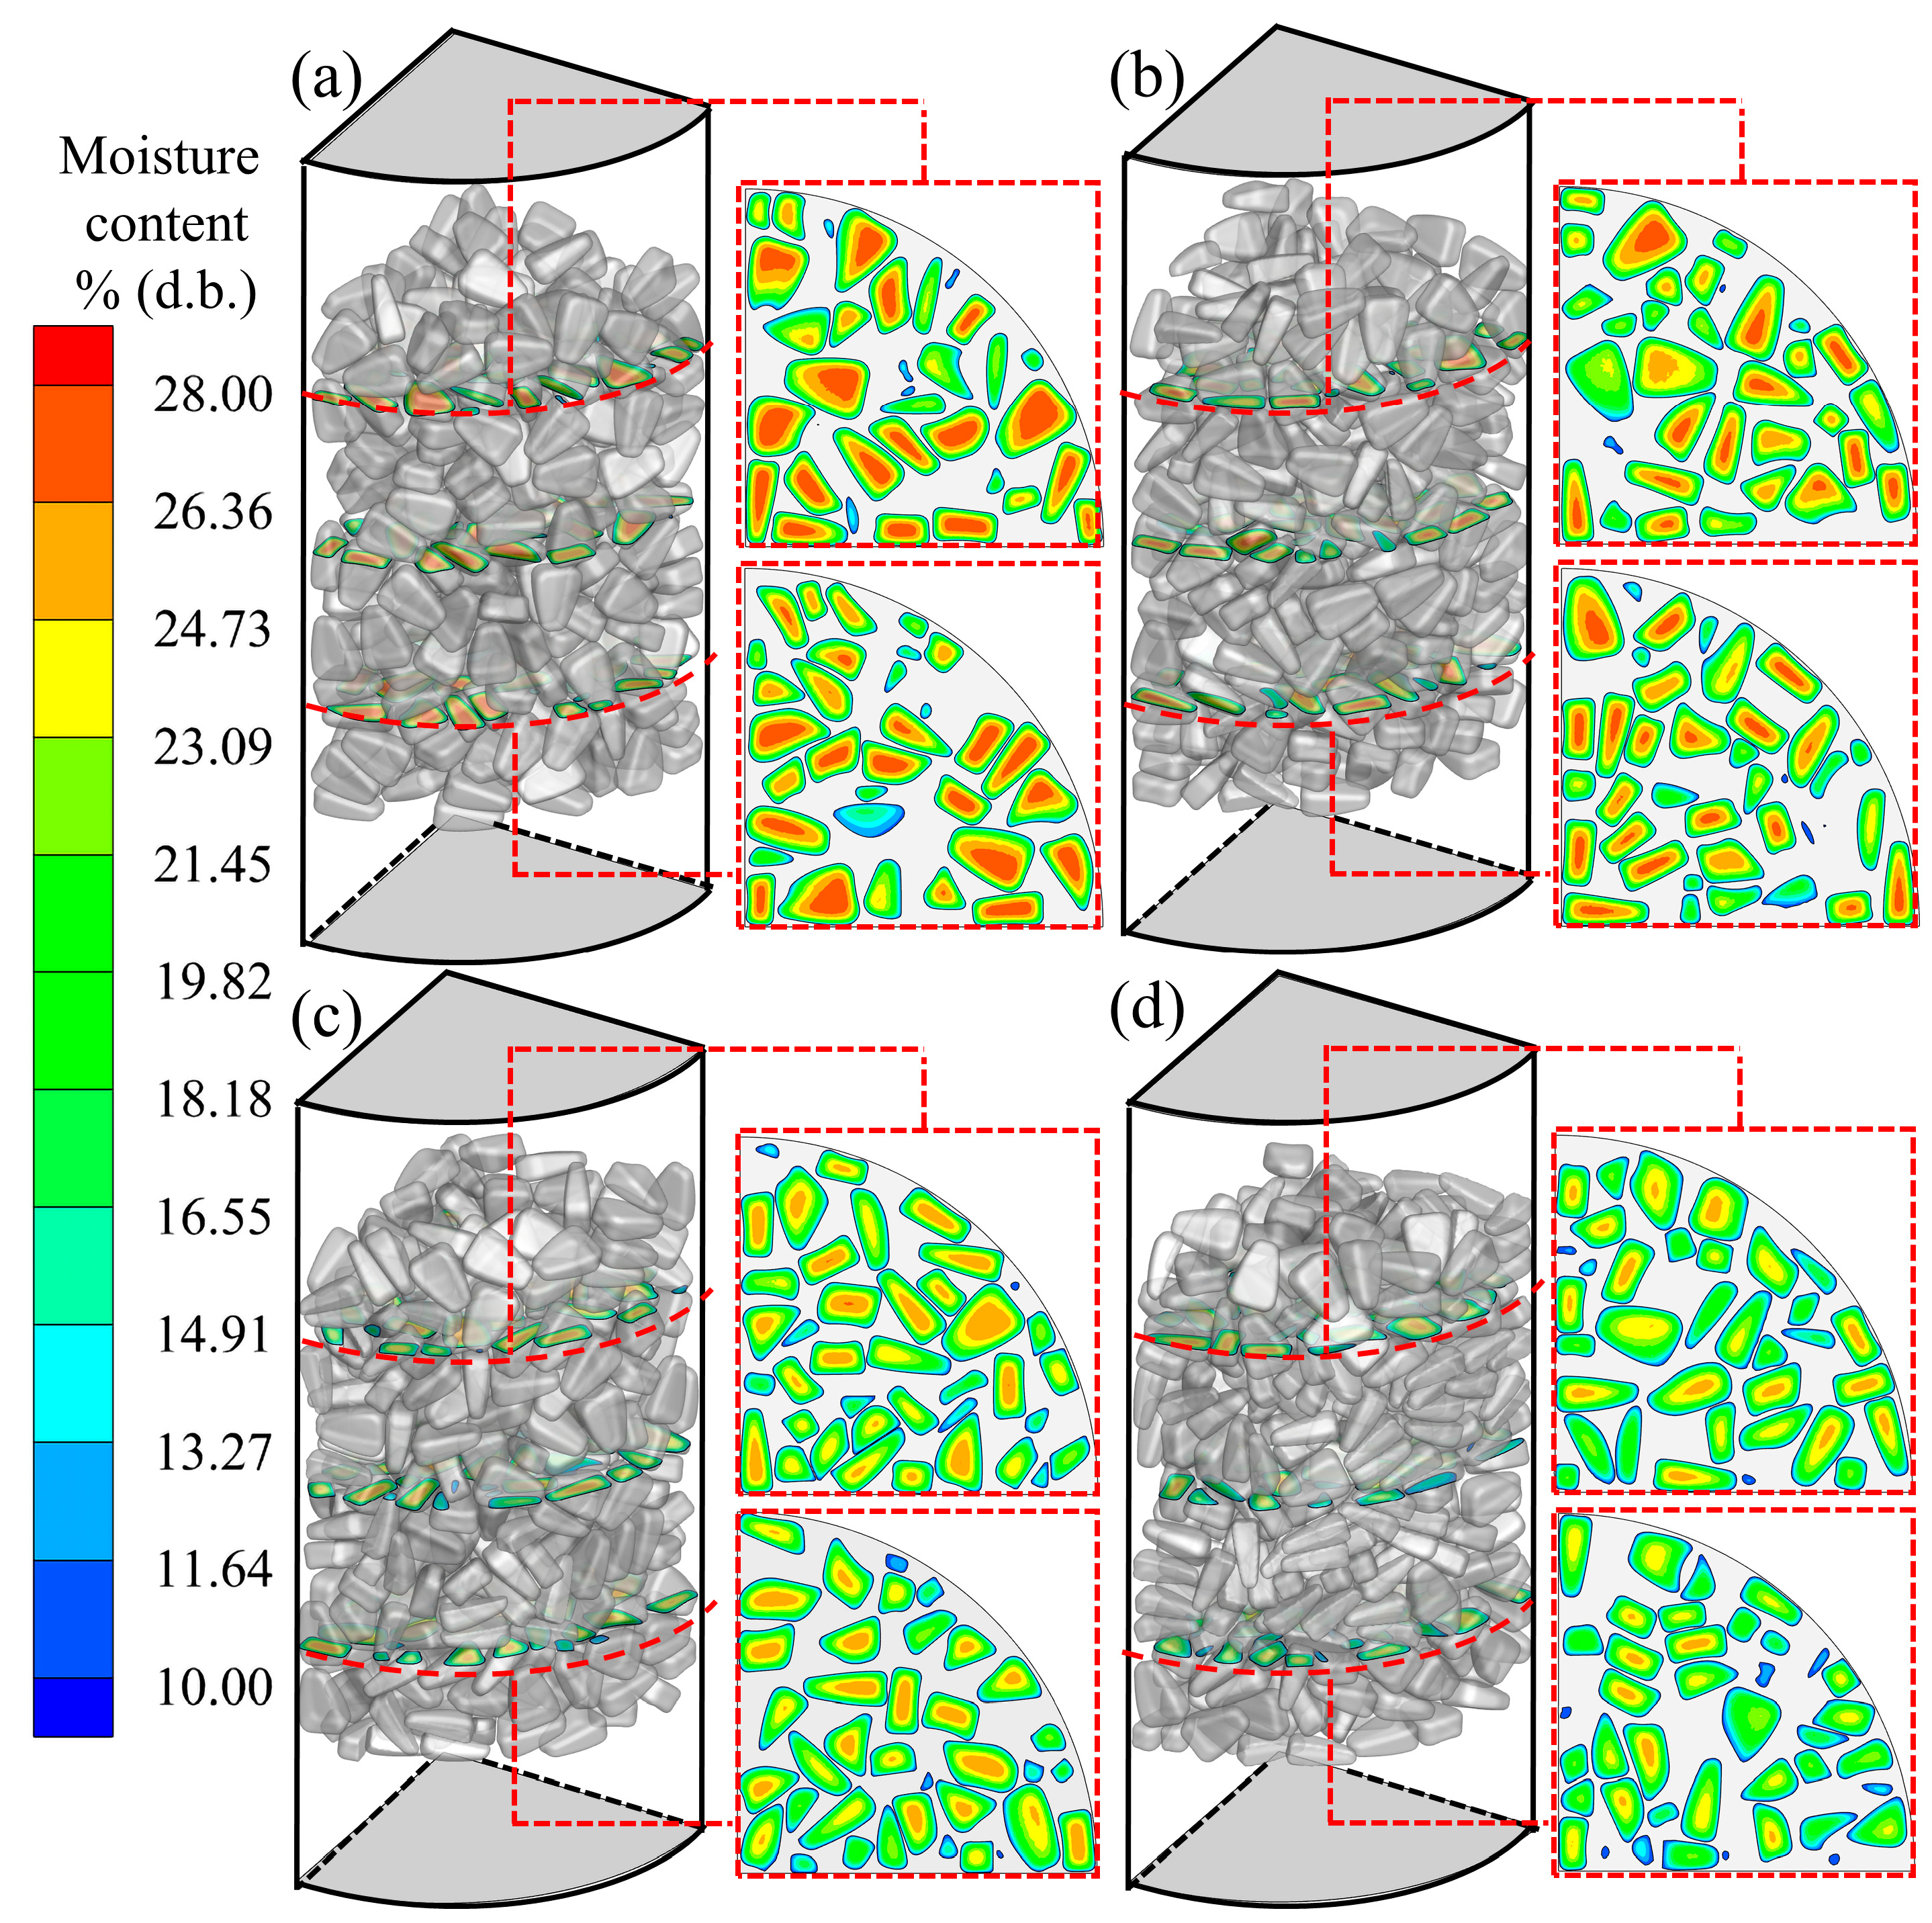
4.5. Moisture Distribution

The investigation focuses on the moisture distribution patterns in different fixed beds by selecting an inlet velocity of V0 = 0.5 m/s and a ventilation temperature of Ti = 328.15 K. Figure 20 illustrates the moisture distribution at different times at the Y = X plane. During the drying process, in contrast to the heat transfer process, moisture is transferred from the interior to the surface of the corn grains. Convection mass transfer near the surface of the grains is evident, while moisture migration and diffusion become relatively slower towards the central region. As a result, a moisture gradient forms within the grains, and even after 2 h of drying, the corn in the fixed bed remains in a high-moisture state. After 6 h of drying, it is noticeable that the moisture in the fixed bed with 30% broken kernels is significantly lower than in the bed without broken kernels (0%), indicating that the moisture transfer rate in the fixed bed increases with the broken kernel content. This can be attributed to the increased mass transfer surface area due to the addition of broken kernels, providing more interfaces for mass transfer and facilitating the interaction between the mass transfer medium and the particles. Furthermore, small intergranular pores offer more pathways for mass transfer, allowing the mass transfer medium to penetrate and diffuse into the particle interiors more easily, thereby further enhancing the mass transfer rate [46]. Figure 21 illustrates the moisture distribution at different heights, Z = 20 mm, and 80 mm, inside the fixed bed after 6 h of drying. The uniformity of axial drying within the fixed bed is quite good, with a reduction in moisture gradients within the corn particles as the drying time increases. Similarly to temperature gradients, the moisture gradient is greater in the radial direction than in the axial direction.
The variation in the overall average moisture content of the particles in different fixed beds with varying broken kernel content is shown in Figure 22. It is evident that when the broken kernel content reaches 30%, the overall moisture content of the corn particles changes at the fastest rate, exhibiting the highest moisture transfer rate and reaching the safe moisture content first. In the case of drying in fixed beds without broken kernels (0%), it takes approximately 560 min to reduce the moisture content of the corn pile to 14% (d.b.). However, with broken kernel contents of 10%, 20%, and 30%, the required time decreases by 60 min, 100 min, and 130 min, respectively. This phenomenon further reinforces the notion that an increase in broken kernel content enhances the moisture transfer rate in fixed beds. In fixed beds without broken kernels (0%), the relatively smaller surface area of the particles results in a reduced contact area with the mass transfer interface and the hot air, consequently lowering the moisture transfer rate. The results of the PRCFD simulation align well with the experimental data, since the PRCFD model accounts for the interactions between particles and the fluid medium, considering both the relative flow mass transfer and solid-phase moisture diffusion processes. Moreover, the model avoids simplification of specific models or diffusion mechanisms and exhibits good agreement between the calculated moisture transfer results and experimental data [37].

5. Conclusions

Using the PRCFD model, the thermal and mass transfer characteristics in fixed beds of corn with different broken kernel contents were simulated, and the numerical results were compared with experimental data to derive the following research conclusions:
(1)
The RBD method can effectively capture the oscillation phenomenon of radial porosity in a fixed bed. Compared to whole grains, a higher content of broken kernels tends to fill the larger pores, resulting in a decrease in local porosity as the broken kernel content increases.
(2)
The increase in the broken kernel content leads to higher curvature in the air-flow paths within the fixed bed, increasing the pressure drop. The PRCFD model takes into account the influence of particle characteristics, providing direct estimates of pressure drop in realistic bed configurations. It agrees well with the experimental results in different bed configurations, with an average error of less than 15%. With an increase in broken kernel content, the velocity within the fixed bed gradually decreases, resulting in smoother fluctuations.
(3)
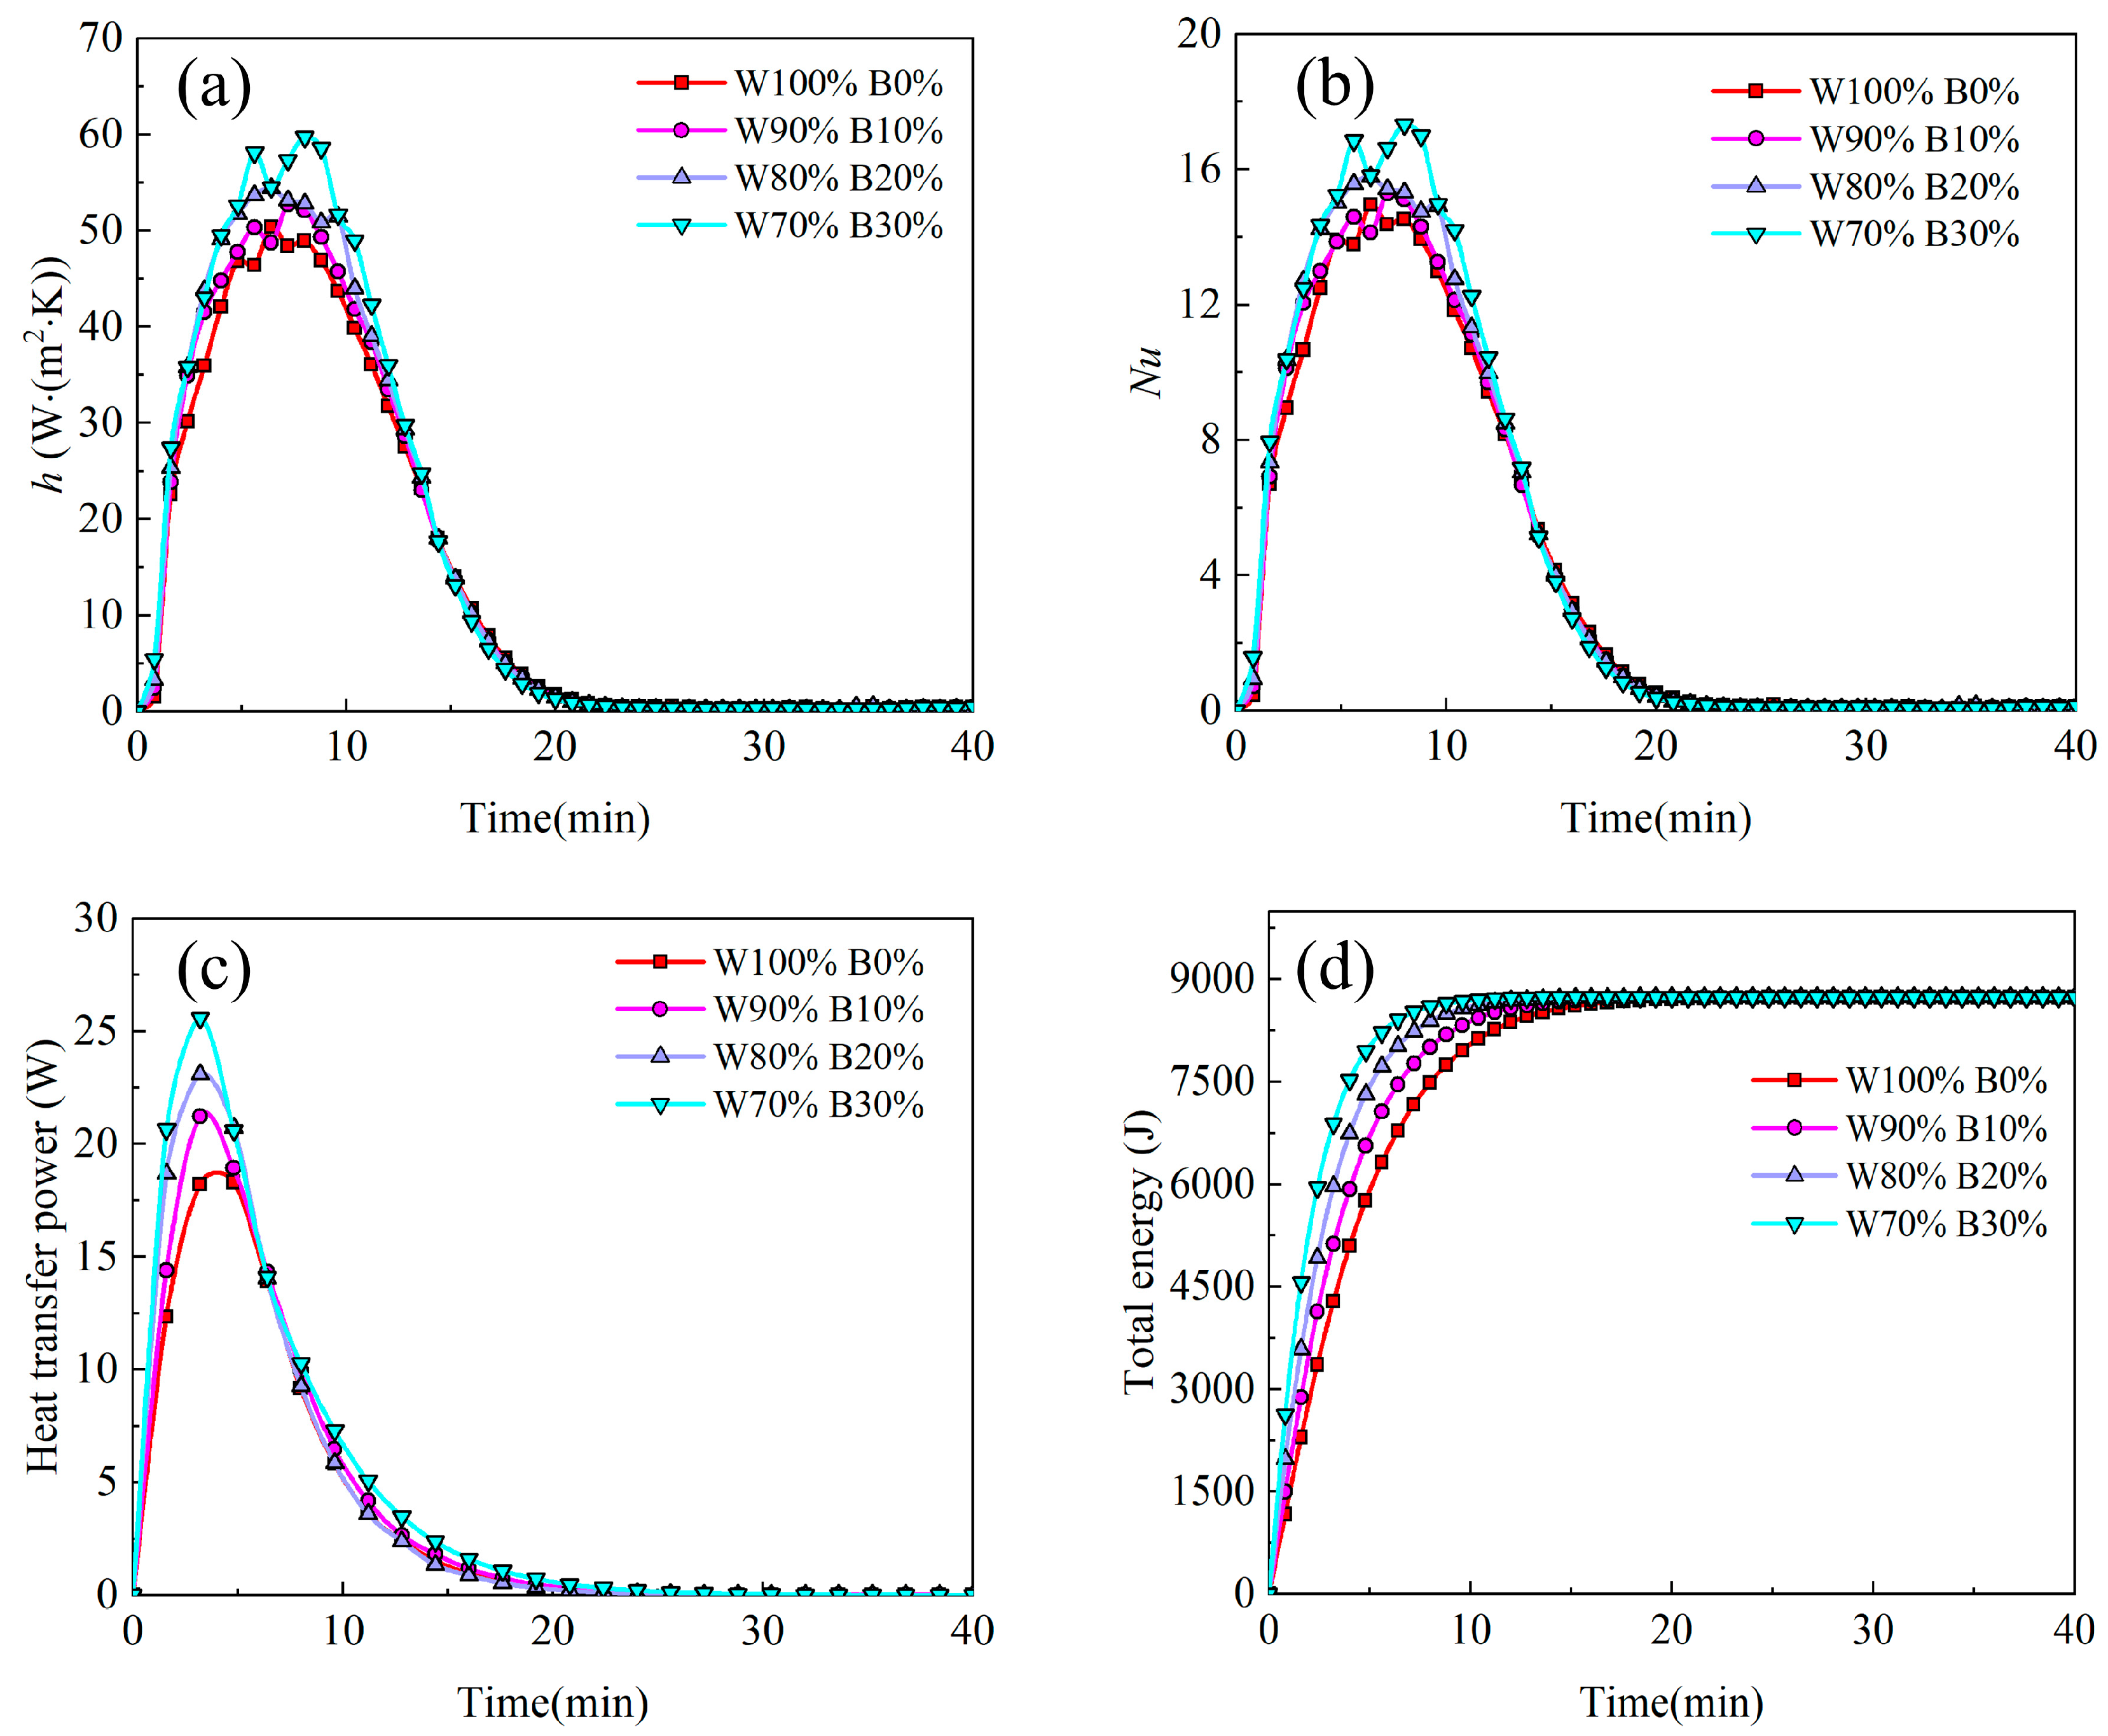
The increase in broken kernel content amplifies the contact area between the particles and the heat transfer medium, thereby enhancing the heat transfer process. The PRCFD model integrates both convective heat transfer in the fluid phase and thermal diffusion in the solid phase, without simplifying any specific models or heat transfer mechanisms, yielding calculation results that align well with experimental data. The characteristic parameters of the transient heat transfer exhibit an increasing trend with increasing broken kernel content.
(4)
The addition of broken kernels increases the surface area for mass transfer, thereby enhancing the rate of moisture transfer in the fixed bed. Compared to the fixed bed without broken kernels (0%), which requires 560 min to dry the corn pile to a safe moisture level of 14% (d.b.), the drying time is reduced by 60 min, 100 min, and 130 min for the respective broken kernel contents of 10%, 20%, and 30%.

Author Contributions

Conceptualization, W.L. and G.C.; methodology, W.L., C.L. and M.G.; software, W.L. and D.Z.; validation, W.L., C.L., and M.G.; formal analysis, W.L. and C.L.; investigation, W.L. and M.G.; resources, G.C. and D.Z.; data curation, W.L. and C.L.; writing—original draft preparation, W.L.; writing—review and editing G.C. and D.Z.; visualization, C.L.; supervision, G.C. and D.Z.; project administration, G.C.; funding acquisition, D.Z. All authors have read and agreed to the published version of the manuscript.

Funding

This research was funded by the joint fund project of Henan Science and Technology R&D Program (grant number 222103810073, 222103810082) and the Open Project of Henan Key Laboratory of Grain and Oil Storage Facility and Safety (grant number 2020KF-A02).

Institutional Review Board Statement

Not applicable.

Data Availability Statement

The data presented in this study are available in the article.

Conflicts of Interest

The authors declare no conflict of interest.

Nomenclature

Apthe area of the particle
Astotal heat transfer surfaces of particles
Aw, Bwthe dimensionless coefficient
cfthe specific heat of the fluid
csthe specific heat of the particle
Dthe diameter of the packing structure
dpthe equivalent diameter of the particle
Dfthe moisture diffusion coefficient of the fluid
Dsthe moisture diffusion coefficient of the particle
Estthe total energy
Hithe length of the inlet region
Hpthe length of the packing region
Hothe length of the outlet region
hmthe mass transfer coefficient
hsthe heat transfer coefficient
kfthe thermal conductivity of the fluid
ksthe thermal conductivity of the particle
Lthe height of the packing structure
Methe initial moisture of the air
Nbthe number of half kernel
Nwthe number of the whole kernel
nthe non-dimension distance
Pstthe heat transfer power
Rthe radius of the fixed bed
rthe distance to the central axis of the fixed bed
Tfthe temperature of the fluid
Tsthe temperature of the particle
T0the initial temperatures of corn
Tinthe temperature of the inlet
Toutthe temperature of the outlet
T ¯ the average temperature of the fluid
µfthe dynamic viscosity of the fluid
Vpthe volume of the particle
Yf,dbthe moisture content of the fluid
Ys,dbthe moisture content of the particle
Ys0the initial moisture of corn
ρfthe density of the fluid
ρsthe density of the particle
εthe non-constrained porosity
pthe pressure drop

References

  1. Lessard, F.F. Integrated management of the risks of stored grain spoilage by seedborne fungi and contamination by storage mould mycotoxins—An update. J. Stored Prod. Res. 2017, 71, 22–40. [Google Scholar] [CrossRef]
  2. Jian, F.; Jayas, D.S. The ecosystem approach to grain storage. Agric. Res. 2012, 1, 148–156. [Google Scholar] [CrossRef] [Green Version]
  3. Flinn, P.W.; Subramanyam, B.; Arthur, F.H. Comparison of aeration and spinosad for suppressing insects in stored wheat. J. Econ. Entomol. 2004, 97, 1465–1473. [Google Scholar] [CrossRef] [PubMed]
  4. Manandhar, A.; Milindi, P.; Shah, A. An overview of the post-harvest grain storage practices of smallholder farmers in developing countries. Agriculture 2018, 8, 57. [Google Scholar] [CrossRef] [Green Version]
  5. Lawrence, J.; Maier, D.E.; Stroshine, R.L. Three-dimensional transient heat, mass, momentum, and species transfer in the stored grain ecosystem: Part I. Model development and evaluation. Trans. ASAE 2013, 56, 179–188. [Google Scholar] [CrossRef]
  6. Panigrahi, S.S.; Singh, C.B.; Fielke, J.; Zare, D. Modeling of heat and mass transfer within the grain storage ecosystem using numerical methods: A review. Dry. Technol. 2020, 38, 1677–1697. [Google Scholar] [CrossRef]
  7. Godfray, H.C.J.; Beddington, J.R.; Crute, I.R.; Haddad, L.; Lawrence, D.; Muir, J.F.; Pretty, J.; Robinson, S.; Thomas, S.M.; Toulmin, C. Food security: The challenge of feeding 9 billion people. Science 2010, 327, 812–818. [Google Scholar] [CrossRef] [Green Version]
  8. Mohseni, M.; Peters, B.; Baniasadi, M. Conversion analysis of a cylindrical biomass particle with a DEM-CFD coupling approach. Case Stud. Therm. Eng. 2017, 10, 343–356. [Google Scholar] [CrossRef]
  9. Niu, Q.; Wang, N.X. Study of heat transfer by using DEM-CFD method in a randomly packed pebble-bed reactor. Nucl. Sci. Tech. 2019, 30, 28. [Google Scholar] [CrossRef]
  10. Moghadami, N.A.; Zare, D.; Singh, C.B.; Stroshine, R.L. Filling of a grain silo. Part 1: Investigation of fine material distribution in a small scale centre-filled silo. Biosyst. Eng. 2020, 191, 145–156. [Google Scholar] [CrossRef]
  11. Moghadami, N.A.; Zare, D.; Stroshine, R.L.; Kamfiroozi, S. Filling of a grain silo. Part 2: A new filling method for uniform distribution of fines in a small scale silo. Biosyst. Eng. 2020, 191, 157–167. [Google Scholar] [CrossRef]
  12. Narendran, R.B.; Jian, F.; Jayas, D.S.; Fields, P.G.; White, N.D. Segregation of canola, kidney bean, and soybean in wheat bulks during bin loading. Powder Technol. 2019, 344, 307–313. [Google Scholar] [CrossRef]
  13. Mandas, N.; Habte, M. PH—Postharvest Technology: Numerical Simulation Static-Bed Drying of Barley. Biosyst. Eng. 2002, 82, 313–319. [Google Scholar] [CrossRef]
  14. Naghavi, Z.; Moheb, A.; Ziaei-Rad, S. Numerical simulation of rough rice drying in a deep-bed dryer using non-equilibrium model. Energy Convers. Manag. 2010, 51, 258–264. [Google Scholar] [CrossRef]
  15. Zare, D.; Chen, G. Evaluation of a simulation model in predicting the drying parameters for deep-bed paddy drying. Comput. Electron. Agric. 2009, 68, 78–87. [Google Scholar] [CrossRef]
  16. Zare, D.; Minaei, S.; Zadeh, M.M.; Khoshtaghaza, M.H. Computer simulation of rough rice drying in a batch dryer. Energy Convers. Manag. 2006, 47, 3241–3254. [Google Scholar] [CrossRef]
  17. Souza, G.F.M.V.; Miranda, R.F.; Lobato, F.S.; Barrozo, M.A.S. Simultaneous heat and mass transfer in a fixed bed dryer. Appl. Therm. Eng. 2015, 90, 38–44. [Google Scholar] [CrossRef]
  18. Montross, M.D.; Maier, D.E.; Haghighi, K. Validation of a finite–element stored grain ecosystem model. Trans. ASAE 2002, 45, 1465. [Google Scholar] [CrossRef]
  19. Jurtz, N.; Srivastava, U.; Moghaddam, A.A.; Kraume, M. Particle-resolved computational fluid dynamics as the basis for thermal process intensification of fixed-bed reactors on multiple scales. Energies 2021, 14, 2913. [Google Scholar] [CrossRef]
  20. Wehinger, G.D.; Scharf, F. Thermal radiation effects on heat transfer in slender packed-bed reactors: Particle-resolved CFD simulations and 2D modeling. Chem. Eng. Res. Des. 2022, 184, 24–38. [Google Scholar] [CrossRef]
  21. Gruyters, W.; Verboven, P.; Diels, E.; Rogge, S.; Smeets, B.; Ramon, H.; Nicolaï, B.M. Modelling cooling of packaged fruit using 3D shape models. Food Bioprocess Technol. 2018, 11, 2008–2020. [Google Scholar] [CrossRef]
  22. Han, J.W.; Badía-Melis, R.; Yang, X.T.; Ruiz-Garcia, L.; Qian, J.P.; Zhao, C.J. CFD simulation of airflow and heat transfer during forced-air precooling of apples. J. Food Process Eng. 2017, 40, e12390. [Google Scholar] [CrossRef]
  23. Zhou, B.; Zuo, Y.; Yang, H.; Wang, S.; Hou, L. Modelling radio frequency heating of randomly stacked walnut kernels with different particle size. Biosyst. Eng. 2023, 228, 56–66. [Google Scholar] [CrossRef]
  24. Wei, S.; Wang, Z.; Xie, W.; Wang, F.; Chen, P.; Yang, D. A heat and mass transfer model based on multi-component heterogeneity for corn kernel tempering drying: Development and application. Comput. Electron. Agric. 2020, 171, 105335. [Google Scholar] [CrossRef]
  25. Ziegler, V.; Paraginski, R.T.; Ferreira, C.D. Grain storage systems and effects of moisture, temperature and time on grain quality—A review. J. Stored Prod. Res. 2021, 91, 101770. [Google Scholar] [CrossRef]
  26. Atungulu, G.G.; Olatunde, G.A. Assessment of new in-bin drying and storage technology for soybean seed. Dry. Technol. 2018, 36, 383–399. [Google Scholar] [CrossRef]
  27. Aprajeeta, J.; Gopirajah, R.; Anandharamakrishnan, C. Shrinkage and porosity effects on heat and mass transfer during potato drying. J. Food Eng. 2015, 144, 119–128. [Google Scholar] [CrossRef]
  28. ASAE S352.2 APR1988 (R2017); Moisture Measurement-Unground Grain and Seeds. ASAE: St. Joseph, MI, USA, 2017.
  29. Shei, H.J.; Chen, Y.L. Computer simulation on intermittent drying of rough rice. Dry. Technol. 2002, 20, 615–636. [Google Scholar] [CrossRef]
  30. Moghaddam, E.M.; Foumeny, E.A.; Stankiewicz, A.I.; Padding, J.T. Multiscale modelling of wall-to-bed heat transfer in fixed beds with non-spherical pellets: From particle-resolved CFD to pseudo-homogenous models. Chem. Eng. Sci. 2021, 236, 116532. [Google Scholar] [CrossRef]
  31. Pohndorf, R.S.; Rocha, J.C.D.; Lindemann, I.; Peres, W.B.; Oliveira, M.D.; Elias, M.C. Physical properties and effective thermal diffusivity of soybean grains as a function of moisture content and broken kernels. J. Food Process Eng. 2018, 41, e12626. [Google Scholar] [CrossRef]
  32. George, G.R.; Bockelmann, M.; Schmalhorst, L.; Beton, D.; Gerstle, A.; Lindermeir, A.; Wehinger, G.D. Influence of Foam Morphology on Flow and Heat Transport in a Random Packed Bed with Metallic Foam Pellets—An Investigation Using CFD. Materials 2022, 15, 3754. [Google Scholar] [CrossRef]
  33. Partopour, B.; Dixon, A.G. An integrated workflow for resolved-particle packed bed models with complex particle shapes. Powder Technol. 2017, 322, 258–272. [Google Scholar] [CrossRef]
  34. Dixon, A.G.; Nijemeisland, M.; Stitt, E.H. Systematic mesh development for 3D CFD simulation of fixed beds: Contact points study. Comput. Chem. Eng. 2013, 48, 135–153. [Google Scholar] [CrossRef]
  35. Dixon, A.G.; Taskin, M.E.; Stitt, E.H.; Nijemeisland, M. 3D CFD simulations of steam reforming with resolved intraparticle reaction and gradients. Chem. Eng. Sci. 2007, 62, 4963–4966. [Google Scholar] [CrossRef]
  36. Bai, H.; Theuerkauf, J.; Gillis, P.A.; Witt, P.M. A coupled DEM and CFD simulation of flow field and pressure drop in fixed bed reactor with randomly packed catalyst particles. Ind. Eng. Chem. Res. 2009, 48, 4060–4074. [Google Scholar] [CrossRef]
  37. Liu, W.; Chen, G.; Zheng, D.; Ge, M.; Liu, C. Numerical and experimental investigation of flow and heat transfer in a fixed bed of non-spherical grains using the DEM-CFD method. J. Food Process Eng. 2023, e14362. [Google Scholar] [CrossRef]
  38. Ostanek, J.; Ileleji, K. Conjugate heat and mass transfer model for predicting thin-layer drying uniformity in a compact, crossflow dehydrator. Dry. Technol. 2020, 38, 775–792. [Google Scholar] [CrossRef]
  39. Du Plessis, J.P.; Woudberg, S. Pore-scale derivation of the Ergun equation to enhance its adaptability and generalization. Chem. Eng. Sci. 2008, 63, 2576–2586. [Google Scholar] [CrossRef]
  40. Wongkham, J.; Wen, T.; Lu, B.; Cui, L.; Xu, J.; Liu, X. Particle-resolved simulation of randomly packed pebble beds with a novel fluid-solid coupling method. Fusion Eng. Des. 2020, 161, 111953. [Google Scholar] [CrossRef]
  41. Choi, D.; Park, S.; Han, J.; Ahn, M.Y.; Lee, Y.; Park, Y.H.; Sohn, D. A DEM-CFD study of the effects of size distributions and packing fractions of pebbles on purge gas flow through pebble beds. Fusion Eng. Des. 2019, 143, 24–34. [Google Scholar] [CrossRef]
  42. De Klerk, A. Voidage variation in packed beds at small column to particle diameter ratio. AIChE J. 2003, 49, 2022–2029. [Google Scholar] [CrossRef]
  43. Sobieski, W.; Zhang, Q.; Liu, C.Y. Predicting tortuosity for airflow through porous beds consisting of randomly packed spherical particles. Transp. Porous Media 2012, 93, 431–451. [Google Scholar] [CrossRef] [Green Version]
  44. Zhang, M.; Dong, H.; Geng, Z. Computational study of flow and heat transfer in fixed beds with cylindrical particles for low tube to particle diameter ratios. Chem. Eng. Res. Des. 2018, 132, 149–161. [Google Scholar] [CrossRef]
  45. Liu, W.; Chen, G.; Liu, C.; Zheng, D.; Ge, M. Experimental and Numerical Study of Pressure Drop Characteristics of Soybean Grain under Vertical Pressure. Appl. Sci. 2022, 12, 6830. [Google Scholar] [CrossRef]
  46. Liang, X.; Liu, X.J.; Xia, D. Numerical investigation of the gas–solid heat transfer characteristics of packed multi-size particles. Int. J. Heat Mass Transf. 2020, 149, 119237. [Google Scholar] [CrossRef]
  47. Duan, Z.; Zhang, Z.; Wang, J.; Cao, X.; Zhang, J. Thermal performance of structured packed bed with encapsulated phase change materials. Int. J. Heat Mass Transf. 2020, 158, 120066. [Google Scholar] [CrossRef]
Figure 1. The geometric model of the corn kernel: (a) physical model kernel; (b) real kernel.
Agriculture 13 01470 g001
Figure 2. The experimental setup of fixed-bed corn drying.
Agriculture 13 01470 g002
Figure 3. The corn kernel packing structure: (a) 0%; (b) 10%; (c) 20%; (d) 30%.
Agriculture 13 01470 g003
Figure 4. Schematic of the geometric model for the corn packing structure.
Agriculture 13 01470 g004
Figure 5. Contact processing and mesh generation.
Agriculture 13 01470 g005
Figure 6. Radial porosity distribution in fixed beds.
Agriculture 13 01470 g006
Figure 7. Pressure drop test values in fixed beds.
Agriculture 13 01470 g007
Figure 8. Streamlines and pressure drop at the Y = X plane in fixed beds: (a) 0%; (b)10%; (c) 20%; (d) 30%.
Agriculture 13 01470 g008
Figure 9. The axial pressure distribution at the Y = X plane in fixed beds.
Agriculture 13 01470 g009
Figure 10. Comparison of experimental and simulated pressure drop in fixed beds: (a) 0%; (b) 10%; (c) 20%; (d) 30%.
Agriculture 13 01470 g010
Figure 11. Velocity distribution on Z = 20 mm, 50 mm, and 80 mm plane in fixed beds: (a) 0%; (b)10%; (c) 20%; (d) 30%.
Agriculture 13 01470 g011
Figure 12. Velocity distribution at the Y = X plane in fixed beds: (a) 0%; (b) 10%; (c) 20%; (d) 30%.
Agriculture 13 01470 g012
Figure 13. The radial distribution of dimensionless average velocity in fixed beds.
Agriculture 13 01470 g013
Figure 14. The axial distribution of dimensionless average velocity and porosity in fixed beds: (a) axial dimensionless velocity; (b) axial porosity.
Agriculture 13 01470 g014
Figure 15. The temperature distribution contour at the Z = 20 mm, 50 mm, and 80 mm plane after 7 min of drying: (a) 0%; (b) 10%; (c) 20%; (d) 30%.
Agriculture 13 01470 g015
Figure 16. The temperature distribution contour at the Y = X plane after 7 min of drying: (a) 0%; (b) 10%; (c) 20%; (d) 30%.
Agriculture 13 01470 g016
Figure 17. The axial and radial average temperature distribution curve: (a) axial temperature; (b) radial temperature.
Agriculture 13 01470 g017
Figure 18. Average temperature of particles in fixed beds at different times.
Agriculture 13 01470 g018
Figure 19. Parameters of the characteristic transient heat transfer for different drying stages in fixed beds: (a) heat transfer coefficient; (b) Nusser number; (c) heat transfer power; (d) total energy.
Agriculture 13 01470 g019
Figure 20. The moisture distribution at different times at the Y = X plane: (a) 0%; (b) 10%; (c) 20%; (d) 30%.
Agriculture 13 01470 g020
Figure 21. The moisture distribution at the Z = 20 mm and 80 mm plane after 6 h of drying: (a) 0%; (b) 10%; (c) 20%; (d) 30%.
Agriculture 13 01470 g021
Figure 22. Average moisture of particles in fixed beds at different times.
Agriculture 13 01470 g022
Table 1. Particle properties used for RBD simulation.
ParametersValueSymbol
Geometry size100 × 100D × L, mm
Particle density1058.7ρs, kg/m3
Gravity acceleration9.81m/s2
Integration time step0.1s
Surface friction coefficient of particles0.4-
Surface bounciness of particles7.6 × 108-
Surface friction coefficient of walls0.2-
Surface bounciness of walls0.02-
Table 2. Parameter settings for corn and air in the simulation.
MaterialParametersSymbolValue
CornDensityρs, kg/m3   ρ s = 1000 + 14.556 Y s , db + 217 exp Y s , db
Specific heat capacitycs, J/(kg∙K) c s = 2000 + 35.5 Y s , db / 1 + Y s , db
Thermal conductivityks, W/(m∙K) k s = exp 1.74 3.7 Y s , db + 4.72 e 3 T s + 6.48 Y s , db 2 1.5 e 4 T s 2 + 6.27 e 2 Y s , db T s
Mass diffusivityDs, m2/s D s = 4.203 e 8 exp 2513 T s + 0.045 T s 5.5 Y s , db
AirDensityρf, kg/m3 ρ f = 8.666 × 10 6 T f 2 4.318 × 10 3 T f + 1.288
dynamic viscosityμf, kg/(m∙s) μ f = 1.691 × 10 5 + 4.984 × 10 8 T f
Specific heatcf, J/(kg∙K) c f = 1002.9 + 0.0054 T f
Thermal conductivitykf, W/(m∙K) k f = 2.401 × 10 8 T f 2 + 7.554 × 10 5 T f + 2.364 × 10 2
Mass diffusivityDf, m2/s D f = 2.89 e 5 T f 40 + 273.15 1.81
Disclaimer/Publisher’s Note: The statements, opinions and data contained in all publications are solely those of the individual author(s) and contributor(s) and not of MDPI and/or the editor(s). MDPI and/or the editor(s) disclaim responsibility for any injury to people or property resulting from any ideas, methods, instructions or products referred to in the content.

