Article

A Co-Simulation Virtual Reality Machinery Simulator for Advanced Precision Agriculture Applications

1
CREA Research Centre for Engineering and Agro-Food Processing, Consiglio per la Ricerca in Agricoltura e l’Analisi dell’Economia Agraria, Via Milano 43, 24047 Treviglio, Italy
2
CREA Research Centre for Engineering and Agro-Food Processing, Consiglio per la Ricerca in Agricoltura e l’Analisi dell’Economia Agraria, Via della Pascolare 16, Monterotondo, 00015 Rome, Italy
3
CREA Research Centre for Engineering and Agro-Food Processing, Consiglio per la Ricerca in Agricoltura e l’Analisi dell’Economia Agraria, Via G. Venezian 26, 20133 Milan, Italy
4
Soluzioni Ingegneria, Via Lorenzo Balicco 113, 23900 Lecco, Italy
*
Author to whom correspondence should be addressed.
Agriculture 2023, 13(8), 1603; https://doi.org/10.3390/agriculture13081603
Submission received: 13 July 2023 / Revised: 2 August 2023 / Accepted: 11 August 2023 / Published: 13 August 2023

Abstract

:
Simulation systems have become essential tools for both researchers and virtual laboratory experiments. In the Agri-food-chain, SimAgri, a driving simulator for tractors and operating machines, has been developed for precision agriculture (PA) research and to train professional farm drivers. Using the virtual environment of the simulator, the influence and fine-tuning of PA operations logic may be evaluated by simulating existing systems, or designing new ones, in specially compared scenarios and setups. Current configurations include an agricultural tractor carrying or towing farm equipment such as sprayers, seeders and fertilizer, embedded sensors, human–machine interfaces that may be configured like a joystick, console and touchscreen, and four virtual environment monitors. The study describes the design choices that have made it possible to create a simulator aimed at precision agriculture, keeping auto guidance, geolocation, and operations with ISOBUS implements as pillars. This research aims to use a unique purpose-designed simulation platform, installed on a driver-in-the-loop simulator to provide data to objectify the benefits of PA criteria. Numerical and experimental data have been compared to ensure results reliability.

1. Introduction

Modern digital technologies in agricultural systems foster advancing beyond the limitations of traditional farming practices [1]. In this regard, precision agriculture (PA), also called precision farming, emerged in the mid-1980s [2,3] in several domains of agricultural production systems [1,4]. Seeding, fertilization, herbicide application, and harvesting can be carried out by linking the mapped variables to farming decisions. The Global Navigation Satellite System technology (GNSS) and sensors development allow improved accuracy, reduced energy needs, and better timeliness. PA principles consider the cultivation’s variability to increase farmers’ profitability and environmental stewardship [5,6,7]. The acquisition of farm imagery increases farm efficiency using georeferenced data to set up management plans. Soil heterogeneity and topography affect plants’ production dynamics, making prescription mapping essential [8].
However, transitioning towards precision agriculture and digital practices requires farmers to adopt specific technology [9], making a comprehensive view of the new available technical possibilities essential [10,11]. Indicative guidelines promoting new agrotechnical patterns based on PA principles and the parallel set up of applicative examples and references (the so-called Living Labs) would strengthen farmers’ confidence [12,13]. Research and activities have proven and quantified the benefits of adopting PA [14,15], although practical constraints (e.g., field availability, weather conditions, impossibility in repeating in-field operations close in time) impair the efforts to objectify the advantages of this process. Moreover, farmers’ training has a crucial role in spreading PA technologies. Following the abovementioned limitations, a simulation platform providing different scenarios and relevant data to objectify and quantify the benefits of adopting different PA levels can decisively support precision farming.
Virtual reality (VR) technology generates primarily an interactive virtual environment designed to simulate a real-life experience [16], which can be non-immersive or immersive based on how immersive the virtual reality that the technology offers is [17], and the resulting user’s immersive experience level [18]. Non-immersive or partially immersive VR systems display the virtual environment on a standard computer screen: the user interacts with it using a mouse, joystick, console, or touchscreen. Conversely, immersive or fully immersive VR requires wearable tools (e.g., head-mounted displays) that allow the users a complete immersion in the virtual environment that displays changes under minimal movements.

2. Related Study

Currently, several areas, such as enhanced education learning, healthcare, military training, disaster risk management, retail and e-commerce, art, and entertainment and video games rely on immersive technology.
Driving simulators are regularly used in vehicle studies, including vehicle and traffic control testing, driver performance testing, driver training under various scenarios, and in developing realistic driving games. In contrast to operating actual vehicles, driving simulators allow high reproducibility of driving scenarios at the expense of realism [19]. Recently, simulators have moved beyond basic driver testing and training, and many simulators are now used for specialized purposes, such as testing hardware interfaces, allowing multiple drivers in the loop, interacting with actual vehicles, and even remote teleoperation of vehicles [20]. The automotive sector regularly uses driving simulators for hardware-in-the-loop (HIL) tests. According to Fathy et al. [21], the advantages of a HIL system include higher fidelity, faster simulation speed than purely virtual systems, and greater comprehensiveness than purely physical systems. The state-of-the-art driving simulations often use HIL combined with human-in-the-loop testing, sometimes called H2IL, in which human operators interact with a HIL workbench. While this represents an extremely high fidelity yet highly safe testing environment, it is recognized that such H2IL capability is generally underused in vehicle research and development [22]. The use of driving simulators for tractor studies is at a very early stage is compared with automotive systems. The rarity of simulated tractor testing environments is mainly due to the high operating expense and the limited funding available for tractor research compared with automotive systems.
A fundamental part of the simulator is the virtual environment in which the operator interacts. This scenario is complex, and one of the current trends in the automotive industry is the so-called digital twin (DT). The key principle is to create a sensor-induced digital copy of a physical object, which receives constant updates from its real-world counterpart [23]. A digital twin is a nonphysical model designed to accurately reflect an artificial or physical system, where sensors acquire various data regarding different aspects of the system’s performance. These data are then transmitted to a data acquisition system and applied to the digital copy. When the digital copy is updated with the relevant data, the virtual model may be used to implement various simulations, which can lead to potential improvements by creating valuable information that can be applied back to the original system existing in the physical world. In this way, physical processes, products, and accompanying elements can be digitally transferred and described in a virtual world reality. The growing digital twin market suggests that while digital twins are already used in many industries, their demand will continue to escalate in the immediate future [24]. An overview in Ibrahim et al. [25] compares DT and HIL for electric vehicle (EV) propulsion drive systems. Combining both can yield the best result. The overview suggests testing initially different models with HIL simulation and using the acquired results to build the propulsion system. After performing enough measurements, the study suggests creating a DT of EV propulsion drive systems.
DT consists of three conceptual elements: (i) a means to observe/ascertain the state of a product, process or the environment in which it operates; (ii) a virtual model, to understand and simulate the effects of state change for a product, process or environment; (iii) a feedback mechanism, used to affect the state of a physical product, process, or operational environment [26].
A classification criterion is based on the data integration level which can be achieved between the physical product and its virtual representation [26,27]:
  • Digital model (DM): a digital representation without automated data exchange between the entity and virtual model.
  • Digital shadow (DS): a digital representation with automated information flow in one direction. This information flows from the entity to the virtual representation, meaning a change in the entity is reflected in the virtual representation.
  • Digital twin (DT): a digital representation with automated bi-directional information flow. The digital twin has a virtual representation, reflecting any changes in the physical entity’s state.
To assess the core focus of research with applications and trends of agricultural digital twins [28,29], studies have focused on the examination of technology solutions across the investigated farming operation and the considered farming type. The thematic application area resulted: crops; urban and controlled environment farming; livestock farming; product design, smart services, and machinery management; supply and value chains; and policy, environment, and infrastructure.
Following the national public consultation on precision farming set up by the Italian Ministry of Agriculture [30] to increase overall farming sustainability, the present research aims to realize a tractor driving simulator intended to recreate the process innovation introduced by PA and quantify the relevant benefits, if any.
The expected benefits are [31]:
  • Energy consumption analysis: analyze the energy consumption of the physical system;
  • Optimization/update: allows to find the optimal parameters for the operation of a system;
  • Behavior analysis user operation guide: analyze human-fabricated operations and provide feedback;
  • Technology integration: bring together different already deployed technologies under the same umbrella to control and visualize operations more easily.
Therefore, the simulator focuses on the management of agricultural machines with autoguiding, geolocation, and ISOBUS and on the adoption of implements able to manage prescription maps, section control, and variable rate (Table 1).
A digital twin of both the tractor and implement has been used. The simulator is the platform that includes both the digital twin and the physical actuators. The digital twin communicates with the tractor physical actuators: the steering wheel, the pedals, and the command console. The driver acts on the physical actuators and closes the loop with the digital twin during the tests.
The project originates from the complexity of studying and appreciating, in real and comparable conditions, the working flow of digital agricultural machinery technologies in an identified environment. As a matter of fact, it is not easy, or impossible, to replicate experiences with different forward speed, working width, number of variable section, number of cluster in the prescription maps, tractor engine power, tractor’s path, traffic control, field shape and size, product capacity of the implement, etc., as it is not allowed to fertilize or weeding or seeding two or more times the same field or to have hundreds of hectares or several different implement available, or for seasonal and weather conditions.
For these reasons, the simulator developed in this research represents a key tool to predict the management of farms in terms of machineries alternatives and under different scenarios considering the possible interaction as well, with particular attention on the designing of hardware and software to enhance training operators in the use of this PA process.
The paper describes the simulator design process, including the digital environment and the digital vehicles and implements developed.
The output of the simulator has been compared with the results carried out with an agricultural tractor both during handling maneuvers and with three different PA tasks.

3. Materials and Methods

The topics covered by the simulator development are described in detail below:
  • The main requirements of the simulation;
  • Virtual tractor design;
  • Virtual implements;
  • Simulation platform;
  • Experimental test.

3.1. The Main Requirements of the Simulation

The main simulation topics concern:
  • Dynamics of the vehicle similar to an agricultural tractor;
  • Monitoring tractor forces exchanged with the ground;
  • Replication of engine behavior and related fuel consumption;
  • Simulation of the main pillars of precision agriculture (PA);
  • Driving position layout;
  • Operating conditions.

3.1.1. Dynamics of the Vehicle

The system is required to be able to simulate:
  • The dynamic behavior of the agricultural tractor as it is subjected to linear and angular accelerations;
  • The lateral and longitudinal stability of the vehicle when working on slopes or with drawbar force;
  • The vertical, lateral, and longitudinal forces that each tire exchanges with the ground.
The simulator shall reproduce the vehicle’s response to varying tire characteristics. The model has been developed, simulating one specific tractor fitted with a set of tires. However, the simulator allows changing the elastic and geometric parameters of the system to evaluate the different responses. It is possible to acquire the input data (steering, speed) and the linear and angular accelerations of the vehicle during the test at an acquisition frequency of at least 50 Hz.
CREA carried out the measures on a real tractor (John Deere 6920S, John Deere GmbH & Co.KG, John Deere-Str. 70, Mann, similar to the virtual tractor developed of (i) the main geometries of the vehicle; (ii) the position of the tractor’s center of gravity [32], Figure 1; (iii) and the characterization of the longitudinal and lateral dynamic response on a tractor by the main handling maneuver on the CREA-IT test track, Figure 1.

3.1.2. Monitoring Tractor Forces Exchanged with the Ground

The software simulates and acquires the contextual data of:
  • Traction force of an agricultural tractor on agricultural land [33];
  • Weight on each single wheel during working and forwarding;
  • Relative load on the engine [32].
The model has been developed on the following input:
  • The algorithms representing the exchange of forces between agricultural tires and agricultural soil, both as resistance to forward movement and as traction force [32,33], of an agricultural tractor; these last were obtained by tests performed at CREA following ASABE standards;
  • The algorithms relating to the forward resistance of an implement [33], i.e., the traction force at the drawbar.

3.1.3. Replication of Engine Behavior and Related Fuel Consumption

The software simulates the load on the engine due to the sum of the forward resistance, the power required in traction, the power required at the power take-off (PTO), the power required by the hydraulic system and the fuel consumption (hourly in kg h−1 or l h−1 and specific in g kWh−1) and the engine speed.
The values adopted to identify these contributions on the engine load and the representative curves of the tractor engine to be simulated (power, torque, and consumption) were acquired by test at the CREA engine room [32], Figure 1, with a real tractor while drawbar force and tire slippage was based on ASABE standard [33].

3.1.4. Simulation of the Main Pillars of Precision Agriculture

The aim is to simulate the systems and constraints characteristic of precision agriculture which are based on:
  • Calculation of guidelines for the tractor, automatic guidance;
  • Actuation signal to the operators based on a position in the field provided by the GNSS signal;
  • ISOBUS implement.
Consequently, it is crucial to develop a virtual world with GNSS signal. In this regard, the simulated positioning system can use position correction systems that guarantee different degrees of precision (for example EGNOS, 20–30 cm, RTK, 2–3 cm) providing a certain degree of error and/or oscillation around the correct value. It must also be possible for one of our operators to modify the agricultural operating scenario (i.e., the size of the farm, the shape of the field, slopes, obstacles such as rocks or poles, etc.)
Basically, after having defined the boundaries of the field and the main guidelines, the software elaborates parallel guidelines at a distance that depends on the working width of the implement; these are the “paths” that the operator or the simulated tractor’s automated guide will have to follow. Apart from the classic manual driving mode, assisted and automatic driving modes can be used. The first mode consists of using a display which indicates to the operator the path to follow. For the second mode, it is necessary to equip the simulator with an automatic system that simulates the effect of an electric motor on the steering wheel or hydraulic cylinders on the steering and a monitor on which the route to be followed in the field will be graphically represented. For this, autonomous driving provides an error algorithm, i.e., oscillation around the ideal trajectory, which can be modified in terms of value and response times. A Proportional Integrative Derivative (PID) control has been used with a preview in front of the vehicle. The error is the lateral deviation from the ideal trajectory and the output of the control is the steering wheel angle required to follow the trajectory. An empirical strategy has been adopted to identify the values of the control parameters.
The execution of some operations (e.g., fertilizing) requires the driver not only to follow the pre-set routes but, on the basis of the actual position of the vehicle, which the GNNS antenna communicates with in real-time, the management software allows varying the settings of the implements connected to the tractor (on–off; partial opening or closing of a valve; modification of the setting of some tools; all these actions are called “section control” of the implement) to comply with the indications received from prescription maps (previously loaded into the software itself) or from “on-the-go” sensors.
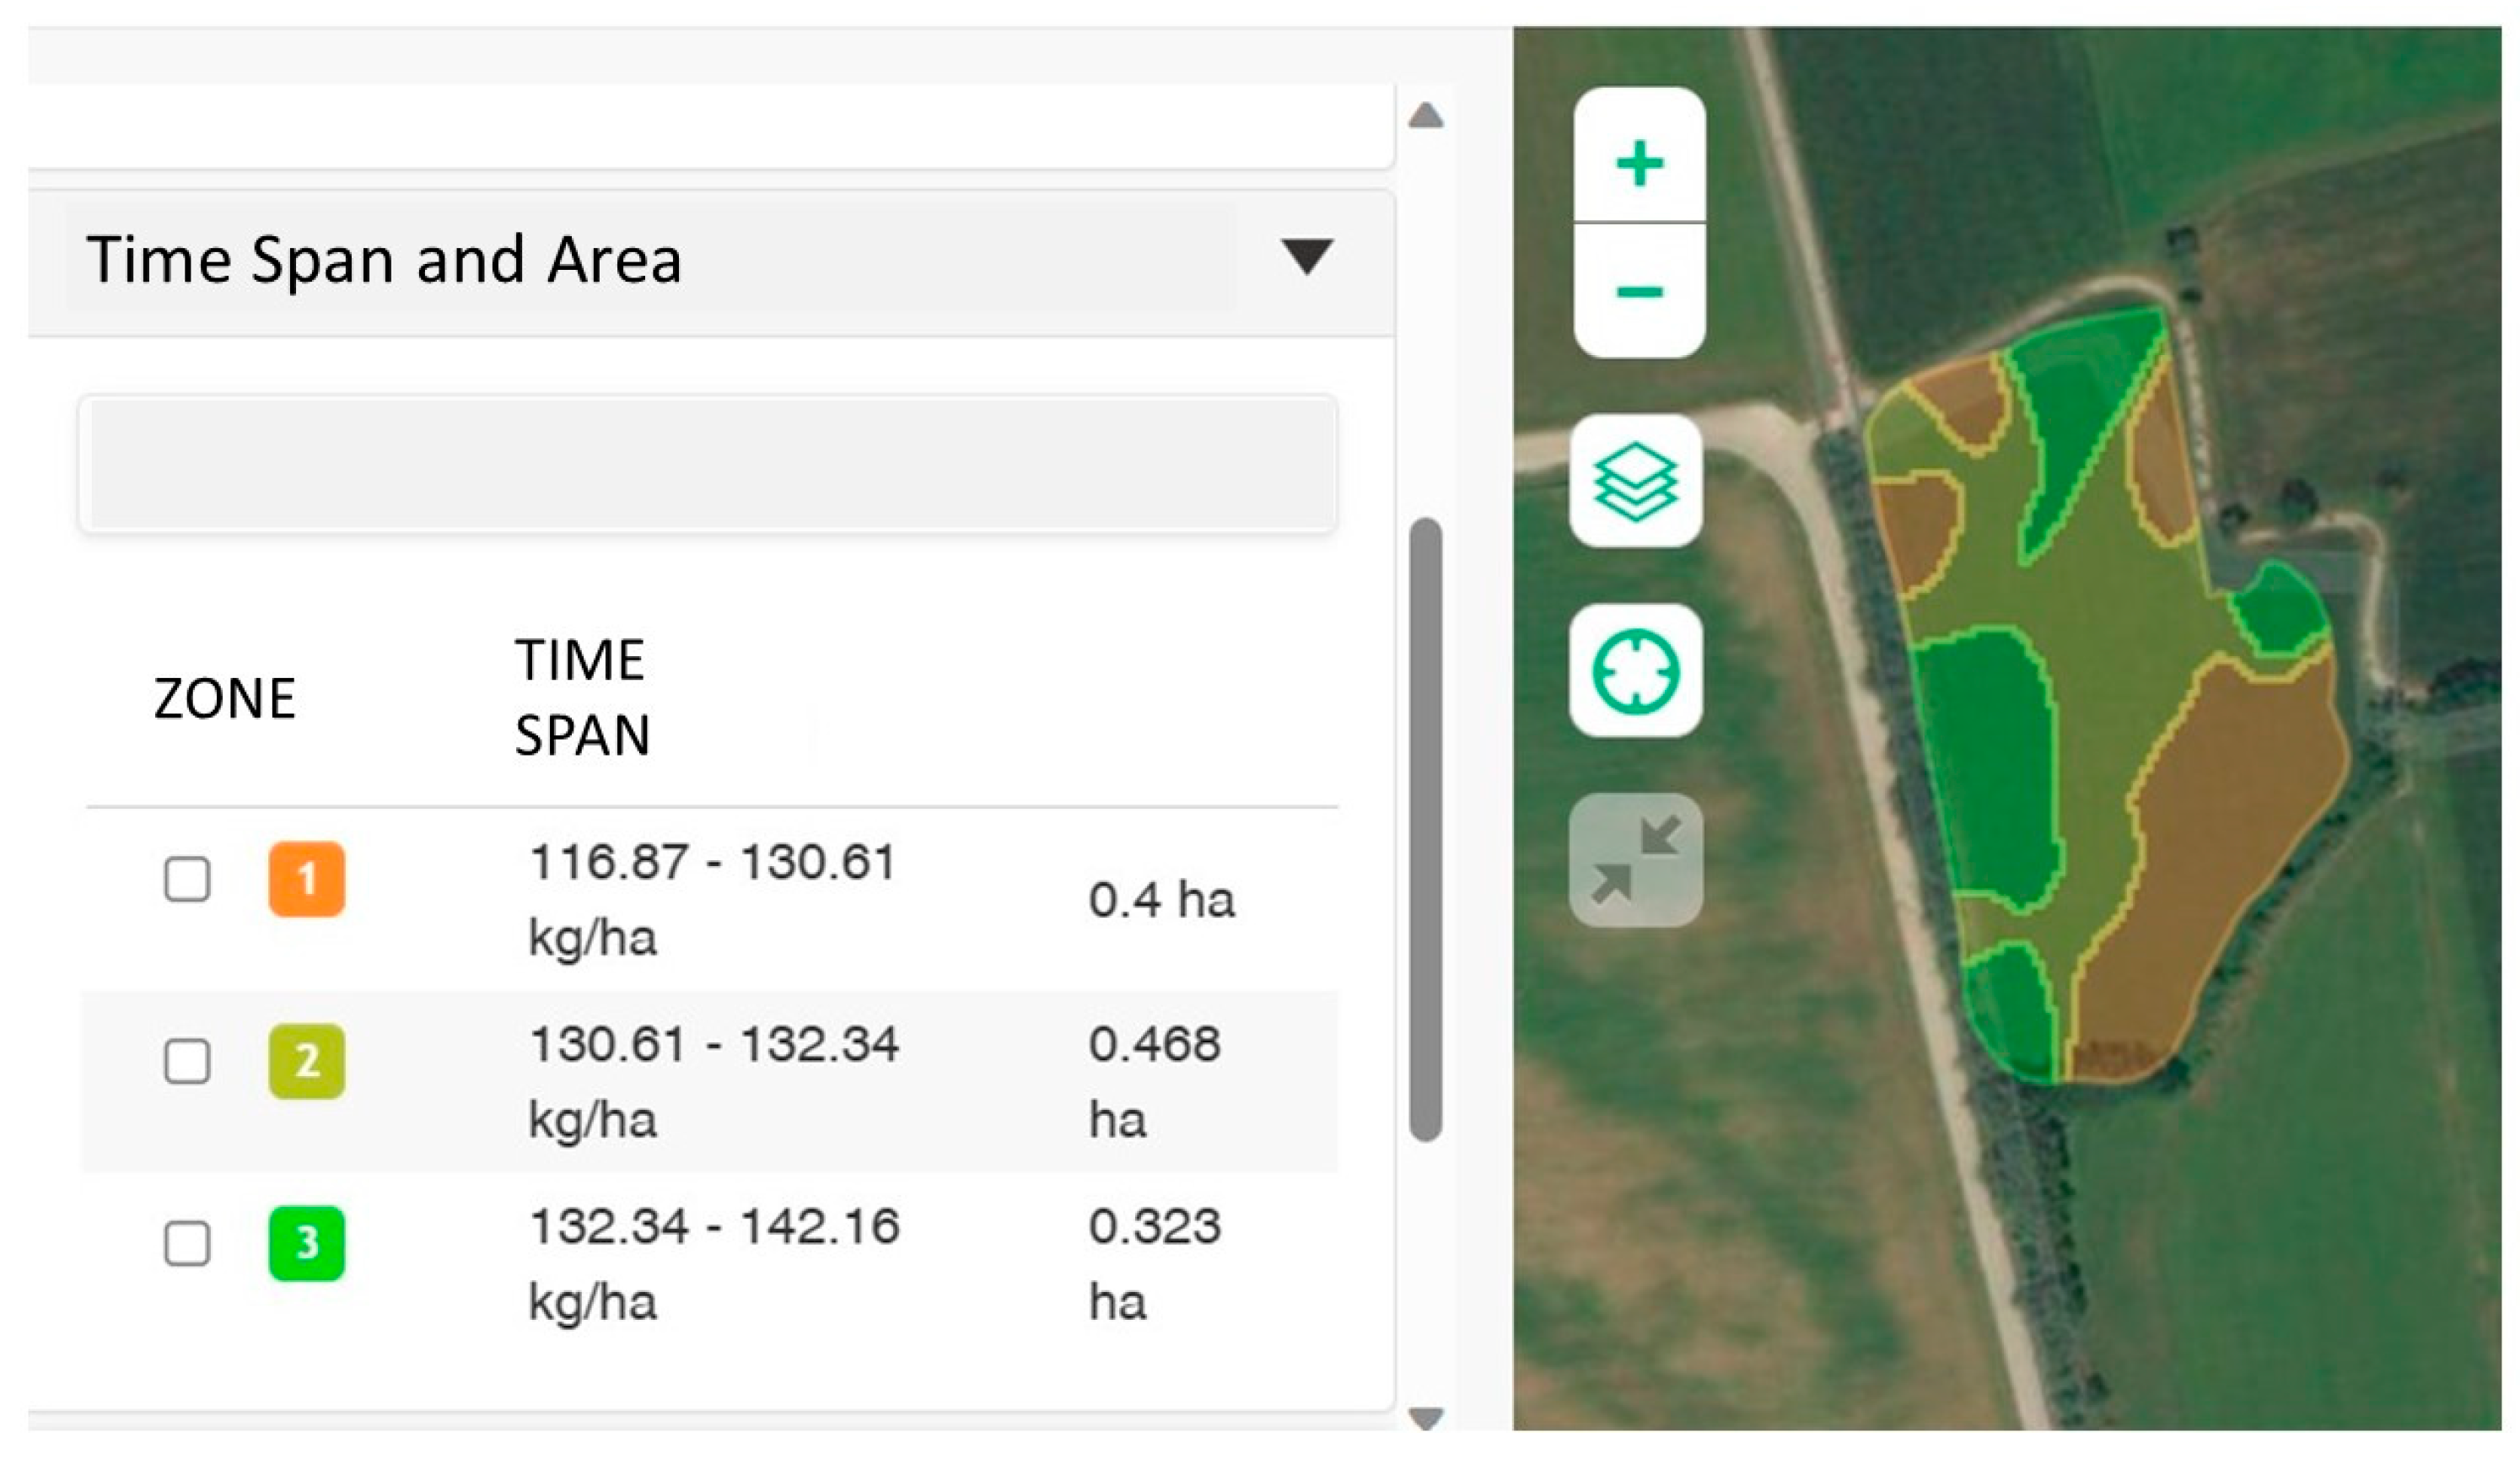
So, the simulator has been developed to replicate the management of the contents of prescription maps to simulate, for example, a precision distribution (seed, fertilizer, and crop protection products). Figure 2 shows an example of a prescription map in which 3 different field zones are combined with three different doses of fertilizer.

3.1.5. Driving Position Layout

The simulator is static.
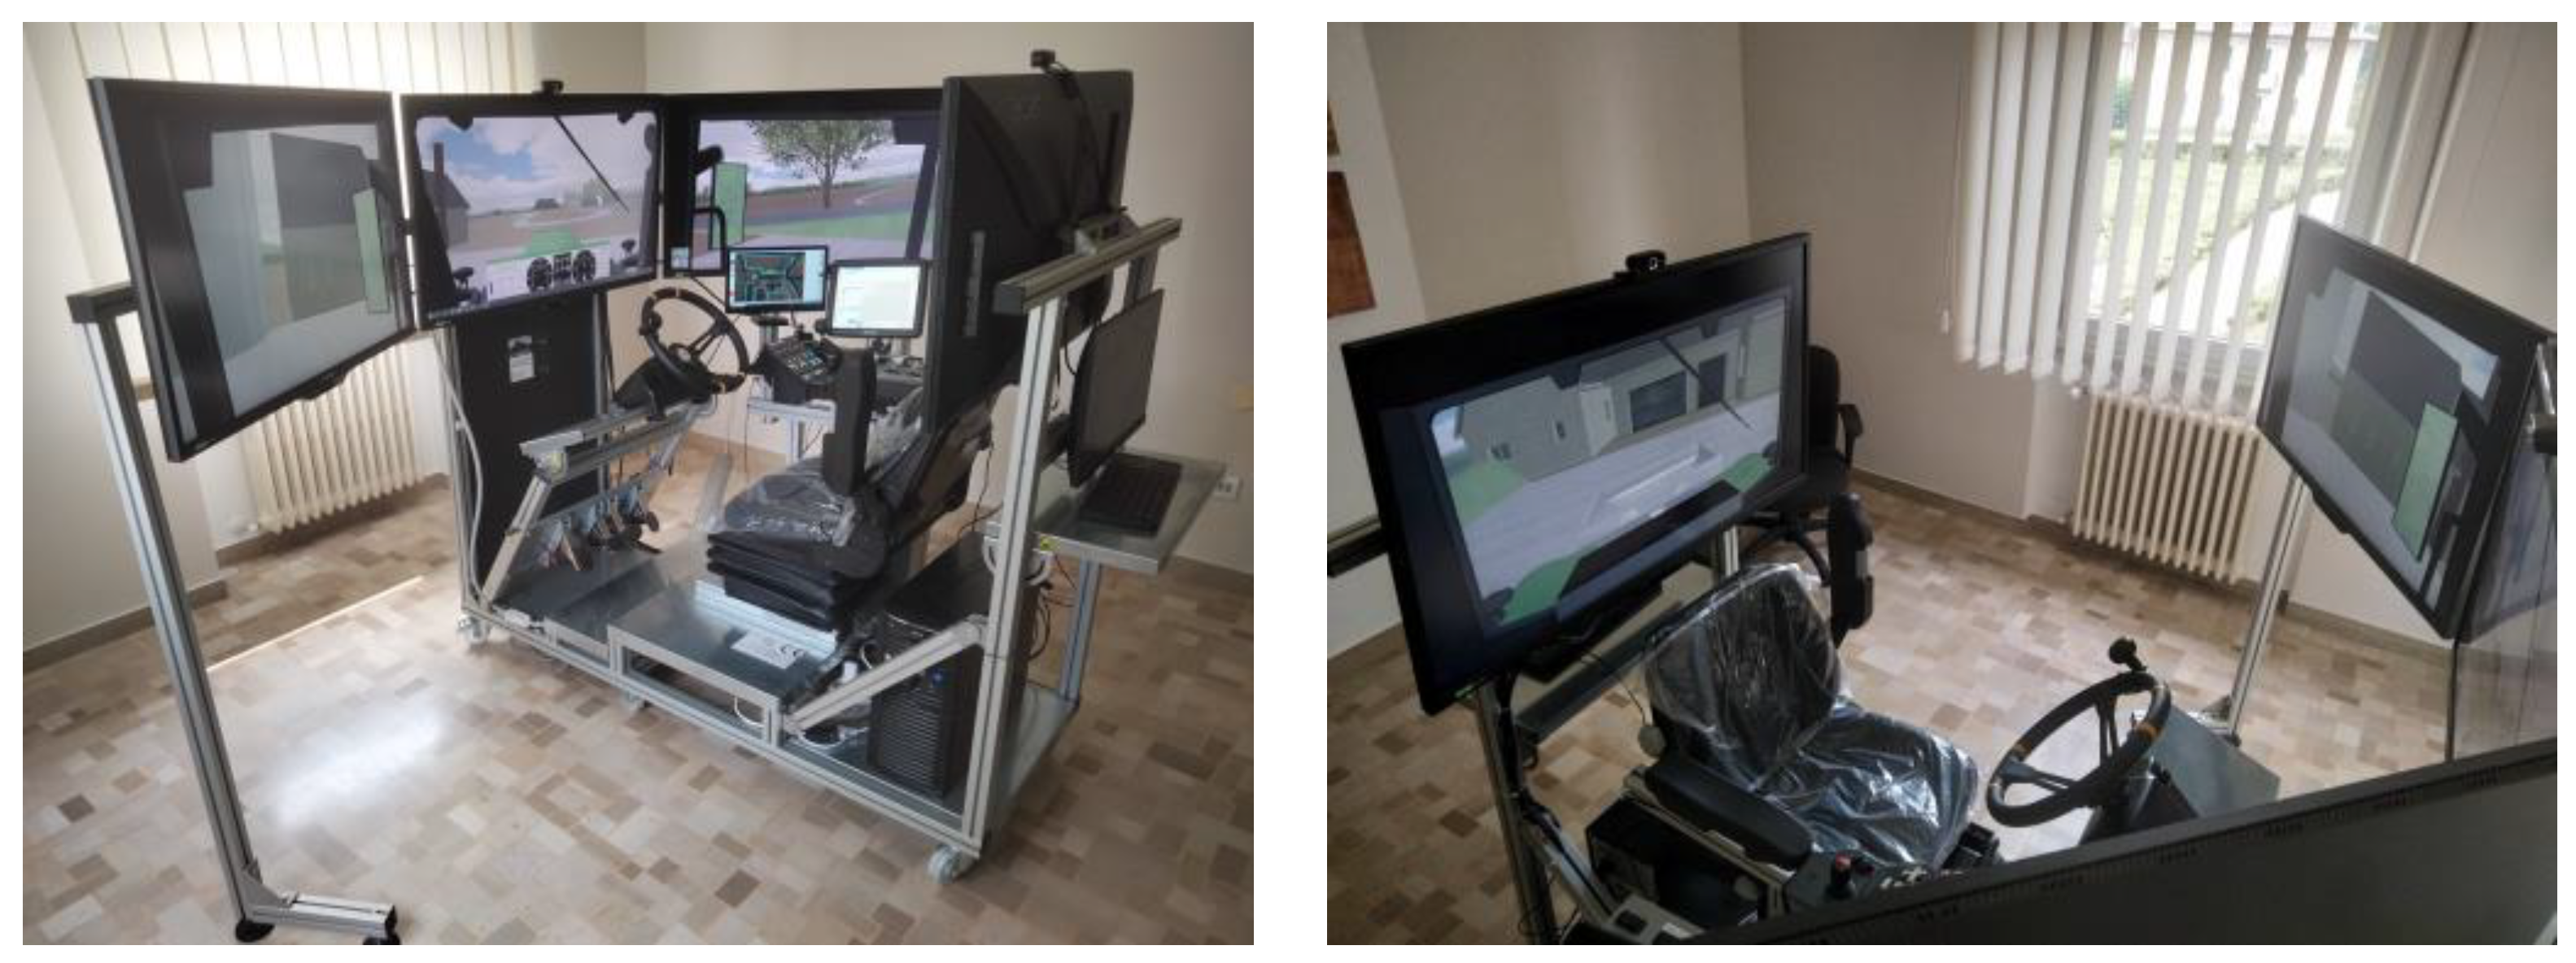
The driving position is representative of that of a modern agricultural tractor, generic and not attributable to a precise brand, on which the interfaces with the operator is positioned (seat, steering wheel, pedals, a dashboard similar to that of cars, a monitor armrest with primary controls, and a console with secondary controls).
The video system of the simulator is equipped with 4 screens of at least 42″: front, left front, right front, and rear to simulate a field of view of a tractor’s cab.
In a modern agricultural tractor, the manual controls are positioned on two supports: the armrest and the console. The first, located next to the seat on the right side, houses the primary controls used during work. In addition to the armrest, on the right side of the driver’s seat, there is the console on which the secondary controls are placed, relating to the adjustments to be set before starting work, but which are not used during processing.
A touch monitor represents the following functions:
  • Engine data: power, torque, fuel consumption;
  • PTO settings;
  • Torque to the wheels and adherent weight;
  • GPS data and view of the auto guidance tractor guidelines;
  • Implement settings (type, width, sections, etc.);
  • Prescription maps to verify the work performed by the operator.
Furthermore, two cameras are present to record the driver’s behavior during the training/test.

3.1.6. Operating Conditions

The required scenarios are:
  • The simulation of transfer or transport on paved roads in a mainly suburban road environment;
  • Transfer or processing on agricultural land: the environment will be brown-colored land with borders represented by farm roads, country roads (“white”) or ditches.
  • The ability to simulate nighttime or poor visibility environments.
In the case of towing a trailer, the effect of the longitudinal traction force on the hook due to the rolling resistance of the tires is considered. The dynamic behavior of the trailer is not simulated.
In the case of agricultural land, it is possible to vary the size of the land and its shape, for example not only rectangular but also triangular, irregular shapes, or curvilinear sides, or acquire them from geographic internet services (SAS Planet or others).
It is possible to model sloping terrain to provide the simulation of workings with a tilted tractor.
An audio system that reproduces the sound of the tractor engine will be present.
There is the possibility of an outside view of the tractor (i.e., aerial) and of the environment during the execution of the tasks.

3.2. Virtual Tractor Design

The tractor model selected for the driving simulation is a commercial tractor. It is a four-wheel drive (mechanical front wheel drive axle type (MFWD)) open-field-type tractor.
A complete three-dimensional tractor design of a commercial tractor was executed in .obj format. The key components of the tractor were modelled, assembled, and parameterized according to the technical specifications supplied by the manufacturer and tested at the CREA-IT facilities as mass, center of gravity, engine characteristics, dynamic behavior (Figure 1), and soil–tire interface to ensure the real behavior of the model.
The adopted tractor had the following main characteristics:
  • MFWD open-field-type tractor with rear axle rigid, front axle and cab suspended;
  • Engine maximum power: 130 CV (96 kW) @ 2100 min−1 and maximum torque of 600 Nm @ 1600 min−1;
  • Engine capacity: 4.5 L, inline-4 cylinders;
  • Curb weight: 6200 kg; maximum admissible mass: 9500 kg;
  • Wheelbase: 2.58 m; front width track 1.95 mm; rear width track 1.85 mm;
  • Four wheels, not isodiametric; front tires: 540/65 R24; rear tires: 600/65 R38;
  • Possibility of working by two- (rear) or four-wheel drive;
  • Maximum forward speed: 65 km h−1;
  • Steering system: no simulation of the correct steering wheel force was required, only a generic activation effort as feedback for the driver;
  • Simulated driveline in three modes: 1. mechanical; 2. power shift (able to change without disconnecting the engine torque); 3. continuously variable transmission ((CVT) obtained as a 99 gears automatic). CREA has provided the transmission characteristics of point 1 and 2.
  • Brakes: there are two brake pedals (one for the right and one for the left wheels only), close and connectable. The two pedals can be connected mechanically. When connected, the force measurement on the pedal is required (max. 60 kg). The CREA has provided the correlation curves between the load on the pedal and the tractor’s deceleration [32].

3.3. The Virtual Implements

3.3.1. The Seeder

The virtual seeder is a six-row corn planter. There are six maize seed distributors, 70 cm apart transversally, capable of distributing one seed at a time, and that can vary the number of seeds placed per square meter by modifying the longitudinal distance between the seeds themselves. The precision required for this operation is 3 cm. Furthermore, during turns, the edges of the field and in some irregularly shaped fields, it must be possible to stop these discs from sowing outside the field or where it has already been sown.
For comparison, with real experimentation the virtual seeder was adapted and designed to distribute on 24 rows over 3 m as the farm was sowing the barley (the .obj file was not modified and appeared as a six-row).

3.3.2. The Fertilizer

The chosen implement distributes the fertilizer placed in a hopper, broadcast through two rotors side by side. The gradual opening of a flap for each rotor allows dose adjustment of fertilizer to be distributed; and the distance at which to distribute the product which can be 0, 8, 16, or 24 m. Furthermore, it is possible to set and monitor the quantity distributed.

3.3.3. The Sprayer

The sprayer is a 1000 L tank and 15 m in width using ISO standard nozzles (for spray angle, maximum flow rate and pressure range). The 15 m width is divided into 5 3 m sections. Each section has 5 nozzles controlled by solenoid valves which can be activated independently and establish the quantity of product to be distributed. The tractor’s PTO moves the pump of the implement, which puts the circuit under pressure. A main valve on the recirculation loop sets the distribution loop pressure.

3.4. Simulation Platform

3.4.1. Vehicle Dynamics Simulation Platform

The CarMaker® (IPG Automotive GmbH, Karlshrue, Germany) platform is a full-fledged virtual driving environment which offers a wide range of applications from offline operation to hardware-in-the-loop (HIL) tests. CarMaker was designed to support the development process from an early conceptual stage to hardware prototype testing. Therefore, the CarMaker suite is composed of two main components, the CarMaker Interface Toolbox (CIT) and the Virtual Vehicle Environment (VVE). The CIT contains a collection of tools for simulation control, parameterization, analysis, visualization, and file management. The VVE represents the computer-modeled composition of the vehicle with all its components, such as the powertrain, tires, brakes, and chassis, and road and driver. Vehicle components may be implemented by default generic models, custom code such as MATLAB/Simulink controller models or even real hardware on a test rig. Depending on the desired task, the VVE can be operated on a regular office computer or on a real-time system. Real-time operation allows investigation of deterministic behavior; office operation might lack real-time capabilities but is therefore applicable on almost any host computer and allows the simulation to run slower or faster than real-time depending on system performance and model complexity and does not require special hardware.
The generality of the CarMaker VVE allows for the modifications of the vehicle models in an almost arbitrary number of ways. Generic vehicle components such as powertrain, steering, tires, brake system, and the complete propulsion system might be configured. Replacing single vehicle components with so-called custom code is easily performed by dynamically linking executable code and registering variables, parameters, and their dimensions and types within the VVE.
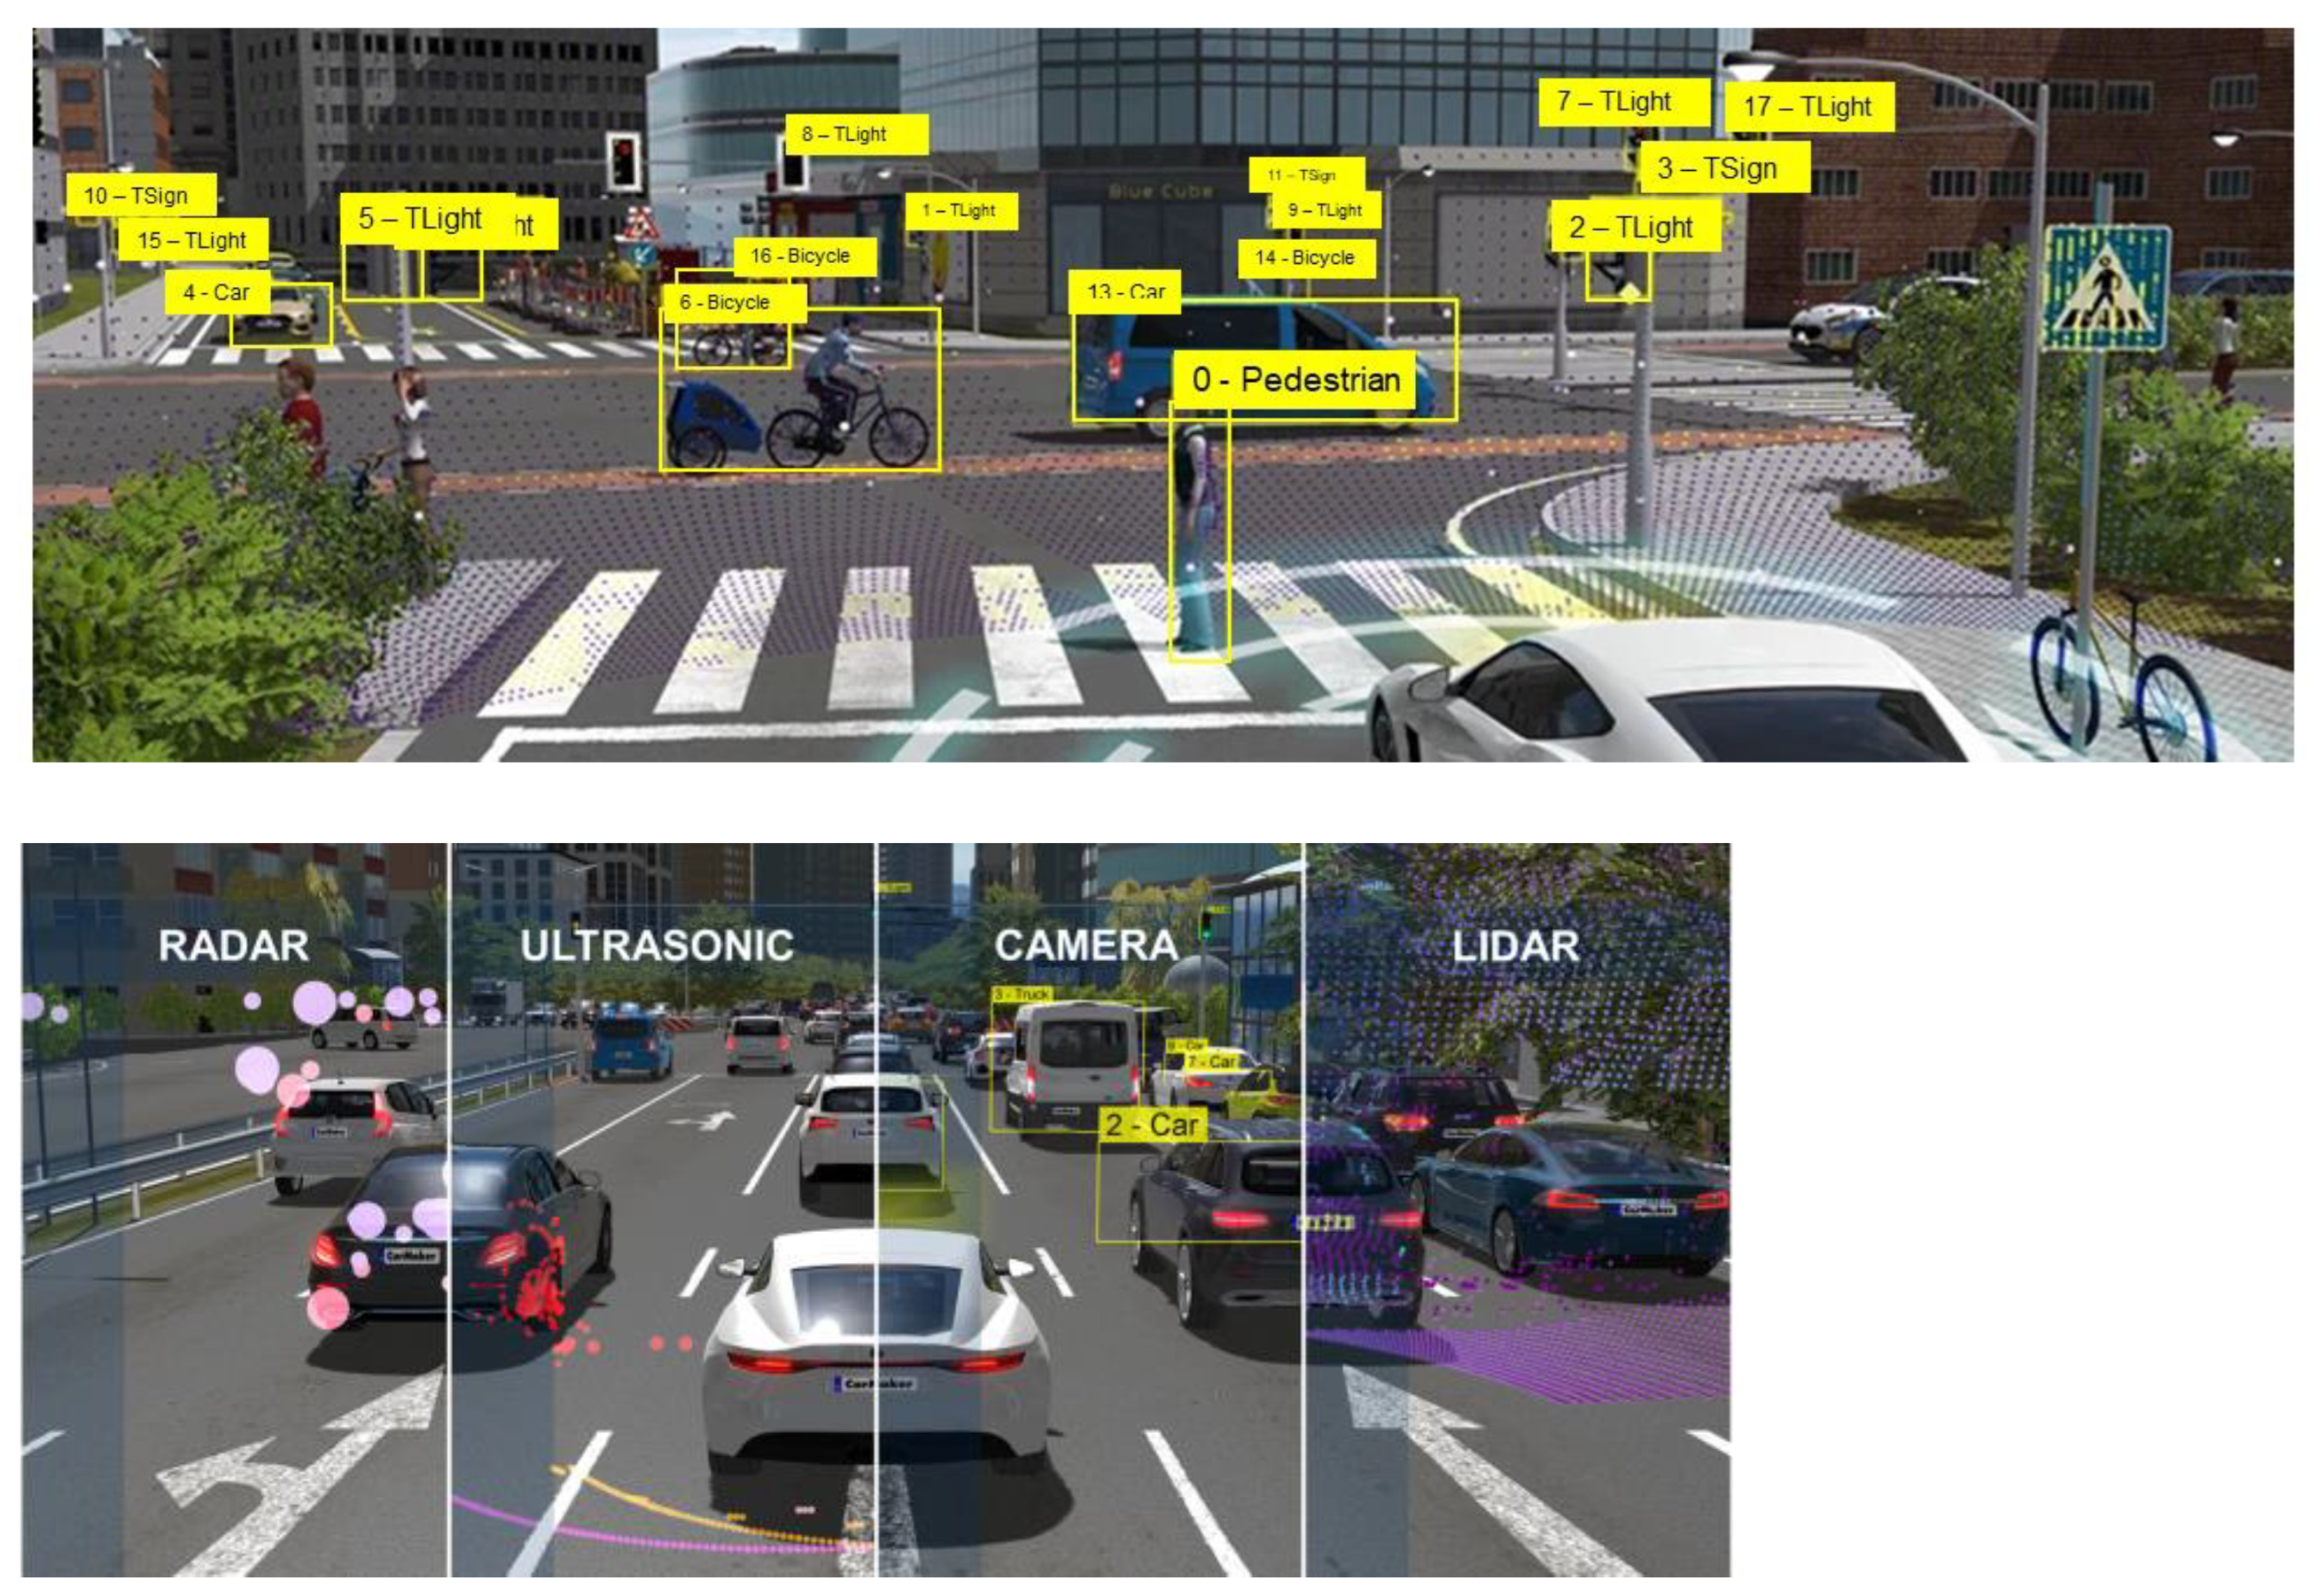
The used platform allows to generate realistic environments, either in field or on public road to properly enable scenarios perception. It is possible to include objects, plants, pedestrians, and animals wherever located in the scenarios and, referring to mobile ones, to attribute a deterministic motion law. Moreover, each element can be associated to reflectivity properties, visible by virtual sensors, such as cameras, ultrasonic, lidar, and radar (Figure 3). Different environmental conditions can be implemented as well as for day or night operations.

3.4.2. Precision Farming Simulation Platform

The tractor model generated using the CarMaker platform must be equipped with a whole series of features that allow it to be able to perform agricultural operations within a simulated scenario.
To ensure this is a Co-simulation with AgriSI 1.1.2 (Soluzioni Ingegneria, Lecco, Italy) software for the management of the precision farming, Python language is used.
These farming features are not included in the CarMaker 7.0 software.
AgriSI communicates with CarMaker and exchange information via a TCP/IP connection. The proposed platforms execute time integration cycles at 1 ms (1 kHz), allowing real time simulations usable for hardware-in-the-loop (HIL) applications.
This software contains all the farming features, and it is composed of three parts:
  • Simulation setting;
  • Simulation run;
  • Data post-processing.
The first part allows to setup the simulation, giving the possibility to choose the tractor model, the implement model (and so the operation type), and the scenario in which the simulation must be performed. At this stage, the software leads the import of georeferenced scenarios of real fields. It is also possible to select the precision of the position system to see how the control system behaves in case of a noisy or inaccurate GNSS signal.
The second part is to perform the simulation with the chosen setup. The implement should be controlled manually or automatically (in this second case, a prescription map provides the target of the operation). An optimal trajectory for the operation is imported and the tractor should follow it thanks to an automatic steering control.
The third part permits the analysis of the simulation’s data and obtains results. Both vehicle dynamics and farming data should be analyzed. Concerning the farming part, it is possible to obtain, for example:
  • Actual distribution map (which should be compared with the prescription map, if any, to obtain the distribution error);
  • Actual trajectory followed by the tractor;
  • Time history of the flow rate of each implement distributor;
  • Time history of the total mass of product spread on the field.

3.5. Experimental Test

3.5.1. Vehicle Dynamics

The performed test resulted:
  • Characterization Maneuver on the tarmac:
    Acceleration and brake, useful to collect tire data and compare numerical and experimental results in longitudinal dynamics;
    Coast down, useful to characterize both the aerodynamic and rolling resistance on the tarmac;
    Steering pad, useful to compare numerical and experimental results in lateral dynamics.
  • Characterization Maneuver on the field:
    Acceleration and brake, useful to collect tire data and compare numerical and experimental results in longitudinal dynamics;
    Coast down, useful to characterize the rolling resistance on the field.

3.5.2. Precision Agriculture

Evaluating the reproducibility of agricultural operations on the simulator entails choosing three field tasks, i.e., sowing, fertilizing and spraying, and performing them on the fields of the province of Bergamo, Italy, dedicated to cultivating extensive crops. The adopted tractor is a CVT with auto guidance system and the three implements were all ISOBUS.
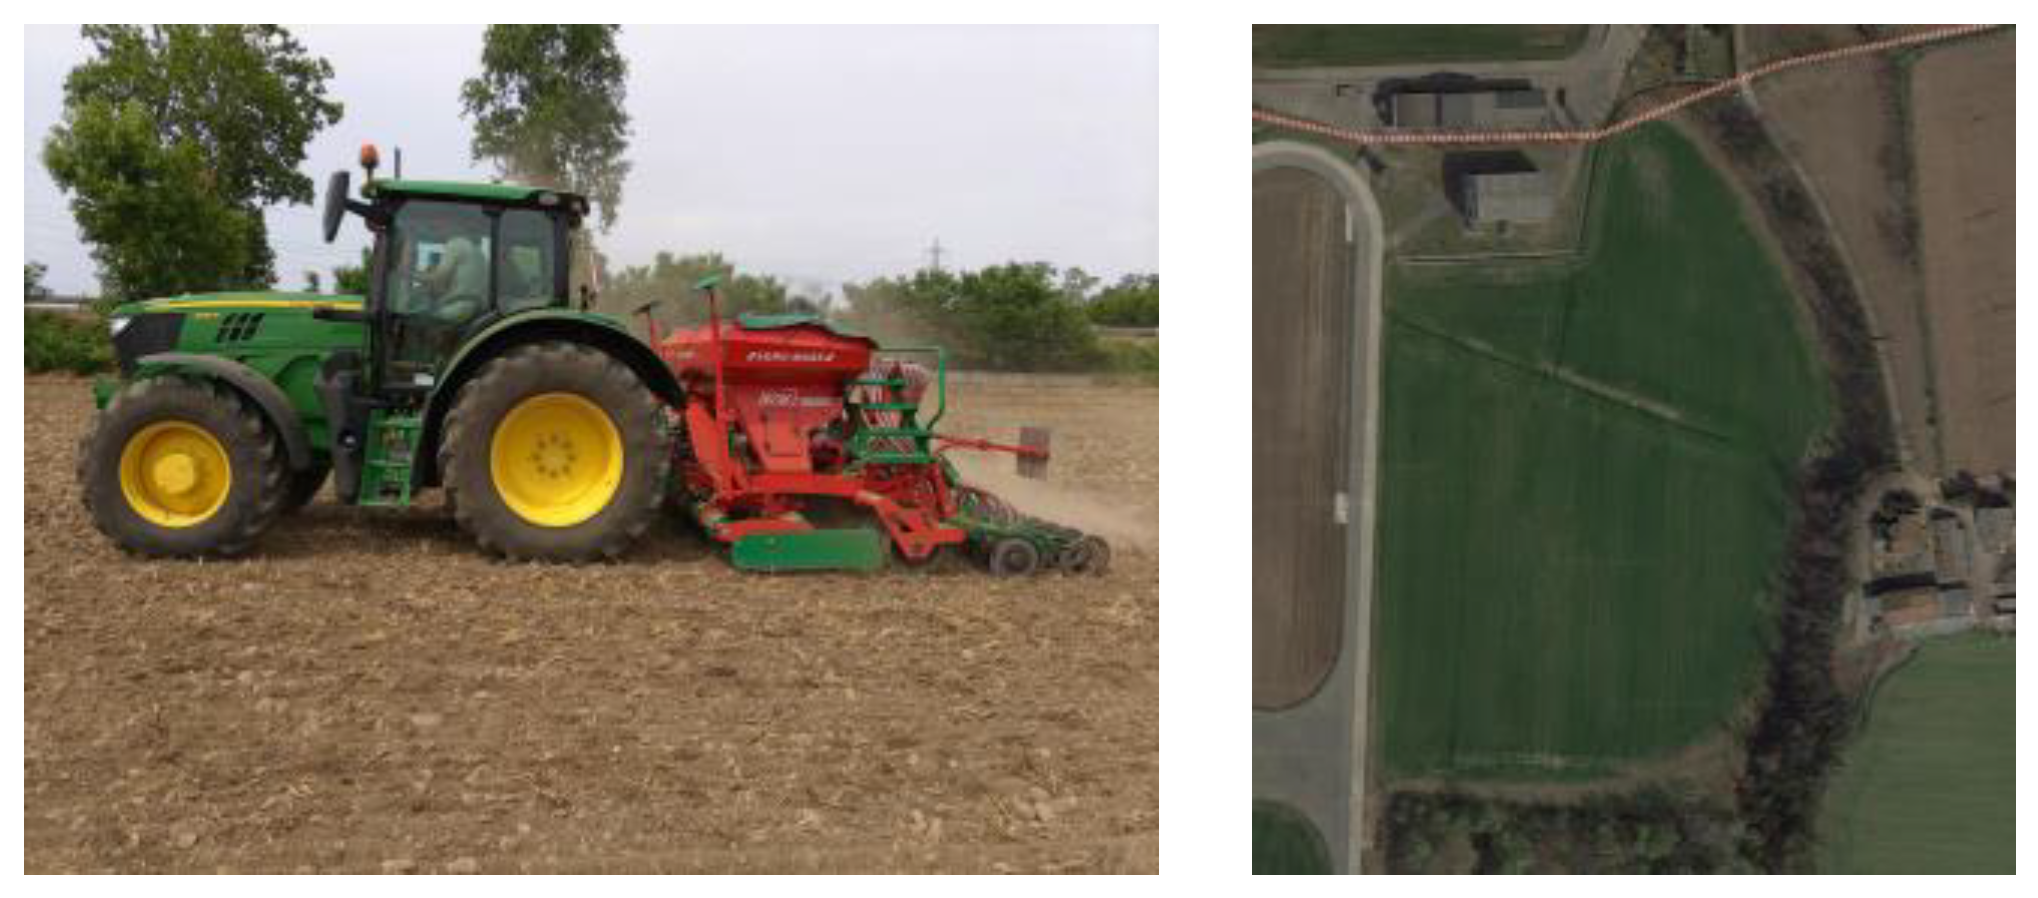
In detail, the sowing operation (Figure 4) resulted in the distribution of barley adopting a seeder 3 m in width, two sections, and 24 rows (Agromasz Aquila 3000, Agro-Masz Agriculture, Strzelce Małe 78, 97-515, Polland). The chosen field was 4.5 hectares; the target speed was 5 km h−1 and the target dose was 80 kg ha−1.
The spraying operation (Figure 5) adopted an implement 12 m in width; 5 sections; 25 nozzles; and a tank of 1100 L (Bargam Mec Poli Super 1100, Via Bicocca, 16, 40026, Imola, Italy). The field was 7.5 ha; the target speed was 10 km h−1; and the target dose was 250 L ha−1.
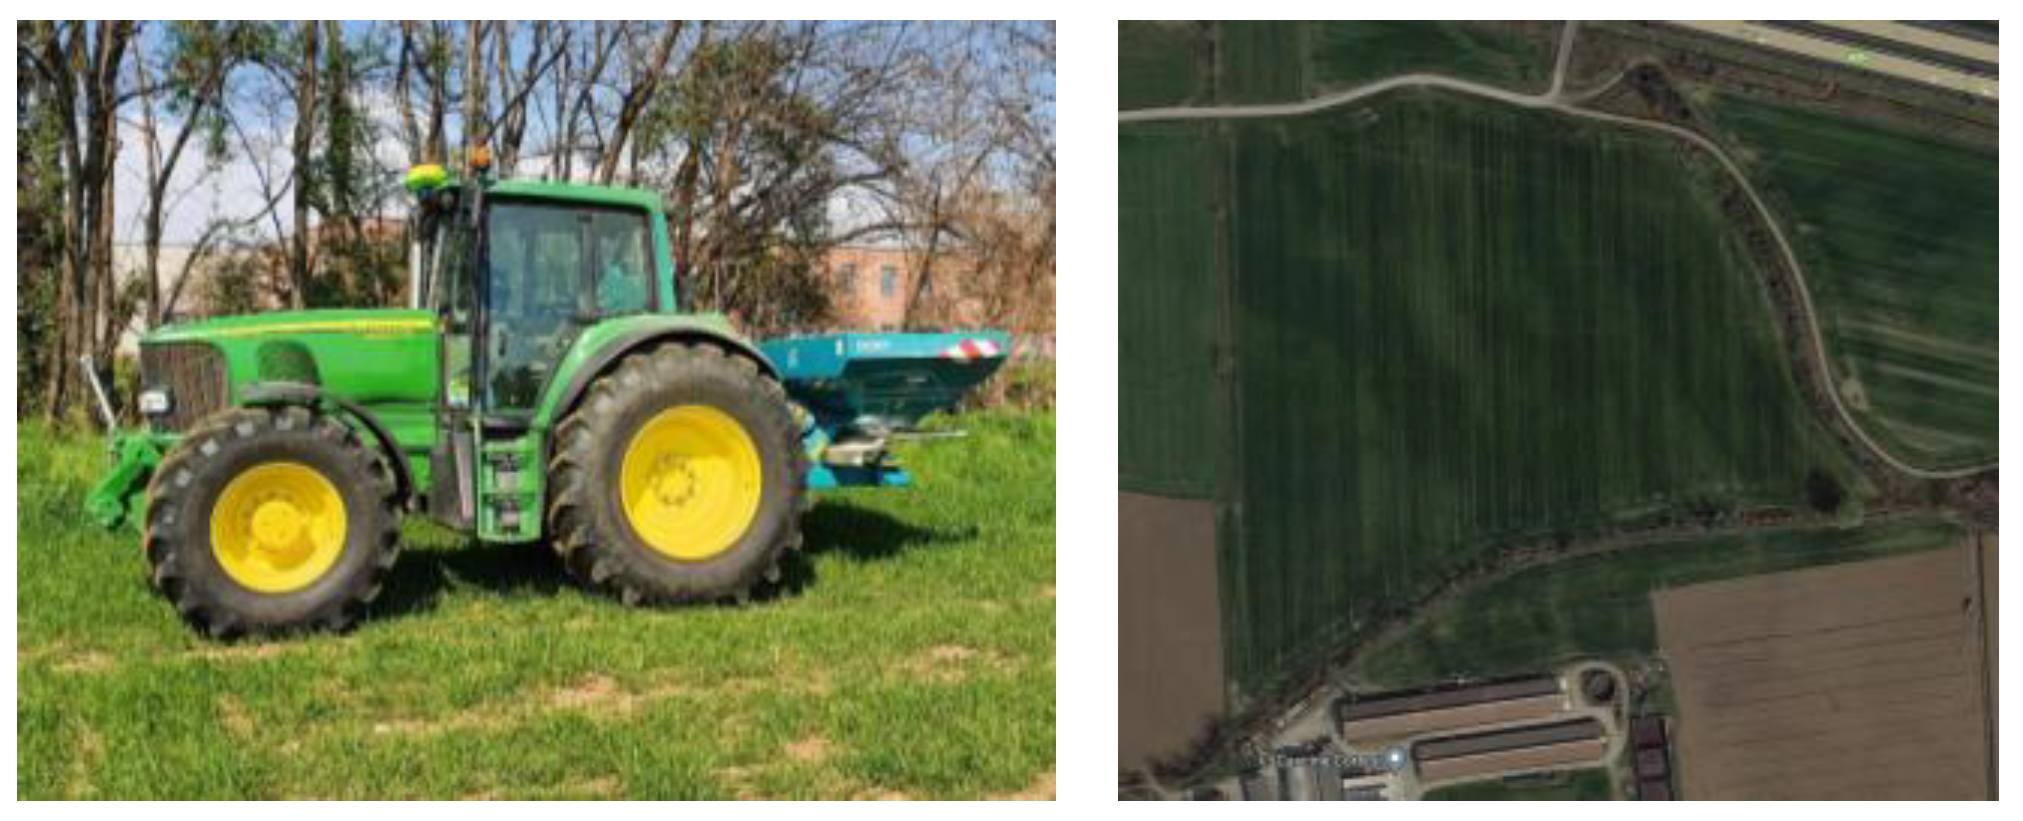
The fertilizing operation (Figure 6) adopted an implement 24 m in width and 4 sections (Sulky 30 DX+, Les Portes de Bretagne–P.A. de la Gaultière, 35220, Chateaubourg, France). The field was 8.4 hectares; the target speed 10 km h−1 and the target dose 150 kg ha−1.
The three experiences described were acquired by the MyJohnDeere© system (John Deere World Headquarters One John Deere Place Moline, Illinois 61265) and reproduced on the simulator.

4. Results

4.1. The Designed Simulator

4.1.1. The Driving Position Layout

The driving position consists of an agricultural tractor seat positioned between 4 × 42″ screens. The screens simulate the tractor’s four windows: front, right, left, and rear (Figure 7).
The controls are on the right, on a console derived from video games. This choice was made in order not to imitate any brands. The controls are necessary for the management of the tractor: PTO, rear lift, hydraulic distributors, the gearbox, manual accelerator, etc.
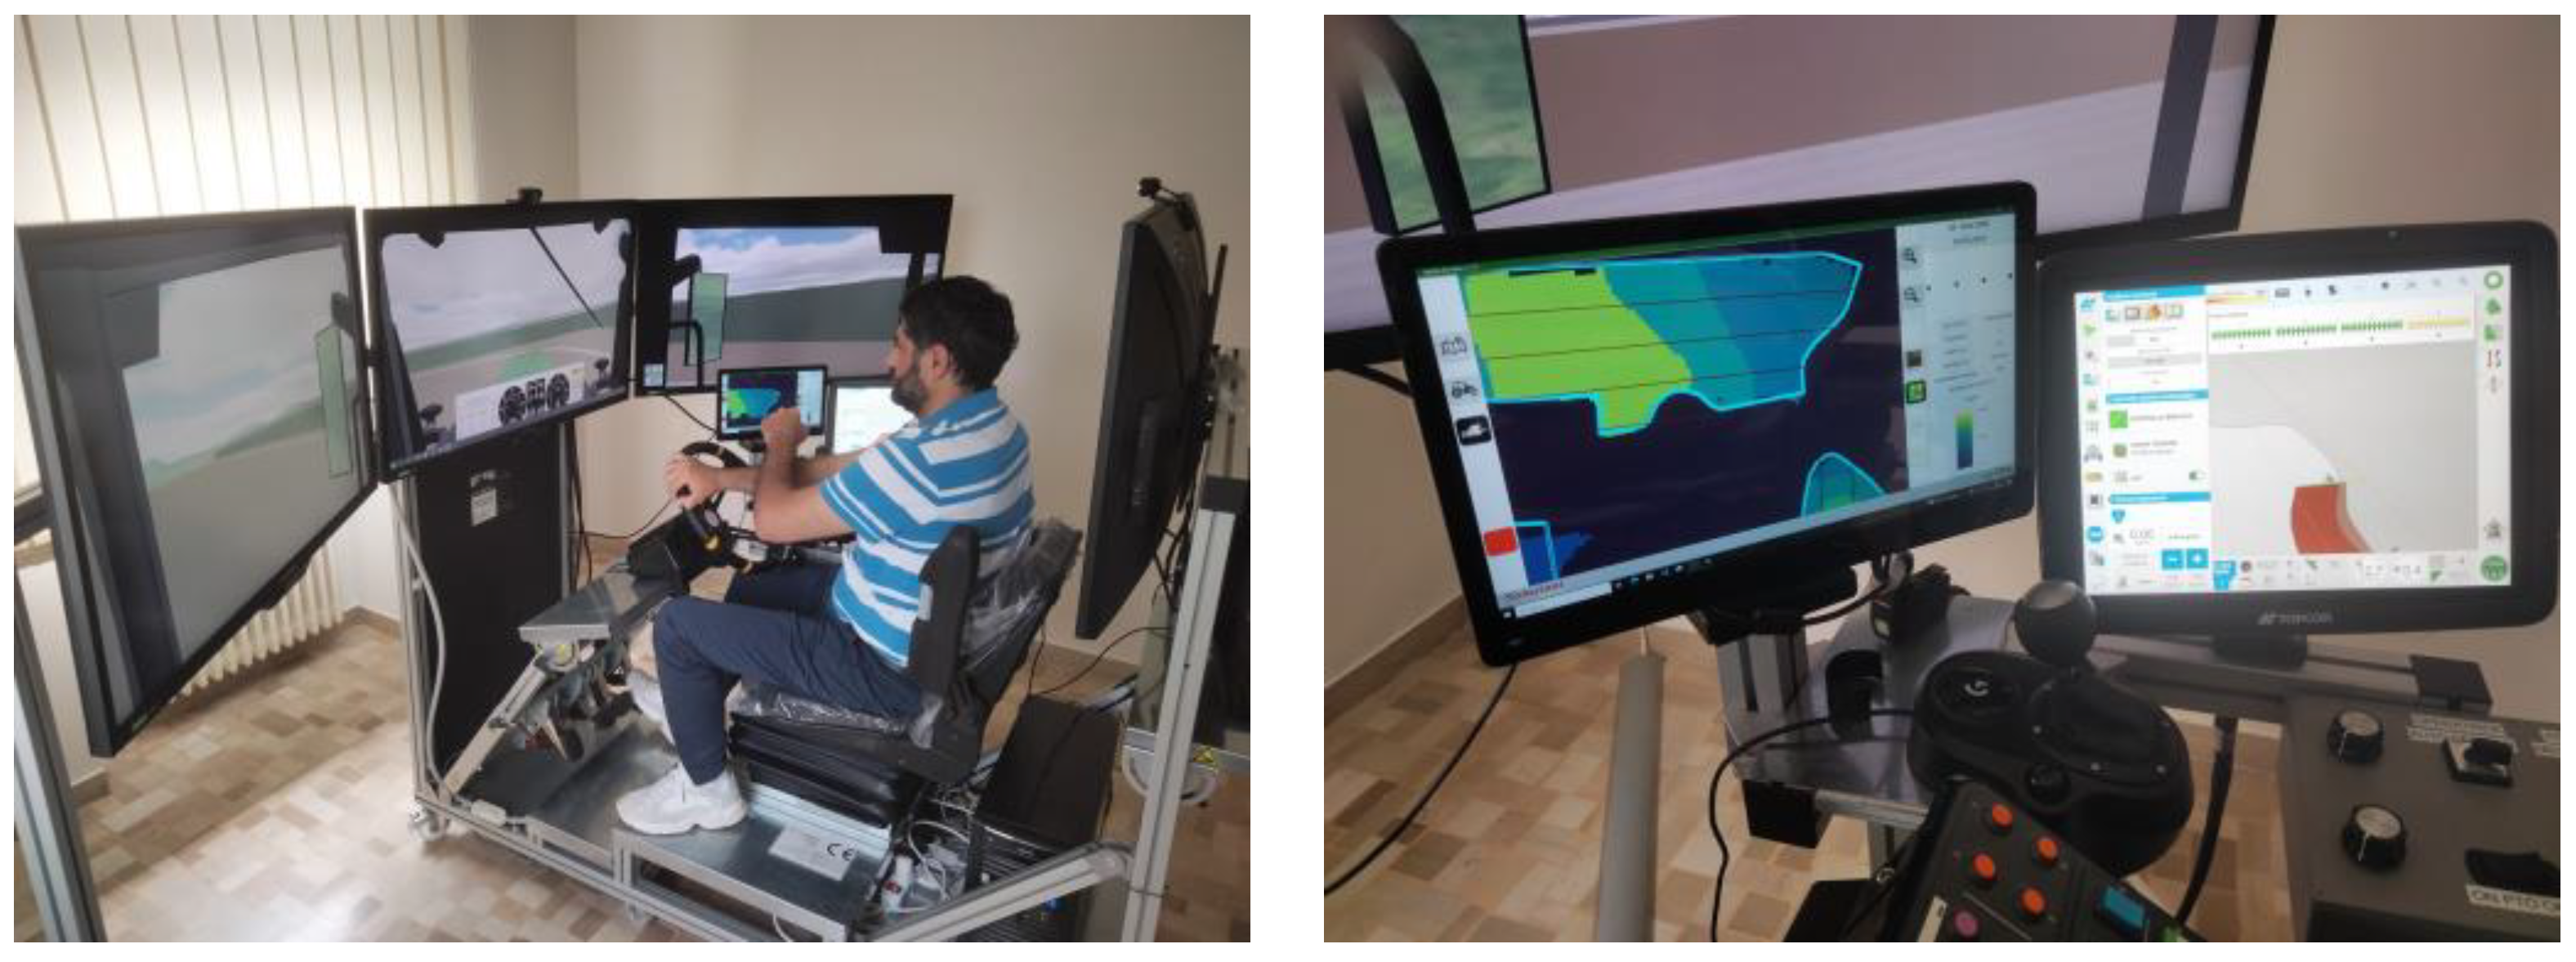
A tablet manages the specifications of the workings, as well as the interface of the virtual terminal during the working (Figure 8).
The system is equipped with a special generation of tractor noise and a camera in case the software is used to monitor operator fatigue. Figure 9 reports an example of the effective view during task performance. Figure 9 shows an example of an operator engaged in carrying out a task, the guidelines and the prescription map are visible. Figure 9 shows a second virtual terminal, on the right, which is also georeferenced, whose task is more aimed at training.

4.1.2. The Virtual Machines

The virtual tractor was realized with the characteristics detailed above (Section 3), starting from the simulation base of a vehicle of the truck type and adapted in the setup to obtain the layout of the tractor, for example the rigid rear axle and the front axle-pivoting. The engine speed and the load are functional to the work that is taking place and, consequently, fuel consumption.
The tractor can be changed as wheelbase, width track and mass distribution directly on the software and the same power can be modified either as a simple gain of the torque curve, or by re-entering a new power curve as a look-up table.
The three implements adopted appear as a rendering as described in materials and methods, can be changed in terms of working width, number of distributors, and distribution width of each single distributor, obviously considering the class of the tractor selected. The implements have been modeled as added masses in case they are mounted or as a trailer in the case of towed or semi-towed. The interface translated from the aerial view looks like Figure 10.
The power absorbed by the implement is entered manually and is based on CREA experience or on the basis of the ASABE tables [33].
During the experimental test, the fuel consumption of the tractor was acquired from the ECU to evaluate the adsorption power of the implement. The fuel consumption was acquired with the implement switched on and off, in case the seeder also lifted, and the difference of fuel consumption was adopted. The fuel consumption of the sprayer and of the fertilizer resulted in 600 g h−1 indicating about 2 kW h−1 of power requirement. The seeder resulted requiring 30 kW h−1 in the performed work conditions (3 m width; 5 km h−1). These values were adopted as engine load at the PTO at the simulator.

4.1.3. The Operating Conditions

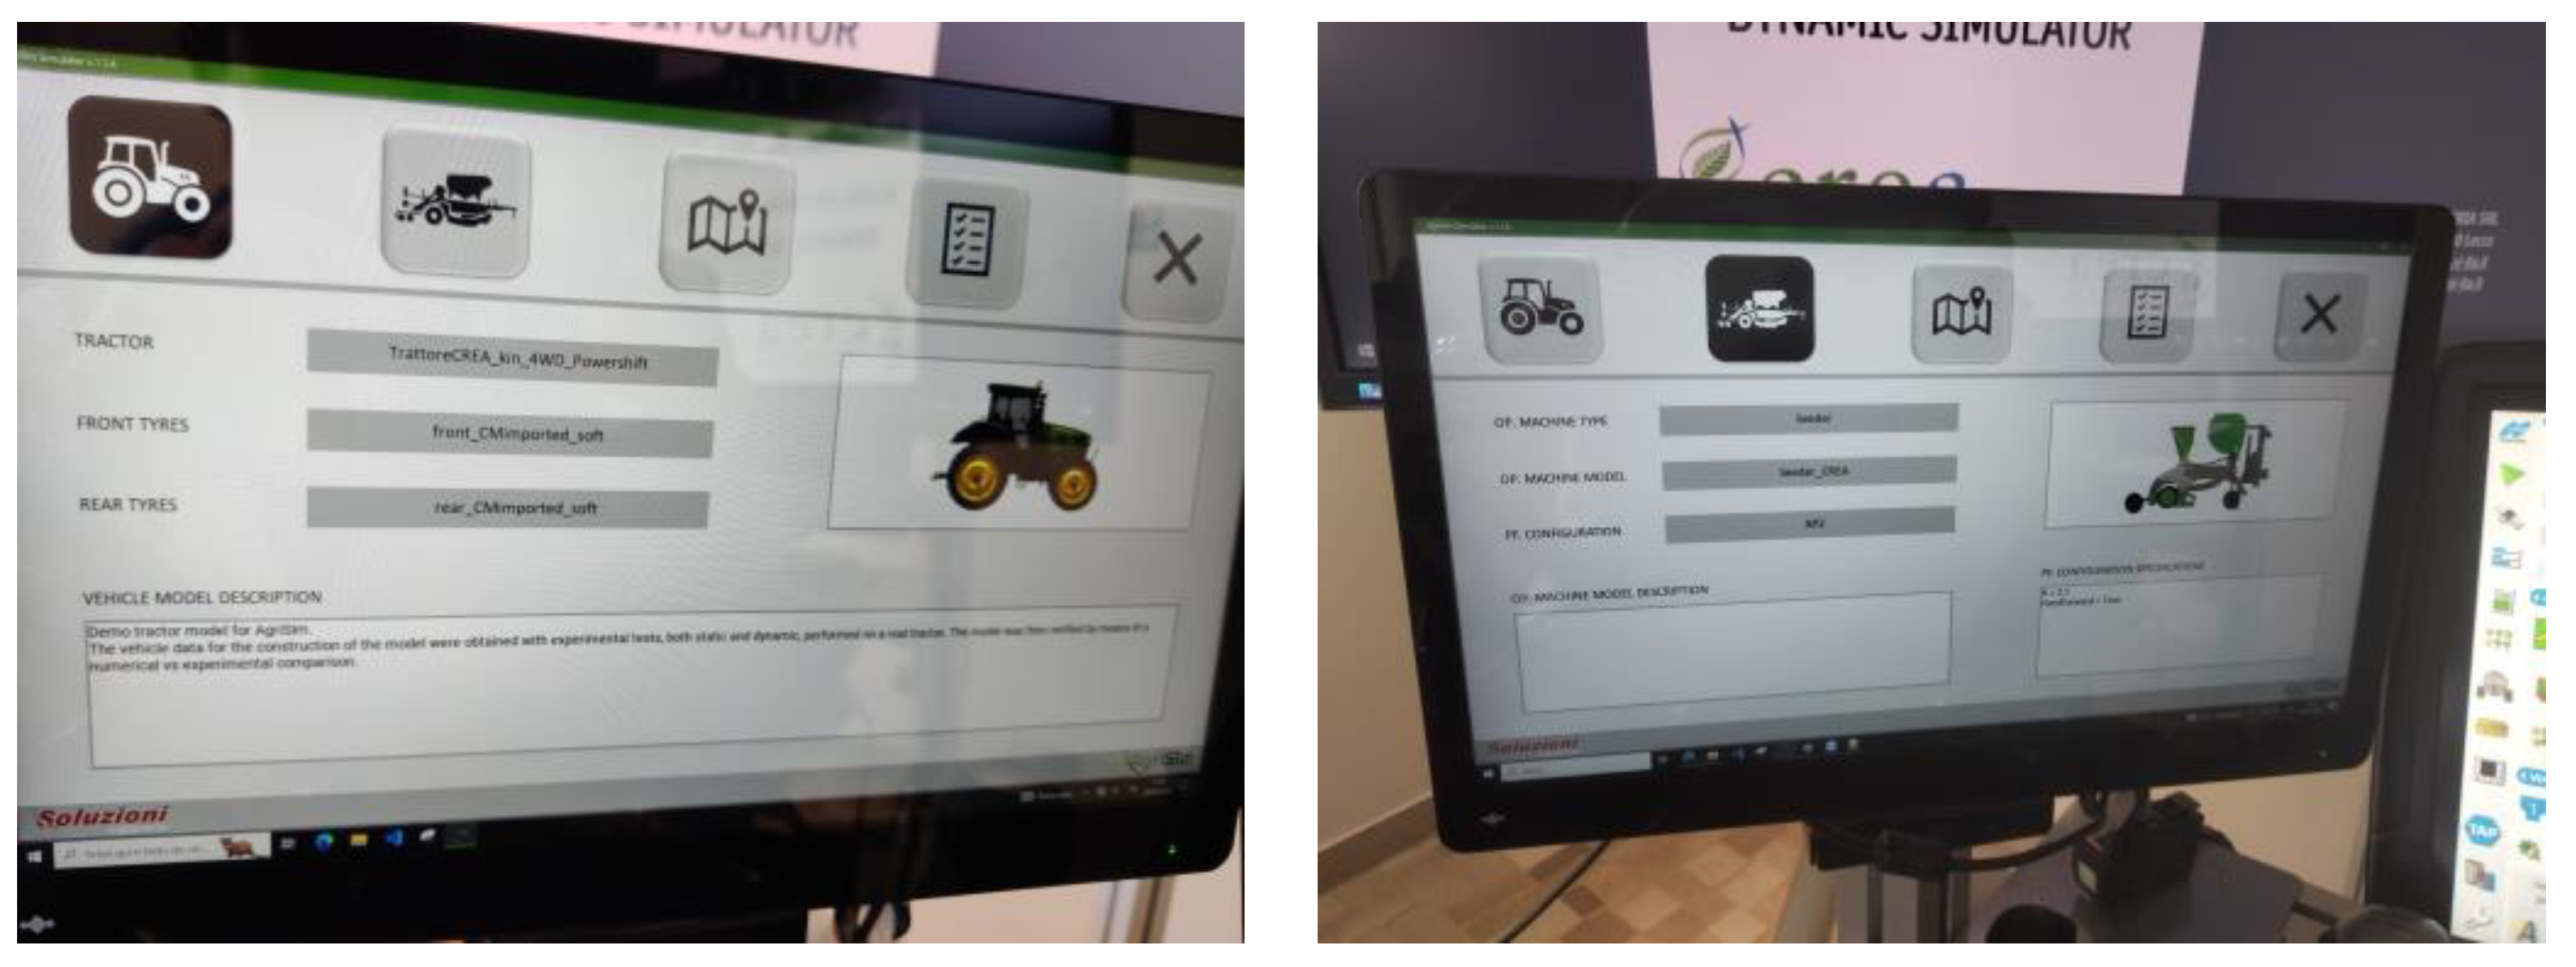
Once the characteristics of the machines have been defined, the software application allows the choice between tractors with manual transmission, power shift or continuously variable (simulated by an automatic with 99 gears); two- or four-wheel drive tractor; rural or city environment; night or day working conditions; auto-guidance or manual; agricultural task; and level of technology of the implement (Figure 11).
The scenario was prepared by choosing the fields worked at the CREA (Figure 12) also for the purpose of validating the simulator to compare the simulated and real data.

4.1.4. The Co-Simulation Software

As described in materials and methods, two aspects of the tractor must be considered during the simulations: the vehicle dynamics and the farming operation. A software able to co-simulate these two aspects has been developed, obtaining as a result, a co-simulation platform called AgriSI.
Regarding vehicle dynamics, AgriSI relies on the CarMaker platform already described in materials and method.
Concerning farming operations, the platform allows to perform virtual operations in georeferenced scenarios, creating and importing real fields, up to obtaining the digital twin of an entire real farm. It is, therefore, possible to carry out agricultural operations on these fields, define vehicles, implement borders, trajectories, and prescription maps, and everything needed to create the virtual environment to simulate the farming operation.
The platform offers a library of tractor models (built starting from experimental tests carried out on real tractors) equipped with a tire model that considers the contact with elasto-plastic soil. All models are fully parameterizable and customizable. The platform follows a hardware-in-the-loop (HIL) approach by including real vehicle ECUs within the simulation.
The included implements are of three types: seeder, sprayer, and centrifugal fertilizer. For each, geometry, number of distributors and sections, power requests from the PTO and resistant forces due to contact with the ground, can be defined. The control logic for the distribution can be imported and tested in both software-in-the-loop (SIL) and HIL approaches. In this case, the models are fully parameterizable and customizable.
The platform also includes a tool to analyze the data acquired during the virtual operation. It is therefore possible to study and evaluate the data generated by the simulation (Figure 13), both for the part relating to vehicle dynamics (speed, accelerations, torques, forces, fuel consumption, etc.) and for the agricultural part (work times, trajectories, quantities of a distributed product, distribution quality as uniformity or as error with respect to the prescription, etc.)
The correctness of the results obtained from the AgriSI simulations has been checked by performing an experimental vs. numerical comparison, as shown in Section 3.3.

4.2. Vehicle Dynamics

The target was to use a reliable vehicle dynamic model for the operation on-field. To ensure this, an agricultural tractor numerical model has been implemented, and results are verified with respect to experimental tests.
Particular attention is provided to tire characterization in both longitudinal and lateral dynamics and for different soils, such as asphalt and field, which are characterized by different properties that affect the vehicle performances. An agricultural tractor must be suitable for working in a field and running on asphalt while reaching the workplace. For this reason, longitudinal and lateral dynamics maneuvers are identified for analyzing the agricultural tractor numerical model: traction on the field (i.e., longitudinal dynamics maneuver representing tractor working conditions) and steering pad on asphalt (i.e., lateral dynamics maneuver representing tractor transportation conditions). Additionally, a coast-down maneuver characterizes tire rolling resistance [34,35]. A detailed description of the methodology and the achieved results have been presented and discussed [36].
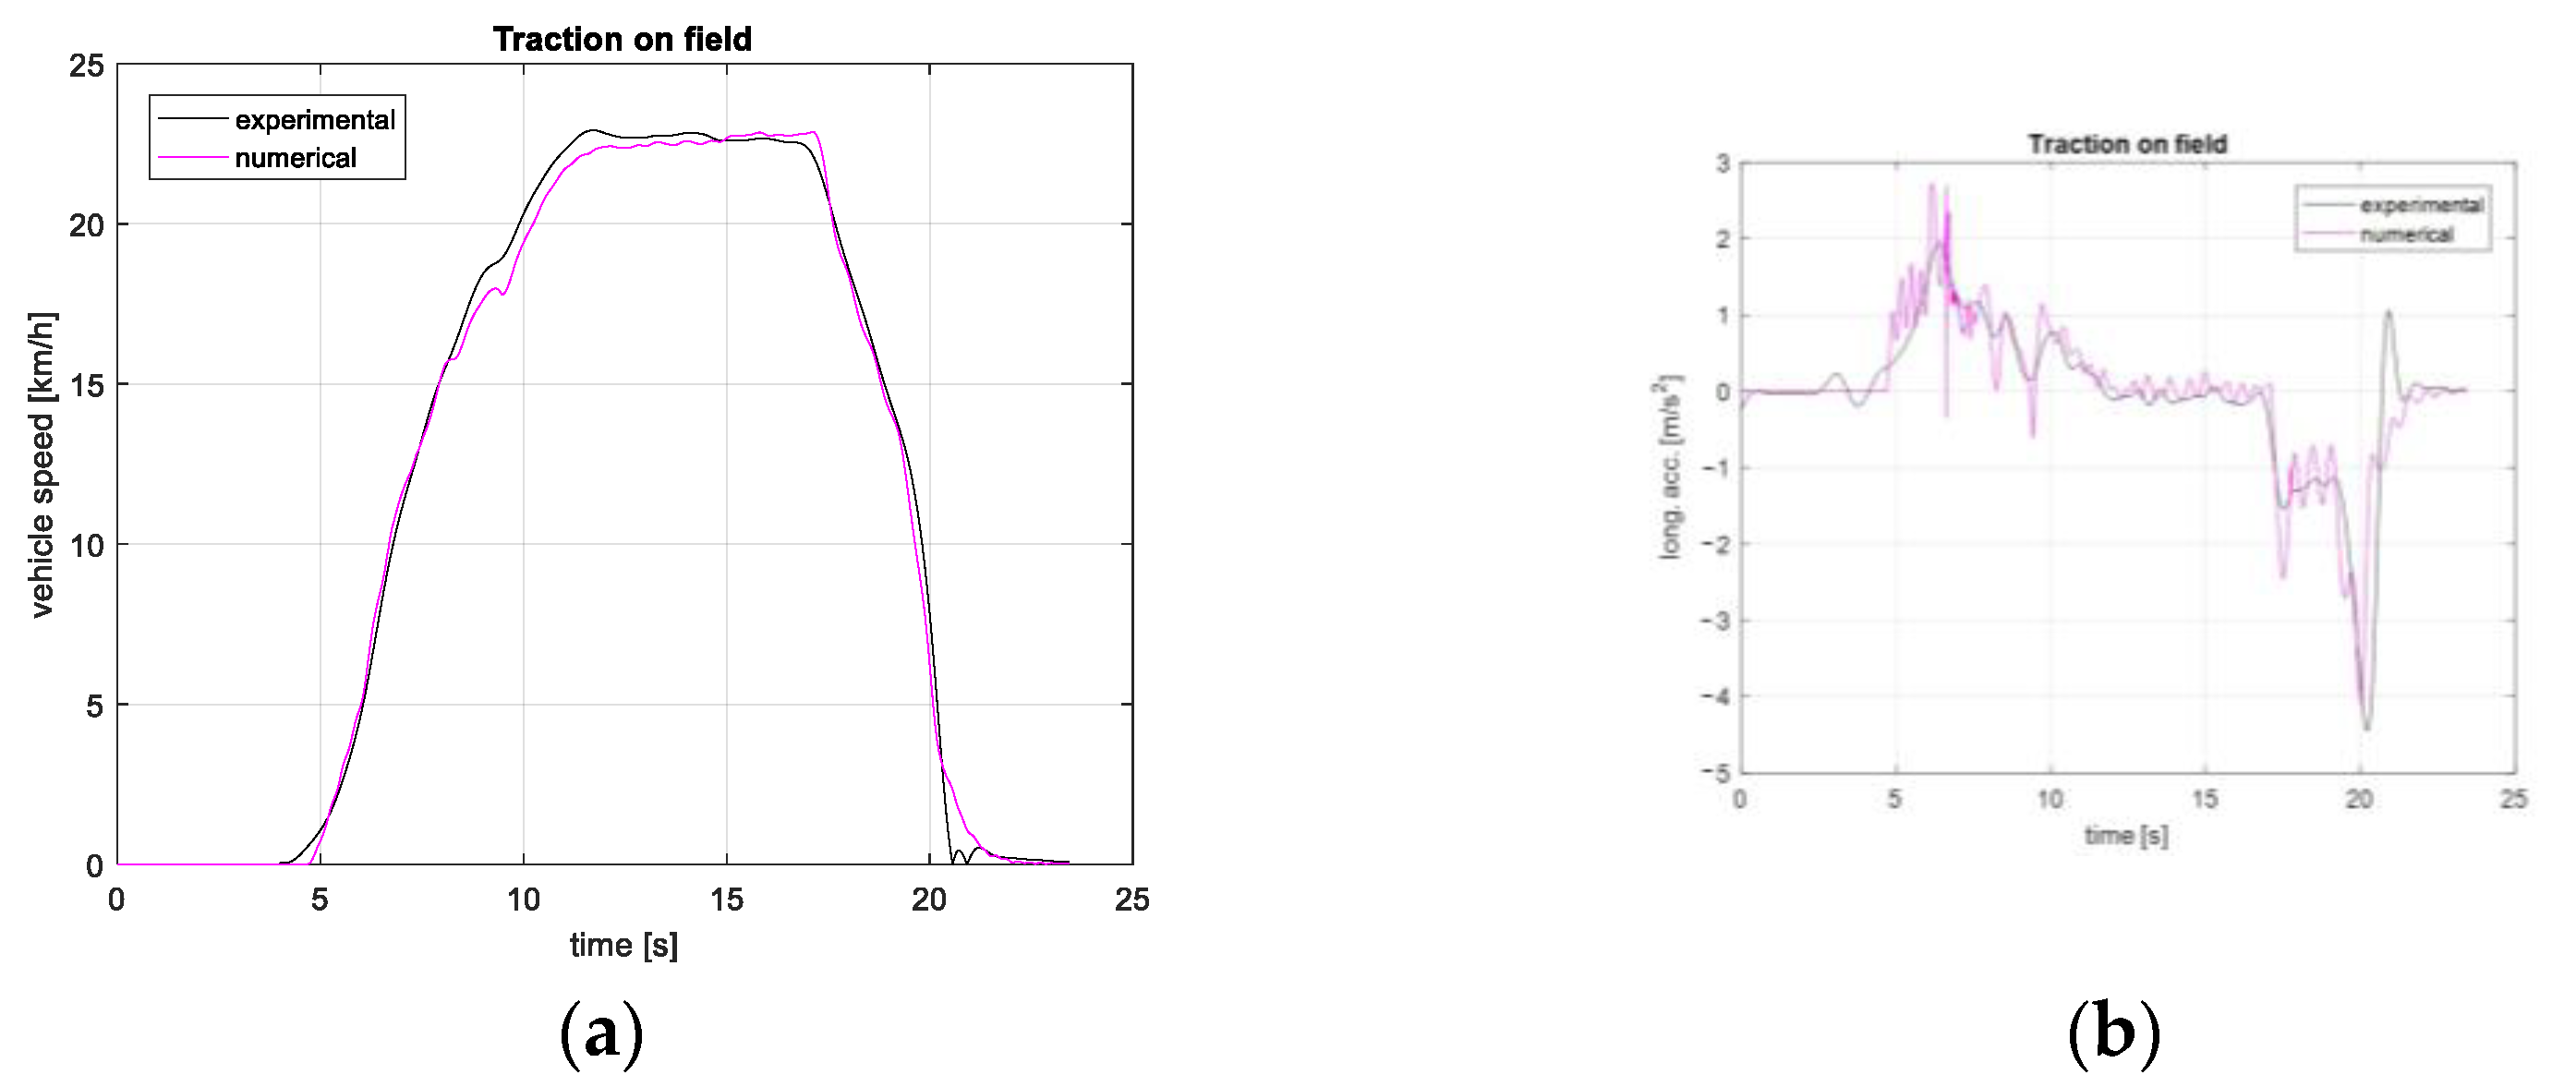
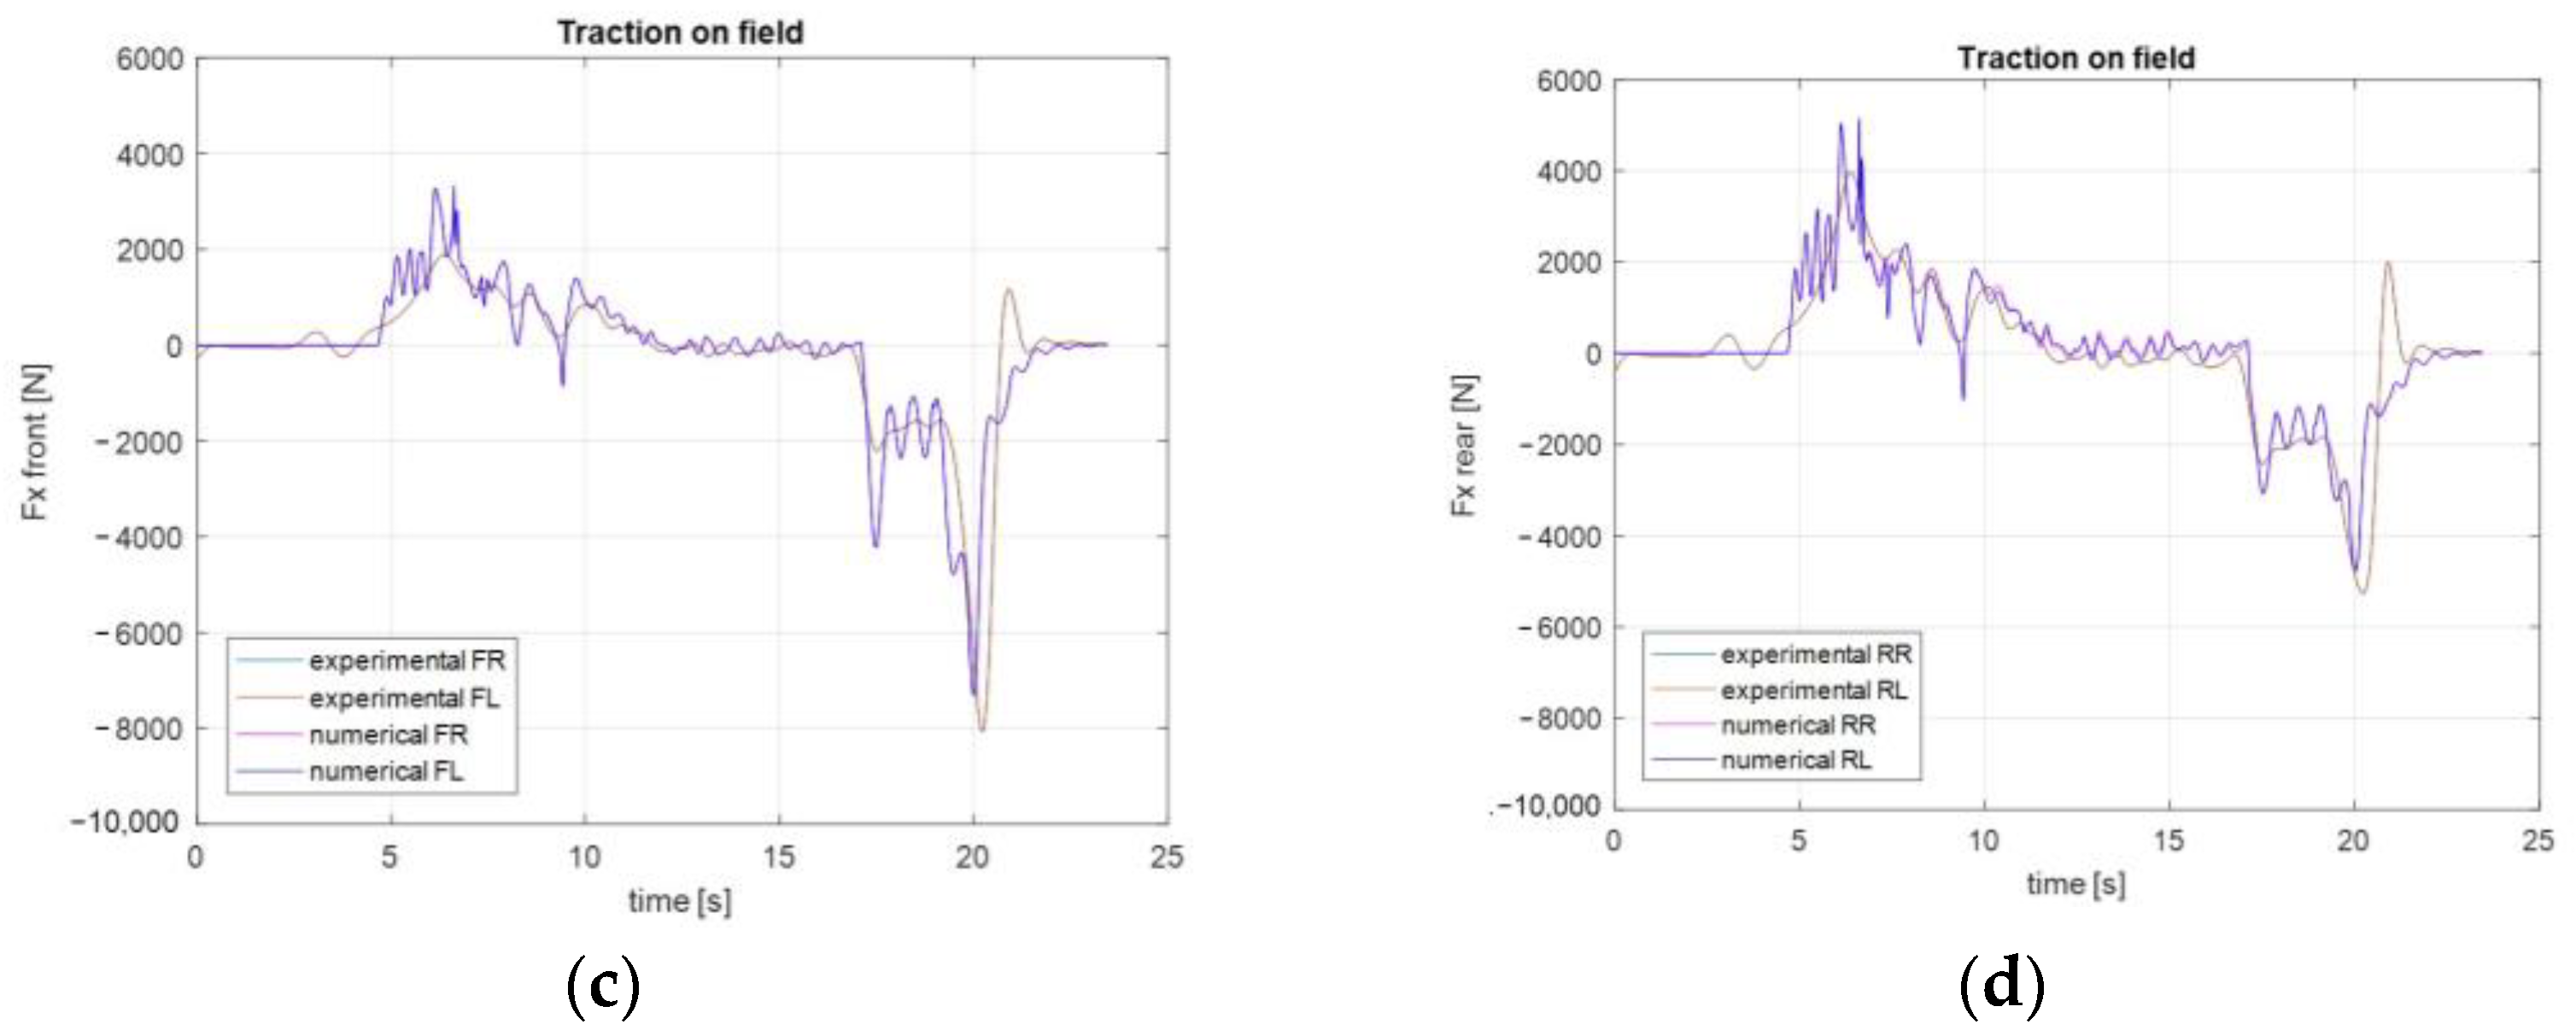
Figure 14 collects the results regarding speed, longitudinal acceleration, and front and rear longitudinal loads for traction on field maneuver from standstill to 22 km h−1 in AWD traction mode. This maneuver simulates the tractor working on the field. Numerical curves lay on experimental curves. Low-frequency oscillations are not present in experimental profiles due to signal filtering.
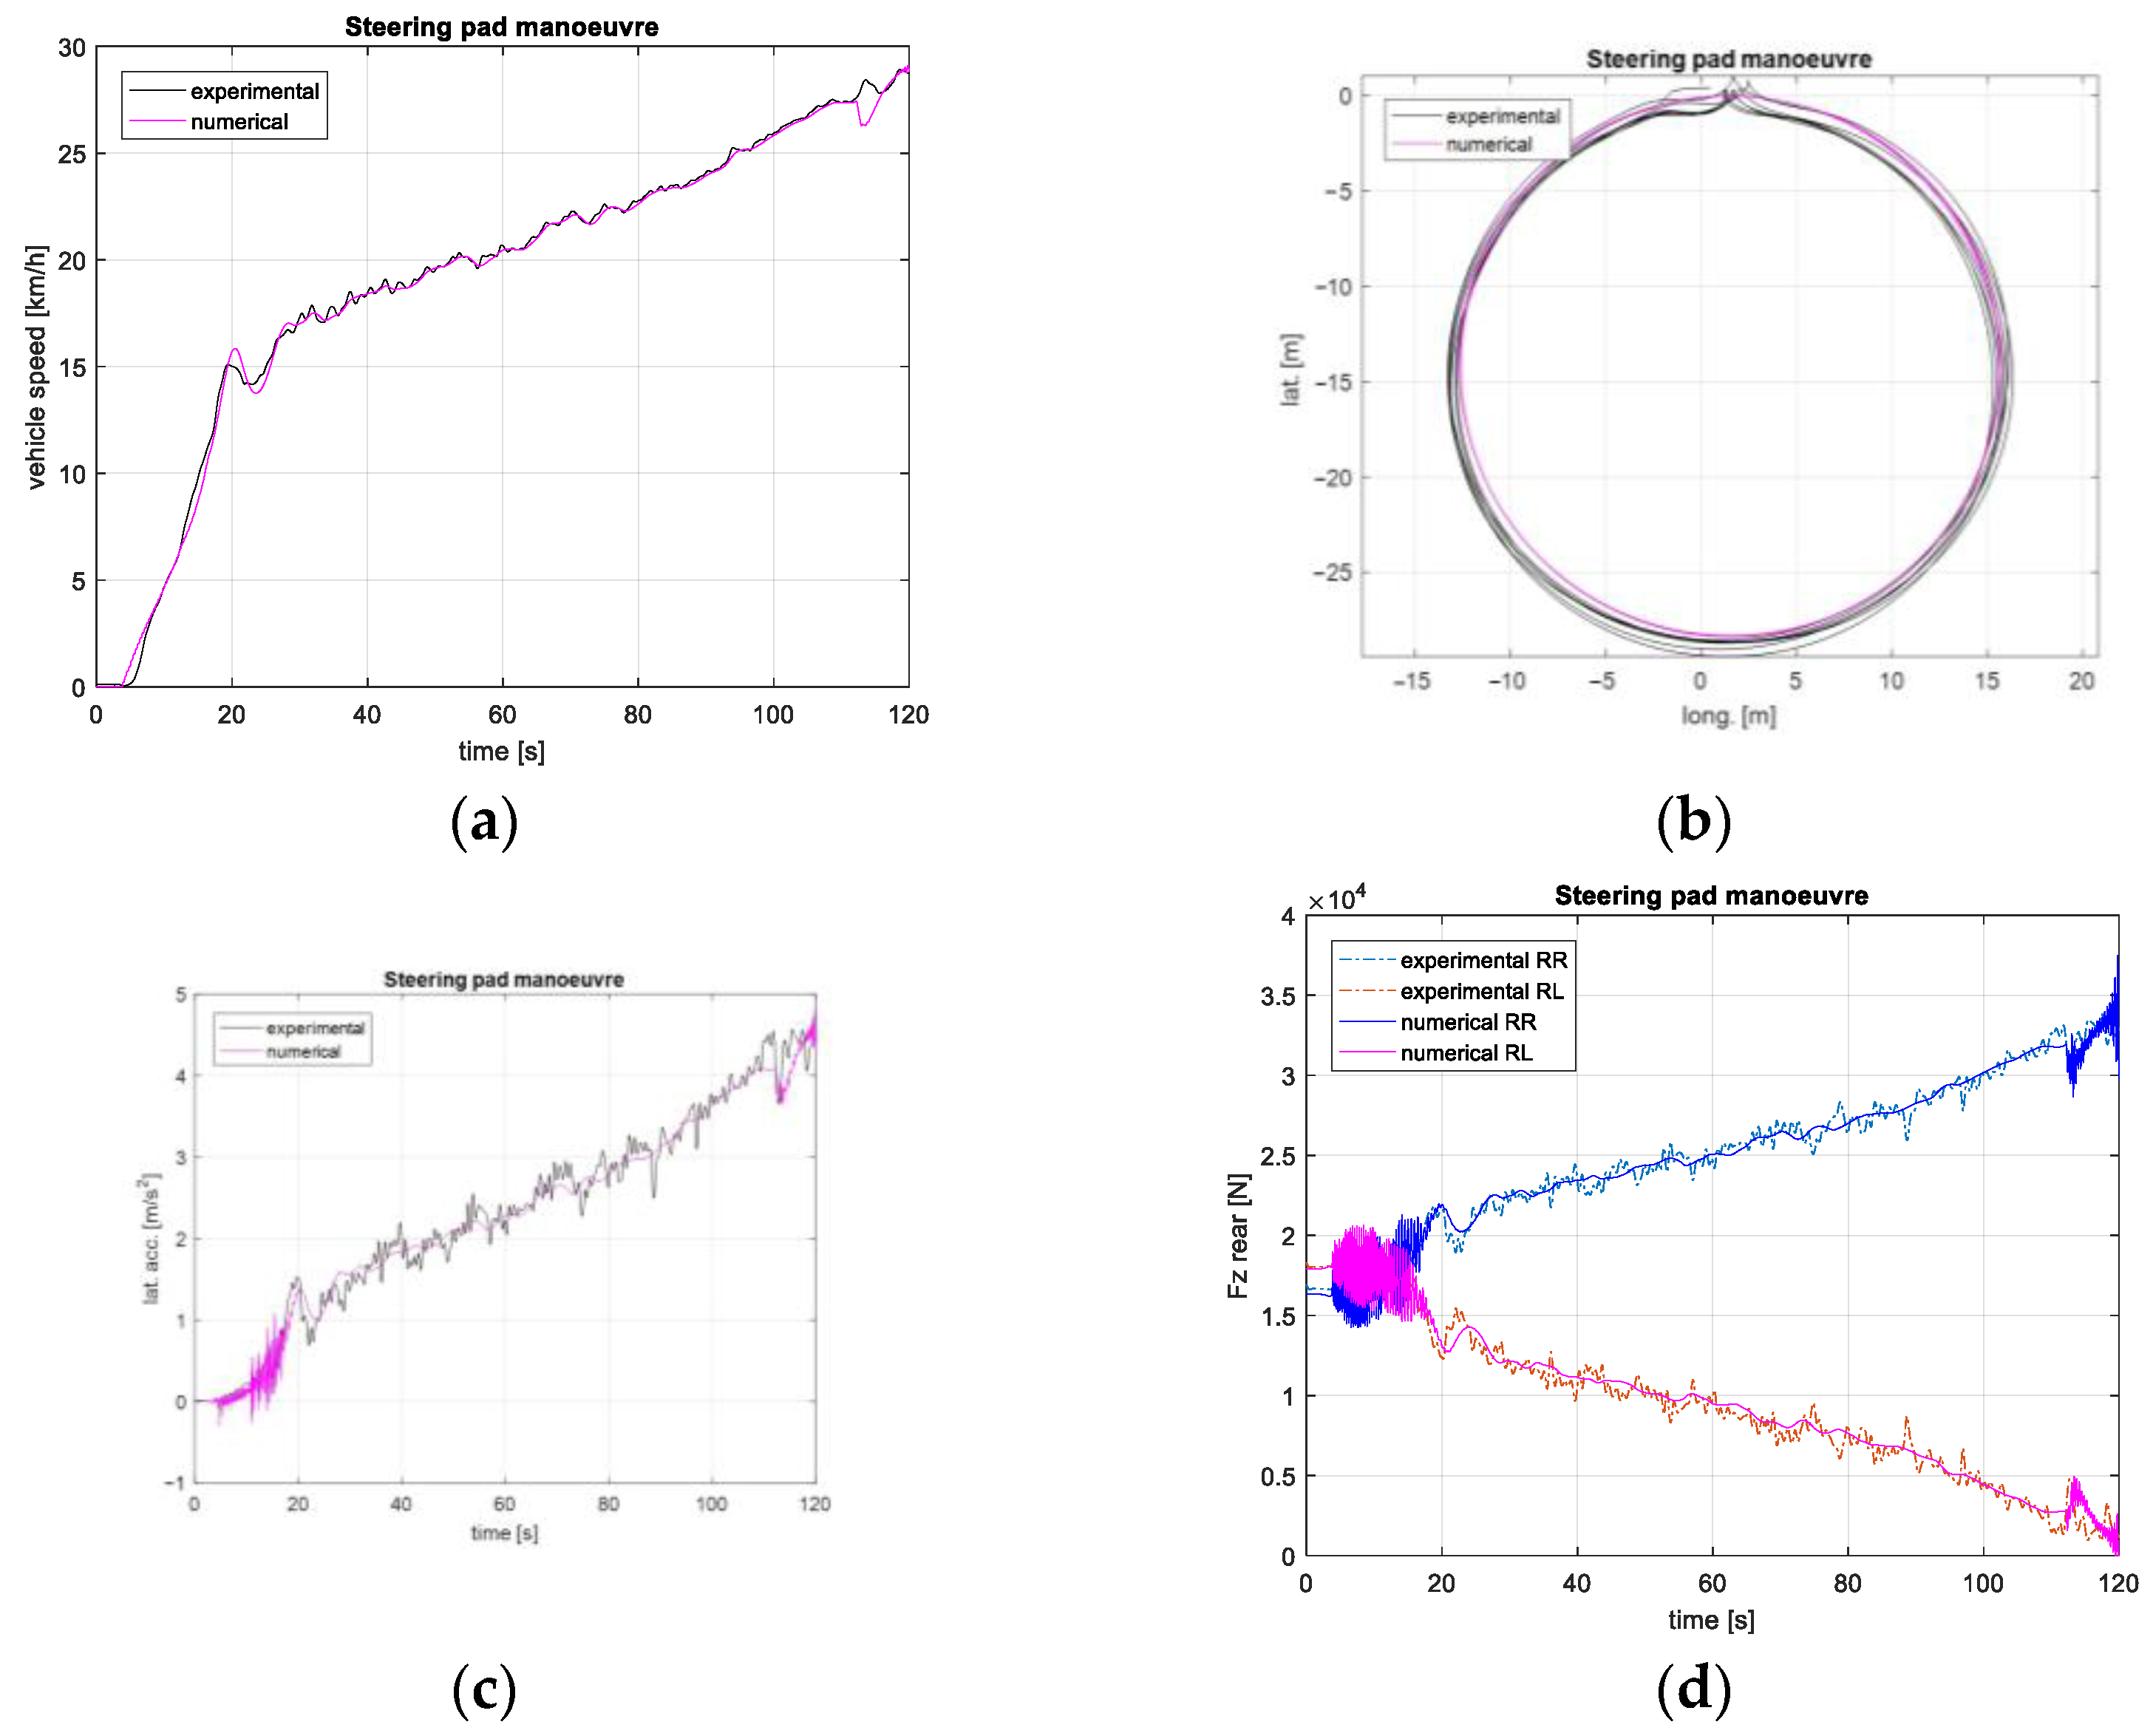
Figure 15 collects the results in terms of speed, imposed trajectory, lateral acceleration, and rear vertical loads for a steering pad maneuver on asphalt from stand still to 30 km h−1 in RWD traction mode. This maneuver simulates the tractor transportation on the road for reaching the working field. Numerical curves lay on experimental curves. Experimental curves oscillations are due to real tractor steering angle correction and not present in numerical profiles since in this last case a trajectory is imposed rather than a steering wheel angle trend to be followed.

4.3. The Experimental Test

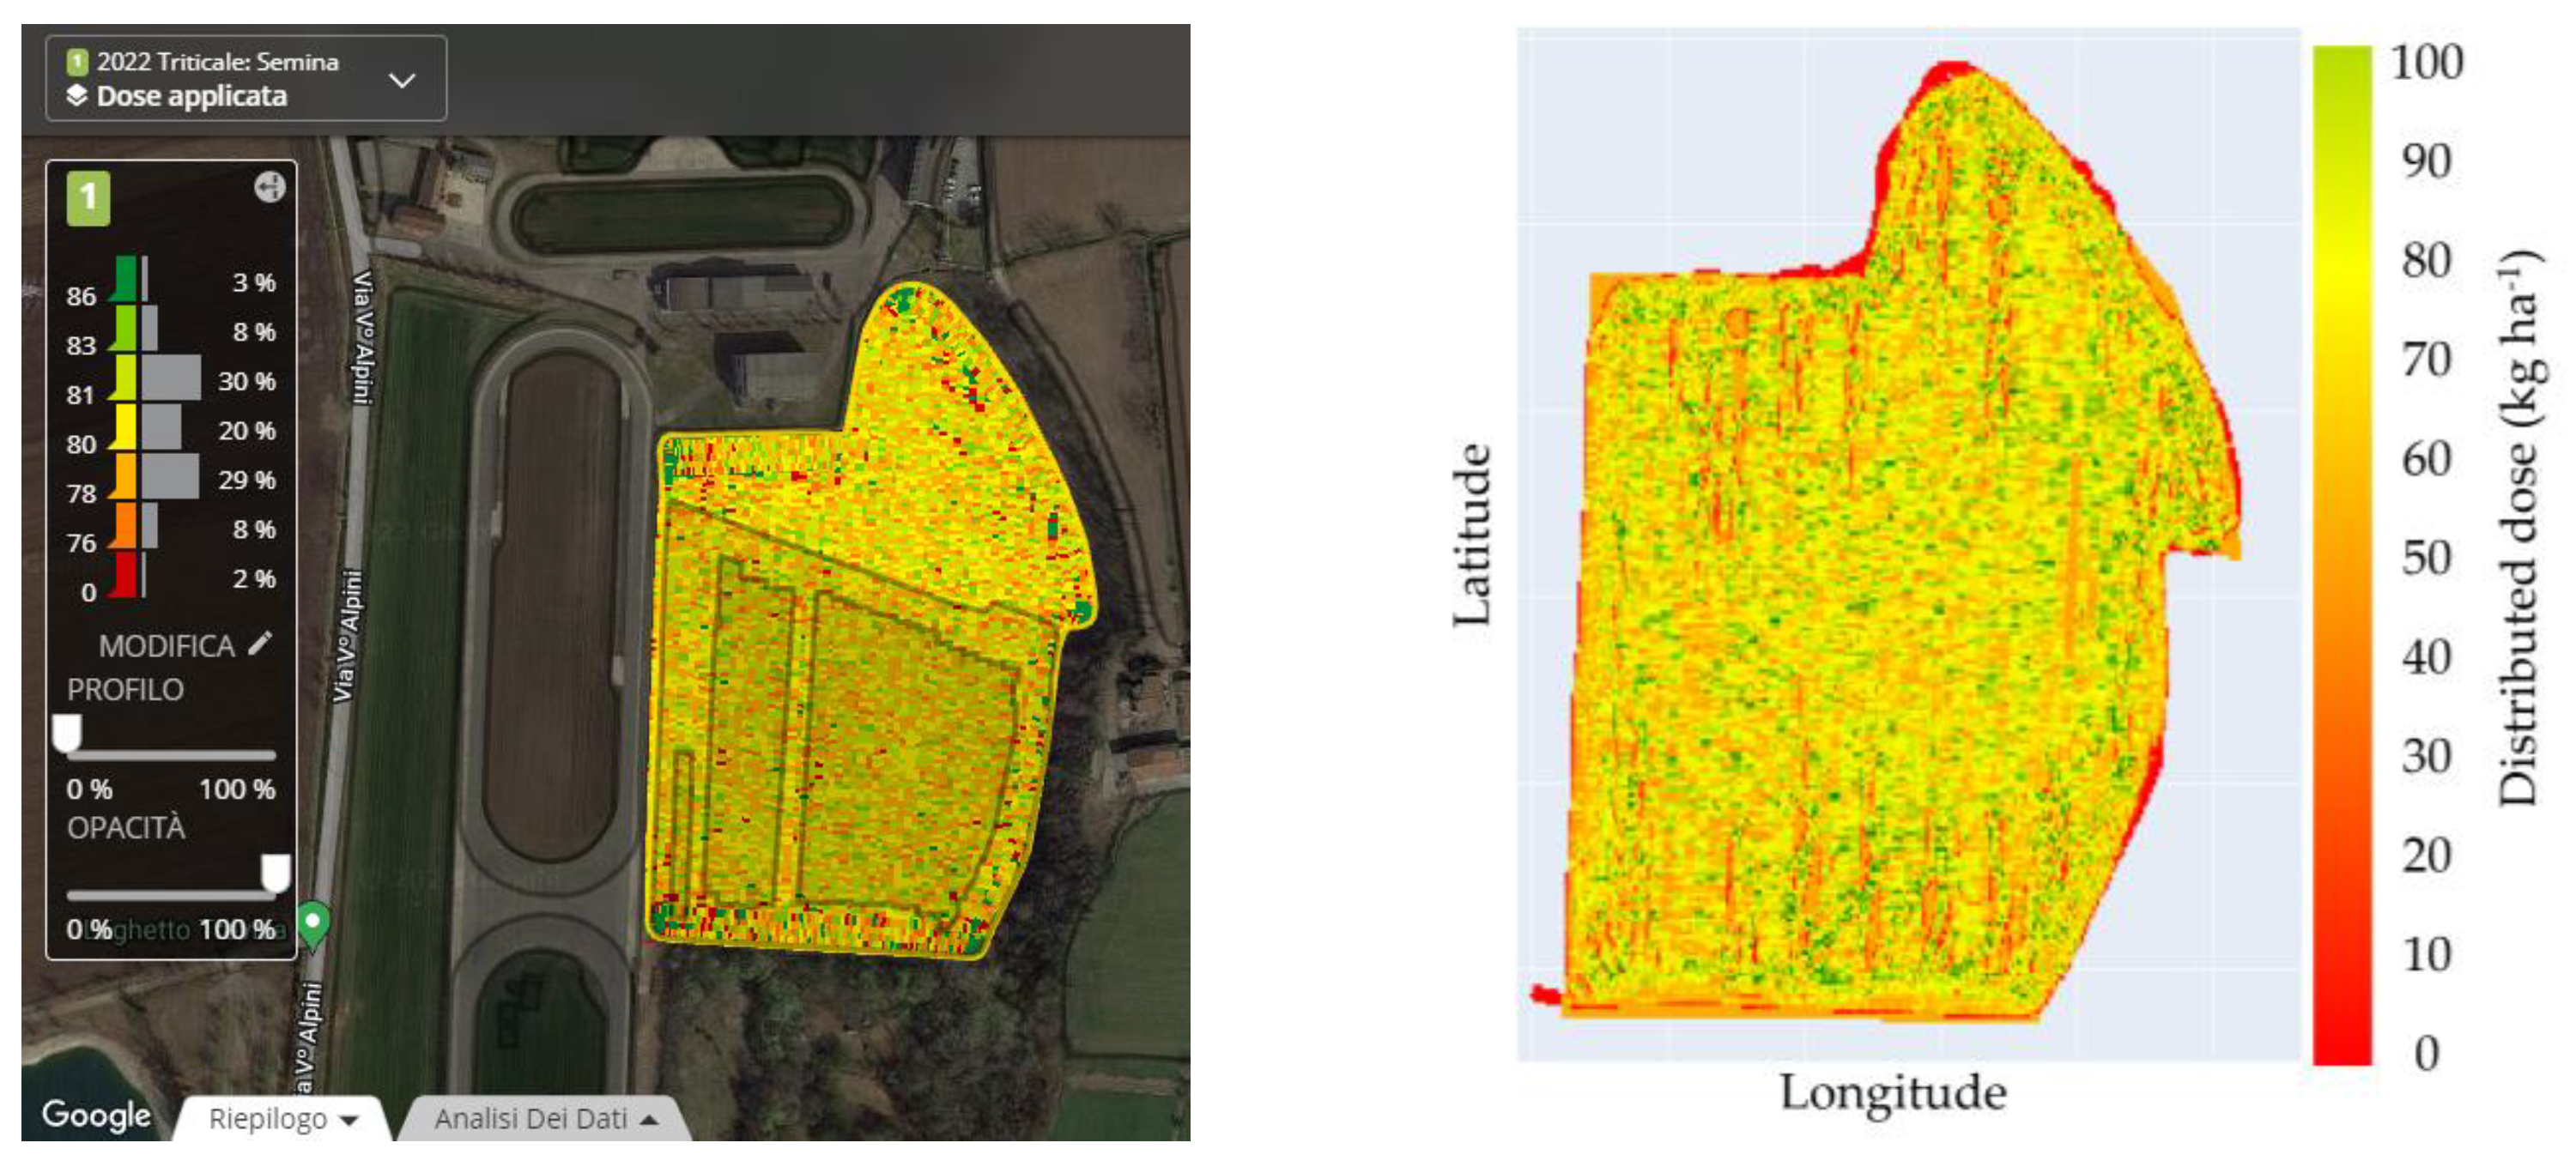
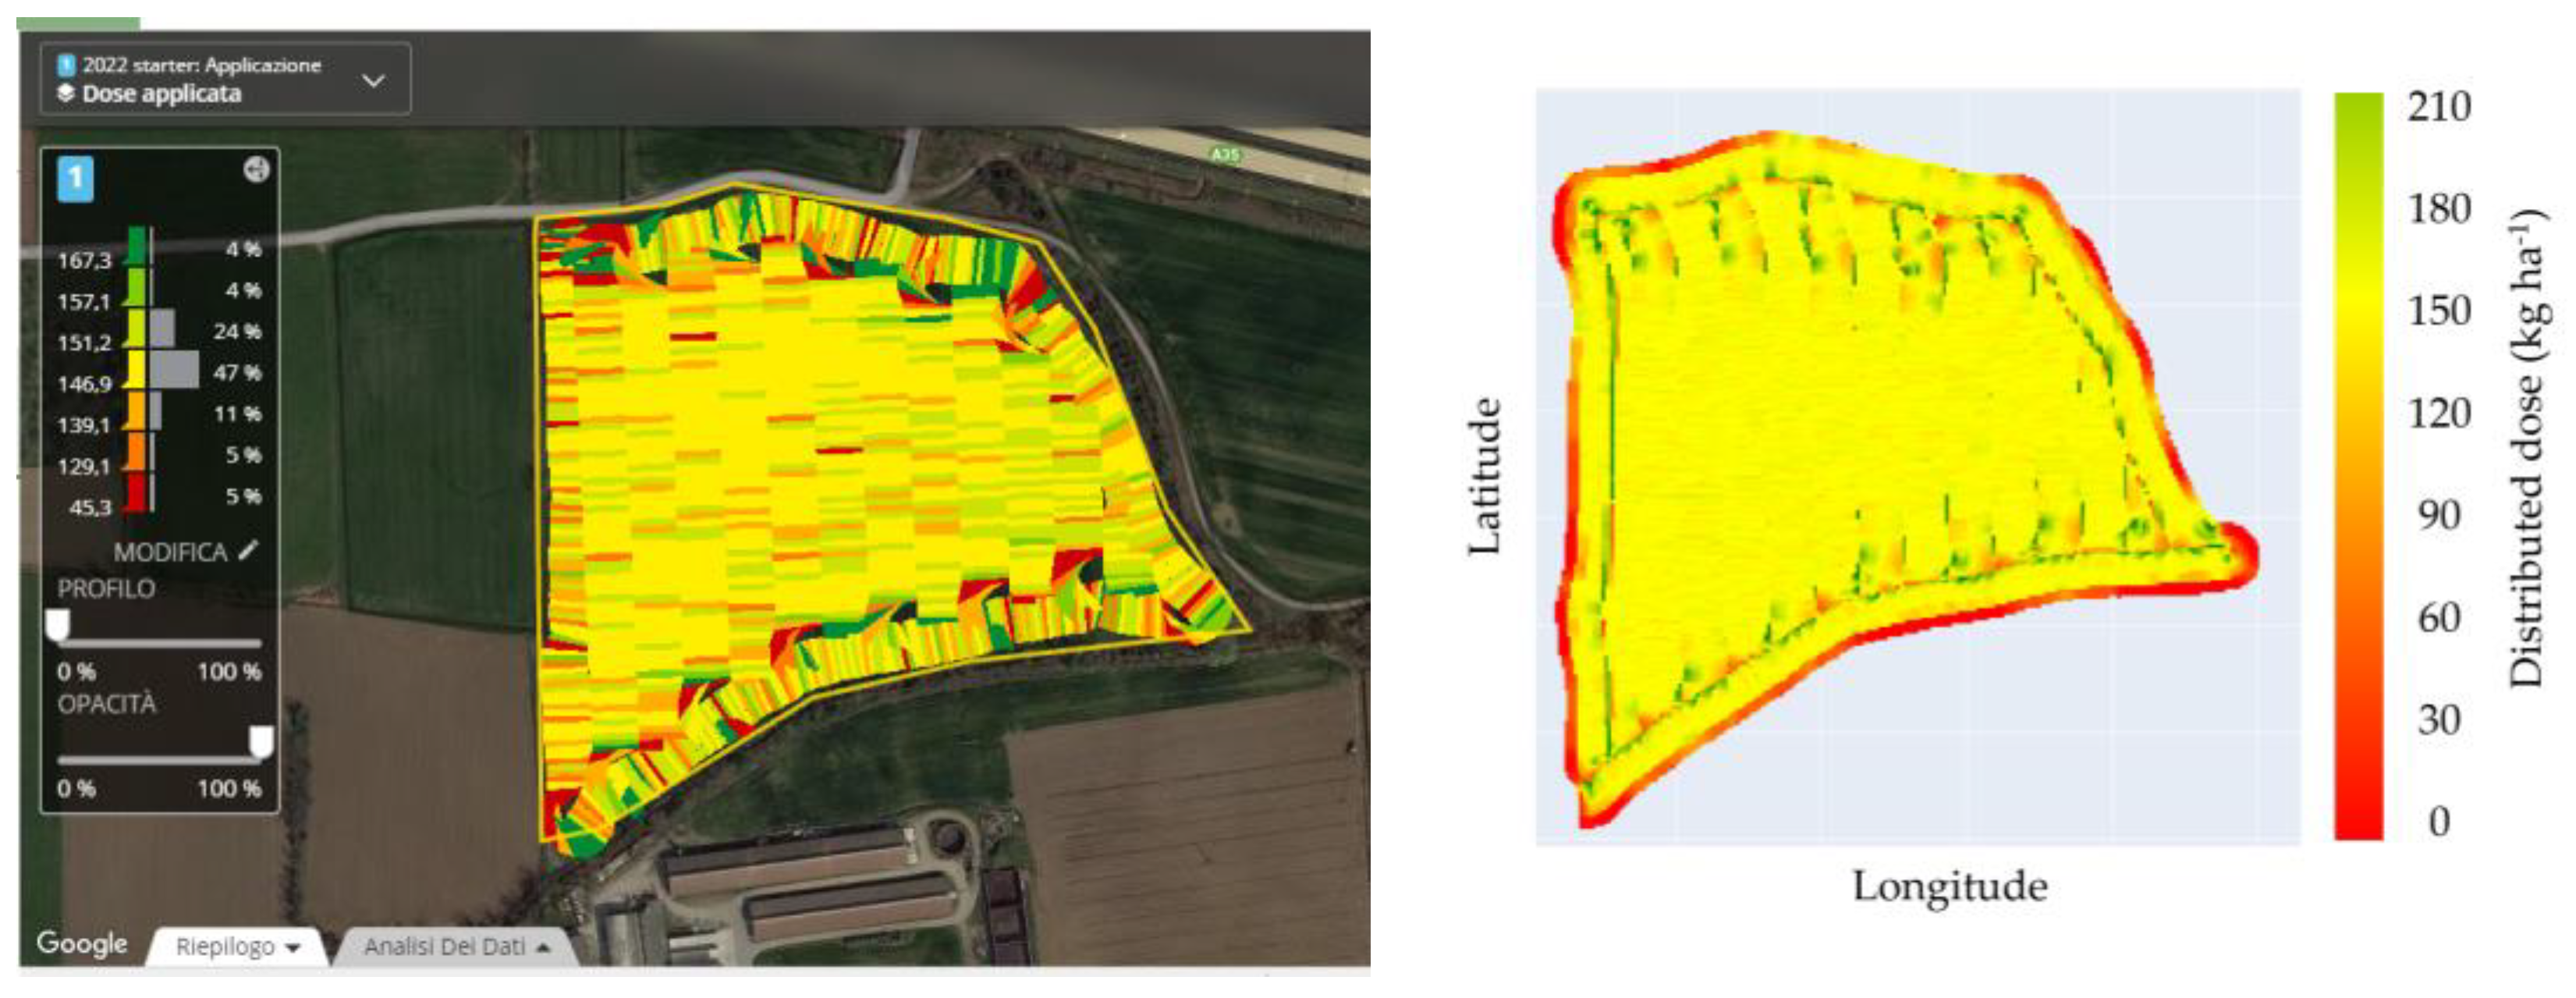
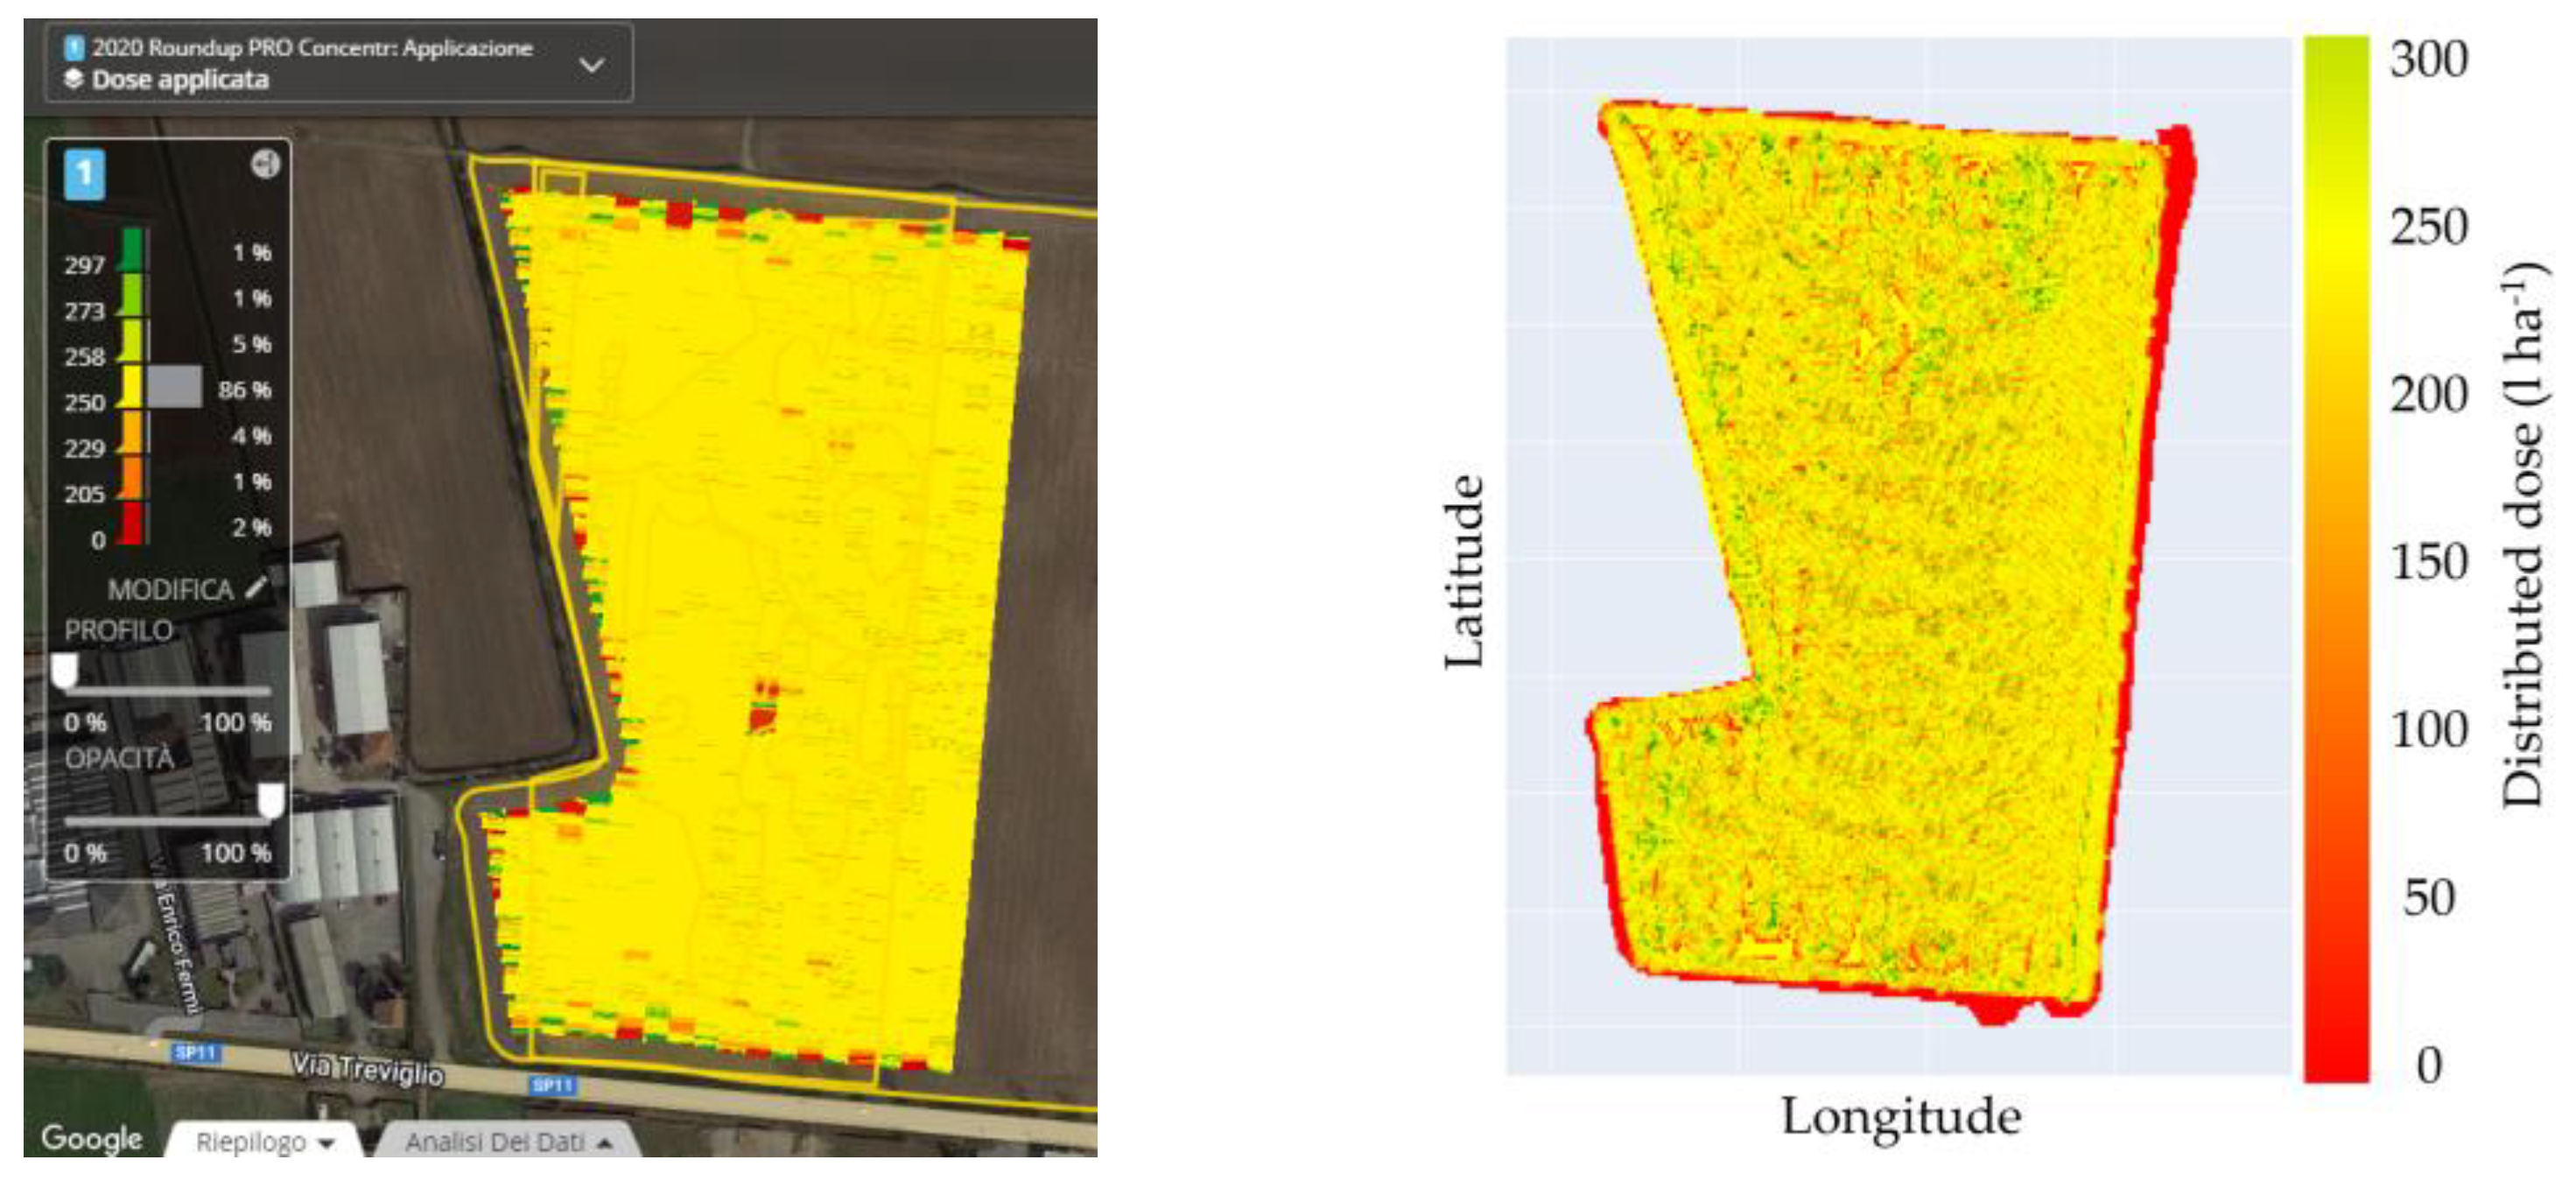
The three operations carried out were successfully reproduced on the simulator. The results are reported graphically for immediate reading as distribution maps in Figure 16, Figure 17 and Figure 18. On the left are the maps generated by the MyJohnDeere© system, and on the right are the simulation results.
The results are reported in terms of worked area (ha), distributed dose (kg ha−1), mean forward speed (km h−1), productivity (ha h−1), and fuel consumption (l h−1) and are reported in Table 2 for the sowing, Table 3 for the fertilizing, and in Table 4 for the spraying.
Although the experience was conducted in only one task for each implement and in the future they may require adjustments in the parameters of the vehicles, they confirm the success in the development of a simulator for precision agriculture 4.0. In the specifics of fuel consumption, it should be considered that, apart the different layout of the machines as shown in Table 4 for the sprayer, the tractor adopted for the power curve in the simulator is not the same tractor with which the operations in the field have been performed.

5. Discussion

A human-in-the-loop approach was evaluated in the development of a simulator for precision agriculture. A static simulator (SimAgri) was purpose designed realized reproducing an agricultural tractor driving environment and used to emulate in-field operations. Vehicle and implement dynamics models have been implemented and correlated with experimental data. A software developed for PA simulation (AgriSI©) was used to quantify and rank operations’ results between several variants. The tool has been demonstrated to be effective in reproducing real tests and will be adopted for training tasks and to investigate the advantages of digital agriculture.

Author Contributions

Conceptualization, P.M., A.A., C.B., M.C. and F.P.; methodology, P.M., A.A., C.B., M.C., E.L., M.P. and F.P.; software, M.P., C.M. and E.L.; validation, M.C., E.R., C.M., A.B., E.L. and M.P.; formal analysis, M.C., E.R., C.M., E.L., M.P. and M.B.; investigation, P.M., A.A., C.B., M.C., A.M. and F.P.; resources, P.M. and C.B.; data curation, M.C., E.R., A.B., C.M., E.L., M.P. and M.B.; writing—original draft preparation, M.C., C.M., E.L., M.B, A.B., A.M. and C.B.; supervision, P.M. and C.B.; project administration, P.M. and C.B.; funding acquisition, P.M. All authors have read and agreed to the published version of the manuscript.

Funding

This research has been supported by the Italian Ministry of Agriculture, Food Sovereignty and Forests (MASAF) as part of the “AGRIDIGIT” project, “AGROFILIERE” sub-project (Decree n. 36503 of 20 December 2018).

Data Availability Statement

Data are available from the authors.

Acknowledgments

The authors would like to thank, for their technical support: Gianluigi Rozzoni, Ivan Carminati, Alex Filisetti and Elia Premoli (CREA-IT, Treviglio, Bergamo, Italy).

Conflicts of Interest

The authors declare no conflict of interest.

References

  1. Gebbers, R.; Adamchuk, V.I. Precision agriculture and food security. Science 2010, 327, 828–831. [Google Scholar] [CrossRef]
  2. Pierce, F.J.; Nowak, P. Aspects of precision agriculture. Adv. Agron. 1999, 67, 1–85. [Google Scholar] [CrossRef]
  3. Olson, K.D. Precision agriculture: Current economic and environmental issues. In Proceedings of the Sixth Joint Conference, Minneapolis, MN, USA, 31 August–2 September 1998; pp. 213–220. [Google Scholar]
  4. Wolfert, S.; Goense, D.; Sørensen, C.A.G. A future internet collaboration platform for safe and healthy food from farm to fork. In Proceedings of the 2014 Annual SRII Global Conference, San Jose, CA, USA, 23–25 April 2014; pp. 266–273. [Google Scholar] [CrossRef]
  5. Zarco Tejada, P.J.; Hubbard, N.; Loudjani, P. Precision Agriculture: An Opportunity for E.U. Farmers Potential Support with the CAP 2014–2020; Joint Research Centre (JRC) of the European Commission, Monitoring Agriculture Resources (MARS) Unit H04: Brussels, Belgium, 2014. [Google Scholar]
  6. Balafoutis, A.; Beck, B.; Fountas, S.; Vangeyte, J.; Wal, T.V.d.; Soto, I.; Gómez-Barbero, M.; Barnes, A.; Eory, V. Precision Agriculture Technologies Positively Contributing to GHG Emissions Mitigation, Farm Productivity and Economics. Sustainability 2017, 9, 1339. [Google Scholar] [CrossRef] [Green Version]
  7. Van Evert, F.K.; Gaitán-Cremaschi, D.; Fountas, S.; Kempenaar, C. Can Precision Agriculture Increase the Profitability and Sustainability of the Production of Potatoes and Olives? Sustainability 2017, 9, 1863. [Google Scholar] [CrossRef] [Green Version]
  8. Stoorvogel, J.J.; Kooistra, L.; Bouma, J. Managing Soil Variability at Different Spatial Scales as a basis for precision agriculture. In Soil-Specific Farming Precision Agriculture, 1st ed.; Lal, R., Stewart, B.A., Eds.; CRC Press: Boca Raton, FL, USA, 2015; pp. 37–72. [Google Scholar] [CrossRef]
  9. Miller, N.; Griffin, T.; Bergtold, J. Kansas Farms’ Sequence of Information-Intensive Precision Agriculture Technology Adoption in Bundles; Kansas State University Department of Agricultural Economics: Manhattan, KS, USA, 2016. [Google Scholar]
  10. Bucci, G.; Bentivoglio, D.; Finco, A.; Belletti, M. Exploring the impact of innovation adoption in agriculture: How and where Precision Agriculture Technologies can be suitable for the Italian farm system? IOP Conf. Ser. Earth Environ. Sci. 2019, 275, 012004. [Google Scholar] [CrossRef]
  11. Miller, N.J.; Griffin, T.W.; Ciampitti, I.A.; Sharda, A. Farm adoption of embodied knowledge and information intensive precision agriculture technology bundles. Precis. Agric. 2019, 20, 348–361. [Google Scholar] [CrossRef]
  12. Haapala, H.E.S. Speeding up innovation in agricultural. It. J. Agric. Eng. 2013, 44, 137–139. [Google Scholar] [CrossRef]
  13. Brambilla, M.; Romano, E.; Toscano, P.; Cutini, M.; Biocca, M.; Ferré, C.; Comolli, R.; Bisaglia, C. From Conventional to Precision Fertilization: A Case Study on the Transition for a Small-Medium Farm. Agri. Eng. 2021, 3, 29. [Google Scholar] [CrossRef]
  14. Caffaro, F.; Cavallo, E. The Effects of Individual Variables, Farming System Characteristics and Perceived Barriers on Actual Use of Smart Farming Technologies: Evidence from the Piedmont Region, Northwestern Italy. Agriculture 2019, 9, 111. [Google Scholar] [CrossRef] [Green Version]
  15. Cutini, M.; Romano, E.; Assirelli, A.; Bisaglia, C.; Brambilla, M. Evaluation of Precision Sprayer Technologies Practical Application. In AIIA 2022: Biosystems Engineering towards the Green Deal; Lecture Notes in Civil Engineering; Springer Nature: Cham, Switzerland, 2023; pp. 509–516. [Google Scholar] [CrossRef]
  16. Lee, H.G.; Chung, S.; Lee, W.H. Presence in virtual golf simulators: The effects of presence on perceived enjoyment, perceived value, and behavioral intention. New Media Soc. 2013, 15, 930–946. [Google Scholar] [CrossRef]
  17. Milgram, P.; Kishino, F. A taxonomy of mixed reality visual displays. IEICE Trans. Inf. Syst. 1994, 77, 1321–1329. [Google Scholar]
  18. Bevilacqua, R.; Maranesi, E.; Riccardi, G.R.; Di Donna, V.; Pelliccioni, P.; Luzi, R.; Lattanzio, F.; Pelliccioni, G. Non-immersive virtual reality for rehabilitation of the older people: A systematic review into efficacy and effectiveness. J. Clin. Med. 2019, 8, 1882. [Google Scholar] [CrossRef] [Green Version]
  19. Olstam, J.; Espié, S. Combination of autonomous and controlled vehicles in driving simulator scenarios. In Proceedings of the RSS, Rome, Italy, 7–9 November 2007. [Google Scholar]
  20. Swanson, K.S.; Brown, A.A.; Brennan, S.N.; LaJambe, C.M. Extending driving simulator capabilities toward hardware-in-the-loop testbeds and remote vehicle interfaces. In Proceedings of the 2013 IEEE Intelligent Vehicles Symposium Workshops (IV Workshops), Gold Coast, QLD, Australia; 2013; pp. 115–120. [Google Scholar] [CrossRef]
  21. Fathy, H.K.; Folip, Z.S.; Hagena, J.; Stein, J.L. Review of hardware-in-the-loop simulation and its prospects in the automotive area. In Modeling and Simulation for Military Applications Bellingham; SPIE: Washington, DC, USA, 2006; Volume 6228, pp. 117–136. [Google Scholar] [CrossRef]
  22. Onesti, P. Combination of Human- and Hardware-in-the-Loop Testing Reduces Development Time. ATZ Autotechnol. 2009, 9, 32–37. [Google Scholar] [CrossRef]
  23. Krepelka, M.; Vrany, J. Synthesizing Vehicle Speed-Related Features with Neural Networks. Vehicles 2023, 5, 40. [Google Scholar] [CrossRef]
  24. Piromalis, D.; Kantaros, A. Digital Twins in the Automotive Industry: The Road toward Physical-Digital Convergence. Appl. Syst. Innov. 2022, 5, 65. [Google Scholar] [CrossRef]
  25. Ibrahim, M.; Rassõlkin, A.; Vaimann, T.; Kallaste, A. Overview on Digital Twin for Autonomous Electrical Vehicles Propulsion Drive System. Sustainability 2022, 14, 601. [Google Scholar] [CrossRef]
  26. Purcell, W.; Neubauer, T. Digital Twins in Agriculture: A State-of-the-art review. Smart Agric. Technol. 2023, 3, 100094. [Google Scholar] [CrossRef]
  27. Kritzinger, W.; Karner, M.; Traar, G.; Henjes, J.; Sihn, W. Digital twin in manufacturing: A categorical literature review and classification. IFAC-PapersOnLine 2018, 51, 1016–1022. [Google Scholar] [CrossRef]
  28. Tsolakis, N.; Bechtsis, D.; Bochtis, D. AgROS: A Robot Operating System Based Emulation Tool for Agricultural Robotics. Agronomy 2019, 9, 403. [Google Scholar] [CrossRef] [Green Version]
  29. Verdouw, C.; Tekinerdogan, B.; Beulens, A.; Wolfert, S. Digital twins in smart farming. Agric. Syst. 2021, 189, 103046. [Google Scholar] [CrossRef]
  30. MIPAAF. Consultazione Pubblica Linee Guida per Agricoltura di Precisione. (Public Consultation on Precision Farming Guidelines). 2016. Available online: https://www.politicheagricole.it/flex/cm/pages/ServeBLOB.php/L/IT/IDPagina/10349 (accessed on 6 March 2013).
  31. Pylianidis, C.; Osinga, S.; Athanasiadis, I.N. Introducing digital twins to agriculture. Comput. Electron. Agric. 2021, 184, 105942. [Google Scholar] [CrossRef]
  32. OECD Code 2:2020; OECD Standard Code for the Official Testing of Agricultural and Forestry Tractor Performance. OECD: Paris, France, 2020.
  33. ASAE D497.7 Mar2011 (R2020); Agricultural Machinery Management Data. American Society of Agricultural and Biological Engineers: St. Joseph, MI, USA, 2011.
  34. Kim, C.; Lee, H.; Park, Y.; Myung, C.-L.; Park, S. Study on the Criteria for the Determination of the Road Load Correlation for Automobiles and an Analysis of Key Factors. Energies 2016, 9, 575. [Google Scholar] [CrossRef] [Green Version]
  35. IS 14785:2000; Determination of Road-Load Constants by Coast Down Test Method. Bureau of Indian Standards: New Delhi, India, 2000; Reaffirmed 2005.
  36. Leo, E.; Maroni, C.; Pezzola, E. On Road and on Field Agricultural Tractor Tires on Board Identification. In Proceedings of the JSAE Annual Congress, Yokohama, Japan, 24–26 May 2023. [Google Scholar]
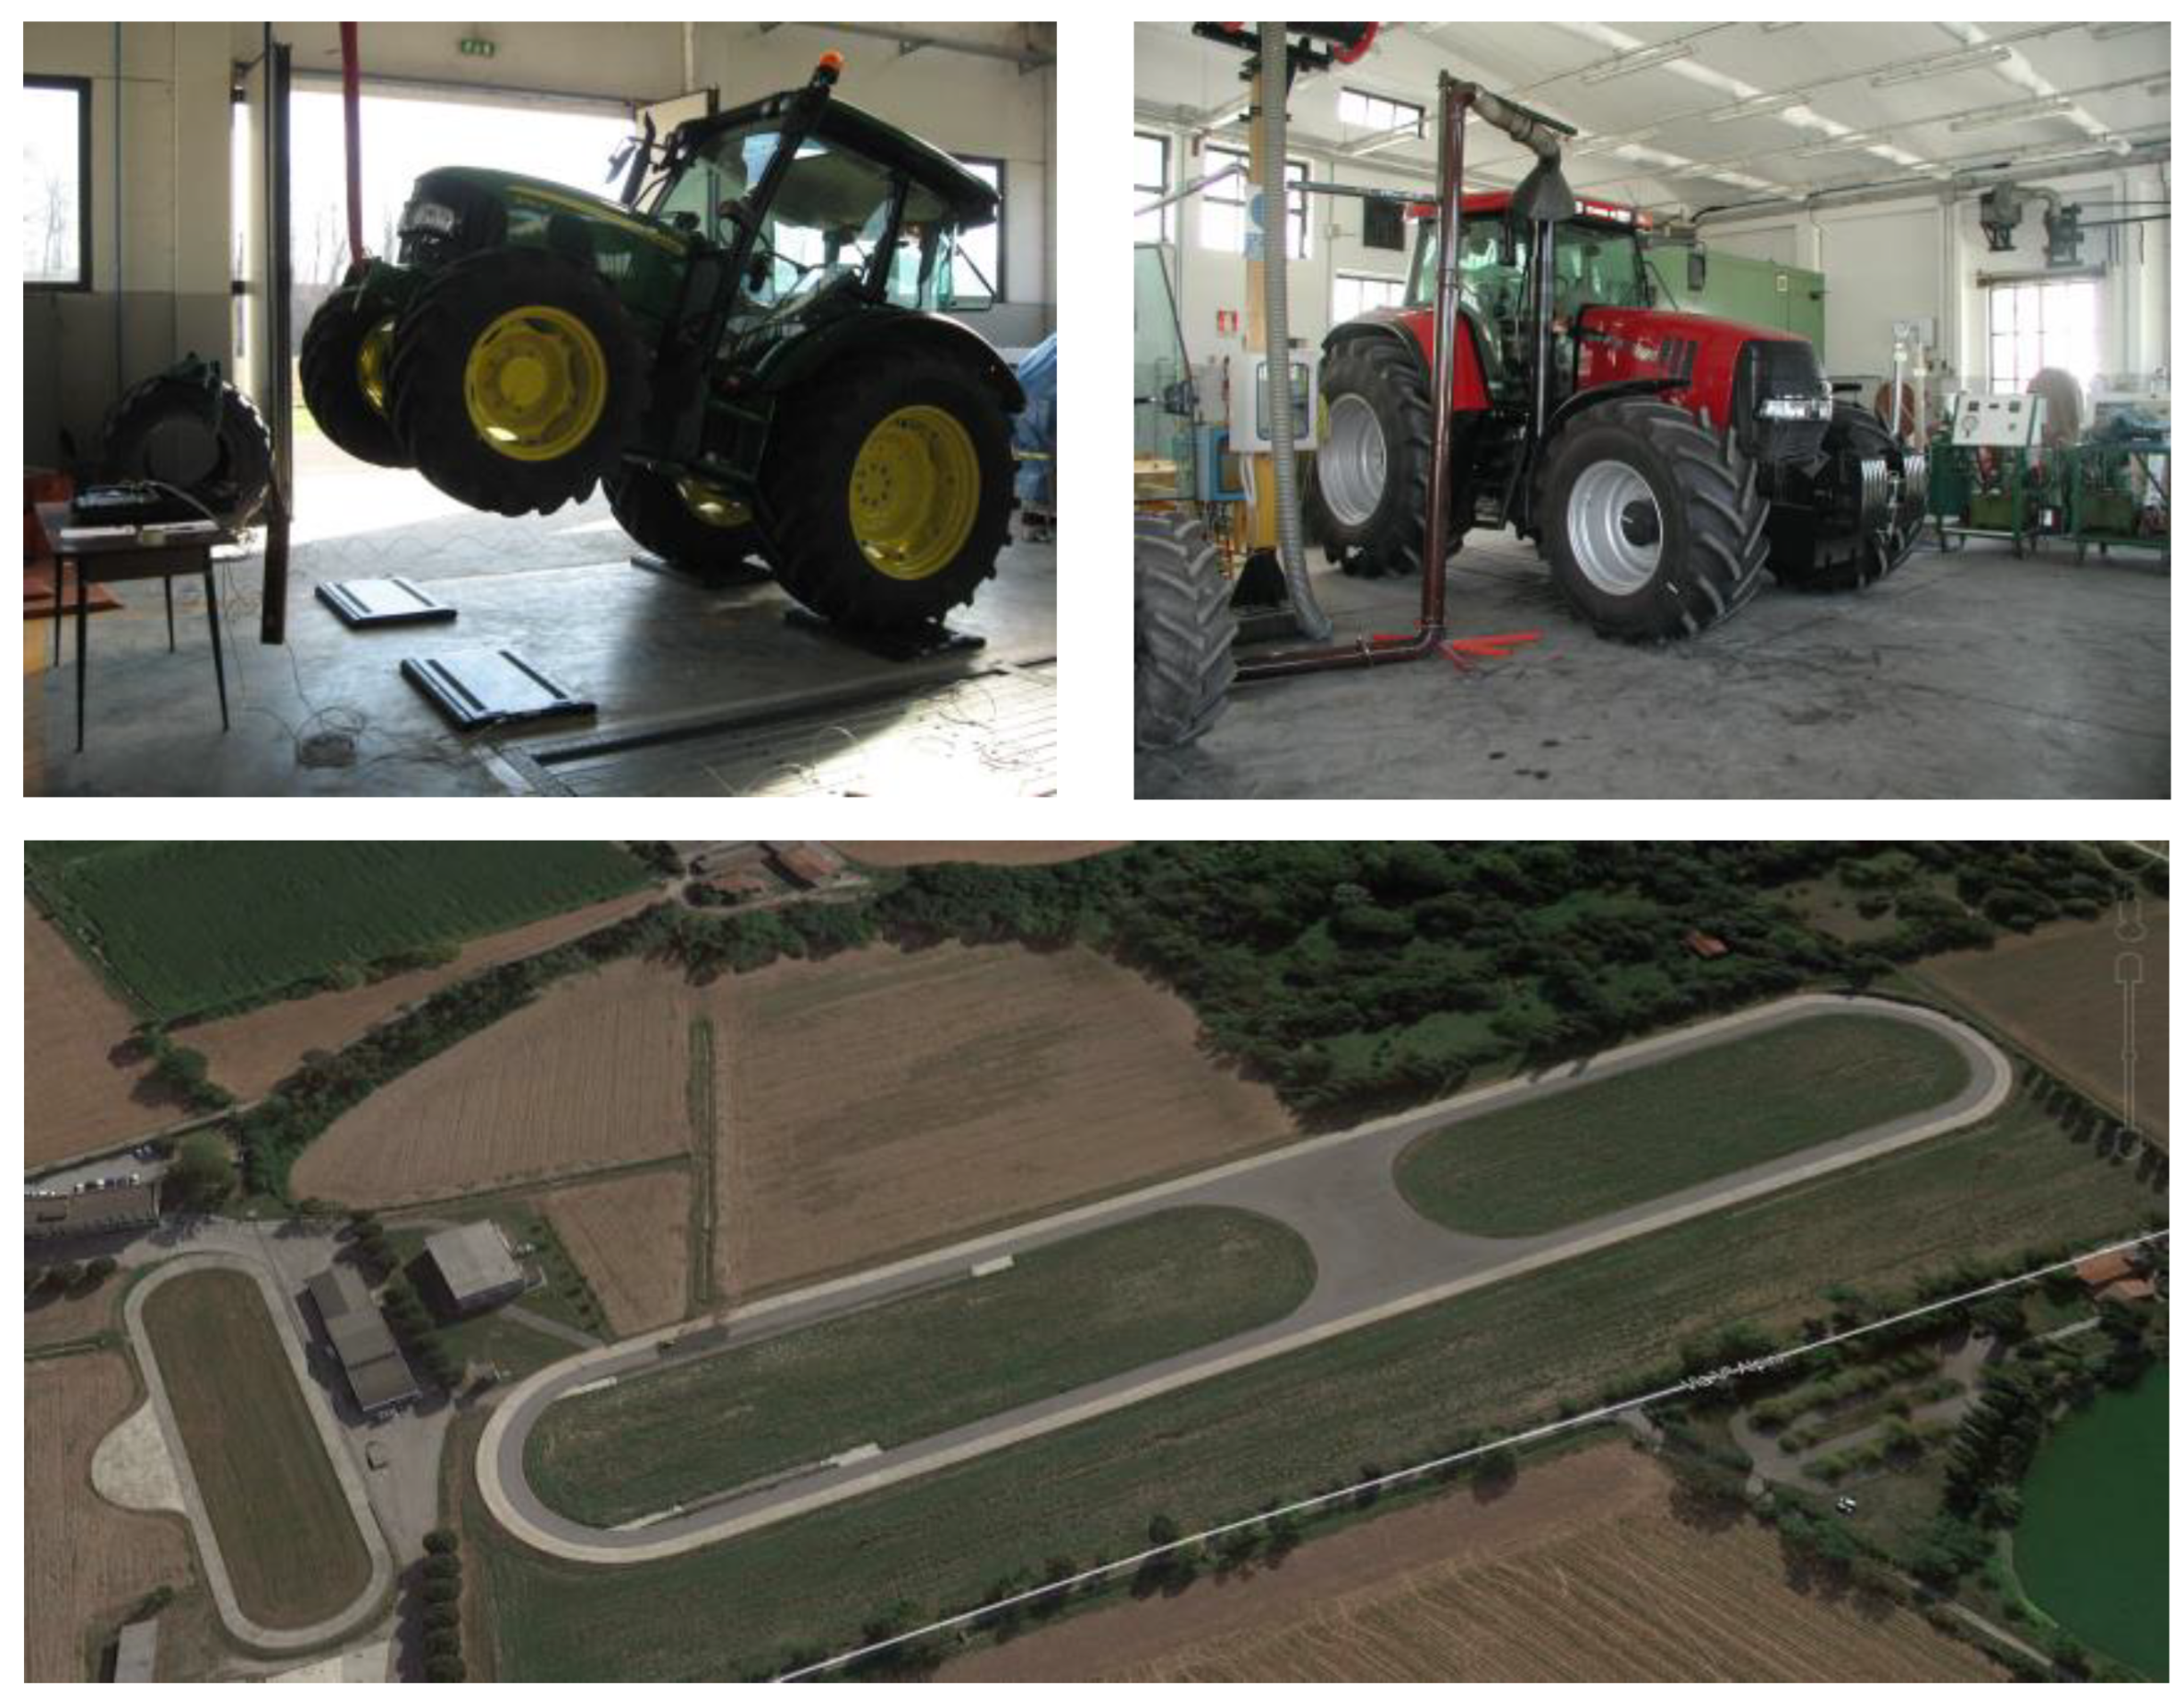
Figure 1. Some of the CREA-IT facilities adopted for fitting the tractor model: measurement of the center of gravity; the engine room and the 1000 m test track (the tractors are only as an example).
Agriculture 13 01603 g001
Figure 2. An example of prescription maps.
Agriculture 13 01603 g002
Figure 3. The platform allows to generate realistic environments, each element can be visible by virtual sensors.
Agriculture 13 01603 g003
Figure 4. Experimental layout of the sowing experimental test and of the adopted field.
Agriculture 13 01603 g004
Figure 5. Experimental layout of the spraying experimental test and the adopted field.
Agriculture 13 01603 g005
Figure 6. Experimental layout of the fertilizing experimental test and the adopted field.
Agriculture 13 01603 g006
Figure 7. The global layout of the developed simulator.
Agriculture 13 01603 g007
Figure 8. Detail of the armrest, of the console, of the virtual terminals and of the set of pedals.
Agriculture 13 01603 g008
Figure 9. An operator during an experience with the virtual fertilizer.
Agriculture 13 01603 g009
Figure 10. The aerial view of the adopted OBJ of the tractor and of the implements during working.
Agriculture 13 01603 g010
Figure 11. An example of selection of the available tractor and seeder.
Agriculture 13 01603 g011
Figure 12. Selection of the scenario (left) and the developed digital twin of the farm environment (right).
Agriculture 13 01603 g012
Figure 13. Examples of screenshots taken from the AgriSI application. The red line shows the trajectory to be followed during the operation and the cyan line highlights the field boundaries. The image on the left is monitoring of the tractor behavior, showing some parameters regarding powertrain, wheel torques, and vertical forces. On the right is the considered prescription map with some information on the implement behavior: flow rate of the distributors, geometrical parameters, and type and remaining quantity of product.
Agriculture 13 01603 g013
Figure 14. Traction on field maneuver numerical vs. experimental results: (a) velocity profile, (b) longitudinal acceleration profile, (c) front axle longitudinal loads, (d) rear axle longitudinal loads.
Agriculture 13 01603 g014aAgriculture 13 01603 g014b
Figure 15. Steering pad maneuver numerical vs. experimental results: (a) velocity profile, (b) imposed trajectory, (c) lateral acceleration profile, (d) rear vertical loads.
Agriculture 13 01603 g015
Figure 16. Results of the sowing reported as georeferenced distributed dose between the experimental test carried out in the field with a tractor and seeder (left) and the result with the simulator experience (right).
Agriculture 13 01603 g016
Figure 17. Results of the fertilizing reported as georeferenced distributed dose between the experimental test carried out in the field with a tractor and fertilizer (left) and the result with the simulator experience (right).
Agriculture 13 01603 g017
Figure 18. Results of the spraying reported as georeferenced distributed dose between the experimental test carried out in the field with a tractor and sprayer (left) and the result with the simulator experience (right).
Agriculture 13 01603 g018
Table 1. The simulator’s main characteristics.
ConceptualThematicFarming OperationFarming Type *
Human in the loop
Digital Model
Machinery Management
Farm Management
Logistic farming
Fertilizing
Spraying
Seeding
Weeding
Arable
* winter and summer crops.
Table 2. The results regarding the comparison of the seeder.
Worked Area
(ha)
Distributed Dose
(kg ha−1)
Forward Speed
(km h−1)
Productivity
(ha h−1)
Fuel
Consumption
(l h−1)
Experimental4.5814.81.411.7
Simulated4.5795.01.611.8
Table 3. The results regarding the comparison of the fertilizer.
Worked Area
(ha)
Distributed Dose
(kg ha−1)
Forward Speed
(km h−1)
Productivity
(ha h−1)
Fuel
Consumption
(l h−1)
Experimental8.41491124.34.6
Simulated8.41491123.44.2
Table 4. The results regarding the comparison of the spraying.
Worked Area
(ha)
Distributed Dose
(kg ha−1)
Forward Speed
(km h−1)
Productivity
(ha h−1)
Fuel
Consumption
(l h−1)
Experimental7.5249.98.36.65.2 *
Simulated7.52498.57.48.5 **
* Mounted, starting mass 1700 kg. ** Trailed, starting mass 2500 kg.
Disclaimer/Publisher’s Note: The statements, opinions and data contained in all publications are solely those of the individual author(s) and contributor(s) and not of MDPI and/or the editor(s). MDPI and/or the editor(s) disclaim responsibility for any injury to people or property resulting from any ideas, methods, instructions or products referred to in the content.