Article

Evaluation of Maize Crop Damage Using UAV-Based RGB and Multispectral Imagery

by
Barbara Dobosz
1,
Dariusz Gozdowski
1,
Jerzy Koronczok
2,
Jan Žukovskis
3 and
Elżbieta Wójcik-Gront
1,*
1
Department of Biometry, Institute of Agriculture, Warsaw University of Life Sciences, Nowoursynowska 159, 02-776 Warsaw, Poland
2
Agrocom Polska, Strzelecka 47, 47-120 Żędowice, Poland
3
Department of Business and Rural Development Management, Vytautas Magnus University, 53361 Kaunas, Lithuania
*
Author to whom correspondence should be addressed.
Agriculture 2023, 13(8), 1627; https://doi.org/10.3390/agriculture13081627
Submission received: 17 July 2023 / Revised: 8 August 2023 / Accepted: 16 August 2023 / Published: 18 August 2023
(This article belongs to the Section Digital Agriculture)

Abstract

:
The accurate evaluation of crop damage by wild animals is crucial for farmers when seeking compensation from insurance companies or other institutions. One of the game species that frequently cause crop damage in Europe is the wild boar, which often feeds on maize. Other game species, such as roe deer and red deer, can also cause significant crop damage. This study aimed to assess the accuracy of crop damage evaluation based on remote sensing data derived from unmanned aerial vehicles (UAVs), especially a digital surface model (DSM) based on RGB imagery and NDVI (normalized difference vegetation index) derived from multispectral imagery, at two growth stages of maize. During the first growth stage, when plants are in the intensive growth phase and green, crop damage evaluation was conducted using both DSM and NDVI. Each variable was separately utilized, and both variables were included in the classification and regression tree (CART) analysis, wherein crop damage was categorized as a binomial variable (with or without crop damage). In the second growth stage, which was before harvest when the plants had dried, only DSM was employed for crop damage evaluation. The results for both growth stages demonstrated high accuracy in detecting areas with crop damage, but this was primarily observed for areas larger than several square meters. The accuracy of crop damage evaluation was significantly lower for smaller or very narrow areas, such as the width of a single maize row. DSM proved to be more useful than NDVI in detecting crop damage as it can be applied at any stage of maize growth.

1. Introduction

Damage to crops caused by wild animals is a significant issue for farmers in Poland and other European countries [1,2,3]. Game species such as wild boar (Sus scrofa), roe deer (Capreolus capreolus), and red deer (Cervus elaphus) are the primary culprits. In 2021, Poland observed the highest number of roe deer, with approximately 917,000 individuals [4], while the population of wild boar was much lower at around 68,000, mainly due to the African swine fever epidemic (ASF) [5]. Despite their lower numbers, wild boar cause extensive damage to crops, particularly during the vegetation season of crops such as cereals and potatoes [6,7,8]. Wild boar are a common species in many European countries and have been known to cause substantial damage to crops [9,10,11,12]. In recent years, with the expansion of maize cultivation and the prolonged vegetation period until late autumn, wild boar have become a significant threat to maize crops [13,14]. A study conducted in Luxemburg over 10 years found that maize crop damage accounted for 30% of all damage cases [15]. Similarly, a three-year study in Poland reported that over 70% of maize crop damage occurred in September and October [16]. When seeking compensation from insurance companies or other responsible entities, an accurate assessment of crop damage is essential for farmers. Crop damage caused by wild animals often appears irregular in shape, scattered across various locations within the field, in the form of patches and paths [17,18]. This makes it difficult to evaluate the damaged area, especially for tall crops such as maize. Evaluating the extent of damage in maize crops can be challenging due to the height of the plants during late growth stages, with maize plants reaching 2–3 m in height [19]. Therefore, there is a need to develop quick and preferably automated methods for assessing the extent of these damages. One of the most effective methods for evaluating crop damage by game species is UAV (unmanned aerial vehicle) remote sensing [17,20,21,22]. UAVs equipped with RGB (visible light) or multispectral cameras are commonly used for this purpose. Typically, flights are conducted at an altitude of about 50–100 m above ground level with an image overlap of approximately 70% [23]. This enables the capture of orthophotos and the generation of three-dimensional surface models that can be utilized to evaluate areas of damaged crops [17,19,21]. Based on the three-dimensional (3D) surface model, a digital surface model (DSM) or crop height model (CHM) can be generated to detect patches within the field where crop damage has occurred. A study conducted in the Czech Republic focused on wheat and employed two methods based on DSM and spatial filtering to detect areas damaged by wild boar [17]. Both methods yielded highly consistent results compared to the reference areas, which were determined using ground–truth data (GNSS measurement of the damage patches) and manual interpretation of the orthomosaic. Although some discrepancies existed between the methods and reference damage, the differences in total damage areas were relatively small (errors below 15% compared to the reference areas). This approach applies to crops with relatively tall plants. An important advantage of this method is the possibility of using consumer-grade UAVs, which are more cost-effective compared with professional-grade UAVs and their sensors.
Detection of crop damage is possible using RGB or multispectral imagery through pixel-based or object-based analysis. One such study that utilized both methods was conducted in Poland on rapeseed [20], where UAV images from a multispectral camera served as input data. Several vegetation indices, including the normalized difference vegetation index (NDVI), were employed to identify areas with crop damage from the collected data. Damaged crop area was classified based on vegetation indices’ values. Areas with vegetation indices below a certain threshold were considered damaged. Additionally, small areas were removed, and machinery tracks within the field were excluded using object-based analysis. The overall classification accuracy for damaged crops ranged from 88% to 95% when compared to the reference areas.
Another study investigating the use of UAV imagery to assess crop damage was conducted in Belgium, focusing on maize and grassland [24]. In the study, RGB imagery was used, and geographic object-based image analysis (GEOBIA) was applied for the classification of areas with crop damage. The overall accuracy in calculating the damaged area for maize fields was about 85%, and for grasslands, it was 94%. Another similar study, which utilized an object-based approach for the classification of crop damage in maize, was conducted in the United States [25]. The overall accuracy of damage estimates ranged from 74% to 98% when multispectral imagery was used and from 72% to 94% with visible light alone.
Very good accuracy of crop damage assessment in maize can be obtained using UAV LIDAR (light detection and ranging) sensors, which allows for the generation of much better DSM compared with DSM generated based on RGB images [19]. However, the disadvantage of using LIDAR sensors is the high cost and more complicated data processing methods.
Evaluation of crop damage using UAV-derived RGB images is usually sufficiently accurate and economically efficient. The cost of such an evaluation is lower in comparison with ground assessment, especially for larger crop fields [24]. In recent years, the costs of generating RGB orthophoto and DSM using UAV-derived images have become relatively low, and the increasing availability of such solutions allows for their more widespread use [26,27,28].
It is important to assess the usefulness of RGB UAV-derived imagery for quick evaluation of crop damage and compare it with multispectral imagery. This is essential due to economic reasons, as consumer-grade UAVs that can acquire RGB images for orthophoto generation are several times cheaper compared with UAVs equipped with multispectral sensors. Depending on the crop species, growth stage, and type of crop damage, methods based on CHM/DSM or vegetation indices, or object-based analysis may be more appropriate for classifying crop damage areas. Especially for maize, where UAV-derived data are the only method to evaluate crop damage due to the large height of plants, it is important to study various methods for a quick assessment of crop damage. In this study, the efficiency of various UAV remote sensing data, such as DSM models derived from RGB, and NDVI derived from multispectral imagery, is evaluated for the classification of crop damage caused by wild boar or other causes in two growth stages of maize: (1) grain filling and (2) full maturity. The accuracy of crop damage classification was examined using various input data and diverse statistical methods. Crop damage was represented as a binomial variable, wherein areas were classified as either having crop damage or being without damage.

2. Materials and Methods

2.1. Study Area and UAV Data Acquisition

The study was conducted in southern Poland in a maize crop field covering approximately 43 hectares in 2022 (Figure 1). The damage to crops was caused by wild boar during different crop stages, from sowing (by eating seeds after sowing, before germination) to late growth stages (to full maturity, before harvest). A portion of the field covering an area of 4.52 ha was selected for statistical analyses.
UAV images were captured on two dates: 25 August 2022, during the R4 growth stage of maize, when kernels have a doughy consistency, and 24 October 2022, during full maturity of maize. Two types of UAVs were used, Phantom 4 Pro, equipped with an RGB camera, and Phantom 4 Multispectral, equipped with a multispectral camera. Table 1 presents the specification of the cameras for both UAVs. The flight altitude of the Phantom 4 Pro was 100 m above the ground with 85% front and side overlap on 25 August 2022 and 100 m above the ground with 80% front overlap and 75% side overlap on 24 October 2022. The flight altitude of the Phantom 4 Multispectral was 90 m above the ground level with 75% front overlap and 60% side overlap. The average ground sampling distance (GSD) for RGB images was about 2.5 cm, and for multispectral images, it was 4.5 cm. Ground control points (GCPs) were used to adjust the georeferencing of the orthophotos. The RGB images were processed using PIX4Dmapper 4.7.5 software, resulting in RGB orthophotos and a 3D cloud, which is a digital model of the field surface. Pix4Dfields 1.12.1 software was used to process multispectral images, resulting in multispectral orthophotos and orthophotos with vegetation indices, including NDVI. All maps use the ETRS89/Poland CS2000 zone 6 (EPSG:2177) coordinate system, where the basic unit is 1 m.

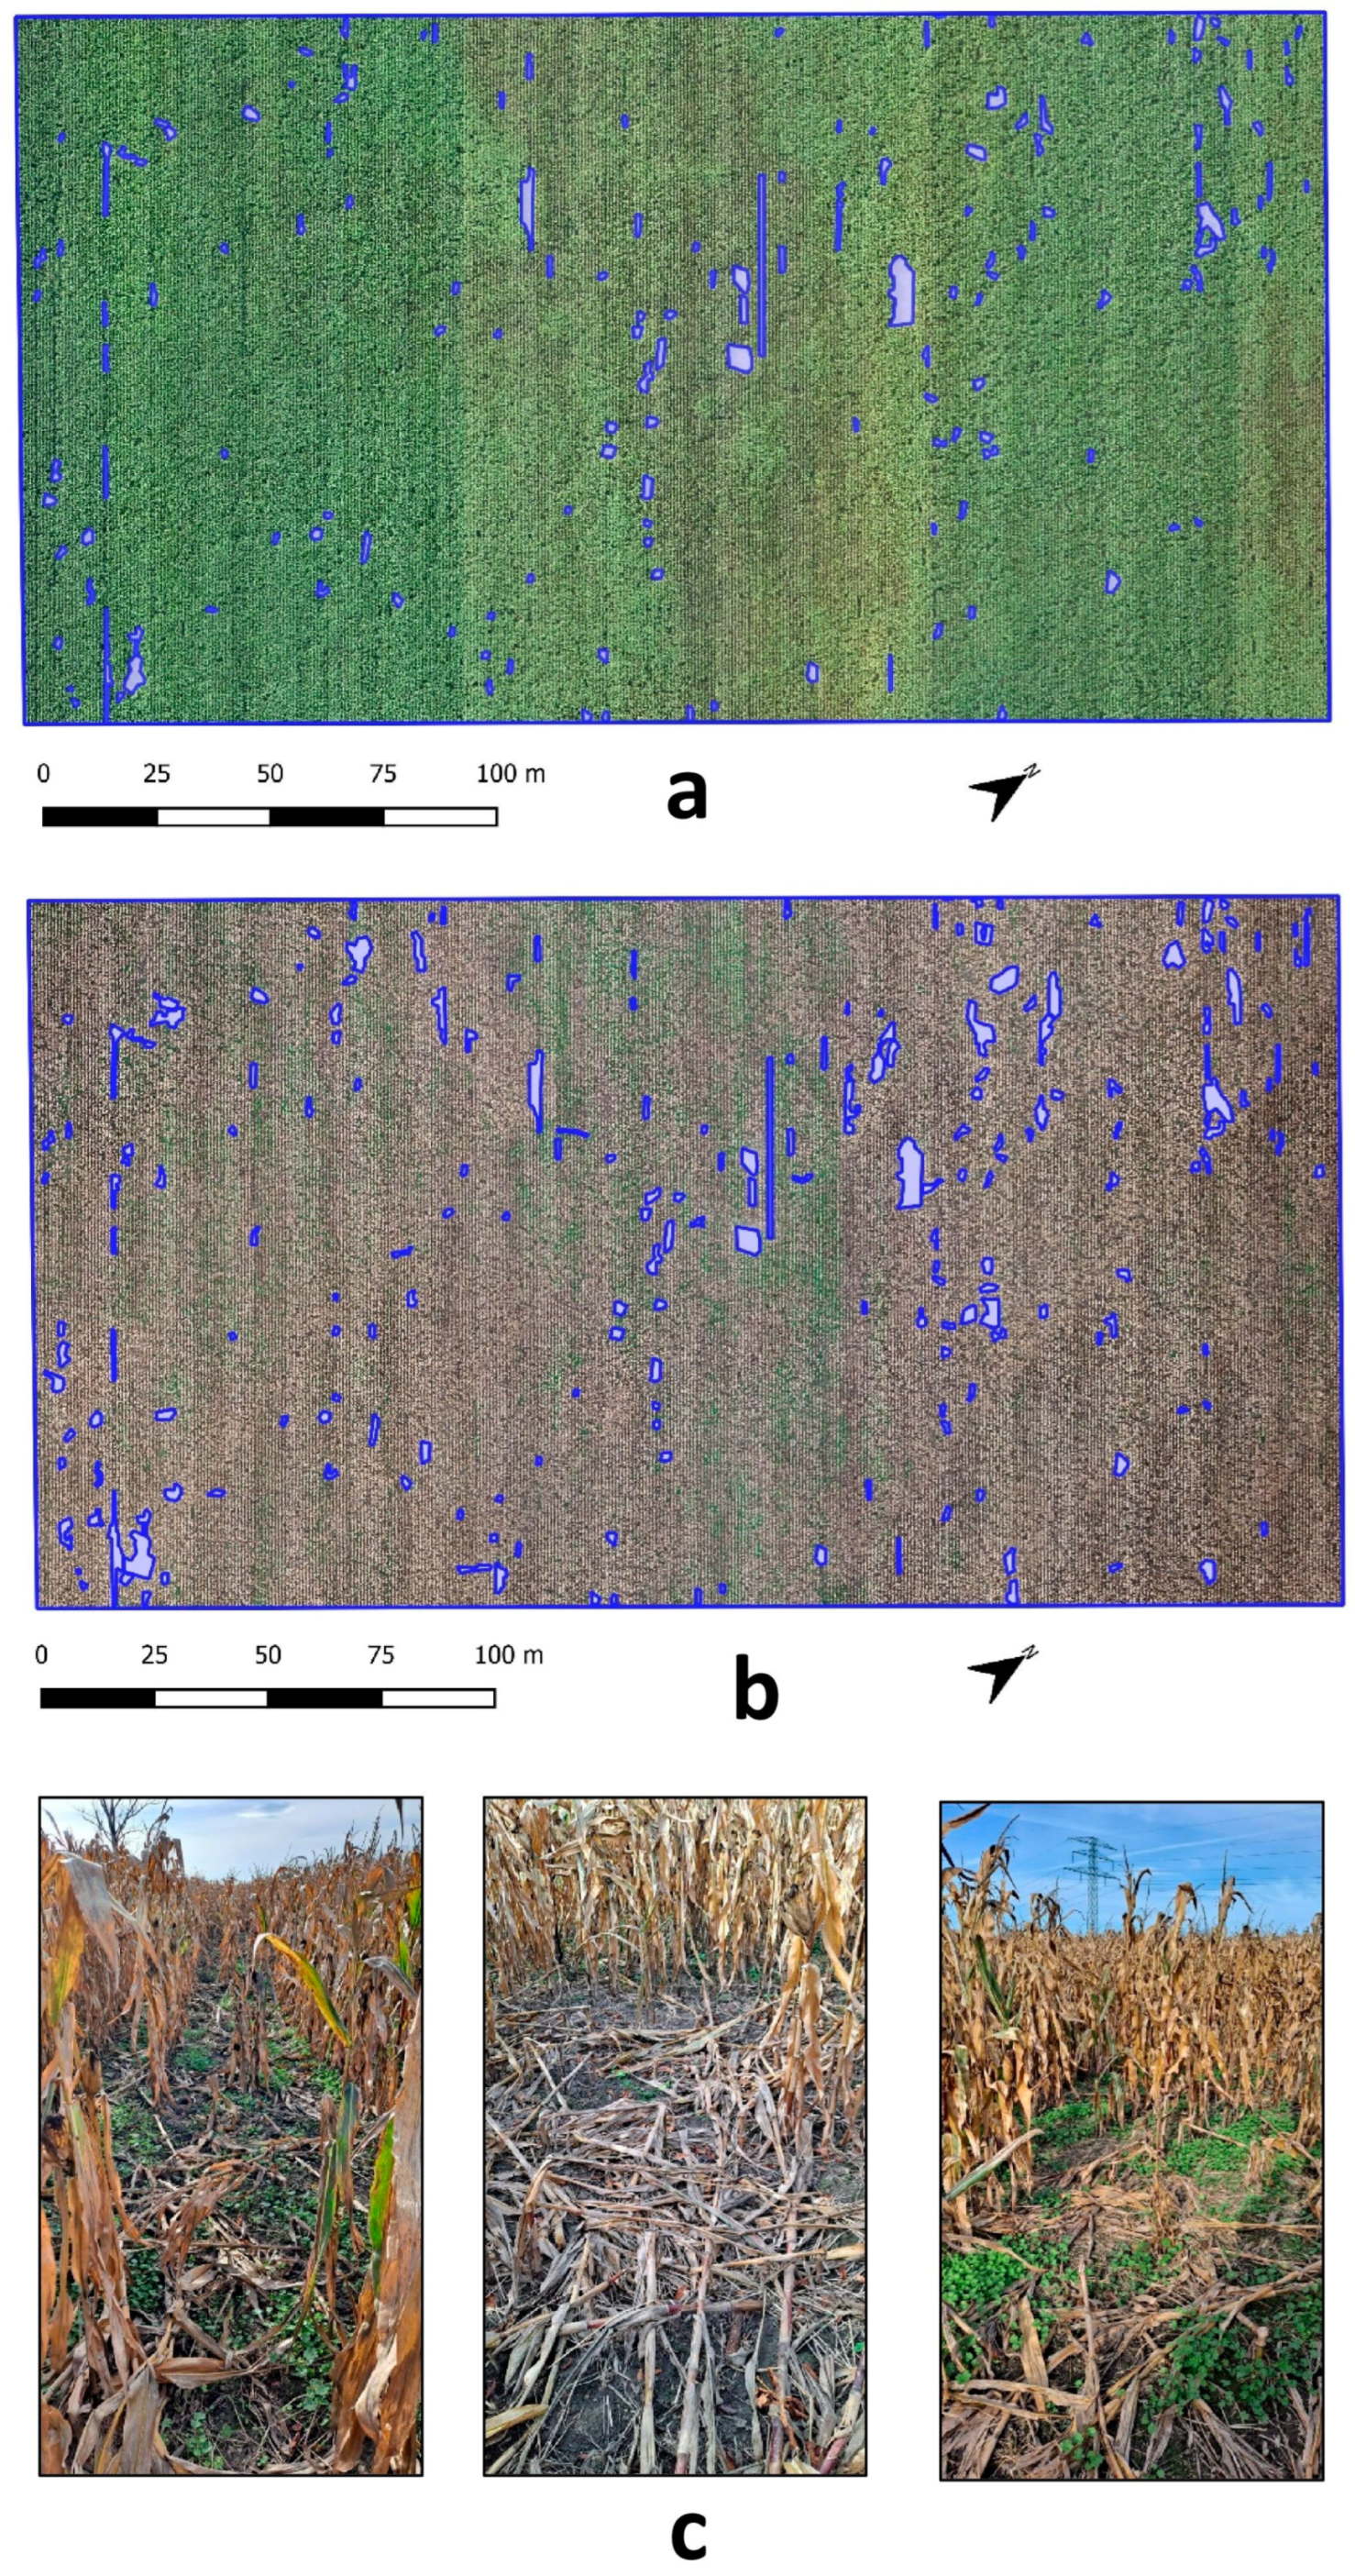
2.2. Reference Areas of Crop Damage

Areas selected through visual assessment of crop damage were considered as the reference for other results obtained in this study (Figure 2). This assessment was performed manually using the high-resolution RGB orthophotos, where an experienced person selected areas with crop damage by outlining polygons believed to be affected either by wild boar or other causes. The delineation process was performed at an extremely high zoom level, approximately at a scale of 1:300, enabling the identification of damaged areas with a high degree of accuracy. Visual assessment is a very common method used for formal purposes, e.g., payment of compensation by insurance companies or other institutions responsible for compensating for damage to crops. Such assessments were conducted on two dates, i.e., on 25 August 2022 and 24 October 2022. The total area of crop damage evaluated using visual evaluation on the first date (25 August 2022) was equal to 742 m2 (1.65% of the total area), while on the second date, the crop damage area increased to 1274 m2 (2.83% of the total area). Most of the damages were caused by wild boar, as hoof prints of wild boars were observed in many places. However, some areas where maize was absent or undamaged could be attributed to other reasons, such as incorrect sowing or damage caused by deer (roe deer or red deer).

2.3. Statistical Analysis

Statistical analyses were conducted to identify areas within the field where the crop was partially or completely damaged. Classification methods based on histogram evaluation and a classification and regression tree (CART) were applied to detect damaged areas within the studied field. Reference areas were used to assess the accuracy of the statistical classification methods. The statistical classification was performed using two data sources: a 3D cloud representing the altitude of the field surface, including plants and other objects, and NDVI orthophotos based on multispectral images. A low NDVI value can indicate crop damage, but only when the plants have been entirely damaged (no longer retaining their green coloration) and during the vegetation stage of the crop’s growth. As a result, we conducted a test to determine the viability of utilizing NDVI exclusively for detecting damaged crops, specifically on the initial date, which was at the end of August. By the subsequent date, which marked the end of October, all maize plants had undergone desiccation, leading to an overall very low NDVI value across the entire field.
Maize is characterized by tall plant growth at the culmination of its vegetation period, reaching heights of approximately 2 to 3 m. This statute enables the application of DSM to identify areas devoid of plants or where plants have sustained damage. DSM is generated using 3D data based on a height estimation model derived from overlapping RGB images. The source orthophotos have a very high resolution (pixel size of several centimeters), and for further processing, they were converted into orthophotos with a pixel size of 0.5 m. The 3D cloud was converted into a DSM (geotiff file) and processed using SAGA GIS 9.0 software. Due to the non-uniform flatness of the field, there exist variations in elevation across different sections of the area. A simple filter module with the option “edges” with a radius of 20 pixels (kernel type: square) was applied to obtain a new layer where values below 0 indicate areas with no plants or damaged plants. The DSM data with the filter was used to classify crop damage using a specific threshold value, which was considered as the classification threshold between crop damage and no crop damage.
The impact of NDVI and the filter value in DSM data on the occurrence of crop damage (0—no damage, 1—damage) was evaluated using CART [29,30]. CART is a type of decision tree algorithm used for both classification and regression tasks. It is a popular machine-learning technique that enables the creation of a predictive model by partitioning the data into smaller subsets based on the values of input variables. In the CART model, the decision tree was built by recursively splitting the data into two subsets based on the value of a single input variable, aiming to make each subset as homogeneous as possible concerning the target variable (i.e., the occurrence of crop damage). This process continues until a stopping criterion is met, such as a minimum number of samples per leaf node, which, in this study, was set at 10% of all observations. For classification tasks, the CART algorithm predicts the most common class (0—no damage, 1—damage) in each terminal node. The total number of observations used in the CART model was 180,770, with each observation representing a pixel of 0.5 m. A 10-fold cross-validation method was employed in this study to avoid overfitting in the CART model. This approach involves dividing the data into k subsets, or “folds”, and training and testing the model on each fold in turn [29]. This allows for a more accurate estimate of the model’s performance on new, unseen data and can help identify overfitting by comparing the model’s performance on the training set to that on the validation set. The analysis was conducted using STATISTICA software ver. 13 [31]. The flowchart illustrating the subsequent steps in the study is presented in Figure 3.

3. Results

3.1. Evaluation of Crop Damage Areas Based on Vegetation Index (NDVI)

Because two different cultivars of maize were planted in the field, the NDVI values are quite different for these cultivars (Figure 4a). In the middle of the study area was a cultivar that had a significantly lower NDVI compared with the other maize cultivar. To detect local low values (i.e., values lower than those of neighboring pixels) of NDVI as indicators of areas without maize, we applied a raster filter with the “edge” option using SAGA GIS software. The orthophoto presenting the values after such filtering is shown in Figure 4b. Negative values indicate that these pixels have a lower NDVI compared with neighboring pixels. After applying this filter, we set a threshold of −0.12 pixel value (Figure 4b) as a probable indicator of crop damage. The threshold was established based on the value distributions for areas categorized as undamaged and damaged. This value shows a strong correlation with the reference crop damage, especially for larger areas of crop damage. All maps were prepared using a pixel size of 0.75 m, which corresponds to the spacing between maize rows. It allowed us to obtain a more uniform NDVI value and avoid detecting areas between maize rows as crop damage.

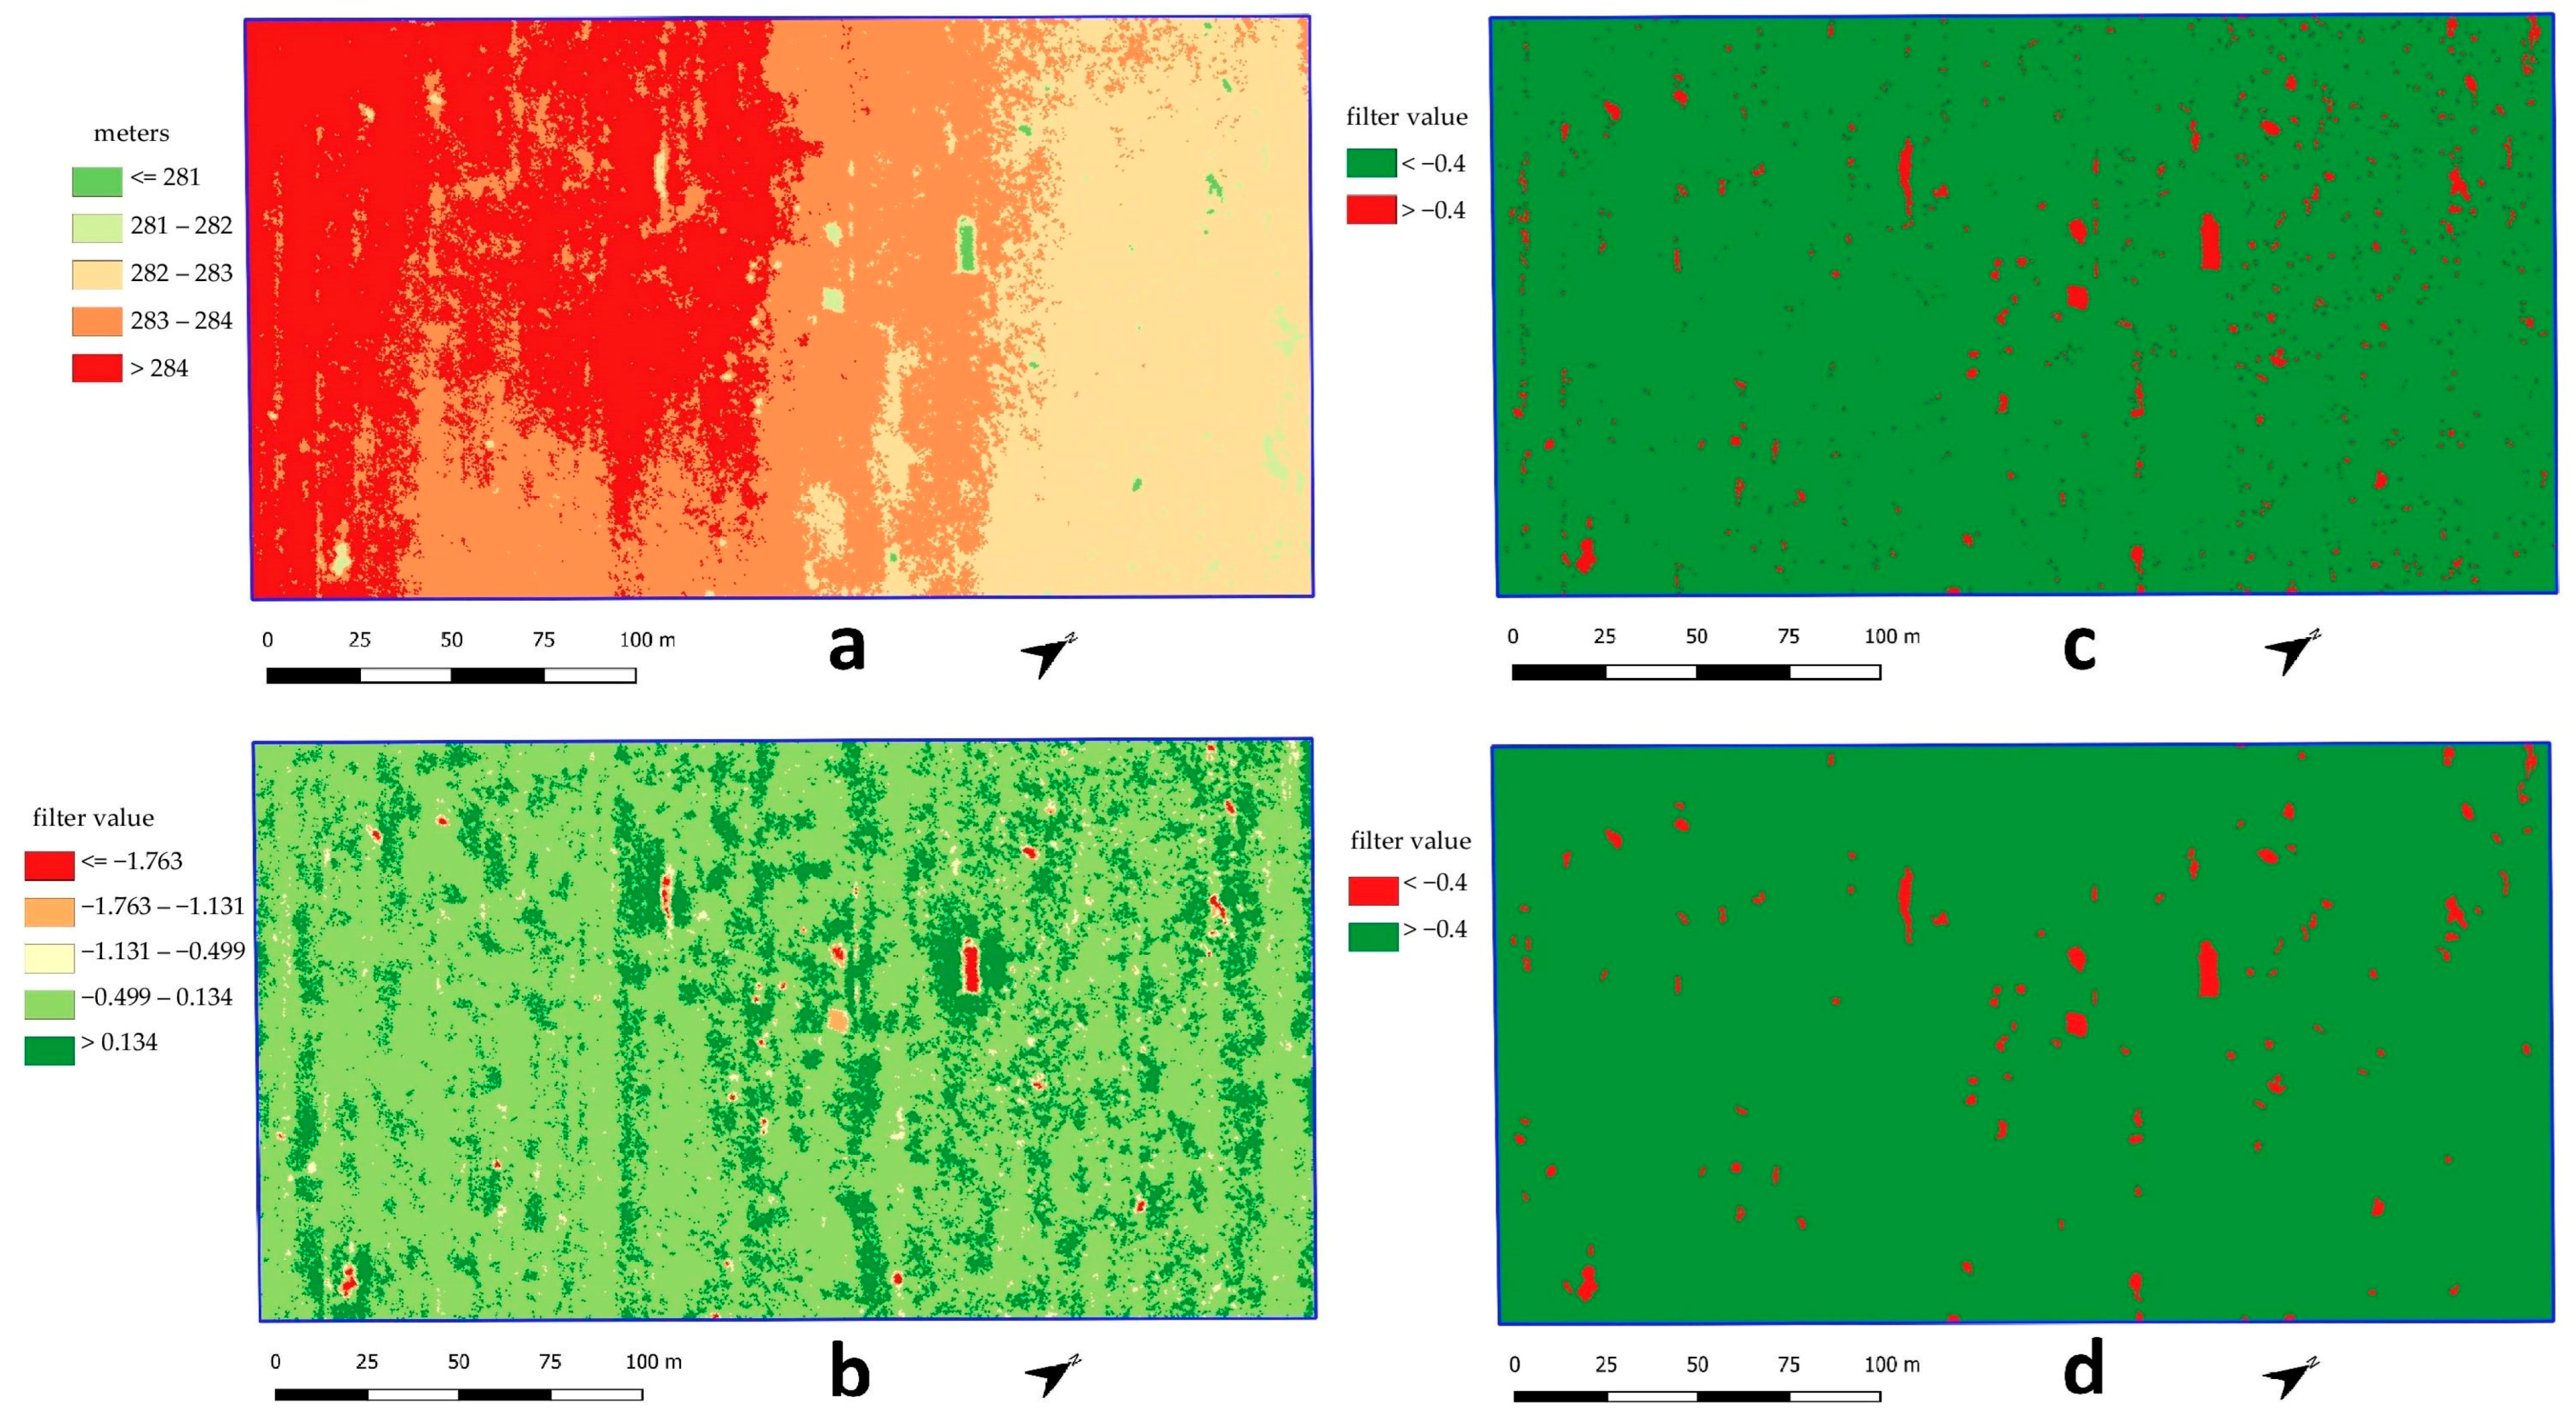
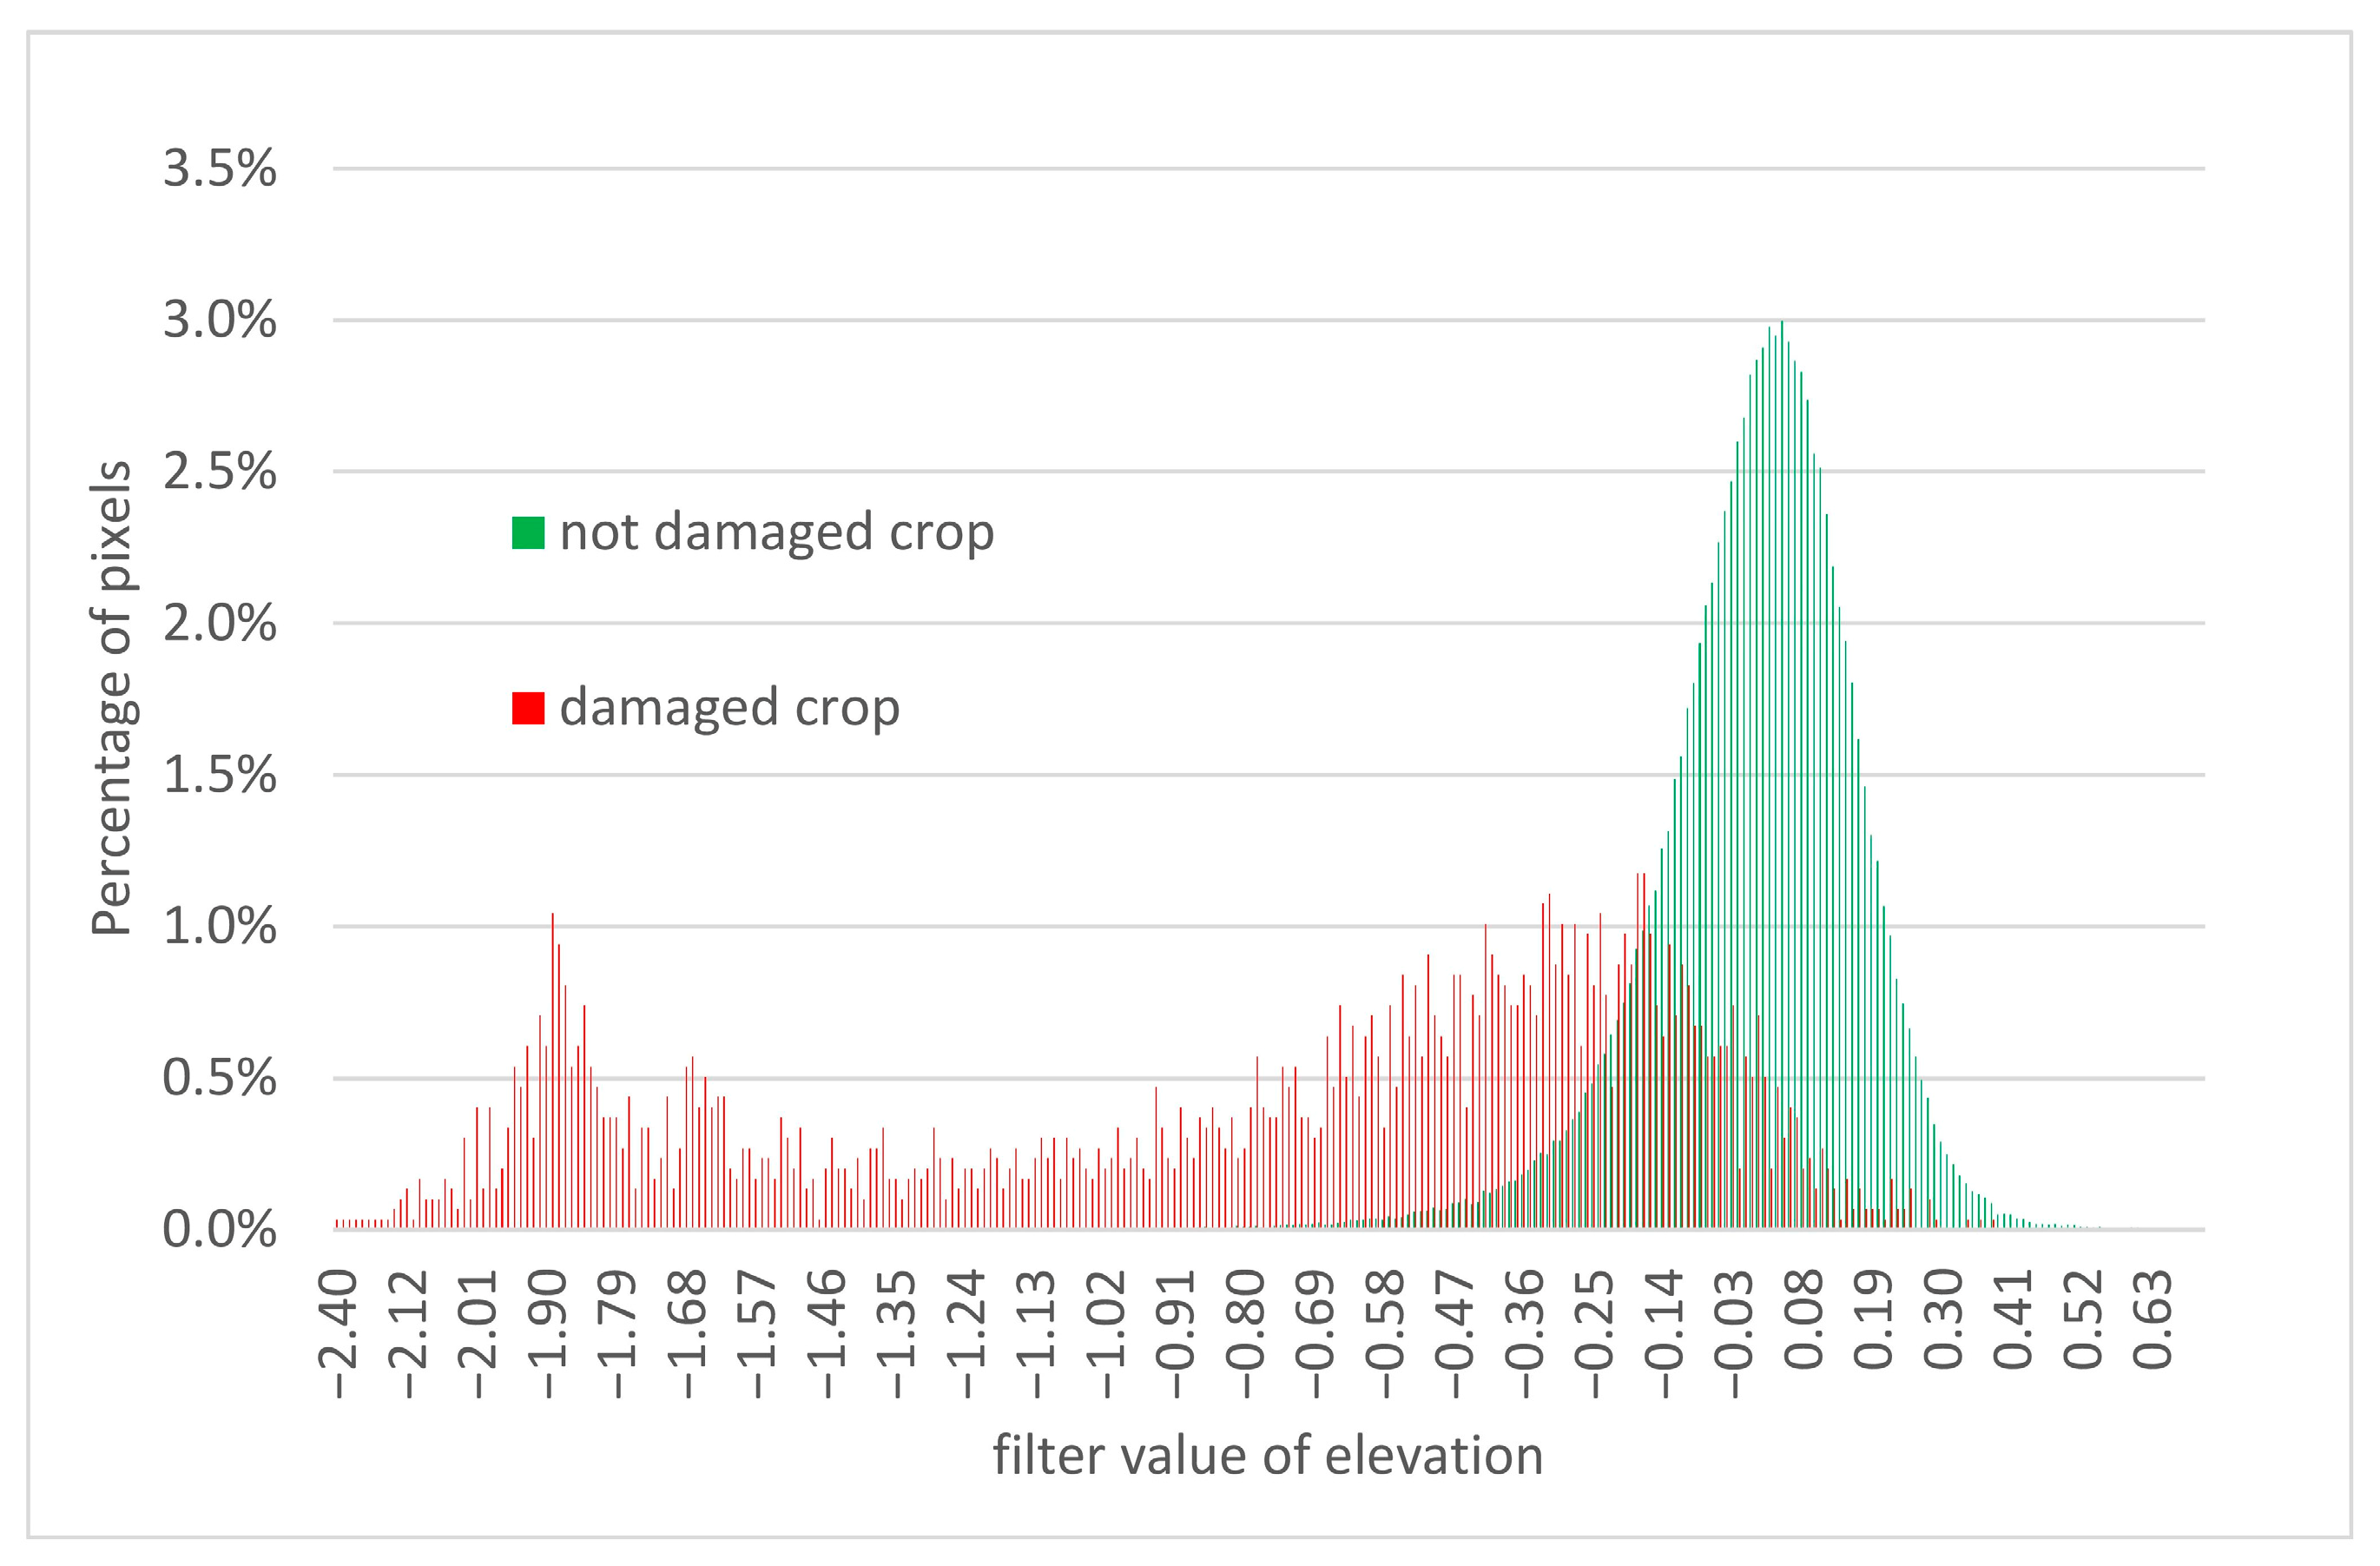
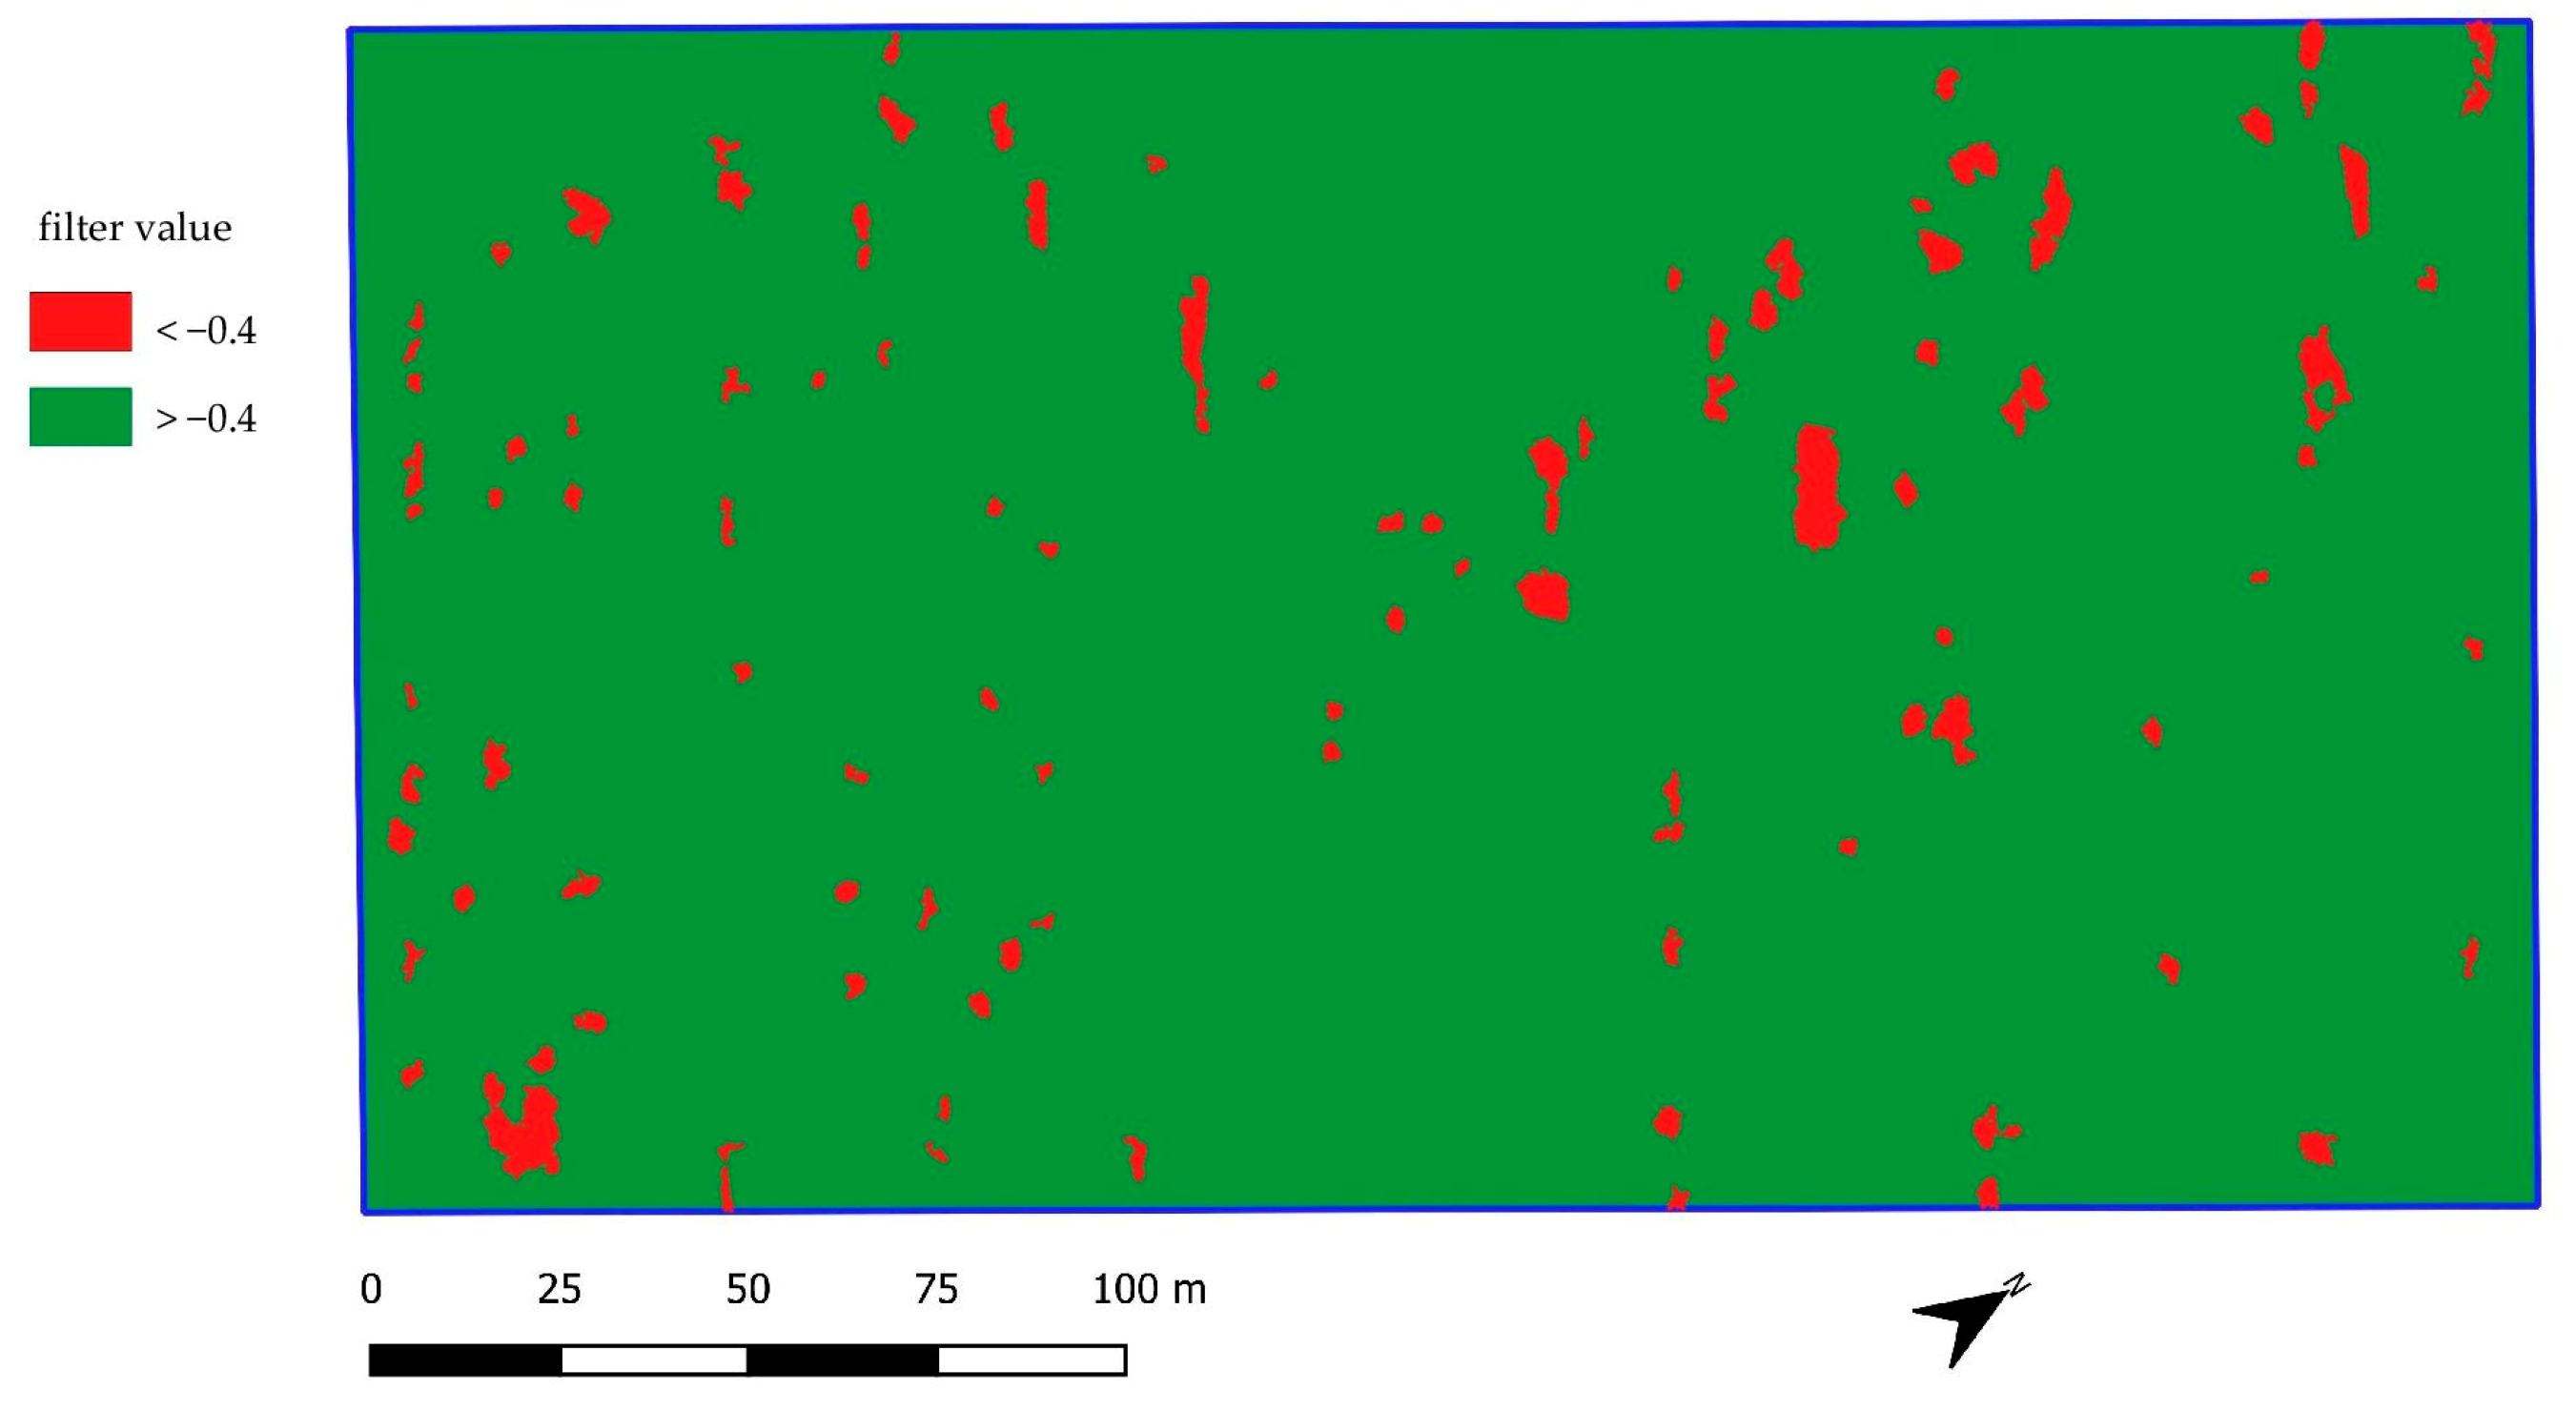
3.2. Evaluation of Crop Damage Areas Based on 3D Cloud

The map presenting the DSM values (Figure 5a) and values after filtering (Figure 5b) is shown in Figure 5. Figure 6 depicts the distribution of DSM values for areas classified as undamaged and damaged. Based on the histogram for the reference areas of crop damage and undamaged crops (Figure 6), we assume that a threshold of about −0.4 indicates a high probability of crop damage. This threshold was applied, and the map of probable crop-damaged areas was prepared (Figure 5c).
The same analysis based on DSM and the detection of crop damage areas using the spatial filter with the “edge” option was applied for the second date, i.e., 24 October 2022. At this time, the crop was fully mature, and the areas of crop damage were larger compared with the end of August (Figure 2b). The same threshold for the DSM value (−0.4) of the filter value was applied, and areas smaller than 3 m2 were removed. The results of this detection of crop damage areas are presented in Figure 7.
Crop damage detection accuracy based on DSM is good for larger areas but insufficient for small areas of crop damage. Figure 8 presents a comparison of reference crop damage based on visual evaluation to areas of crop damage selected using DSM. For larger areas (over a dozen square meters) of crop damage, the agreement between these two methods is good, but for smaller areas, especially very narrow ones, the compatibility is not sufficient.

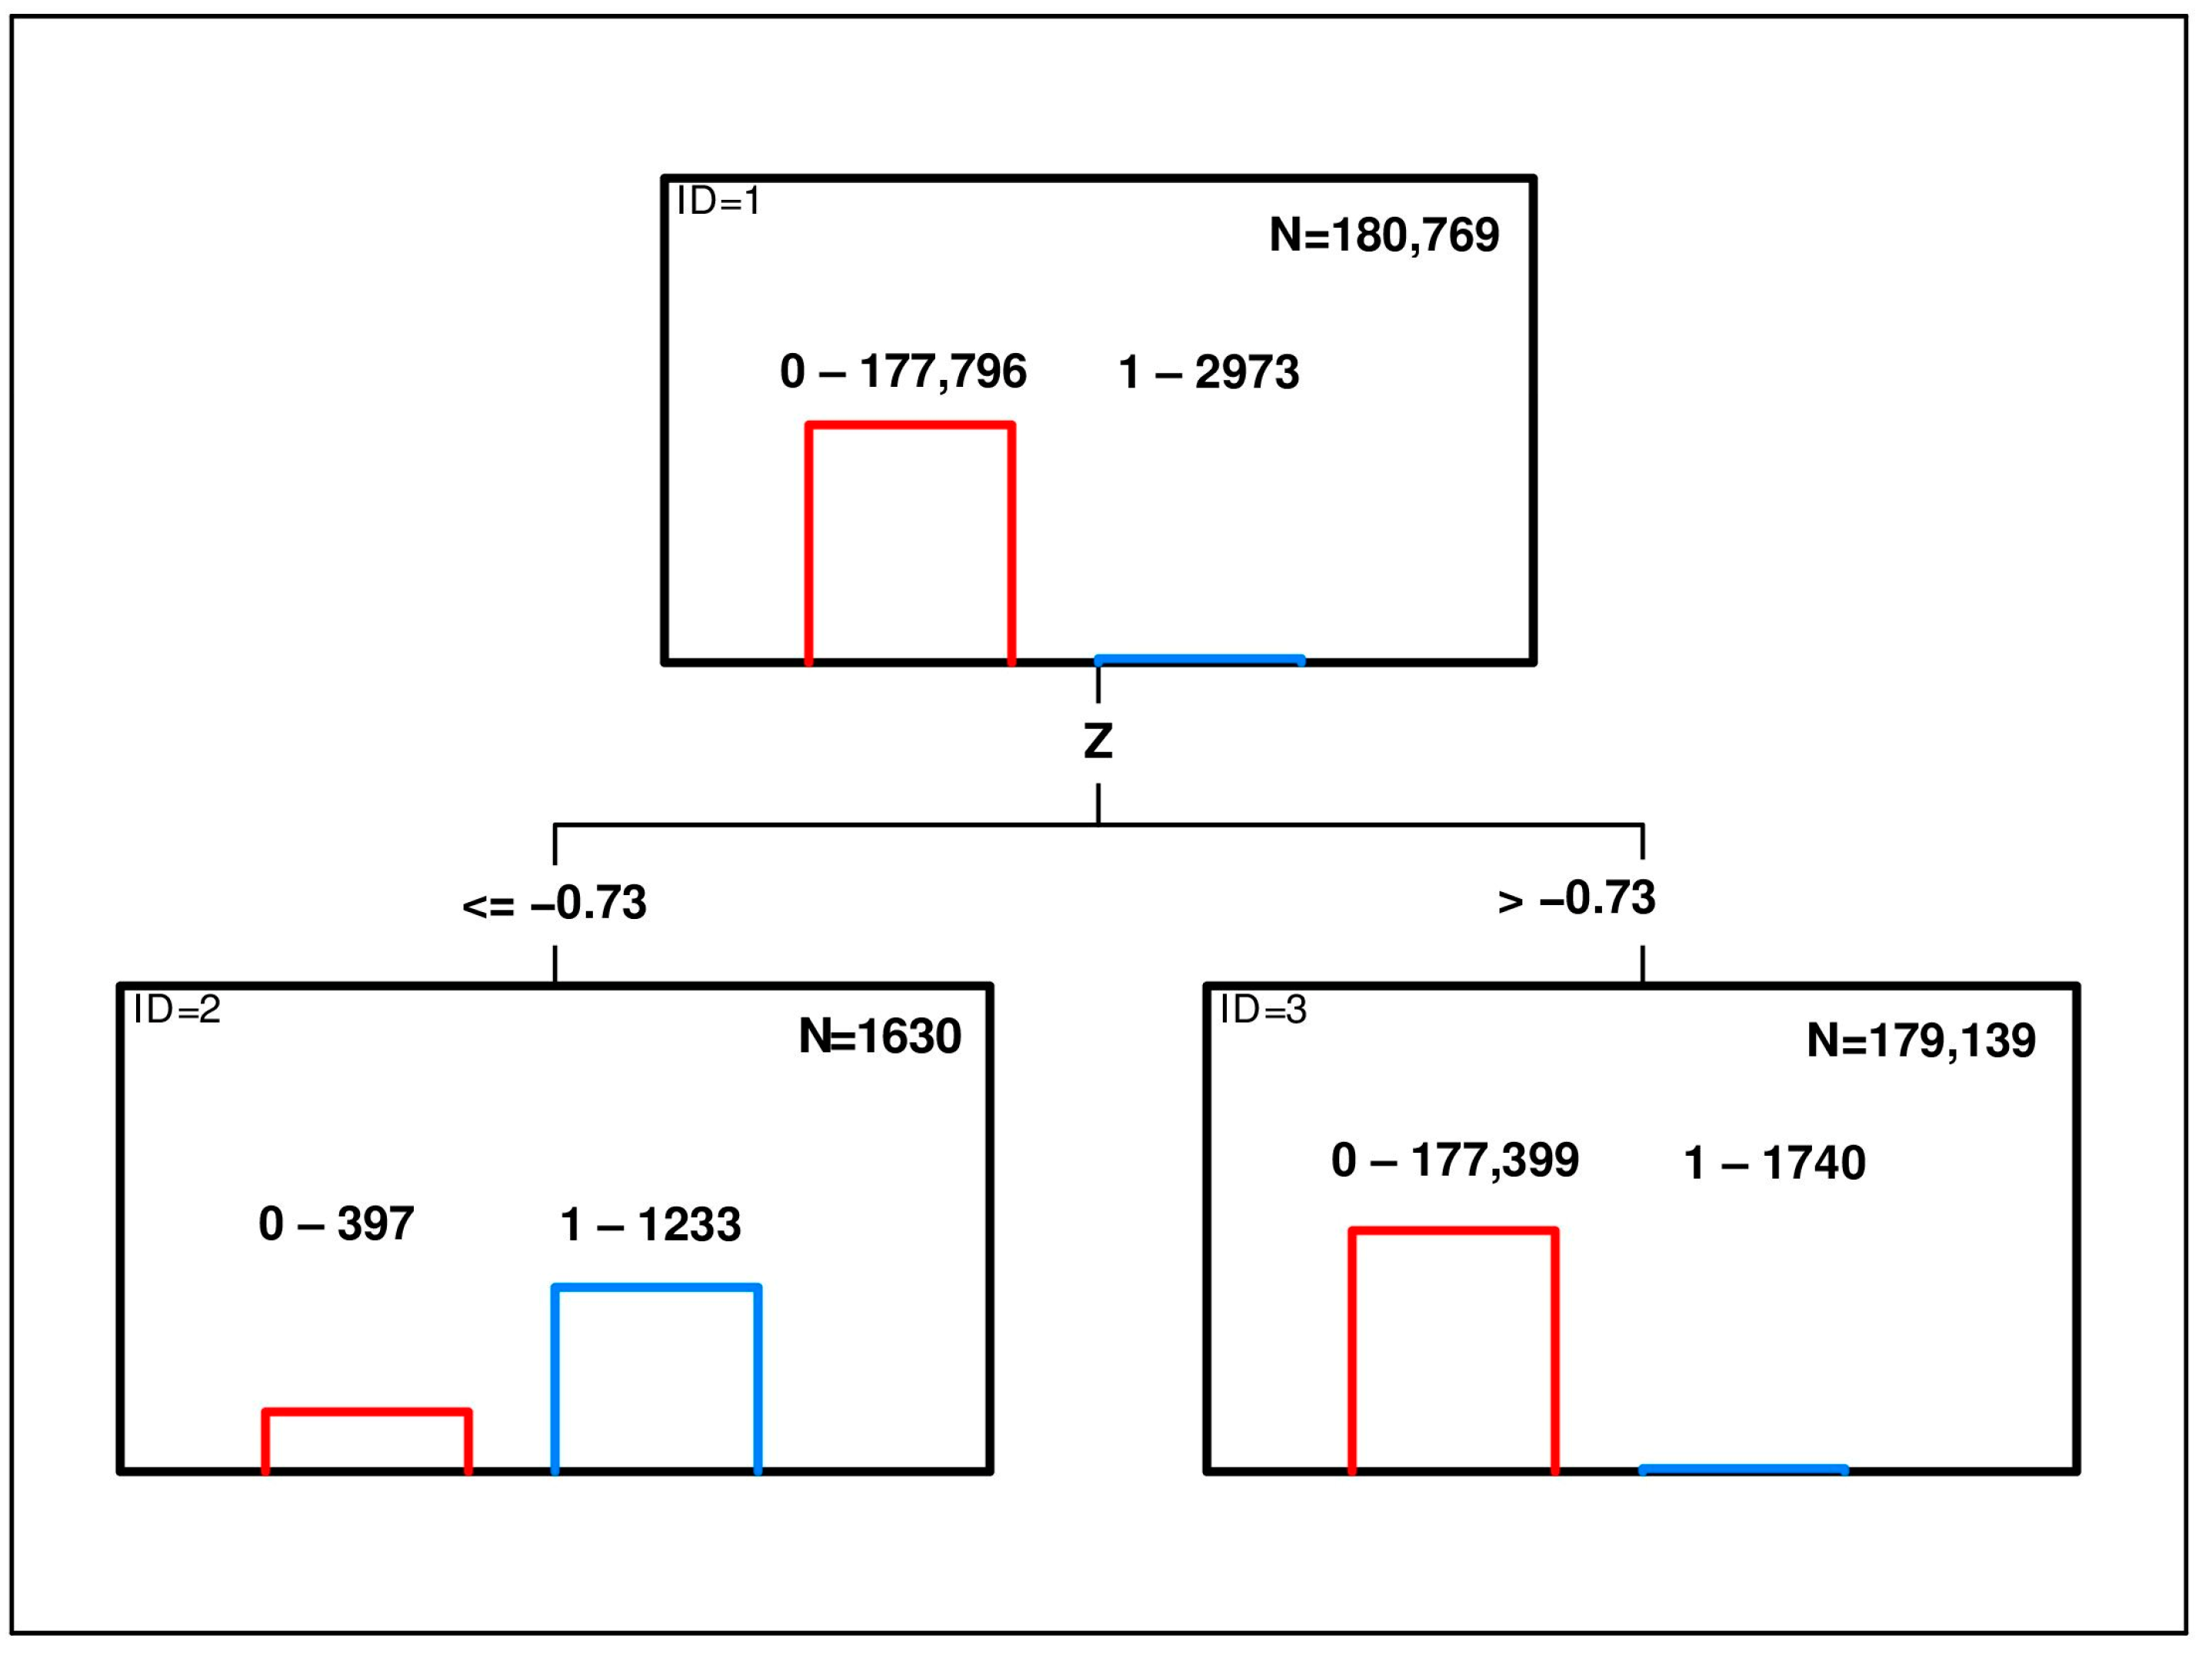
3.3. Evaluation of Crop Damage Areas Based on CART

To use both the NDVI value and DSM to detect crop damage areas, CART was applied to the data obtained on 25 August 2022. This analysis allows for the evaluation of more than one variable (in this study, two variables) in terms of their influence. The variables for the analysis were obtained using the same methods described in the previous sections (i.e., Section 3.1 and Section 3.2. The analysis was performed with a pixel size of 0.5 m. CART with cross-validation was conducted on 180,770 observations, using the occurrence of crop damage as the target variable. The variable z (representing the filter value based on DSM) is the main variable explaining crop damage variability (Figure 9). Observations with a class equal to 1 (crop damage) have the filter value based on DSM lower than −0.73, as opposed to the class with a value of 0 (no damaged crop). No further splits are observed, and the NDVI variable is not present in the CART tree. Compared with the filter value based on DSM, NDVI is 44% less important.
The results of the analysis are presented in Figure 10. Due to the large number of small areas that were considered crop damage, areas of less than 3 m2 were removed similarly to the previous methods.

3.4. Evaluation of Classification Accuracy of Crop Damage Areas Based on Different Methods

The crop damage evaluation results presented in Section 3.1, Section 3.2 and Section 3.3 were compared with reference crop damage based on visual assessment (Section 2.2). Because small areas of crop damage are questionable, as it is unclear whether this is the actual damage caused by wild boar, such areas were excluded from the analysis. The analyses were performed only for bigger areas, i.e., in the first scenario without areas smaller than 3 m2 and in the second scenario without areas smaller than 15 m2. The results are presented in Table 2. The worst results of crop damage detection were obtained for the method based on NDVI. In this method, the areas of crop damage are underestimated, as many areas were omitted. The only advantage of this method was the low percentage of commissions. The highest percentage of correctly classified crop damage (71.3% for the second scenario) was observed for the method based on the DSM filter value, where the threshold value was set at −0.40. The disadvantage of such a threshold is the large percentage of commissions. The threshold of the DSM filter value based on CART analysis shows promising results for the second scenario, where the percentage of correctly classified crop damage areas is 66.6%, the percentage of commissions is 16.8%, and the overall accuracy is 83.4%. This method underestimates crop damage area, but larger areas are correctly detected in most cases.

4. Discussion

The results obtained in this study demonstrate the usefulness of DSM based on RGB images acquired by drones for detecting areas of crop damage, but only for areas over a dozen square meters. For small areas of crop damage, especially narrow paths trampled by wild boar, the detection accuracy was poor. In cases of damage caused by wild animals that are small in area or long but narrow, it is challenging to find an efficient method for assessing such damage, as both methods based on vegetation indexes and DSM are not effective. Similar results were found in a study by Kuželka and Surový [17] on wheat, where a high agreement was observed between the automatic detection of crop damage areas and reference crop damage based on manual measurements for larger regular areas of crop damage. However, for crop damage, such as narrow paths or borders of damaged areas, automatic detection resulted in omissions or commissions. In that wheat study, only DSM data were used to detect crop damage. One problem observed in that study was the reference to machinery tracks within the field. Moreover, wild boar game tracks were not correctly detected using automatic methods based on DSM due to their narrow size. The final balance of area omissions or commissions in that study was close to zero, and the total estimated area of crop damage was highly consistent (with an error of about 5%) with the reference area of crop damage. This confirms that the detection of crop damage based on DSM is an accurate method, especially at the end of the vegetation period when plants are not green.
In our study, the NDVI vegetation index was less useful compared with the DSM, even during the intensive vegetation of maize at the end of August. A similar study on the detection of crop damage in maize was conducted by Fischer et al. [25]. In their study, UAV-derived multispectral imagery was used as input data. They achieved good accuracy, ranging from 74% to 98%, depending on the field, for detecting crop damage areas using RGB and near-infrared data, including NDVI. In that study, only spectral data were used as a variable included in the analysis, and the height of crops was not considered.
Another study [24], which assessed the area of maize and grassland damage by wild boars using UAV-derived RGB images, reported an overall accuracy of 94.4% for grassland and 84.5% for maize. This suggests that maize is a more challenging crop for such evaluation. In this study, object-oriented methods using RGB imagery were applied.
The accuracy of detecting crop damage areas is usually quite good in the middle of such areas. Problems with classification usually occur at the borders of crop damage areas, where false negative (underestimation) or false positive (overestimation) classifications might happen [32]. Therefore, the accuracy of crop damage classification is much better for larger areas of regular shape compared to scattered crop damage.
The canopy height model (CHM) used to evaluate crop damage areas can be based on two sources of data, i.e., DSM based on RGB images and DTM (Digital Terrain Model) based on LIDAR data. The difference between DSM and DTM gives CHM. Such an approach was applied in the study by Michez and colleagues [18]. The authors of this study noticed that UAV data could hardly be used to characterize the type of crop damage, e.g., undamaged corn stems can lay flat due to the wind, not because of wild boars. Such a problem is particularly important in the case of crops that are sensitive to weather conditions (e.g., wheat lodging caused by strong wind and rainfall).
The results obtained in this study confirm that 3D models based on UAV-derived data can be useful for evaluating crop damage areas, especially for crops such as maize, for which other methods of evaluation of crop damage are not possible to apply due to the large height of the plants. Such evaluation can be more accurate if DSM or CHM are characterized by high accuracy, which is possible at a lower flight altitude or with the use of more advanced measurement methods, especially LIDAR sensors [19,33,34,35]. Such data were used in the study by Zhou et al. [34] on maize, where a very good accuracy of crop height measurement was obtained, allowing for the detection of maize lodging. In the study by Hu et al. [19], CHM based on a LIDAR sensor was much more accurate compared with CHM based on RGB images. However, the disadvantage of LIDAR data is the much higher cost of LIDAR sensors compared to RGB cameras used in consumer-grade UAVs [36,37,38]. Economic considerations are crucial in the practical application of UAV-derived data for the evaluation of crop damage. The results obtained in this study are quite promising, as they demonstrate the utility of consumer-grade UAVs equipped with RGB cameras for identifying crop damage areas using UAV-derived DSM. The practical applications of such damage assessment can be quite extensive, given the prevalence of animal-induced damage in maize crops.

5. Conclusions

The results of the study demonstrated a fairly good accuracy in crop damage evaluation when DSM was used as input data, but only for larger areas of crop damage, over a dozen of square meters. In the case of smaller areas, smaller than several square meters, the results were not satisfactory due to the high percentage of omissions and commissions. DSM-derived data were more efficient in classifying crop damage compared with the NDVI vegetation index. Depending on the filter value based on DSM, overestimation or underestimation of crop damage was observed. Accurately assessing crop damage in irregularly shaped areas remains a challenge. Overall, 3D models derived from UAV data are valuable for evaluating crop damage, particularly for tall crops such as maize, although the accuracy depends on factors such as flight altitude and sensor technology, with LIDAR offering higher precision but at a higher cost.

Author Contributions

Conceptualization, B.D. and D.G.; methodology, B.D., D.G. and J.K.; validation, B.D., J.K., E.W.-G. and J.Ž.; investigation, B.D., D.G. and J.K.; resources, B.D. and J.K.; data curation, B.D., D.G. and E.W.-G.; writing—original draft preparation, B.D. and D.G.; writing—review and editing, B.D., J.K., E.W.-G. and J.Ž.; visualization, B.D., D.G. and E.W.-G.; supervision, D.G. and J.K.; funding acquisition, J.Ž. All authors have read and agreed to the published version of the manuscript.

Funding

This research received no external funding.

Institutional Review Board Statement

Not applicable.

Data Availability Statement

Data are available upon request from the authors.

Conflicts of Interest

The authors declare no conflict of interest.

References

  1. Novosel, H.; Piria, M.; Safner, R.; Kutnjak, H.; Šprem, N. The Game Damages on Agricultural Crops in Croatia. J. Cent. Eur. Agric. 2012, 13, 631–642. [Google Scholar] [CrossRef]
  2. Carpio, A.J.; Apollonio, M.; Acevedo, P. Wild Ungulate Overabundance in Europe: Contexts, Causes, Monitoring and Management Recommendations. Mam. Rev. 2021, 51, 95–108. [Google Scholar] [CrossRef]
  3. Bleier, N.; Lehoczki, R.; Újváry, D.; Szemethy, L.; Csányi, S. Relationships between Wild Ungulates Density and Crop Damage in Hungary. Acta Theriol 2012, 57, 351–359. [Google Scholar] [CrossRef]
  4. Statistics Poland. Statistical Yearbook of Forestry; Statistical Office in Białystok: Białystok, Poland, 2022. [Google Scholar]
  5. Pejsak, Z.; Woźniakowski, G. Etyczne i Ekonomiczne Aspekty Depopulacji Dzików w Zwalczaniu Afrykańskiego Pomoru Świń (ASF). Życie Weter. 2021, 96, 703–708. [Google Scholar]
  6. Mackin, R. Dynamics of Damage Caused by Wild Boar to Different Agricultural Crops. Acta Theriol. 1970, 15, 447–458. [Google Scholar] [CrossRef]
  7. Piekarczyk, P.; Tajchman, K.; Belova, O.; Wójcik, M. Crop Damage by Wild Boar (Sus Scrofa L.) Depending on the Crop Composition in Central-Eastern Poland. Balt. For. 2021, 27. [Google Scholar] [CrossRef]
  8. Lee, S.-M.; Lee, E.-J. Diet of the Wild Boar (Sus Scrofa): Implications for Management in Forest-Agricultural and Urban Environments in South Korea. PeerJ 2019, 7, e7835. [Google Scholar] [CrossRef]
  9. Amici, A.; Serrani, F.; Rossi, C.M.; Primi, R. Increase in Crop Damage Caused by Wild Boar (Sus Scrofa L.): The “Refuge Effect”. Agron. Sustain. Dev. 2012, 32, 683–692. [Google Scholar] [CrossRef]
  10. Massei, G.; Kindberg, J.; Licoppe, A.; Gačić, D.; Šprem, N.; Kamler, J.; Baubet, E.; Hohmann, U.; Monaco, A.; Ozoliņš, J.; et al. Wild Boar Populations up, Numbers of Hunters down? A Review of Trends and Implications for Europe: Wild Boar and Hunter Trends in Europe. Pest. Manag. Sci. 2015, 71, 492–500. [Google Scholar] [CrossRef]
  11. Schley, L.; Roper, T.J. Diet of Wild Boar Sus Scrofa in Western Europe, with Particular Reference to Consumption of Agricultural Crops: Diet of Wild Boar. Mammal. Rev. 2003, 33, 43–56. [Google Scholar] [CrossRef]
  12. Tarvydas, A.; Belova, O. Effect of Wild Boar (Sus Scrofa L.) on Forests, Agricultural Lands and Population Management in Lithuania. Diversity 2022, 14, 801. [Google Scholar] [CrossRef]
  13. Herrero, J.; García-Serrano, A.; Couto, S.; Ortuño, V.M.; García-González, R. Diet of Wild Boar Sus Scrofa L. and Crop Damage in an Intensive Agroecosystem. Eur. J. Wildl. Res. 2006, 52, 245–250. [Google Scholar] [CrossRef]
  14. Cappa, F.; Lombardini, M.; Meriggi, A. Influence of Seasonality, Environmental and Anthropic Factors on Crop Damage by Wild Boar Sus Scrofa. Folia Zool. 2019, 68, 261. [Google Scholar] [CrossRef]
  15. Schley, L.; Dufrêne, M.; Krier, A.; Frantz, A.C. Patterns of Crop Damage by Wild Boar (Sus Scrofa) in Luxembourg over a 10-Year Period. Eur. J. Wildl. Res. 2008, 54, 589–599. [Google Scholar] [CrossRef]
  16. Bobek, B.; Furtek, J.; Bobek, J.; Merta, D.; Wojciuch-Ploskonka, M. Spatio-Temporal Characteristics of Crop Damage Caused by Wild Boar in North-Eastern Poland. Crop Prot. 2017, 93, 106–112. [Google Scholar] [CrossRef]
  17. Kuželka, K.; Surový, P. Automatic Detection and Quantification of Wild Game Crop Damage Using an Unmanned Aerial Vehicle (UAV) Equipped with an Optical Sensor Payload: A Case Study in Wheat. Eur. J. Remote Sens. 2018, 51, 241–250. [Google Scholar] [CrossRef]
  18. Michez, A.; Morelle, K.; Lehaire, F.; Widar, J.; Authelet, M.; Vermeulen, C.; Lejeune, P. Use of Unmanned Aerial System to Assess Wildlife (Sus Scrofa) Damage to Crops (Zea Mays). J. Unmanned Veh. Syst. 2016, 4, 266–275. [Google Scholar] [CrossRef]
  19. Hu, X.; Gu, X.; Sun, Q.; Yang, Y.; Qu, X.; Yang, X.; Guo, R. Comparison of the Performance of Multi-Source Three-Dimensional Structural Data in the Application of Monitoring Maize Lodging. Comput. Electron. Agric. 2023, 208, 107782. [Google Scholar] [CrossRef]
  20. Jełowicki, Ł.; Sosnowicz, K.; Ostrowski, W.; Osińska-Skotak, K.; Bakuła, K. Evaluation of Rapeseed Winter Crop Damage Using UAV-Based Multispectral Imagery. Remote Sens. 2020, 12, 2618. [Google Scholar] [CrossRef]
  21. Garcia Millan, V.E.; Rankine, C.; Sanchez-Azofeifa, G.A. Crop Loss Evaluation Using Digital Surface Models from Unmanned Aerial Vehicles Data. Remote Sens. 2020, 12, 981. [Google Scholar] [CrossRef]
  22. Velusamy, P.; Rajendran, S.; Mahendran, R.K.; Naseer, S.; Shafiq, M.; Choi, J.-G. Unmanned Aerial Vehicles (UAV) in Precision Agriculture: Applications and Challenges. Energies 2021, 15, 217. [Google Scholar] [CrossRef]
  23. Stöcker, C.; Nex, F.; Koeva, M.; Gerke, M. High-Quality UAV-Based Orthophotos for Cadastral Mapping: Guidance for Optimal Flight Configurations. Remote Sens. 2020, 12, 3625. [Google Scholar] [CrossRef]
  24. Rutten, A.; Casaer, J.; Vogels, M.F.A.; Addink, E.A.; Vanden Borre, J.; Leirs, H. Assessing Agricultural Damage by Wild Boar Using Drones: Wild Boar Damage Assessment. Wildl. Soc. Bull. 2018, 42, 568–576. [Google Scholar] [CrossRef]
  25. Fischer, J.W.; Greiner, K.; Lutman, M.W.; Webber, B.L.; Vercauteren, K.C. Use of Unmanned Aircraft Systems (UAS) and Multispectral Imagery for Quantifying Agricultural Areas Damaged by Wild Pigs. Crop Prot. 2019, 125, 104865. [Google Scholar] [CrossRef]
  26. Jang, G.; Kim, J.; Yu, J.-K.; Kim, H.-J.; Kim, Y.; Kim, D.-W.; Kim, K.-H.; Lee, C.W.; Chung, Y.S. Review: Cost-Effective Unmanned Aerial Vehicle (UAV) Platform for Field Plant Breeding Application. Remote Sens. 2020, 12, 998. [Google Scholar] [CrossRef]
  27. Chen, P.-C.; Chiang, Y.-C.; Weng, P.-Y. Imaging Using Unmanned Aerial Vehicles for Agriculture Land Use Classification. Agriculture 2020, 10, 416. [Google Scholar] [CrossRef]
  28. Mattivi, P.; Pappalardo, S.E.; Nikolić, N.; Mandolesi, L.; Persichetti, A.; De Marchi, M.; Masin, R. Can Commercial Low-Cost Drones and Open-Source GIS Technologies Be Suitable for Semi-Automatic Weed Mapping for Smart Farming? A Case Study in NE Italy. Remote Sens. 2021, 13, 1869. [Google Scholar] [CrossRef]
  29. Breiman, L. Classification and Regression Trees; Routledge: Abingdon, UK, 2017; ISBN 978-1-351-46048-4. [Google Scholar]
  30. Wójcik-Gront, E. Variables Influencing Yield-Scaled Global Warming Potential and Yield of Winter Wheat Production. Field Crops Res. 2018, 227, 19–29. [Google Scholar] [CrossRef]
  31. StatSoft. STATISTICA Ver. 13, Data Analysis Software System 2014; Statsoft: Tulsa, OK, USA, 2014. [Google Scholar]
  32. Johenneken, M.; Drak, A.; Herpers, R. Damage Analysis of Grassland from Aerial Images Applying Convolutional Neural Networks. In Proceedings of the 2020 International Conference on Software, Telecommunications and Computer Networks (SoftCOM), Virtual, 17–19 September 2020; IEEE: Split, Croatia; pp. 1–6. [Google Scholar]
  33. ten Harkel, J.; Bartholomeus, H.; Kooistra, L. Biomass and Crop Height Estimation of Different Crops Using UAV-Based Lidar. Remote Sens. 2019, 12, 17. [Google Scholar] [CrossRef]
  34. Zhou, L.; Gu, X.; Cheng, S.; Yang, G.; Shu, M.; Sun, Q. Analysis of Plant Height Changes of Lodged Maize Using UAV-LiDAR Data. Agriculture 2020, 10, 146. [Google Scholar] [CrossRef]
  35. Luo, S.; Liu, W.; Zhang, Y.; Wang, C.; Xi, X.; Nie, S.; Ma, D.; Lin, Y.; Zhou, G. Maize and Soybean Heights Estimation from Unmanned Aerial Vehicle (UAV) LiDAR Data. Comput. Electron. Agric. 2021, 182, 106005. [Google Scholar] [CrossRef]
  36. Gao, M.; Yang, F.; Wei, H.; Liu, X. Individual Maize Location and Height Estimation in Field from UAV-Borne LiDAR and RGB Images. Remote Sens. 2022, 14, 2292. [Google Scholar] [CrossRef]
  37. Pecho, P.; Škvareková, I.; Ažaltovič, V.; Bugaj, M. UAV Usage in the Process of Creating 3D Maps by RGB Spectrum. Transp. Res. Procedia 2019, 43, 328–333. [Google Scholar] [CrossRef]
  38. Maimaitijiang, M.; Sagan, V.; Erkbol, H.; Adrian, J.; Newcomb, M.; LeBauer, D.; Pauli, D.; Shakoor, N.; Mockler, T.C. UAV-Based Sorghum Growth Monitoring: A Comparative Analysis of Lidar and Photogrammetry. ISPRS Ann. Photogramm. Remote Sens. Spatial Inf. Sci. 2020, 3, 489–496. [Google Scholar] [CrossRef]
Figure 1. Areas of study; (A) UAV-derived RGB orthophoto of the field taken on 25 August 2022, where the red border indicates the total field area (43 ha) and the blue border indicates the selected area (4.5 ha) used for statistical analysis; (B) location of the study area on the map of Poland; (C) part of the field showing visible crop damage.
Agriculture 13 01627 g001
Figure 2. RGB orthophoto of the part of the field included in the study from 25 August 2022 (a) and from 24 October 2022 (b) with areas of crop damage selected by visual evaluation and on-ground photos with examples of crop damages (c).
Agriculture 13 01627 g002
Figure 3. Flowchart presenting the subsequent steps in the study, encompassing data acquisition through to the evaluation of accuracy in classifying diverse methods for determining crop damage.
Agriculture 13 01627 g003
Figure 4. NDVI orthophoto of the study area from 26 August 2022 (a), filtered values using the “edge” option based on the NDVI orthophoto (b), and areas assumed to have crop damage based on filer values below −0.12 (c).
Agriculture 13 01627 g004
Figure 5. DSM of the study area from 25 August 2022 (a), filtered values using the “edge” option based on DSM (b), filer value below −0.40 (c), and filer value below −0.4, where small areas below 3 m2 were excluded (d).
Agriculture 13 01627 g005
Figure 6. Histograms presenting the percentage of pixels with various ranges of the DSM filter value from 25 August 2022 for the reference areas of crop damage and undamaged crop.
Agriculture 13 01627 g006
Figure 7. Filer value below −0.4 based on DSM from 24 October 2022, with small areas below 3 m2 excluded.
Agriculture 13 01627 g007
Figure 8. Comparison of reference crop damage (polygons in blue color) with areas of crop damage selected using DSM (polygons in red color) for two dates: 25 August 2022 (a) and 24 October 2022 (b) in part of the study area.
Agriculture 13 01627 g008
Figure 9. Classification tree predicting the occurrence of crop damage on 25 August 2022 depending on variable z (filter value based on DSM) and normalized difference vegetation index (NDVI). In each node, the total number of observations and the number of observations in classes with a value of 0 (no damaged crop) and 1 (crop damage) are given.
Agriculture 13 01627 g009
Figure 10. Crop damage areas were selected based on a DSM filter value threshold (−0.73) set using CART analysis for 25 August 2022 (areas below 3 m2 were excluded).
Agriculture 13 01627 g010
Table 1. Specification of cameras Phantom 4 Pro and Phantom 4 Multispectral.
Phantom 4 ProPhantom 4 Multispectral
SensorsOne 1” CMOS (complementary metal–oxide–semiconductor) RGB sensorsSix 1/2.9” CMOS (complementary metal–oxide–semiconductor) sensors, one RGB, and five monochrome sensors
Resolution20 MP (5472 × 3648 pixels)2.08 MP (1600 × 1300 pixels)
WavelengthsVisible light—RGBBlue (B): 450 nm ± 16 nm; Green (G): 560 nm ± 16 nm; Red (R): 650 nm ± 16 nm; Red edge (RE): 730 nm ± 16 nm; Near-infrared (NIR): 840 nm ± 26 nm
LensesFOV (Field of view): 84°FOV (Field of view): 62.7°
Photo format JPEGJPEG (visible light imaging) + TIFF (multispectral imaging)
Table 2. Accuracy of classification of crop damage based on different methods in comparison to the reference areas of crop damage based on visual assessment for 25 August 2022. Results are presented in m2 (in brackets % of the reference area).
MethodTrue Positive
(Correctly Classified Crop Damage)
False Negative
(Omissions)
False Positive (Commissions)Estimated Crop Damage Area (% of the Reference Area)
Only areas larger than 3 m2 (reference crop damage area 573 m2)
NDVI-based—filter value threshold −0.12162.1 (28.3% *)411.3 (71.8%)62.3 (10.9%)224.4 (39.2%)
DSM-based—filter value threshold −0.40339.8 (59.3%)233.6 (40.8%)338.9 (59.1%)678.7 (118.4%)
CART-based—DSM filter value threshold −0.73251.5 (43.9%)321.8 (56.2%)57.7 (10.1%)309.2 (54.0%)
Only areas larger than 15 m2 (reference crop damage area 222 m2)
NDVI-based—filter value threshold −0.12108.3 (48.8%)114.2 (51.5%)17.2 (7.7%)125.5 (56.5%)
DSM-based—filter value threshold −0.40158.2 (71.3%)64.3 (29.0%)119.8 (54.0%)278.0 (125.2%)
CART-based—DSM filter value threshold −0.73147.9 (66.6%)74.5 (33.6%)37.3 (16.8%)185.2 (83.4%)
* percentage of the reference crop damage.
Disclaimer/Publisher’s Note: The statements, opinions and data contained in all publications are solely those of the individual author(s) and contributor(s) and not of MDPI and/or the editor(s). MDPI and/or the editor(s) disclaim responsibility for any injury to people or property resulting from any ideas, methods, instructions or products referred to in the content.

