Abstract
Improving the total factor productivity (TFP) of animal husbandry enterprises is the key to promoting the sustainable development of animal husbandry. Technological progress is an important driving force for improving the TFP of animal husbandry enterprises, and research and development (R&D) investment determines the speed of technological progress. Based on the data of Chinese animal husbandry enterprises listed on Shanghai and Shenzhen A-shares in China between 2009 and 2022, this article empirically analyzes the impact of R&D investment on the TFP of animal husbandry enterprises and the moderating role of executive incentives in it and discusses the heterogeneity of this impact, using the fixed-effects model. It is found that R&D investment has a significant positive impact on the TFP of animal husbandry enterprises, and the TFP of animal husbandry enterprises increased by 0.00105 for every 1% increase in R&D investment. Equity incentives for executives positively moderated the relationship between R&D investment and the TFP of animal husbandry enterprises, while executive compensation incentives negatively moderated the relationship. Heterogeneity analysis shows that R&D investment has a significant effect on the TFP of non-state-owned animal husbandry enterprises, but has no significant impact on the TFP of state-owned animal husbandry enterprises. The impact of R&D investment on TFP showed a significant promotion in the livestock and poultry breeding and meat product processing industries, but not in the feed production, dairy product processing and animal health industries. R&D investment has a significant effect on the TFP of animal husbandry enterprises in Eastern China and Central China, but has no significant impact on the TFP of animal husbandry enterprises in Western China.
1. Introduction
Animal husbandry provides about 13% of the energy and 28% of the protein consumed globally [1], providing direct livelihoods and economic benefits to at least 1.3 billion producers and retailers [2] and directly contributing to 12 of the 17 Sustainable Development Goals [3]. Animal husbandry enterprises are the mainstay of the animal husbandry economy and play an important role in animal husbandry production; they can not only supply all kinds of animal products, such as meat, eggs and milk, by raising animals, but can also promote the development and enhancement of animal husbandry by providing high-quality breeding stock, feed, veterinary medicine and other products. In addition, animal husbandry enterprises are able to actively introduce new technologies and varieties, helping to transform the animal husbandry industry into a modernized one [4,5].
Total factor productivity (TFP) refers to the ratio of total output to comprehensive factor input, usually understood as the “surplus” in the total output that cannot be explained by the factor input [6]. TFP can reflect the level of production technology, resource allocation and organizational management of production [7,8]. In the economics literature, many scholars use TFP to measure changes in firms’ economic growth and productivity levels [9,10,11]. The existing literature on the TFP of enterprises mainly focuses on industrial enterprises and manufacturing industries, while there is very little literature on TFP with animal husbandry enterprises as the object of study. China, as a developing country, has experienced the rapid development of its market economy since the implementation of the reform and opening-up policy in 1978. Animal husbandry enterprises in China have also developed rapidly in the last four decades. According to incomplete statistics by the author, the total assets of 70 animal husbandry enterprises listed on the Shanghai and Shenzhen A-shares in China in 2022 are approximately RMB 1172 billion, covering almost all animal husbandry production chains, such as livestock and poultry breeding, feed production, meat product processing, dairy product processing and animal healthcare. However, the main source of China’s economic growth after the reform and opening up is the increase in factor inputs, and most of China’s animal husbandry enterprises are at the middle and lower end of the value chain, selling low value-added products to maintain the high speed of enterprise development. According to the theory of economic growth, economic growth obtained by increasing factor inputs is followed by diminishing marginal returns, which leads to the cessation of economic growth. Only through technological progress and other methods of improving TFP can sustainable economic development be fundamentally achieved [12,13,14,15]. Therefore, improving the TFP of animal husbandry enterprises is of great significance in promoting the sustainable development of the sector.
Endogenous growth theory believes that endogenous technological innovation is a guarantee of sustained economic growth and an important path to promoting the continuous improvement of TFP [16,17]. Research and development (R&D) investment, as the basis and core of technological innovation, brings about an incremental increase in technology and knowledge that can promote technological upgrades, and thus increase TFP. There has been some literature on the impact of R&D investment on firms’ TFP, but the findings vary widely. Some studies believe that R&D investment can promote the improvement of the TFP of enterprises. Goto (1989) found that R&D investment contributes significantly TFP improvement in Japanese manufacturing firms [18], and this finding has also been confirmed in the United States, India and China [19,20,21]. Xiao (2022) found that global enterprise R&D investment can significantly improve TFP based on data from 119 countries surveyed by the World Bank between 2007 and 2017 [22]. Another part of the study argues that R&D investment does not contribute to the growth of firms’ TFP and even has a dampening effect on it. Fernandes (2008), based on data from manufacturing firms in Bangladesh, found that R&D investment does not always contribute to TFP and may also have a negative impact [23]. Tang et al. (2012) found that R&D investment has a negative relationship with the TFP of Chinese industrial firms [24]. In addition, some studies have argued that the impact of R&D investment on firms’ TFP is not a simple linear relationship. Wang (2020) found a U-curve relationship between R&D investment and the TFP of listed companies in coastal China [25]. Some other studies have found that R&D investment has a lag in the improvement of firms’ TFP [26,27]. After sorting out the findings, it was found that the inconsistency in the findings on the impact of R&D investment on enterprises’ TFP may be due to the differences in the selection of the enterprises’ samples, the research methodology, the indicators of R&D investment and the methods of measuring TFP. Therefore, based on the data of the Chinese animal husbandry enterprises listed in China’s Shanghai and Shenzhen A-shares, this research investigates how R&D investment in animal husbandry enterprises in developing countries, represented by China, actually affects the TFP of the enterprises, with a view to providing a reference basis for enhancing the TFP of animal husbandry enterprises in China and providing a reference basis for the sustainable development of animal husbandry enterprises in other developing countries.
The improvement of the TFP of enterprises is inseparable from the role played by enterprise managers, especially senior managers [28]. Due to the high investment and high risk of R&D activities [29], executives may choose to avoid risks and reduce R&D investment out of their own interests [30,31]. Therefore, properly motivating executives can help them make decisions that are more in line with the long-term development of the enterprise. Several studies have found a positive relationship between executive incentives and enterprises’ performance through empirical studies [32,33,34]. Han (2011) found that executive incentives can play a positive moderating role between R&D investment and enterprises’ performance [35]. In contrast, Chinese scholars found that the moderating role of executive incentives between R&D investment and enterprises’ performance was inconsistent when Chinese enterprises were used as the subject of the study. Xue (2015) found that executive equity incentives play a positive moderating role in enterprises’ R&D investment and financial performance, while executive compensation incentives are a negative moderating role [36]. Chen (2017) found that executive equity incentives have a positive moderating effect on R&D investment for enterprise performance improvement, while executive compensation incentives have no significant moderating effect [37]. In this context, this article incorporates executive incentives as a moderating variable into the framework of the impact of R&D investment on TFP in animal husbandry enterprises to explore the role played by executive incentives in the relationship between R&D investment and TFP in animal husbandry enterprises.
From the existing literature, the conclusion of whether the impact of enterprise R&D investment on TFP is promoted or inhibited, whether executive incentive can play a role between enterprise R&D investment and TFP and whether it plays a positive or negative regulatory role has not yet been unanimous. Based on this, the research goal of this paper is to empirically analyze whether the R&D investment of animal husbandry enterprises can promote the improvement of TFP, what role executive incentives play in the relationship between the two and whether these conclusions will show differentiated characteristics in different types of animal husbandry enterprises. Through research, we find that the R&D investment of animal husbandry enterprises has a significant effect on improving their TFP, and the executive equity incentive can play a positive regulating role in the relationship between R&D investment and the TFP of animal husbandry enterprises, while the executive compensation incentive plays a negative regulating role. The impact of R&D investment on the TFP of animal husbandry enterprises varies according to the nature of ownership, industries and regions. Based on this, this paper argues that animal husbandry enterprises should increase R&D investment and scientifically implement equity incentive and salary incentive policies for executives, while the government should consider the heterogeneity of animal husbandry enterprises to formulate corresponding R&D subsidy policies.
Our article is structured as follows. The theoretical analysis and research hypotheses are presented in Section 2. The data, variable selection and methodology are presented in Section 3. The impact of R&D investment on the TFP of Chinese animal husbandry enterprises and the moderating role of executive incentives in it are analyzed in Section 4. A discussion is presented in Section 5. The conclusions and policy implications are presented in Section 6.
2. Theoretical Analysis and Research Hypotheses
2.1. The Impact of R&D Investment on TFP of Animal Husbandry Enterprises
As Schumpeter (1912) proposed in “The Theory of Economic Development”, fundamental innovative changes could upset the economic equilibrium, as well as two basic forms of economic life: circular flows and economic development [38]. Subsequently, in his publication, “Capitalism, Socialism and Democracy”, he defined a mechanism for explaining the structure of economic evolution (innovative destruction) [39]. He believes that innovation leads to the introduction of new goods, technologies and new organizational structures. Innovation is an important path to promoting the improvement of TFP, and R&D investment, as the support point for innovation in animal husbandry enterprises, helps enterprises to accelerate technological progress, thus contributing to the improvement of enterprises’ TFP [40]. Therefore, we argue that R&D investment can enhance the TFP of animal husbandry enterprises through the following four aspects: First, increased R&D investment by animal husbandry enterprises is conducive to upgrading the knowledge stock and technology level of the enterprises, thereby promoting TFP through improving product production processes and upgrading employee skills. Second, the increase in R&D funding of animal husbandry enterprises helps investment to release a positive signal to the outside world that they attach importance to scientific and technological innovation, thereby attracting enterprises and scientific research institutions with strong scientific and technological strength to cooperate with them and promote the further improvement of the technical level of enterprises. Third, the increase in R&D investment is conducive to optimizing the allocation of resources, and the technological progress brought by R&D investment is makes it easy to induce the substitution of factors, such as the development of new breeding equipment and technology, which can reduce the demand for labor. In addition, the technological progress brought about by R&D investment can also promote the flow of factors such as capital and labor between different production sectors of animal husbandry enterprises until the level of factor allocation reaches an optimal level, thus further increasing the TFP of enterprises. Fourth, the increase in R&D investment is also conducive to improving the production organization and management level of enterprises while optimizing the allocation of resources [41], which also contributes to the improvement of enterprises’ TFP. Based on the above analysis, research Hypothesis 1 was proposed.
H1:
R&D investment can promote the TFP of animal husbandry enterprises, i.e., the more R&D investment in animal husbandry enterprises, the higher the TFP of the enterprises.
2.2. The Moderating Effect of Executive Incentives in the Impact of R&D Investment on TFP in Animal Husbandry Enterprises
Senior managers of enterprises are the decision-makers and managers of enterprise innovation, which is important for the improvement of the TFP and sustainable development of animal husbandry enterprises. According to the principal-agent theory [42,43], enterprise owners as principals pursue the maximization of the enterprise value, while executives as agents tend to pursue the maximization of their interests, and these different goals may lead to divergence in decision-making between the two. Due to the characteristics of large investments and high uncertainty in R&D activities, executives who focus only on short-term benefits tend to make decisions to reduce R&D investment in enterprises, which is not conducive to the enhancement of TFP in animal husbandry enterprises. By incentivizing executives, animal husbandry enterprises can closely combine the interests of executives with the interests of enterprises and shareholders, so that the goal of executives for enterprise development will change from pursuing short-term profit maximization to pursuing the maximization of corporate value in order to actively increase R&D investment and promote the improvement of the TFP of enterprises. Common incentive methods for the listed companies to corporate executives include equity incentives and compensation incentives [44]. In terms of equity incentives, the acquisition of equity by an executive makes the executive one of the owners of the business [45,46]. When a livestock enterprise makes a profit, the executives not only receive profit sharing but also have the right to claim retained earnings. The fact that executives’ personal interests are closely linked to the enterprise’s performance can make executives more concerned about the firm’s long-term value and sustainable development, thus making it easier for executives to make decisions to increase R&D investment, which promotes the enterprise’s TFP. In terms of compensation incentives, the implementation of compensation incentives for executives is conducive to mobilizing the work motivation of executives [47], so that executives can engage in R&D activities that promote the TFP of enterprises and promote the smooth implementation of R&D investment projects of enterprises. Based on the above analysis, we propose Hypothesis 2a and Hypothesis 2b.
H2a:
Executive equity incentives play a positive moderating role in the process of the impact of R&D investment on TFP in animal husbandry enterprises.
H2b:
Executive compensation incentives play a positive moderating role in the process of the impact of R&D investment on TFP in animal husbandry enterprises.
3. Materials and Methods
3.1. Data Source
The data used in the present study were obtained directly from the China Stock Market and Accounting Research (CSMAR) Database, which has been used in several other studies [48,49,50] focusing on the animal husbandry enterprises listed in Shenzhen and Shanghai A-shares in China. In 2008, the State Administration of Taxation of China, for the first time, standardized the management of enterprises’ R&D investment expenses, and issued a special notice entitled “Administrative Measures for Pre-tax Deduction of Enterprise R&D Expenses (Trial)”. To ensure the standardization and feasibility of the data, this report selects the data from 2009, after the implementation of standardized management, and selects the sample from 2009~2022. In accordance with existing research practices and the characteristics of this study, the sample is screened as follows: firstly, ST and *ST firms are deleted; secondly, firms with serious missing data are excluded; finally, to mitigate the effect of extreme values, we shrink the upper and lower 1% of all continuous variables. In this study, a total of 556 unbalanced panel sample data of 72 listed animal husbandry enterprises were obtained, and 72 enterprises were divided into five types according to their main businesses: livestock and poultry breeding, feed production, meat product processing, dairy product processing and animal healthcare. Table 1 shows the 72 sample enterprises.

Table 1.
Sample of animal husbandry enterprises listed on Shanghai and Shenzhen A-shares in China.
3.2. Variables Selection
3.2.1. Dependent Variable
The existing literature that used dataset panel dimensions to measure TFP at the firm level includes Olley and Pakes (1996) [51] and Levinsohn and Petrin (2003) [52]. Both methods attempt to reduce the bias caused by the correlation between productivity and input choices at the firm level. The core idea of Olley and Pakes’ theory is to use a firm’s level of investment as a proxy variable for productivity. This method assumes that firms will make investment decisions based on the current productivity situation, so it uses the current investment of firms as a proxy variable for unobservable productivity shocks, thereby solving the problem of simultaneity bias. However, the method needs to satisfy the monotonic increase between investment and production; that is, these samples with zero investment amount cannot be estimated. The reality is that not every business has positive investments every year, so there are limitations to this approach. Levinsohn and Petrin, on the other hand, build on Olley and Pakes, arguing that instead of using investment amount as a proxy variable, they should use intermediate inputs as indicators. In this way, researchers can flexibly select proxy variables based on the available data. Therefore, compared with the OP method, this paper argues that the LP method is more suitable for measuring the TFP of livestock enterprises. However, in the robustness test, the OP method was used in this study to verify its robustness. The variables involved in calculating the TFP of livestock enterprises in LP are: (1) the added value of the enterprise—expressed by the natural logarithm of the main business; (2) capital investment—expressed by the natural logarithm of net fixed assets: (3) labor income—expressed by the natural logarithm of the employees of the enterprise; (4) Intermediate input—expressed as the natural logarithm of the enterprise’s “cash for purchasing goods and accepting payment for services”.
3.2.2. Core Independent Variable
The natural logarithm of the amount of R&D investment is used to express the R&D investment with reference to the existing study [37].
3.2.3. Moderator Variables
The moderator variables are measured by two variables: executive shareholding and executive compensation. Executive shareholding is expressed as the ratio of the number of shares held by executives to the total number of shares in the enterprise, and executive compensation is expressed as the natural logarithm of executive compensation.
3.2.4. Control Variables
Drawing on the relevant studies [53,54], the enterprise size, enterprise age, gearing ratio, return on net assets, board size, ratio of independent directors, power balance with shareholder structure and duality were selected as the control variables. The variables are described in Table 2.
Table 2.
Variables definitions and formulas.
3.3. Empirical Models
The data collected in this research is panel data that include two dimensions: individual and time. The Fixed Effects Model is often used in panel data analysis because of its advantages in the following aspects [55]: First, it solves the problem of missing variables that do not change over time but change with individuals. For example, other characteristic variables that do not change over time, such as the culture of the enterprise, are often difficult to measure and easy to miss, and the individual fixed effect can separate the individual differences of the enterprise from the overall relationship and eliminate the differences between individuals, and thus more accurately estimate the relationship between the variables. Second, it solves the problem of missing variables that do not change with individuals but change over time. For example, the annual macroeconomy will not be affected by an individual livestock enterprise, and if you need to strip the macroeconomic impact, you need to introduce a fixed effect of the year. At the same time, in order to control for the differences between different provinces, this paper also adds the province-fixed effect to the model.
Therefore, the benchmark regression model set up in this study is as follows:
where is the enterprise and is the year. represents the total factor productivity of animal husbandry enterprises. represents the natural logarithm of R&D investment amount. represents the group of control variables. represents the fixed effects, including the enterprise, year and province. represents a random perturbation term. represents a constant term. and are coefficients to be estimated.
To further explore the moderating role of executive incentives in R&D investment affecting the TFP of animal husbandry enterprises, the following models are established, respectively:
Equations (2) and (3) correspond to Hypotheses 2a and 2b, respectively. represents the percentage of the number of shares held by executives to the total number of shares in the enterprise. represents the interaction term between and , which is used to verify the moderating effect of executive equity incentives on the relationship between R&D investment and TFP in animal husbandry enterprises. represents the natural logarithm of executive compensation. represents the interaction term between and , which is used to verify the moderating effect of executive compensation incentives on the relationship between R&D investment and TFP in animal husbandry enterprises.
4. Results
4.1. Descriptive Statistical Analysis
4.1.1. Descriptive Statistical Analysis of Major Variables
Table 3 shows the descriptive statistics for the variables. The TFP of animal husbandry enterprises calculated using the LP method had a mean of 14.930, a standard deviation of 1.076 and a median of 14.790, indicating that the TFP was not significantly skewed. The natural logarithm of R&D investment was taken to have a mean of 17.324, a standard deviation of 1.560 and a median of 17.437, indicating that R&D investment is basically normally distributed. The mean value of executive shareholding is 6.958, the standard deviation is 13.595, the minimum value is 0.000 and the maximum value is 56.143, which indicates that there is a big difference in the equity incentives given to executives in different animal husbandry enterprises. The natural logarithm of executive compensation was taken to have a mean of 15.132, a standard deviation of 0.934, a minimum value of 12.665 and a maximum value of 17.594, indicating that there is less disparity in the compensation of executives in animal husbandry enterprises compared to the executive shareholding.
Table 3.
Descriptive statistics for variables.
4.1.2. Distribution Characteristics of TFP of Animal Husbandry Enterprises
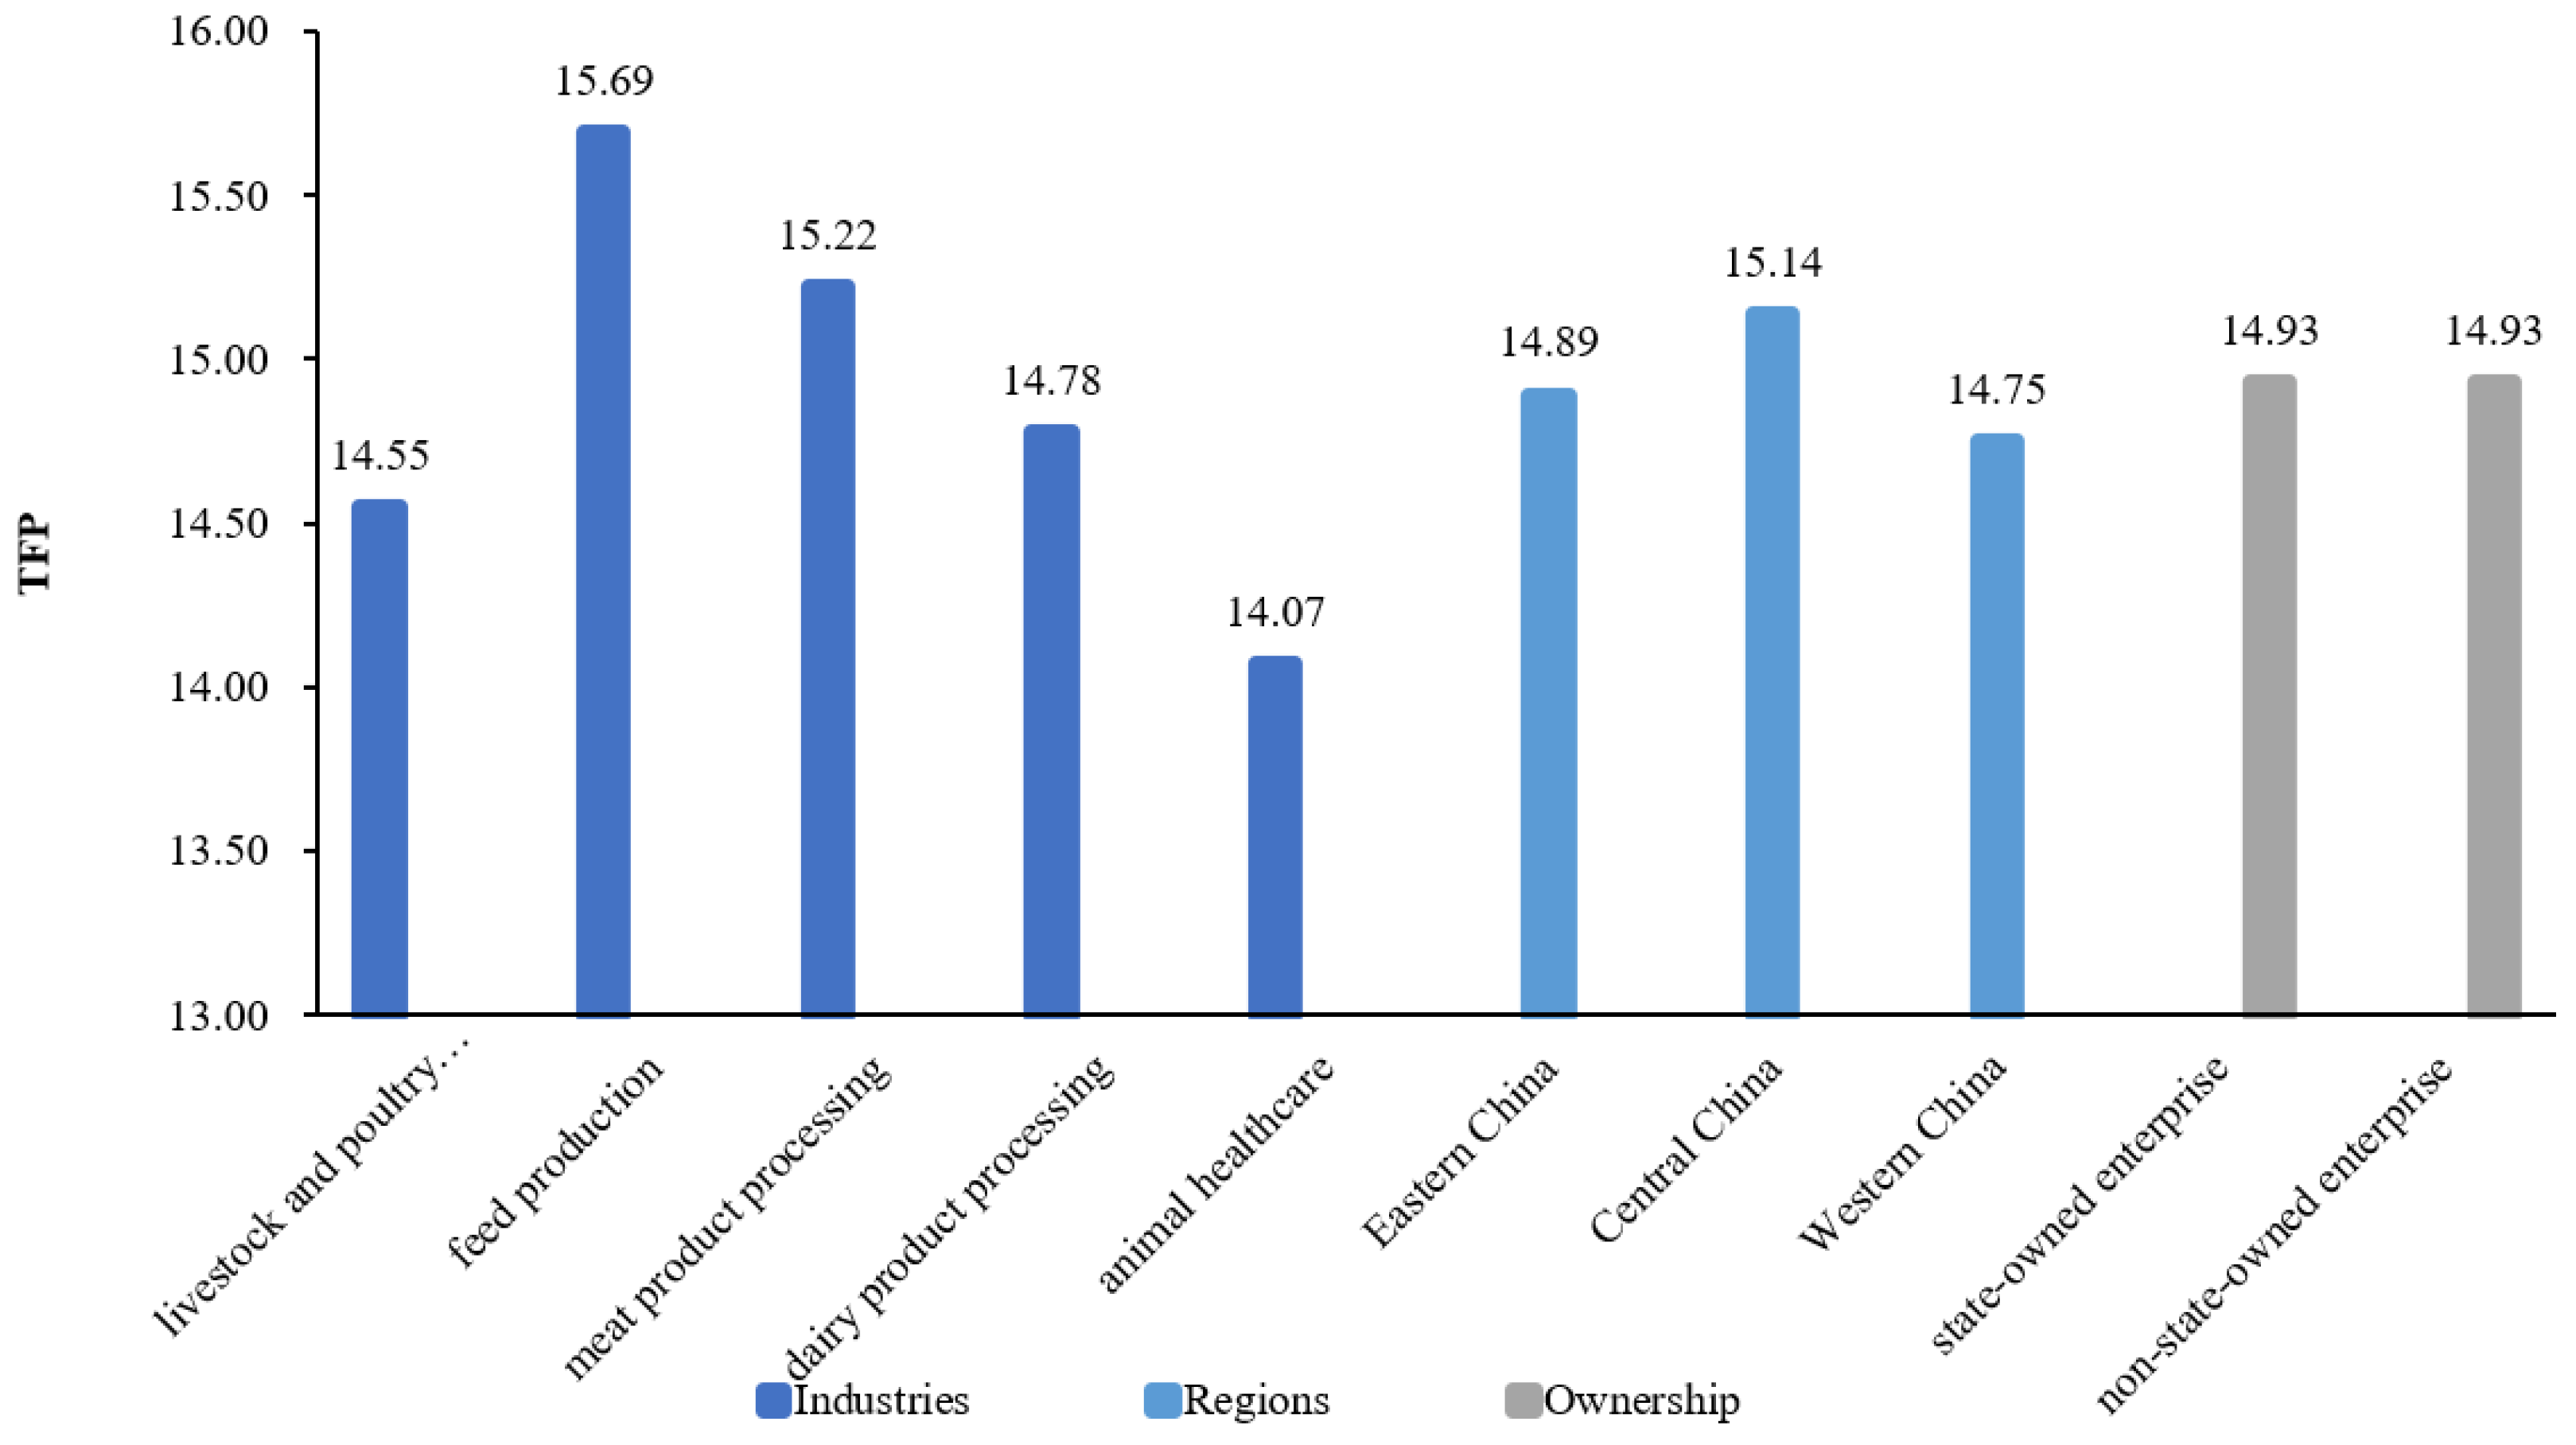
As shown in Figure 1, the average TFP of Chinese animal husbandry enterprises between 2009 and 2022 has different distribution characteristics in different industries, different regions and different ownership types. From the perspective of industry distribution characteristics, feed production enterprises have the highest TFP (average value of 15.69), followed by meat processing enterprises (average value of 15.22), dairy processing enterprises (average value of 14.78), livestock and poultry breeding enterprises (average value of 14.55) and, finally, animal health enterprises (average value of 14.07). From the perspective of regional distribution characteristics, the TFP of animal husbandry enterprises in Central China is the highest (15.14 on average), followed by animal husbandry enterprises in Eastern China (14.89 on average) and animal husbandry enterprises in the Western region (14.75 on average). From the perspective of enterprise ownership type, the average TFP of state-owned livestock enterprises and non-state-owned livestock enterprises between 2009 and 2022 was 14.93, which did not show a significant difference.
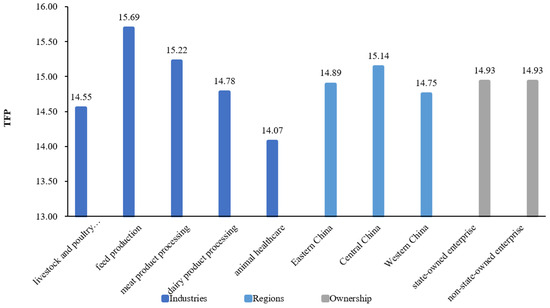
Figure 1.
Distribution of TFP of Chinese animal husbandry enterprises in different industries, regions and ownership types from 2009 to 2022.
4.2. The Impact of R&D Investment on TFP of Animal Husbandry Enterprises
Table 4 shows the results of the benchmark regression on the impact of R&D investment on the TFP of animal husbandry enterprises. Columns (2)~(5) are based on column (1) under continuously adding control variables and the enterprise, year and province fixed effect. The results show that R&D investment always has a significant positive impact on the TFP of animal husbandry enterprises; that is, R&D investment significantly improves the TFP of animal husbandry enterprises. Using the regression results in column (5), the TFP of animal husbandry enterprises increased by 0.00105 for every 1% increase in R&D investment under the condition that the other influencing factors remained unchanged. Research Hypothesis 1 was validated.
Table 4.
Benchmark regression results on the impact of R&D investment on TFP of animal husbandry enterprises.
4.3. Dealing with Endogeneity
From the perspective of the interaction logic between R&D investment and the TFP of animal husbandry enterprises, increased R&D investment by enterprises can improve their TFP by promoting technological progress; however, on the contrary, enterprises with higher TFP may have more resources to invest in R&D, thereby promoting further R&D investment. Therefore, the above benchmark model may have endogenous problems caused by mutual causation and sample selection bias. We used the instrumental variable method, dynamic panel system generalized method of moment and propensity score matching analysis to solve this problem.
4.3.1. Instrumental Variable Method
Using instrumental variables is a common way to solve endogenous problems caused by mutual causation. The ideal instrumental variable must satisfy both the correlation and exogenous conditions. Drawing on the practices of Wang (2023) [56] and He et al. (2023) [57], we select the mean of the natural logarithm (Dmean) of enterprise R&D investment in the same industry and the same year as the instrumental variable of R&D investment for two-stage least squares (2SLS) estimation. The main basis is that the R&D investment of an enterprise usually refers to the overall R&D investment of the industry, which meets the relevant conditions; however, the overall R&D investment of the industry will not have a direct impact on the TFP of the enterprise, which meets the exogenous conditions. In addition, we selected the tax incentives (Taxinc) received by animal husbandry enterprises as an instrumental variable for R&D investment. The reason for this is that tax incentives can improve the enthusiasm of enterprises towards R&D investment by reducing the tax cost of enterprise scientific and technological innovation, but they cannot have a direct impact on the TFP of enterprises and meet the relevance and exogenous requirements. Referring to the practice of Liu (2016) [58], tax incentives are expressed by various tax refunds received by enterprises/(various tax refunds received + various taxes paid).
To ensure the effectiveness of the instrumental variable selection, a weak identification test and an over-identification test were performed. The weak instrumental variable test results show that the Cragg-Donald Wald F statistic is 38.581, which is much greater than the critical value of 19.93 at the 10% bias level, indicating that there is no weak instrumental variable problem. The results of the over-identification test show that the p-value of the Sargan statistic corresponding to the instrumental variable test is 0.1210, which cannot reject the null hypothesis that “all instrumental variables are exogenous” at the significance level of 10%, indicating that the instrumental variable meets the exogenous requirements. Therefore, the two instrumental variables selected in this article are valid. The regression results using the instrumental variables are shown in the first and second columns of Table 5, and in the first stage of regression, the estimated coefficients for both the Dmean and Taxinc variables were positive and significant at the statistical level of 1%, indicating a strong correlation between the instrumental variables and animal husbandry enterprise R&D investment. In the second stage of main regression, the estimation coefficient of the R&D investment variable after correcting for endogenous problems was still positive and significant at the statistical level of 5%, indicating that the baseline results were robust.
Table 5.
The estimate results of two stage least square and System Generalized Method of Moments.
4.3.2. System Generalized Method of Moment (SYS GMM)
The TFP at the firm level has a certain degree of continuity; that is, there is a sequence correlation. To solve this problem, we refer to the practice of Song et al. (2021) [59] and use system GMM estimation to test the robustness of the previous conclusions, as shown in column 3 of Table 5. From the model test results, it can be seen that the p-value of AR(1) is 0.000 and the p-value of AR(2) is 0.512, which indicates that there is first-order autocorrelation but no second-order autocorrelation. Therefore, the null hypothesis that “disturbance term has no autocorrelation” cannot be rejected, indicating that the model setting is reasonable. The p-value corresponding to the Sargan overidentification test is 1, which cannot reject the null hypothesis that “all instrumental variables are valid”, indicating that the selection of instrumental variables is reasonable and meets the GMM conditions of the system. The regression results show that R&D investment is significantly positive at the significance level of 5%, indicating that after considering the characteristics of TFP series correlation (control L.TFP and its resulting endogenousness), R&D investment still has a promoting effect on the TFP of animal husbandry enterprises.
4.3.3. Propensity Score Matching Analysis (PSM)
Due to the possible problem of sample selection bias, we chose the propensity score matching method to control the endogenous problem. According to the median RD of the enterprise, the sample enterprises were grouped into two groups—the high R&D group (treatment group) and the low R&D group (control group)—and the Logit model was used to estimate their tendency score value. The size of the enterprise (Size), the age of the enterprise (Age), the return on net assets (ROA) and the power balance with shareholder structure (PBSS) were selected as the covariates, and one-to-one nearest neighbor matching, radius matching and kernel matching were used for matching. The results are shown in Table 6. The estimation results of the three matching methods are consistent, R&D investment has a significant positive impact on the TFP of animal husbandry enterprises and the previous conclusion is still robust.
Table 6.
Results of Propensity Score Matching estimation.
4.4. Robustness Test
4.4.1. Exclude Specific Samples
Considering that newly listed companies may publish high data such as R&D investment for their own interests, which will affect the model estimation results, the sample of companies with an age of 0 (i.e., the annual report data of the current year) is deleted. In addition, the R&D investment of enterprises with a short time to market may be unstable, and this article continues to exclude samples with a market life of 3 years or less on the basis of deleting the sample of the enterprise’s age of 0. The results are shown in columns (1) and (2) of Table 5, and the estimated coefficient for R&D investment is still significantly positive.
4.4.2. Replace Variables
First, the TFP of animal husbandry enterprises remeasured using the OP method replaces the TFP measured using the LP method. In addition, the WRDG method proposed by Wooldridge [60] improves the estimation method of the OP method and LP method, which can obtain a robust standard error considering sequence correlation and heteroscedasticity. Therefore, the TFP of animal husbandry enterprises measured using the WRDG method regressed instead of the total factor productivity measured using the LP method. The regression results using the OP method and the WRDG method as the explanatory variables are shown in columns (3) and (4) of Table 7, respectively, and the estimated coefficients of R&D investment are still significantly positive, indicating that the estimates are robust.
Table 7.
Robustness test.
4.5. The Lagging Effect of R&D Investment
Some of the authors in the existing literature believe that R&D investment may take some time to exert its effect, and the lag effect of R&D investment is analyzed by introducing the lag of R&D investment. For example, Kong et al. (2014) [26] found that the lag of R&D investment in the first period affects the productivity of manufacturing enterprises. Yang et al. (2014) [61] found that the lag of R&D investment in the first and second periods has a significant positive impact on the productivity of new start-ups. Deng et al. (2011) [27] found that the impact of R&D activities on TFP generally lags by 2–3 years. Therefore, to test whether the R&D investment of animal husbandry enterprises has a hysteresis effect on its TFP, this article introduces the first, second and third lags of R&D investment to regress the TFP, respectively. The results are shown in Table 8. The lag period of R&D investment by animal husbandry enterprises did not have a significant impact on TFP. This may be because, compared with other industries, the R&D investment of livestock enterprises in livestock and poultry breeding, feed production and food processing is mostly in the form of applied research, which can be quickly converted into productivity, so the lag effect is not obvious enough.
Table 8.
Regression results of the effect of R&D’s lagged term on TFP of animal husbandry enterprises.
However, as an enterprise’s increasing R&D investment can improve its knowledge stock and technology stock, its cumulative R&D investment may promote its TFP. Therefore, we calculated the cumulative R&D investment based on the company’s R&D investment in each year using the natural logarithm and introduced it into the model as an explanatory variable. The regression results are shown in Table 9. Cumulative R&D investment (RDsum) has a significant promoting effect on the TFP of animal husbandry enterprises, and this conclusion still holds after continuously adding the control variables, enterprise and year fixed effects.
Table 9.
Regression results on the impact of cumulative R&D investment on TFP of animal husbandry enterprises.
4.6. The Moderating Effect of Executive Incentives
To alleviate the high degree of collinearity between the interaction term and the independent and moderator variables, we centralize R&D investment, executive shareholding and executive compensation. From the perspective of the relationship between executive incentives and the TFP of animal husbandry enterprises, executives with stronger incentives help enterprises improve their TFP, and in turn, higher productivity firms may also provide higher compensation and equity for employees. In order to solve this endogenous problem, we select the average shareholding ratio and average compensation of executives in the same province and the same year as the instrumental variables of executive shareholding and executive compensation, respectively. The main basis for the selection of the instrumental variables is that the average shareholding ratio and average compensation of executives in the same year in the same province will affect the shareholding ratio and compensation of executives of the enterprise, but will not directly affect the TFP of the enterprise, so the conditions of correlation and exogenousness are met. At the same time, we use tax incentives as the instrumental variable of R&D investment, and the instrumental variable of the interaction term is the product of the instrumental variable of executive incentive and the instrumental variable of R&D investment. On this basis, we use the two-stage least squares method for the estimation, and the regression results are shown in columns (1) and (2) of Table 10. The models passed the weak identification test and the overidentification test, indicating that the selected instrumental variable is valid. Column (1) shows that the coefficient of the interaction RD × ES is 0.002, which is significant at the level of 1%. This shows that the equity incentive for executives plays a positive moderating role in the impact of R&D investment on the TFP of enterprises. In other words, with the increase in the shareholding ratio of executives, the role of R&D investment in improving the TFP of animal husbandry enterprises has been strengthened, and research Hypothesis 2a has been verified. Column (2) shows that the coefficient of the interaction RD × EC is −0.032, which is significant at the level of 1%. Research Hypothesis 2b has not been verified. The reason for this may be that there is a conflict of interest between the company’s R&D investment and the remuneration of executives, and executives reduce R&D investment to maintain their salary, which affects the TFP of animal husbandry enterprises.
Table 10.
The moderating effect of executive incentives.
4.7. Analysis of Heterogeneity
4.7.1. Heterogeneity of Enterprise Ownership
According to the nature of the ownership of enterprises, Chinese animal husbandry enterprises can be divided into state-owned enterprises and non-state-owned enterprises, and there are great differences between the two in terms of their management system, governance structure and resource acquisition. Therefore, regression is conducted on the samples of state-owned enterprises and non-state-owned enterprises, respectively, to test whether the impact of R&D investment on the TFP of animal husbandry enterprises is different between the two; the regression results are shown in Table 11. The results show that the impact of R&D investment of state-owned animal husbandry enterprises on their total factor productivity is not significant, while the impact of R&D investment of non-state-owned animal husbandry enterprises on their total factor productivity is positive and significant at the level of 1%. This shows that non-state-owned enterprises have higher R&D investment efficiency than state-owned enterprises. The reason for this is that non-state-owned enterprises are more flexible in terms of their management system and execution of R&D innovation activities, thus making the contribution of R&D investment to the TFP of these animal husbandry enterprises more obvious.
Table 11.
Results of heterogeneity analysis of animal husbandry enterprises under different ownership systems.
4.7.2. Heterogeneity of Enterprise Industry
Considering the differences in the R&D activities and technical characteristics of animal husbandry enterprises in different industries, we divide animal husbandry enterprises into five categories: livestock and poultry breeding, feed production, meat product processing, dairy product processing and animal healthcare. The results of the regression tests for these five industry groups are shown in Table 12. R&D investment has a significant positive impact on the TFP of animal husbandry enterprises in the livestock and poultry breeding and meat product processing industries, while in the three remaining industries (feed production, dairy product processing and animal health), R&D investment has no significant impact on the TFP of the enterprises. This may be because, compared with other industries, China’s dairy product processing enterprises started late and from a low base, and are in the early stage of development. Therefore, R&D investment does not have a significant effect on the TFP of dairy product processing enterprises. In the animal health industry, the R&D cycle for products such as vaccines and veterinary medicines is longer, and R&D investment may not be able to improve the TFP of these enterprises in the short term.
Table 12.
Results of heterogeneity analysis of animal husbandry enterprises in different industries.
4.7.3. Regional Heterogeneity in Which the Enterprise Is Located
According to the level of economic development and geographical location, China has formed three major economic regions: Eastern, Central and Western. There are several differences in the level of economic development and the atmosphere of enterprises’ R&D investment in the different regions. Therefore, in this article, we conduct group regression of the animal husbandry enterprises in different regions to test whether the impact of R&D investment on the TFP of animal husbandry enterprises varies depending on the region where the enterprises are located. The regression results are shown in Table 13. R&D investment has a significant positive impact on the TFP of animal husbandry enterprises in Eastern China and Central China. However, the TFP of animal husbandry enterprises in Western China is not significant. These differences might be due to differences in the R&D investment in different regions. According to the sample data, the average R&D investment of animal husbandry enterprises in Western China is 16.89 (after taking the natural logarithm). There is a significant gap between Eastern China (mean is 17.26) and Central China (mean is 17.67). Hence, the regions in Eastern China and Central China with better R&D investment foundations are more likely to promote TFP in enterprises.
Table 13.
Results of heterogeneity analysis of animal husbandry enterprises in different regions.
5. Discussion
First, this study finds that the R&D investment of animal husbandry enterprises has a significant positive impact on their total factor productivity, which is consistent with the conclusions of Goto (1989) [18] and Xiao (2022) [22]. Unlike Kong et al. (2014) [26], Yang et al. (2014) [61] and Deng et al. (2011) [27] found that the lag of R&D investment has a significant effect on total factor productivity; this research claims that the lag of R&D investment of animal husbandry enterprises from one to three lags has no significant impact on TFP. However, the cumulative R&D investment obtained by the cumulative R&D investment of animal husbandry enterprises each year has a significant role in promoting the TFP of livestock enterprises, indicating that animal husbandry enterprises can increase the knowledge stock and technology stock of enterprises through increasing R&D investment, thereby promoting the improvement of TFP. Secondly, this research also confirms that executive equity incentive plays a positive regulating role in the impact of R&D investment on the TFP of animal husbandry enterprises, while executive compensation incentive has a negative moderating effect on the relationship between the two, which is similar to the conclusion that executive equity incentive and salary incentive play a role in the relationship between enterprise R&D investment and financial performance found by Xue et al. (2015) [36]. In addition, this article finds that the impact of R&D investment efficiency on animal husbandry enterprises’ TFP varies according the firm system (non-state-owned enterprises are more efficient than state-owned enterprises), from region to region (the efficiency of Eastern China and Central China is better than that of Western China) and the industry (the efficiency of livestock and poultry breeding and meat product processing is better than that of feed production, dairy product processing and animal healthcare industry). Therefore, the government should consider the heterogeneity of animal husbandry enterprises and formulate corresponding R&D and subsidy policies.
Moreover, compared with previous studies, we have also made some improvements in the models and methods. First, as the two-way fixed-effect model of individuals and time can solve both the problem of missing variables that do not change with time but change with individuals and the problem of missing variables that do not change with individuals but change with time, we chose this model as the main model for our argumentation. At the same time, to control for the differences between different provinces, the study also added the fixed effect of provinces to the model. Secondly, to better suggest a clear causal effect, this study also used the instrumental variable method, dynamic panel system GMM and propensity score matching analysis to alleviate the possible endogeneity in this article, making the research conclusion more robust.
It is important to note that this study still has some limitations. For example, in the process of R&D investment affecting TFP, the conversion rate of R&D investment is also related to factors such as the regional economic foundation, innovation ability and actual implementation, which may also be the intermediary mechanism of R&D investment affecting TFP; this is also the direction we want to further the study in the future.
6. Conclusions
6.1. Conclusions
The main conclusions of the article are as follows: First, R&D investment has a significant effect on the total factor productivity of animal husbandry enterprises; that is, the greater the R&D investment of animal husbandry enterprises, the higher the total factor productivity of enterprises, and the above conclusion is still valid after dealing with the endogeneity and the robustness test. Second, the equity incentive for executives can strengthen the effect of R&D investment on the TFP of animal husbandry enterprises, while the incentive for executive compensation will weaken the effect of R&D investment on the TFP of livestock enterprises. Third, the impact of R&D investment on the TFP of livestock enterprises varies according to the nature of the ownership, industry and region. R&D investment has a significant effect on the TFP of non-state-owned animal husbandry enterprises, but has no significant impact on the TFP of state-owned animal husbandry enterprises. The impact of R&D investment on the TFP of animal husbandry enterprises showed a significant promotion in the livestock and poultry breeding and meat product processing industries, but not in the feed production, dairy product processing and animal healthcare industries. R&D investment has a significant effect on the TFP of livestock enterprises in Eastern China and Central China, but has no significant impact on the TFP of animal husbandry enterprises in Western China.
6.2. Policy Implications
There are important policy implications for improving the TFP of animal husbandry enterprises shown in the above conclusions.
First, animal husbandry enterprises should increase their investment in research and development. Technological progress is an important driving force for improving the TFP of animal husbandry enterprises, and R&D investment determines the speed of technological progress. Compared with developed countries, Chinese animal husbandry enterprises started late and from a low base, have insufficient investment in R&D and have low overall innovation capabilities. Therefore, if animal husbandry enterprises want to achieve sustainable development, the innovation consciousness of animal husbandry enterprises needs to be cultivated. Animal husbandry enterprises should increase their R&D investment and formulate corresponding systems to ensure that R&D investment continues to be adhered to in order to continuously improve the scientific and technological level of Chinese animal husbandry enterprises and promote the improvement of the TFP of animal husbandry enterprises.
Second, animal husbandry enterprises should give full play to the moderating role of executives’ equity incentives. Equity incentives for executives can closely link the interests of executives with the interests of enterprise owners, and it is easier for executives to make decisions that are conducive to improving the TFP of enterprises. Therefore, animal husbandry enterprises should scientifically evaluate their corporate governance structure and system and reasonably formulate and improve the equity incentive policies for executives according to their own actual conditions in order to improve the TFP of enterprises. In view of the negative moderating effect of executive compensation incentives in the relationship between R&D investment and the TFP of animal husbandry enterprises, animal husbandry enterprises should optimize the design of their executive compensation policy and pay attention to avoiding crowding out R&D resources due to increasing executive compensation.
Third, heterogeneous factors such as the ownership, industry type and region of the animal husbandry enterprises should be taken into account to give full play to the positive effect of R&D investment on enhancing the TFP of animal husbandry enterprises. In view of the characteristics of the stronger R&D investment effect of non-state-owned enterprises, the late start to the development of dairy processing enterprises, the long R&D cycle of animal healthcare enterprises and the low R&D investment level of animal husbandry enterprises in the western region, the government can appropriately tilt the above enterprises when implementing R&D subsidy policies to alleviate the problem of the insufficient R&D resources of these enterprises in order to promote the R&D investment of these enterprises to play a positive role in the improvement of the TFP of enterprises.
Author Contributions
Conceptualization, Z.Y. and M.W.; methodology, Z.Y.; software, Z.Y.; validation, Z.Y. and M.W.; formal analysis, Z.Y.; investigation, Z.Y.; resources, Z.Y. and M.W.; data curation, Z.Y.; writing—original draft preparation, Z.Y. and Y.S.; writing—review and editing, Z.Y. and Z.N.; visualization, Z.Y.; supervision, M.W.; project administration, M.W.; funding acquisition, M.W. All authors have read and agreed to the published version of the manuscript.
Funding
This research was funded by The Agricultural Science and Technology Innovation Program of Chinese Academy of Agricultural Sciences, grant number 10-IAED-01-2023, and The Key Project of National Natural Science Foundation of China, grant number 72033009.
Institutional Review Board Statement
Not applicable.
Data Availability Statement
All relevant data are within the manuscript.
Conflicts of Interest
The authors declare no conflict of interest.
References
- FAO. The State of Food and Agriculture 2009: Livestock in the Balance; FAO: Rome, Italy, 2009; pp. 20–24. [Google Scholar] [CrossRef]
- Herrero, M.; Thornton, P.K.; Gerber, P.; Reid, R.S. Livestock, livelihoods and the environment: Understanding the trade-offs. Curr. Opin. Environ. Sustain. 2009, 1, 111–120. [Google Scholar] [CrossRef]
- Alders, R.G.; Campbell, A.; Costa, R.; Guèye, E.F.; Ahasanul, M.; Perezgrovas-Garza, R.; Rota, A.; Wingett, K. Livestock across the world: Diverse animal species with complex roles in human societies and ecosystem services. Anim. Front. 2021, 11, 20–29. [Google Scholar] [CrossRef] [PubMed]
- Neethirajan, S. The role of sensors, big data and machine learning in modern animal farming. Sens. Bio-Sens. Res. 2020, 29, 100367. [Google Scholar] [CrossRef]
- Neethirajan, S.; Kemp, B. Digital Livestock Farming. Sens. Bio-Sens. Res. 2021, 32, 100408. [Google Scholar] [CrossRef]
- Solow, R.M. Technical Change and the Aggregate Production Function. Rev. Econ. Stat. 1957, 39, 312–320. [Google Scholar] [CrossRef]
- Pan, W.; Xie, T.; Wang, Z.; Ma, L. Digital economy: An innovation driver for total factor productivity. J. Bus. Res. 2022, 139, 303–311. [Google Scholar] [CrossRef]
- Sohag, K.; Chukavina, K.; Samargandi, N. Renewable energy and total factor productivity in OECD member countries. J. Clean. Prod. 2021, 296, 126499. [Google Scholar] [CrossRef]
- Ai, H.; Hu, S.; Li, K.; Shao, S. Environmental regulation, total factor productivity, and enterprise duration: Evidence from China. Bus. Strateg. Environ. 2020, 29, 2284–2296. [Google Scholar] [CrossRef]
- Song, M.; Peng, L.; Shang, Y.; Zhao, X. Green technology progress and total factor productivity of resource-based enterprises: A perspective of technical compensation of environmental regulation. Technol. Forecast. Soc. 2022, 174, 121276. [Google Scholar] [CrossRef]
- Peng, J.; Xie, R.; Ma, C.; Fu, Y. Market-based environmental regulation and total factor productivity: Evidence from Chinese enterprises. Econ. Model. 2021, 95, 394–407. [Google Scholar] [CrossRef]
- Ghobakhloo, M. Industry 4.0, digitization, and opportunities for sustainability. J. Clean. Prod. 2020, 252, 119869. [Google Scholar] [CrossRef]
- Wang, K.; Sun, T.; Xu, R. The impact of artificial intelligence on total factor productivity: Empirical evidence from China’s manufacturing enterprises. Econ. Chang. Restruct. 2023, 56, 1113–1146. [Google Scholar] [CrossRef]
- Xie, Z.; Wu, R.; Wang, S. How technological progress affects the carbon emission efficiency? Evidence from national panel quantile regression. J. Clean. Prod. 2021, 307, 127133. [Google Scholar] [CrossRef]
- Mohsin, M.; Taghizadeh-Hesary, F.; Iqbal, N.; Saydaliev, H.B. The role of technological progress and renewable energy deployment in green economic growth. Renew. Energy 2022, 190, 777–787. [Google Scholar] [CrossRef]
- Aghion, P.; Howitt, P. A Model of Growth Through Creative Destruction. Econometrica 1992, 60, 323–351. [Google Scholar] [CrossRef]
- Jones, C.I. The Past and Future of Economic Growth: A Semi-Endogenous Perspective. Annu. Rev. Econ. 2022, 14, 125–152. [Google Scholar] [CrossRef]
- Goto, A.; Suzuki, K. R&D Capital, Rate of Return on R&D Investment and Spillover of R&D in Japanese Manufacturing Industries. Rev. Econ. Stat. 1989, 71, 555. [Google Scholar] [CrossRef]
- Mao, D.F.; Li, J.; Peng, F. R&D Input and Corporate TFP: An Empirical Test Based on PSM and GPS Methods. Financ. Stud. 2013, 39, 134–144. [Google Scholar] [CrossRef]
- Feinberg, S.E.; Majumdar, S.K. Technology Spillovers from Foreign Direct Investment in the Indian Pharmaceutical Industry. J. Int. Bus. Stud. 2001, 32, 421–437. [Google Scholar] [CrossRef]
- Adams, J.D.; Jaffe, A.B. Bounding the Effects of R&D: An Investigation Using Matched Establishment-Firm Data. RAND J. Econ. 1996, 27, 700–721. [Google Scholar] [CrossRef]
- Xiao, Z.; Peng, H.; Pan, Z. Innovation, external technological environment and the total factor productivity of enterprises. Account. Financ. 2022, 62, 3–29. [Google Scholar] [CrossRef]
- Fernandes, A.M. Firm Productivity in Bangladesh Manufacturing Industries. World Dev. 2008, 36, 1725–1744. [Google Scholar] [CrossRef]
- Tang, E.Z.; Liu, H.Y.; Kong, X.Z. An empirical study of R&D investment and effectiveness of Chinese manufacturing firms. Econ. Manag. 2012, 26, 57–61. [Google Scholar] [CrossRef]
- Wang, J.; Zhang, Q.; Li, Q. R&D Investment and Total Factor Productivity: An Empirical Study of the Listed Companies in the Coastal Regions of China. J. Coastal Res. 2020, 106, 13–16. [Google Scholar] [CrossRef]
- Kong, D.M.; Pang, L.J. The lagged effect of R&D investment on productivity improvement: Micro evidence from industrial firms. Ind. Econ. Res. 2014, 6, 69–80. [Google Scholar] [CrossRef]
- Deng, L.Q. An empirical analysis of the contribution of R&D investment to TFP in China. Nanjing Soc. Sci. 2011, 4, 152–156. [Google Scholar] [CrossRef]
- Huang, J.; Cai, X.; Huang, S.; Tian, S.; Lei, H. Technological factors and total factor productivity in China: Evidence based on a panel threshold model. China Econ. Rev. 2019, 54, 271–285. [Google Scholar] [CrossRef]
- Beladi, H.; Deng, J.; Hu, M. Cash flow uncertainty, financial constraints and R&D investment. Int. Rev. Financ. Anal. 2021, 76, 101785. [Google Scholar] [CrossRef]
- Kartadjumena, E.; Rodgers, W. Executive Compensation, Sustainability, Climate, Environmental Concerns, and Company Financial Performance: Evidence from Indonesian Commercial Banks. Sustainability 2019, 11, 1673. [Google Scholar] [CrossRef]
- Zhou, B.; Li, Y.; Sun, F.; Zhou, Z. Executive compensation incentives, risk level and corporate innovation. Emerg. Mark. Rev. 2021, 47, 100798. [Google Scholar] [CrossRef]
- Al Farooque, O.; Buachoom, W.; Hoang, N. Interactive effects of executive compensation, firm performance and corporate governance: Evidence from an Asian market. Asia Pac. J. Manag. 2019, 36, 1111–1164. [Google Scholar] [CrossRef]
- Kothari, S.P.; Leone, A.J.; Wasley, C.E. Performance matched discretionary accrual measures. J. Account. Econ. 2005, 39, 163–197. [Google Scholar] [CrossRef]
- Makri, M.; Lane, P.J.; Gomez-Mejia, L.R. CEO incentives, innovation, and performance in technology-intensive firms: A reconciliation of outcome and behavior-based incentive schemes. Strateg. Manag. J. 2006, 27, 1057–1080. [Google Scholar] [CrossRef]
- Han, I.; Chuang, C. The Impacts of R&D Investment on Company Performance: US vs. Taiwanese Technology-Intensive Industry. Rev. Pac. Basin Financ. 2011, 14, 171–194. [Google Scholar] [CrossRef]
- Xue, Q.; Li, G. The impact of R&D investment on financial performance of GEM companies-the moderating effect of executive incentives. Financ. Account. Mon. 2015, 32, 123–128. [Google Scholar] [CrossRef]
- Chen, X. Empirical analysis of the moderating effects of executive incentives, R&D investment and firm performance. Stat. Decis. Making 2017, 1, 178–181. [Google Scholar] [CrossRef]
- Schumpeter, J.A. The Theory of Economic Development; Harvard University Press: Cambridge, MA, USA, 1912. [Google Scholar] [CrossRef]
- Schumpeter, J.A.; Stiglitz, J.E. Capitalism, Socialism and Democracy; Taylor & Francis Group: Florence, Italy, 2010. [Google Scholar]
- Segerstrom, P. Innovation, Imitation, and Economic Growth. J. Political Econ. 1991, 99, 807–827. [Google Scholar] [CrossRef]
- Chen, Z.; Yang, Z.; Yang, L. How to optimize the allocation of research resources? An empirical study based on output and substitution elasticities of universities in Chinese provincial level. Socio-Econ. Plan. Sci. 2020, 69, 100707. [Google Scholar] [CrossRef]
- Braun, D.; Guston, D.H. Principal-agent theory and research policy: An introduction. Sci. Public Policy 2003, 30, 302–308. [Google Scholar] [CrossRef]
- Ross, S. The economic theory of agency: The principal’s problem. Am. Econ. Rev. 1973, 63, 134–139. [Google Scholar] [CrossRef]
- Qiao, M.; Chen, S.; Xu, S. Equity incentive contract characteristics and company operational performance—An empirical study of Chinese listed companies. PLoS ONE 2023, 18, e0281244. [Google Scholar] [CrossRef] [PubMed]
- Harris, O.; Karl, J.B.; Lawrence, E. CEO compensation and earnings management: Does gender really matters? J. Bus. Res. 2019, 98, 1–14. [Google Scholar] [CrossRef]
- Qian, T.; Yang, C. State-Owned Equity Participation and Corporations’ ESG Performance in China: The Mediating Role of Top Management Incentives. Sustainability 2023, 15, 11507. [Google Scholar] [CrossRef]
- Xu, X.L.; Shen, T.; Zhang, X.; Chen, H.H. The role of innovation investment and executive incentive on financial sustainability in tech-capital-labor intensive energy company: Moderate effect. Energy Rep. 2020, 6, 2667–2675. [Google Scholar] [CrossRef]
- Liu, G.; Lu, D.; Yang, J. Innovation for promotion: The effect of executive involvement on inventors’ innovation choice. J. Corp. Financ. 2023, 80, 102394. [Google Scholar] [CrossRef]
- Ding, N.; Gu, L.; Peng, Y. Fintech, financial constraints and innovation: Evidence from China. J. Corp. Financ. 2022, 73, 102194. [Google Scholar] [CrossRef]
- Bernard, D.; Blackburne, T.; Thornock, J. Information flows among rivals and corporate investment. J. Financ. Econ. 2020, 136, 760–779. [Google Scholar] [CrossRef]
- Olley, G.S.; Pakes, A. The Dynamics of Productivity in the Telecommunications Equipment Industry. Econometrica 1996, 64, 1263–1297. [Google Scholar] [CrossRef]
- Levinsohn, J.; Petrin, A. Estimating Production Functions Using Inputs to Control for Unobservables. Rev. Econ. Stud. 2003, 70, 317–341. [Google Scholar] [CrossRef]
- Sánchez Serrano, A. Loan renegotiation and the long-term impact on total factor productivity. Lat. Am. J. Cent. Bank. 2022, 3, 100074. [Google Scholar] [CrossRef]
- Wu, X.; Zeng, S. R&D Investment, Internal Control and Enterprise Performance: An Empirical Study Based on the Listed Companies in China of the Core Industry of the Digital Economy. Sustainability 2022, 14, 16700. [Google Scholar] [CrossRef]
- Bell, A.; Jones, K. Explaining Fixed Effects: Random Effects Modeling of Time-Series Cross-Sectional and Panel Data. Political Sci. Res. Methods 2014, 3, 133–153. [Google Scholar] [CrossRef]
- Wang, Z.G. How corporate R&D investment affects innovation strategy choice-based on the perspective of government support and market competition. East China Econ. Manag. 2023, 37, 54–65. [Google Scholar] [CrossRef]
- He, Y.L.; Liu, G.C. The impact of R&D investment on credit risk of small and medium-sized enterprises--Based on the perspective of digital inclusive finance. China Sci. Technol. Forum 2023, 8, 86–96. [Google Scholar] [CrossRef]
- Liu, G.Q. Analysis of incentive effect of tax preference and financial subsidy policy—An empirical study based on the perspective of information asymmetry theory. Manag. World 2016, 10, 62–71. [Google Scholar] [CrossRef]
- Song, M.; Zhou, P.; Si, H.T. Financial Technology and Enterprise Total Factor Productivity-Perspective of “Enabling” and Credit Rationing. China Ind. Econ. 2021, 4, 138–155. [Google Scholar] [CrossRef]
- Wooldridge, J.M. On estimating firm-level production functions using proxy variables to control for unobservables. Econ. Lett. 2009, 104, 112–114. [Google Scholar] [CrossRef]
- Yang, Y.; Yuan, Z. Technological innovation and productivity of start-ups-Evidence from VC/PE-backed firms. J. Manag. Eng. 2014, 28, 56–64. [Google Scholar] [CrossRef]
Disclaimer/Publisher’s Note: The statements, opinions and data contained in all publications are solely those of the individual author(s) and contributor(s) and not of MDPI and/or the editor(s). MDPI and/or the editor(s) disclaim responsibility for any injury to people or property resulting from any ideas, methods, instructions or products referred to in the content. |
© 2023 by the authors. Licensee MDPI, Basel, Switzerland. This article is an open access article distributed under the terms and conditions of the Creative Commons Attribution (CC BY) license (https://creativecommons.org/licenses/by/4.0/).