Article

Evaluation of Morpho-Physiological Traits of Oat (Avena sativa L.) under Drought Stress †

1
Department of Agronomy, Horticulture and Plant Science, South Dakota State University, Brookings, SD 57007, USA
2
School of Earth and Space Exploration, Arizona State University, Tempe, AZ 85281, USA
*
Author to whom correspondence should be addressed.
This paper is a part of the Ph.D. Thesis of Krishna Ghimire, presented at South Dakota State University (USA).
Agriculture 2024, 14(1), 109; https://doi.org/10.3390/agriculture14010109
Submission received: 13 October 2023 / Revised: 20 December 2023 / Accepted: 5 January 2024 / Published: 9 January 2024
(This article belongs to the Section Crop Production)

Abstract

:
The increase in intensity and frequency of drought due to global climate change has increased the urgency of developing crop cultivars suitable for dry environments. Drought tolerance is a complex trait that involves numerous physiological, biochemical, and morphological responses. A better understanding of those mechanisms is critical to develop drought tolerant cultivars. In this study, we aimed to understand the morphophysiological changes at the shoot and root levels in response to drought stress of ten oat genotypes with diverse root morphological characteristics. Twenty-one-day old plants were subjected to drought stress in a greenhouse by withholding water for two weeks. Several characteristics including chlorophyll content, relative water content (RWC), stomatal conductance, stomata number, shoot dry weight (SDW), root dry weight (RDW), root-to-shoot biomass ratio (RSR), root length, root area, and root volume were measured on well-watered, and drought-stressed plants. Grain yield was evaluated by continuing the drought treatment with a drying and rewatering cycle every 15 days until physiological maturity. The water regime had a significant impact on all traits evaluated. A significant interaction between genotype and water treatment was observed for RWC, chlorophyll content, stomatal conductance, stomata number, and grain yield but not for root traits, suggesting that the root system of all genotypes responded similarly to drought stress. Hayden, the cultivar with the lowest reduction in grain yield from the drought treatment, was among the genotypes with the lowest reduction in RWC and chlorophyll content but with a sharp decrease in stomata number, thus indicating that regulating the plant water status and maintaining the photosynthesis level are important for oat plants to maintain grain yield under drought stress. The size of the root system was not correlated with grain yield under drought, but the RWC and grain yield were significantly correlated under drought, thus suggesting that maintaining the RWC is an important characteristic for oat plants to maintain yield under drought stress.

1. Introduction

Oats (Avena sativa L.) are classified as whole grains and are rich in healthy nutrients such as beta-glucan, lipid, protein, minerals, and polyphenols [1]. The regular consumption of oat beta-glucan has been shown to lower cholesterol, prevent type II diabetes, stimulate the immune system, and positively affect the function of the intestinal flora [2,3,4]. The demand for food products containing oats, such as oatmeal, breakfast cereals, cereal bars, and oat milk, is steadily rising as consumers gain awareness of oat health benefits globally. The global market revenue of oats in 2018 was 4.9 billion US dollars and it is projected to reach 8.37 billion US dollars by 2028 [5].
Oats are grown worldwide and adapted to a wide range of soil types, although the production is concentrated between latitudes 35–65° N and 20–46° S [6]. Oats thrive in cool environments with ample moisture, and the optimum growth temperature is between 68 and 70° F [7]. In North America, Canada is the largest oat producer, with a production of 5.2 million tons in 2022 [8]. Canada is also the largest exporter of oats globally, accounting for 60% of oat global exports, with the majority being exported to the US [9]. In the US, oats are primarily produced in the Northern Plains (North Dakota, Minnesota, South Dakota, and Wisconsin) with spring planted cultivars, but the US domestic production of oats is lower than the domestic consumption. The US is the largest importer of oats globally, importing approximately 1.5 million metric tons in 2022 [10].
Oat production is significantly reduced under drought stress [11,12]. With global warming and climate change, drought is expected to become more frequent and more severe [13], including at higher latitudes where the majority of oat production occurs. In 2021, drought affected the major oat growing regions of Canada and the United States. The drought stress severely affected oat grain yield, significantly reducing oat production in North America and resulting in a sharp increase in oat price [14]. The US oat production was estimated at 613,799 metric tons in 2021, which is 39% lower than in 2020 [14]. Similarly, Canada’s oat harvest in 2021 was around 4,143,919 metric tons which is approximately 15% lower than the previous year [15].
Drought stress in plants is known to decrease photosynthesis rate, transpiration rate, and stomatal conductance [16], and to reduce leaf area and post-anthesis green leaf area duration due to accelerated leaf senescence [17]. Oat yield parameters such as grains per panicle and 1000-grain weight are decreased with drought stress [16]. The intensity of the stress depends on the growth stage of the plant. In oats, yield reduction due to drought compared to well-watered conditions was reported to be 31% when severe drought stress was imposed at jointing and 69% when imposed at heading [17]. A study by Mahadevan et al. [11] has shown that oats are more vulnerable to drought stress from stem elongation to 10 days after anthesis and that the yield response is mediated primarily through a reduction in grain number instead of grain weight.
As the climate becomes hotter, and drought becomes more frequent and severe, there is an urgent need to develop high-yielding varieties of oats adapted to North America that use water more efficiently [18]. Increasing our understanding of the mechanisms of drought tolerance in plants is critical to develop drought-tolerant cultivars. Drought tolerance is a highly complex process involving physiological, biochemical, and morphological traits both below and above ground levels [19].
The roots are the first organ sensing soil moisture depletion and initiate a signaling cascade that leads to the overall plant’s response to drought stress [20]. In oats, root response to drought evaluated on drought-resistant and susceptible cultivars showed an increase in root length, branching rate, root surface area, and length of fine roots in drought-tolerant genotypes [19]. Although valuable results were previously reported, highlighting shoot and root responses to drought in contrasting oat genotypes, only two genotypes were considered [19]. Plants have evolved multiple mechanisms to respond to drought stress [21], and different genotypes may show different mechanisms for drought tolerance. The study of drought stress tolerance in US oat germplasm is limited. Evaluating the response of diverse US spring oat genotypes to drought stress would be valuable for developing oat cultivars with improved drought tolerance adapted to the US.
Greenhouse experiments are common for drought studies; however, the plant growth medium and drought imposition methods should be carefully chosen to mimic field conditions as closely as feasible. When carefully planned, correlations between drought response under greenhouse and field conditions have been reported [22]. The objectives of this study were to evaluate the change in the morphological and physiological traits of oats under drought stress and to determine root architectural components that contribute to the ability of oats to cope with drought.

2. Materials and Methods

2.1. Plant Materials

Ten oat cultivars with variation in root architectural traits at the seedling stage were selected from a panel of 285 spring oat genotypes from US breeding programs. The panel was evaluated for root morphological characteristics at the seedling stage (average primary emergence angle, average length of all roots, average length of lateral roots, average length of primary roots, number of lateral roots, number of primary roots, lateral root density, total length of lateral roots, total length of primary roots, total root length, maximum depth of root, maximum width, of root, convex hull area, and width to depth ratio). A cluster analysis was conducted to select a sub-set representing the diversity in root system architectural traits from the panel. The sub-set included cultivars ‘Clintford’ [23], developed by Purdue University; ‘Gopher’, ‘Deon’, and ‘MN Pearl’, released in 1923, 2013, and 2018, respectively, by the University of Minnesota; ‘Goliath’, ‘Hayden’ [24], and ‘Saddle’, released in 2012, 2014, and 2017 by South Dakota Agricultural Experiment Station; ‘Kame’, released in 2005 by the University of Wisconsin; and ‘SD140327’, an experimental breeding line developed by South Dakota State University. In addition, the cultivar ‘Checota’ [25], released by Oklahoma Agricultural Experiment Station, was included as a drought-tolerant check cultivar based on previous reports [12,26]. Variability in root system architecture traits was considered in selecting cultivars for this study because the literature suggests that some root characteristics can improve productivity under limited water availability [27].
The seeds were first pregerminated for two days in germination paper. The pregerminated seeds were transferred in topsoil in 10 cm × 10 cm × 35 cm tall tree pots (Stew and Sons, Inc., Tangent, OR, USA) at the rate of one plant per pot. Each pot was filled with 4 kg topsoil at field capacity (the soil was soaked with water and the excess water was allowed to drain for 48 h). The tall pots were chosen so as to limit interference with root development, and topsoil was selected as growing medium to mimic field conditions [28]. A total of 10 plants were grown per genotype per water regime treatment. The experiment was repeated twice. Each repetition of the experiment included a total of 200 plants (10 genotypes × 2 water regimes × 10 replications). The plants were grown for 21 days in well-watered conditions by watering all pots every three days in a greenhouse maintained at 24 °C with a 16 h photoperiod. After 21 days, the well-watered (control) plants were watered every third day and the drought treatment plants were no longer watered. Gradual soil drying by withholding watering was chosen as the drought imposition method to impose water deficits in the pots that more closely mimic the situation in the field [28]. After 15 days, shoot and roots were harvested from 5 plants per genotype for each water regime group for a total of 100 plants. The shoot dry weight (SDW) was determined after drying the shoot at 60 °C for 72 h. The roots were cleaned from the soil and scanned before drying for root dry weight (RDW) determination. To determine the grain yield, the drought treatment was continued on the remaining 100 plants (five plants per genotype for each water regime) with a drying and rewatering cycle every 15 days until physiological maturity. The experiment was conducted with a completely randomized design. Each single plant (planted in an individual pot) was an experimental unit.

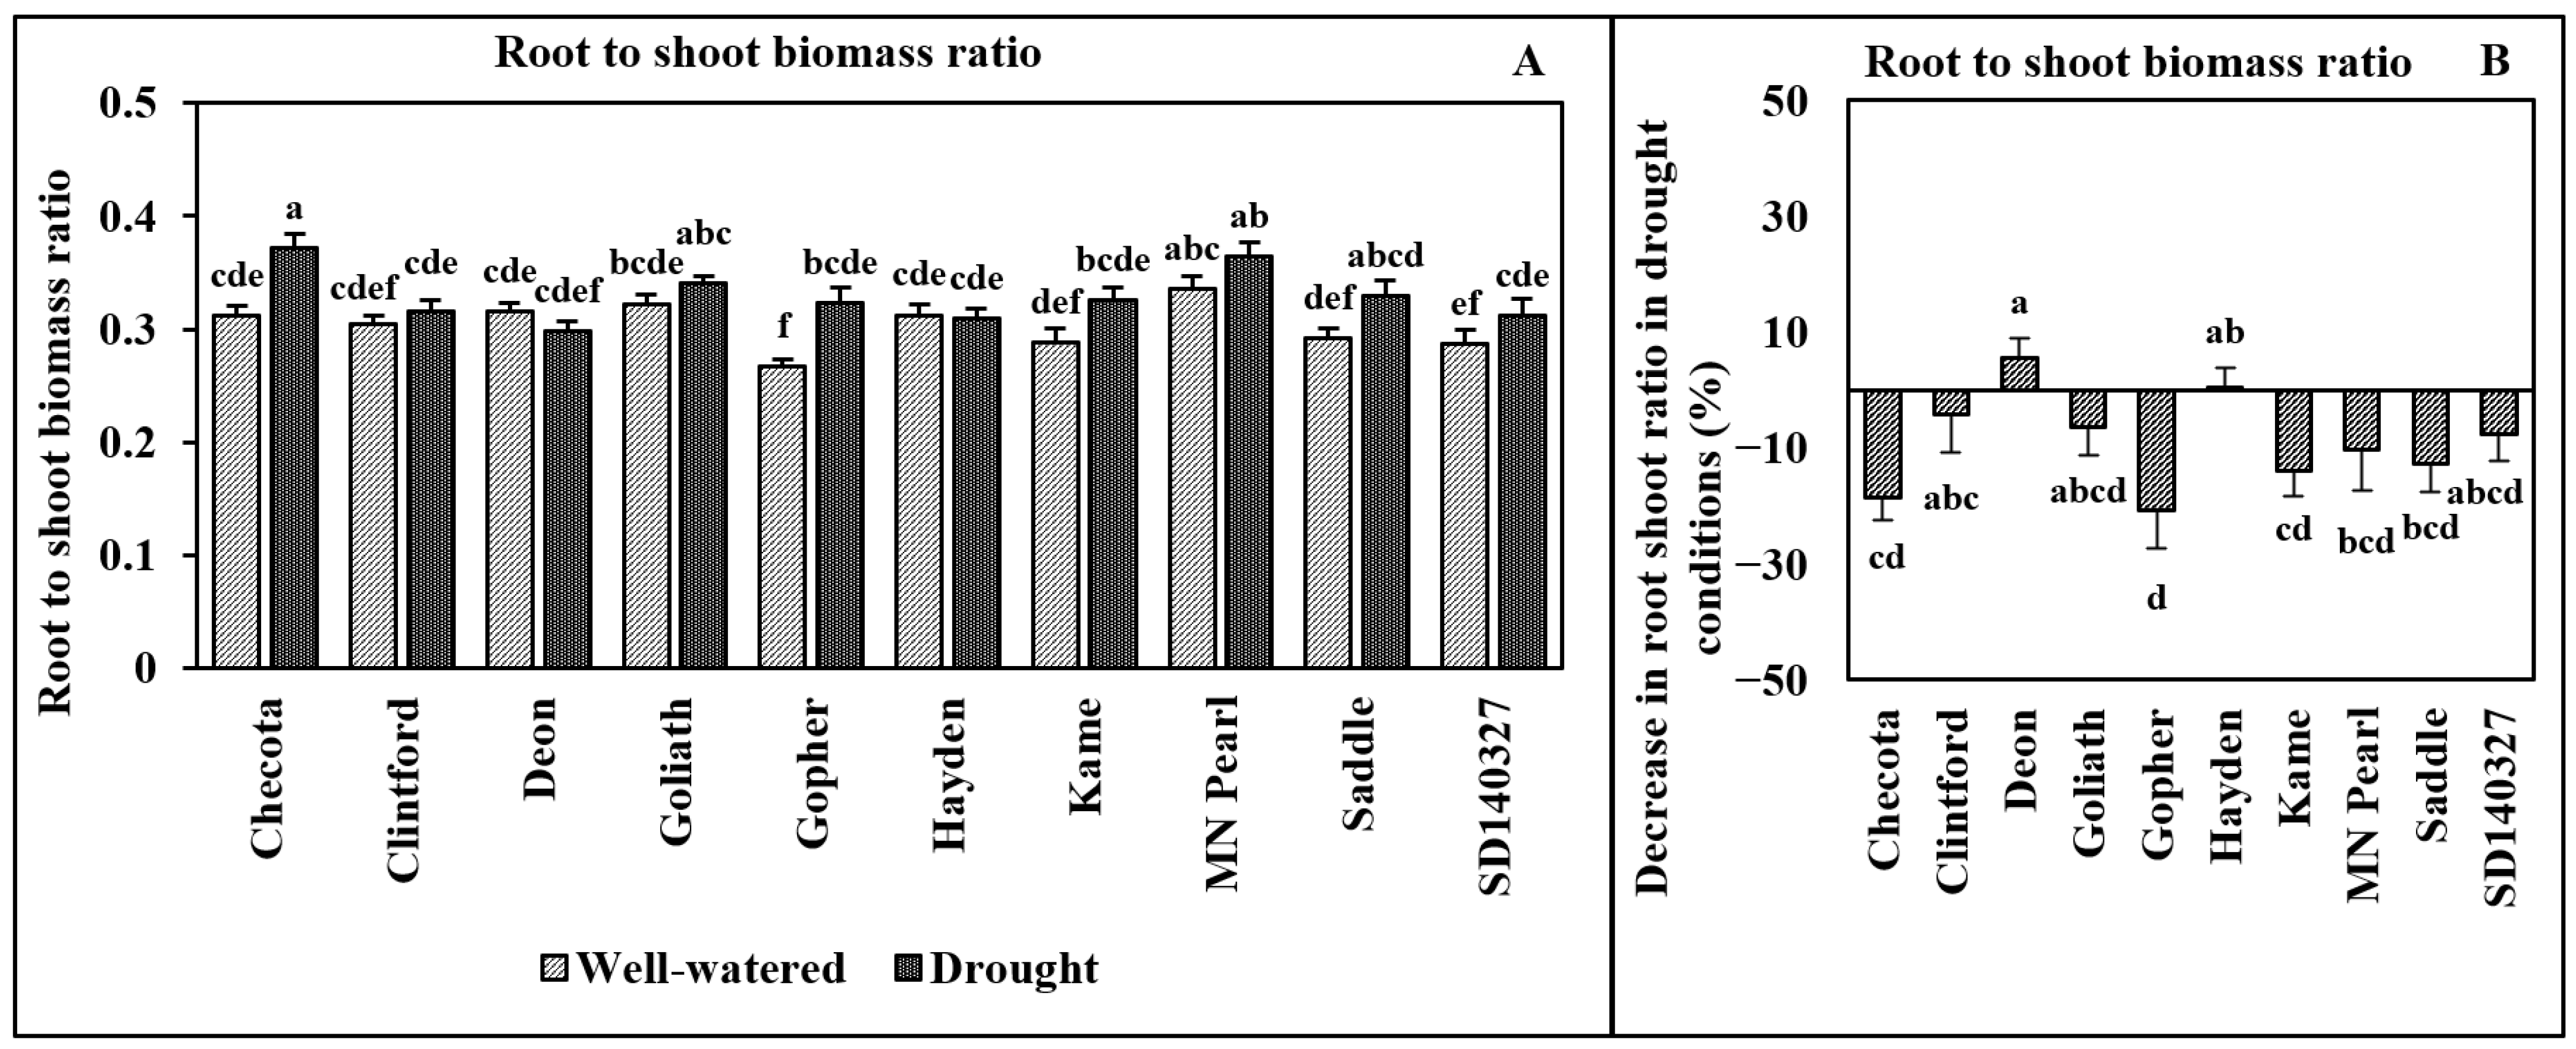
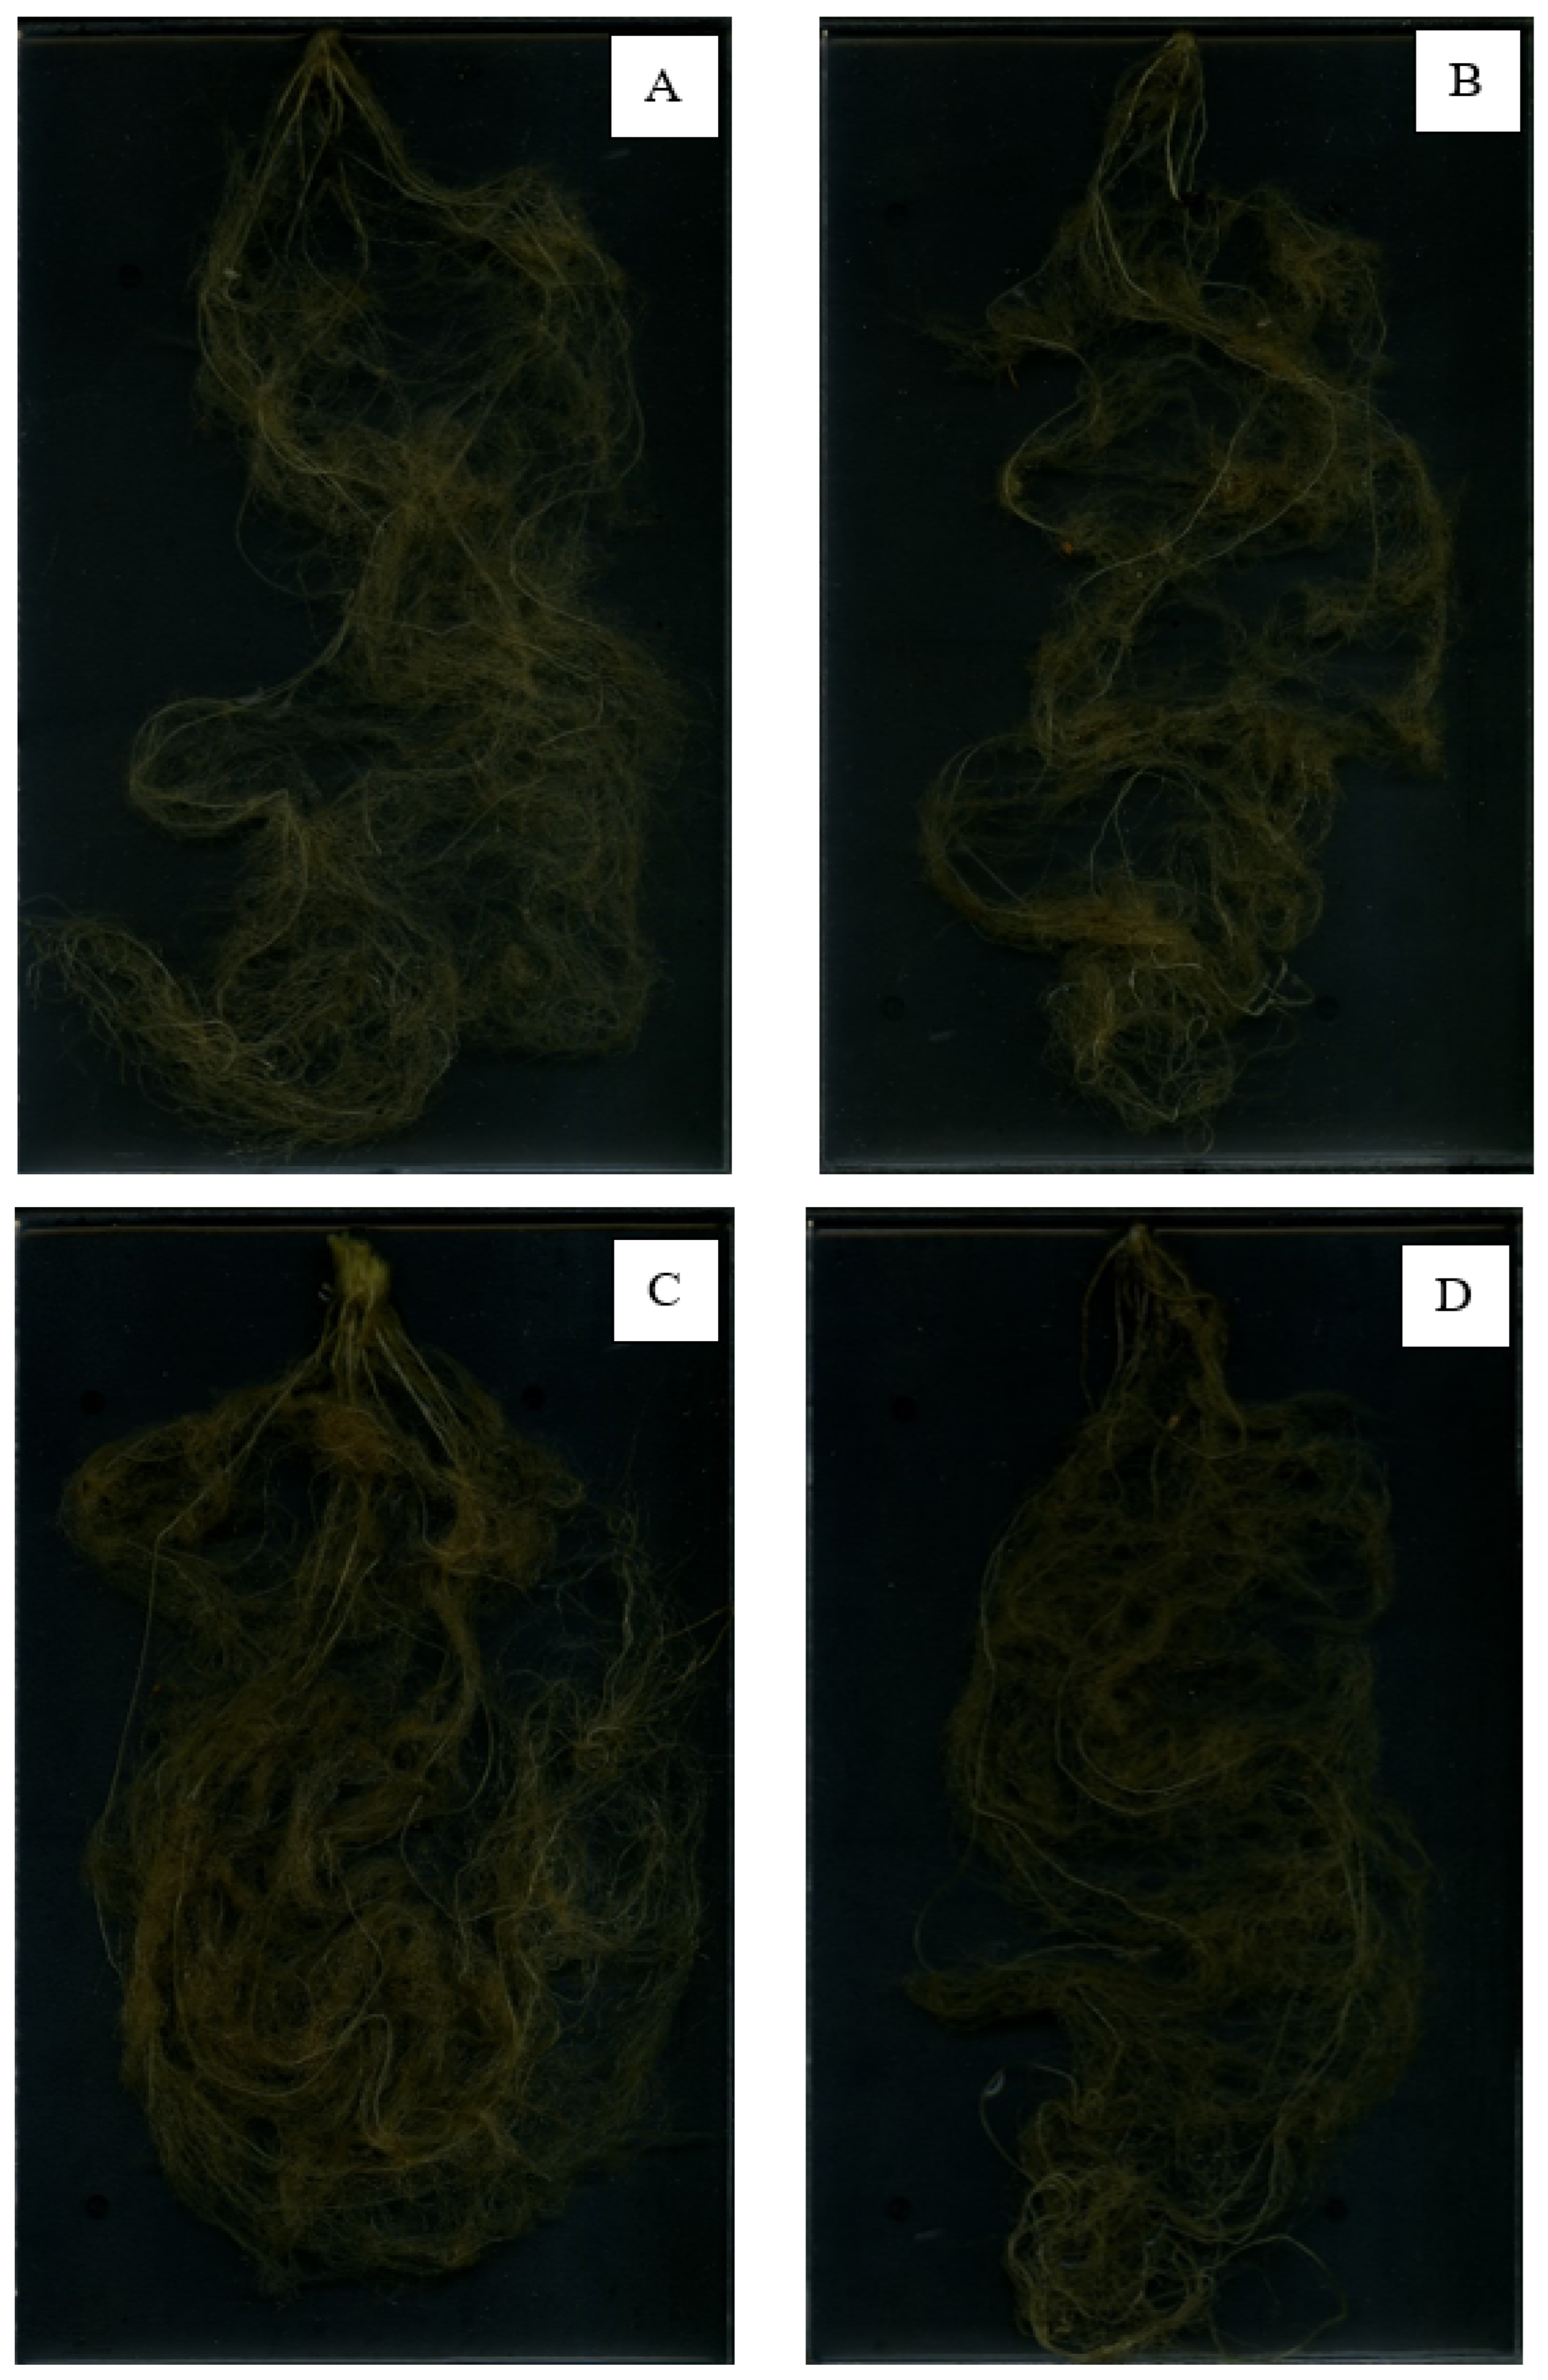
2.2. Root Morphology

The roots were cleaned and scanned with an Epson flatbed scanner (Epson America, Inc., Los Alamitos, CA, USA). The scanned root images were run through WhinRhizo (V 5.0, Reagent Instruments, Quebec City, QC, Canada) to measure root length, root area, and root volume.

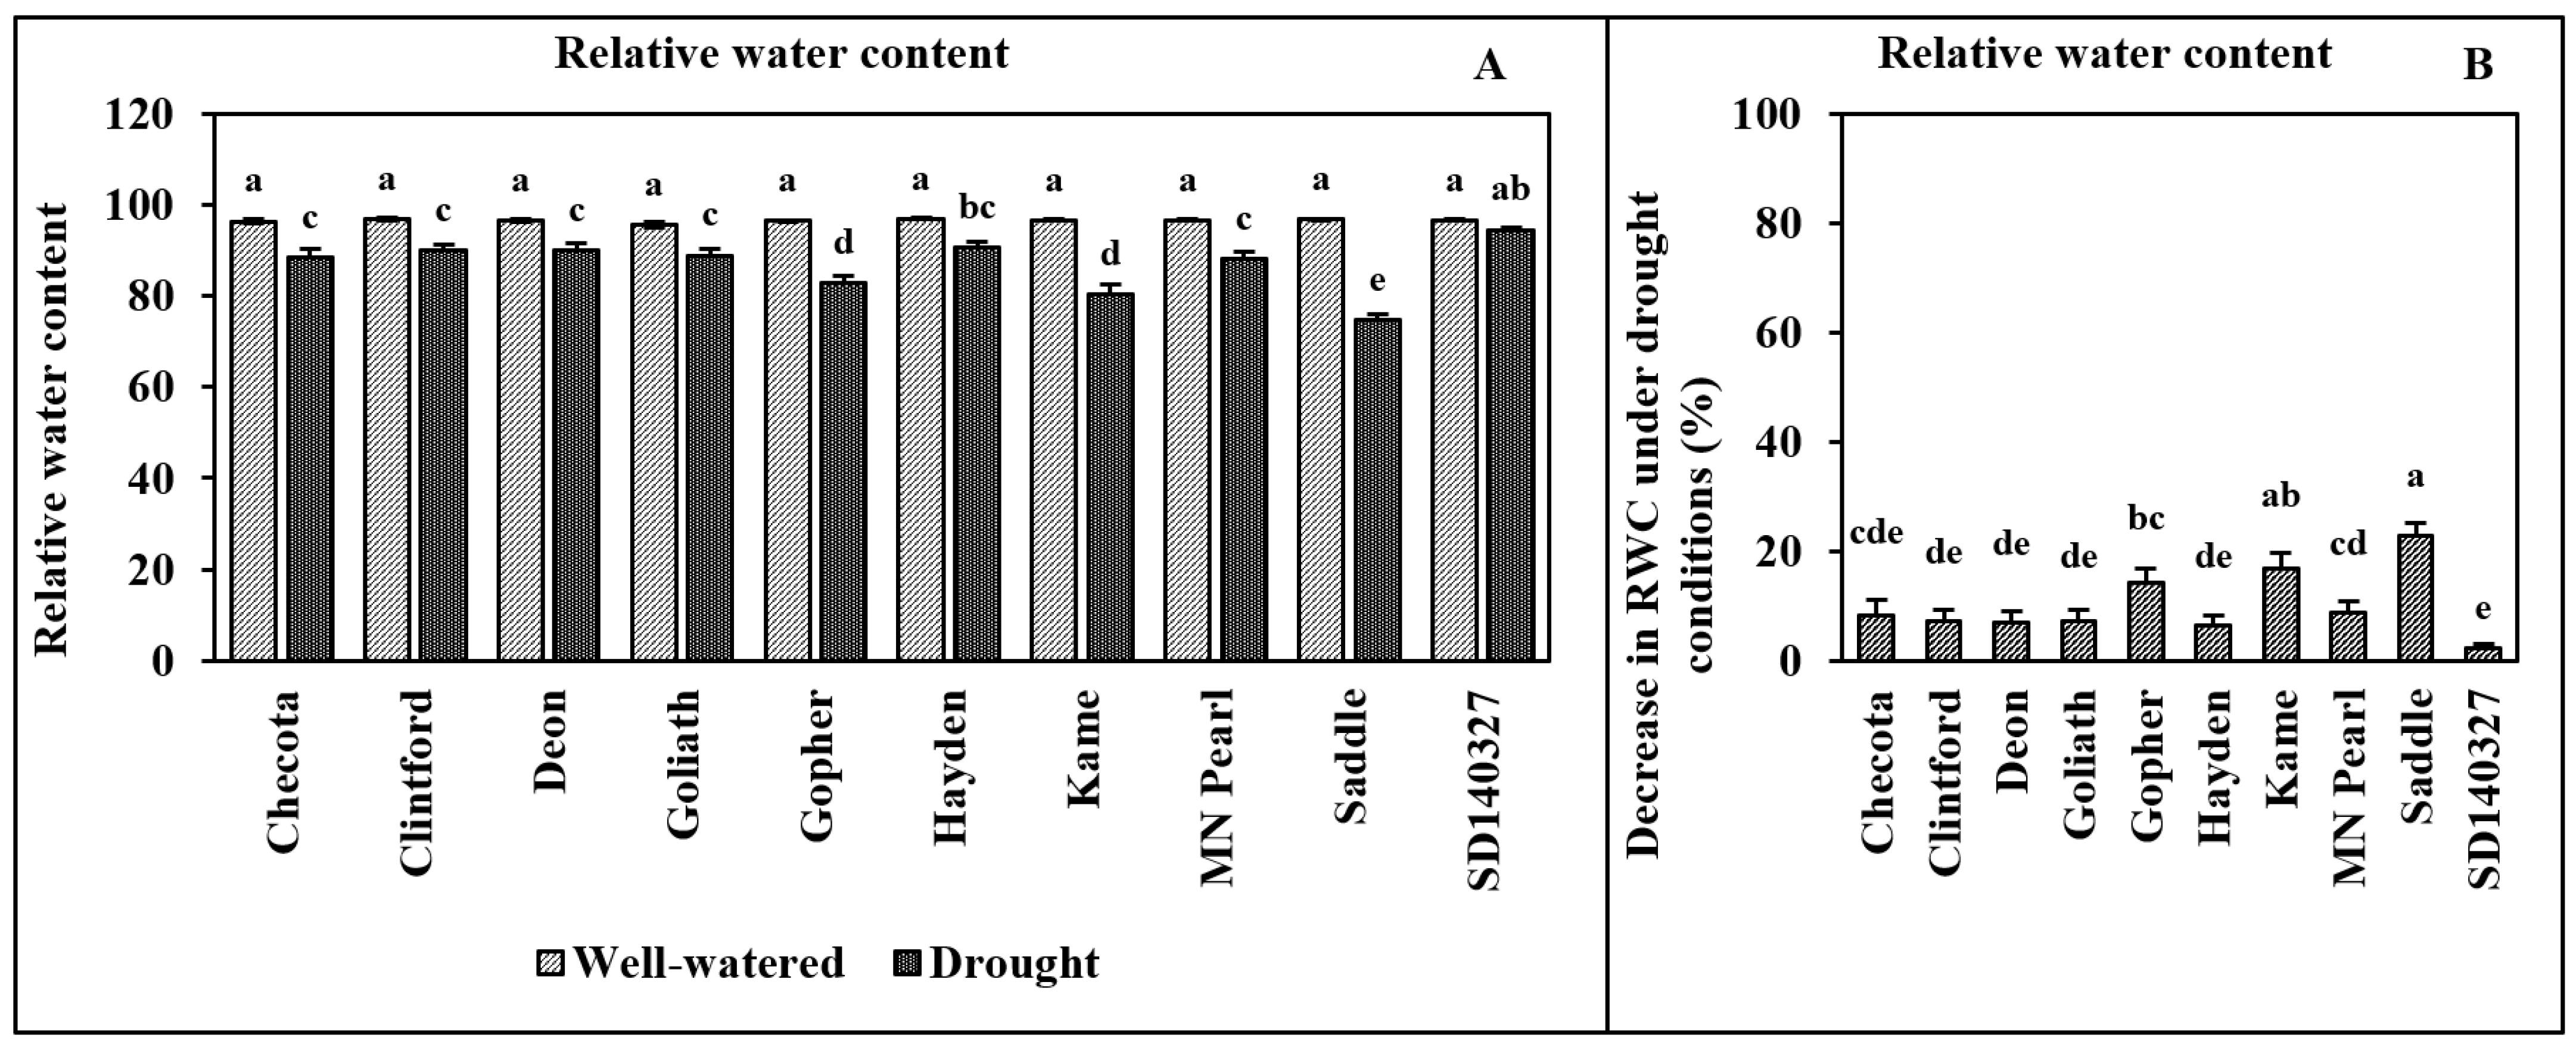
2.3. Relative Water Content (RWC)

Relative water content was measured according to the method described by Smart and Bingham [29]. Relative water content was determined on the mid-leaf section of the youngest mature leaf. A 5 cm long leaf section was cut and weighed immediately to determine the fresh weight (W). The leaf samples were hydrated with deionized water for 24 h in a closed Petri dish. The leaf samples were taken out of the Petri dishes and were well dried of any surface moisture using a paper towel and weighed to determine the turgid weight (TW). The samples were then oven-dried and weighed to determine the dry weight (DW). One measurement was made per plant for each genotype in each treatment.
RWC   ( % ) = W D W T W D W × 100
  • W—Sample fresh weight
  • TW—Sample turgid weight
  • DW—Sample dry weight.

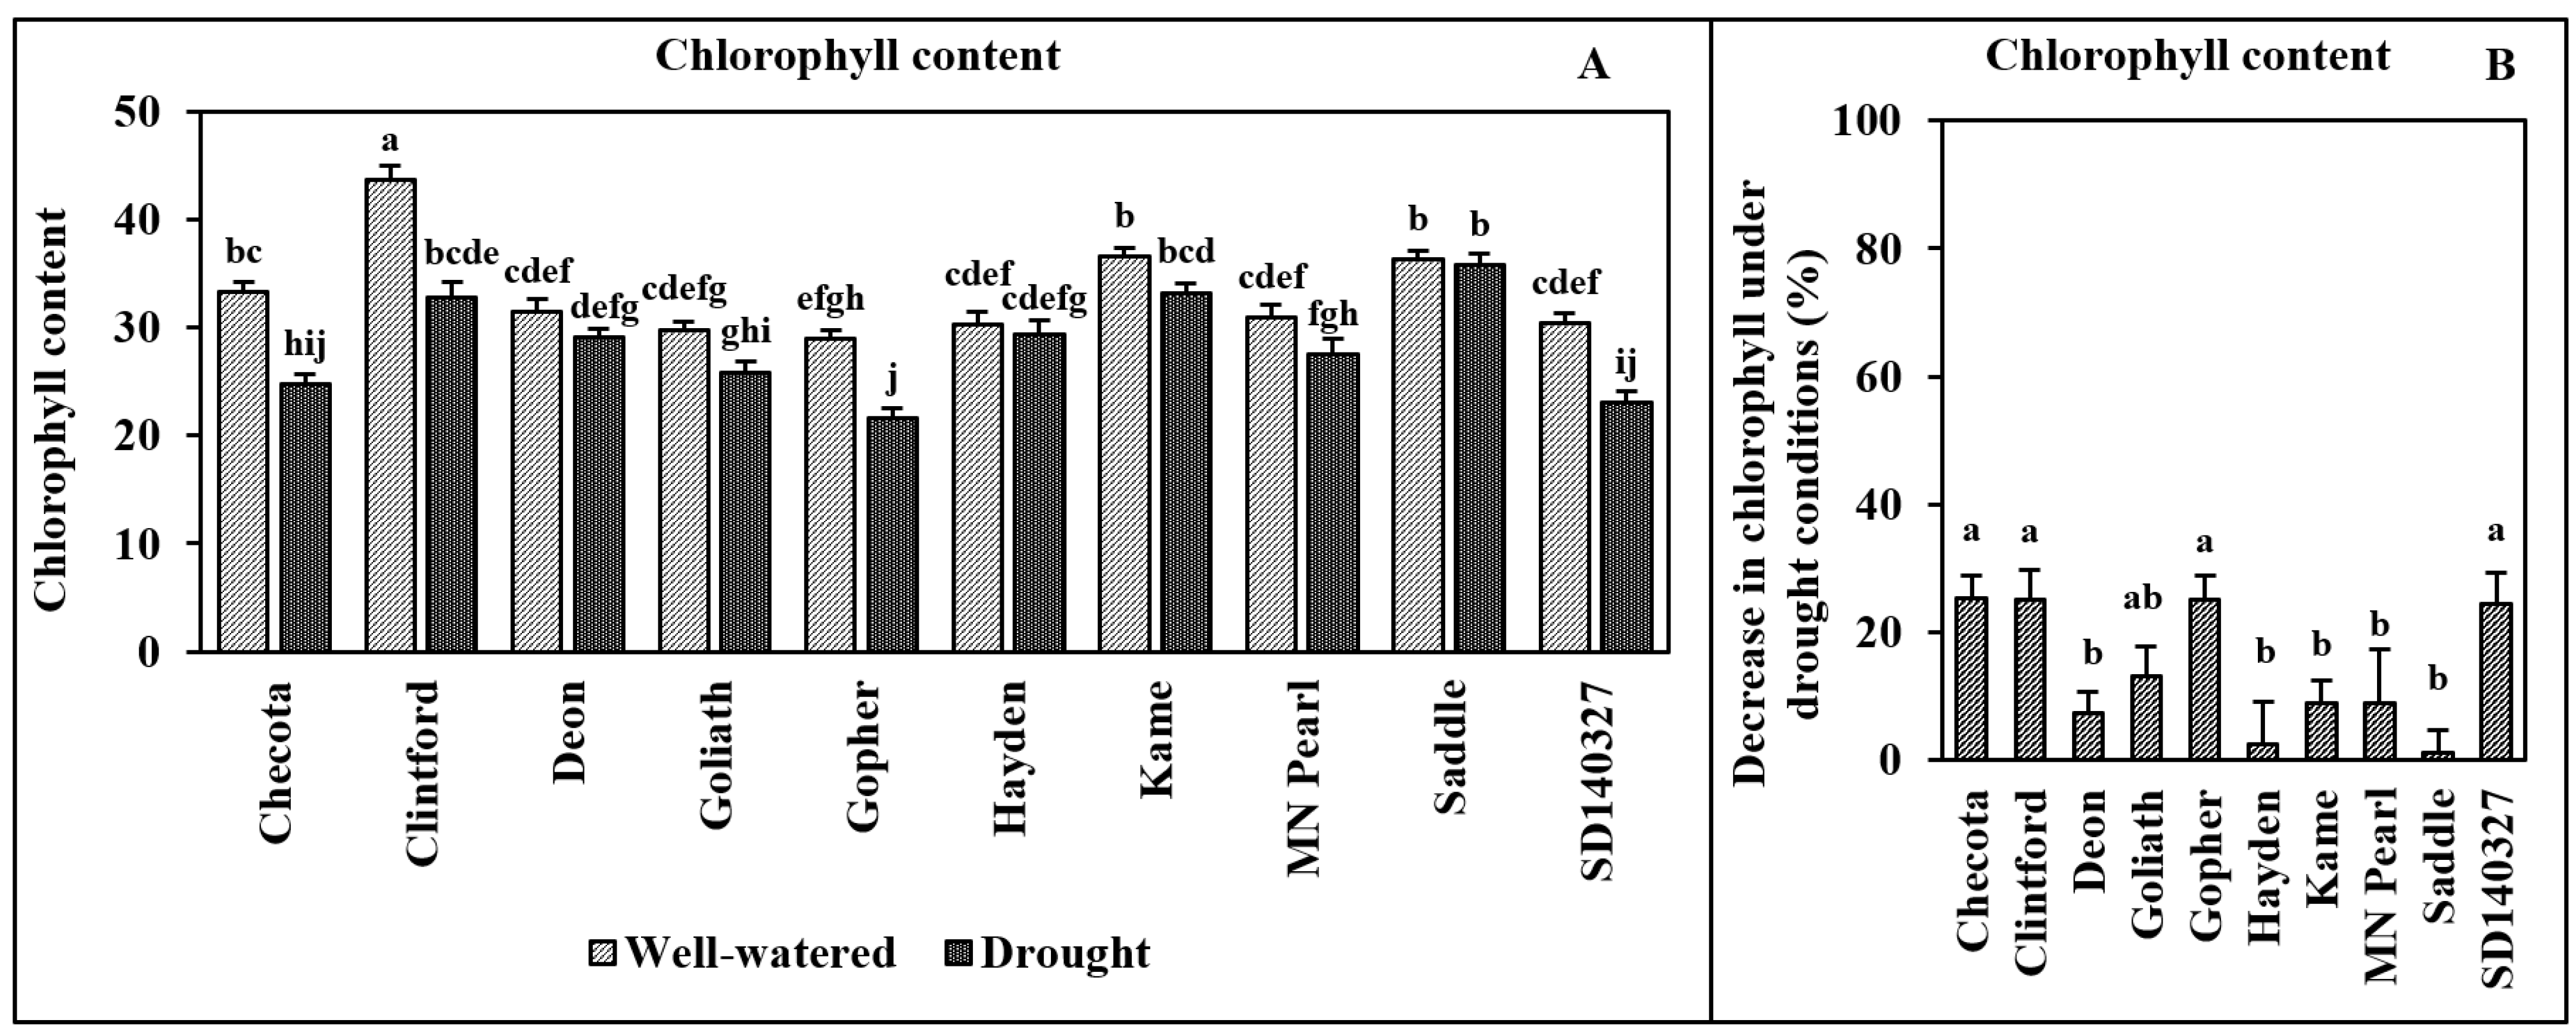
2.4. Chlorophyll Content

The chlorophyll content was measured using CCM-200 plus Chlorophyll Content Meter (Opti-Sciences, Inc., Hudson, NH, USA). The youngest fully expanded leaf from each plant was chosen for measuring chlorophyll content. One measurement was made on every plant in each treatment (5 measurements per genotype per treatment per run of the experiment).

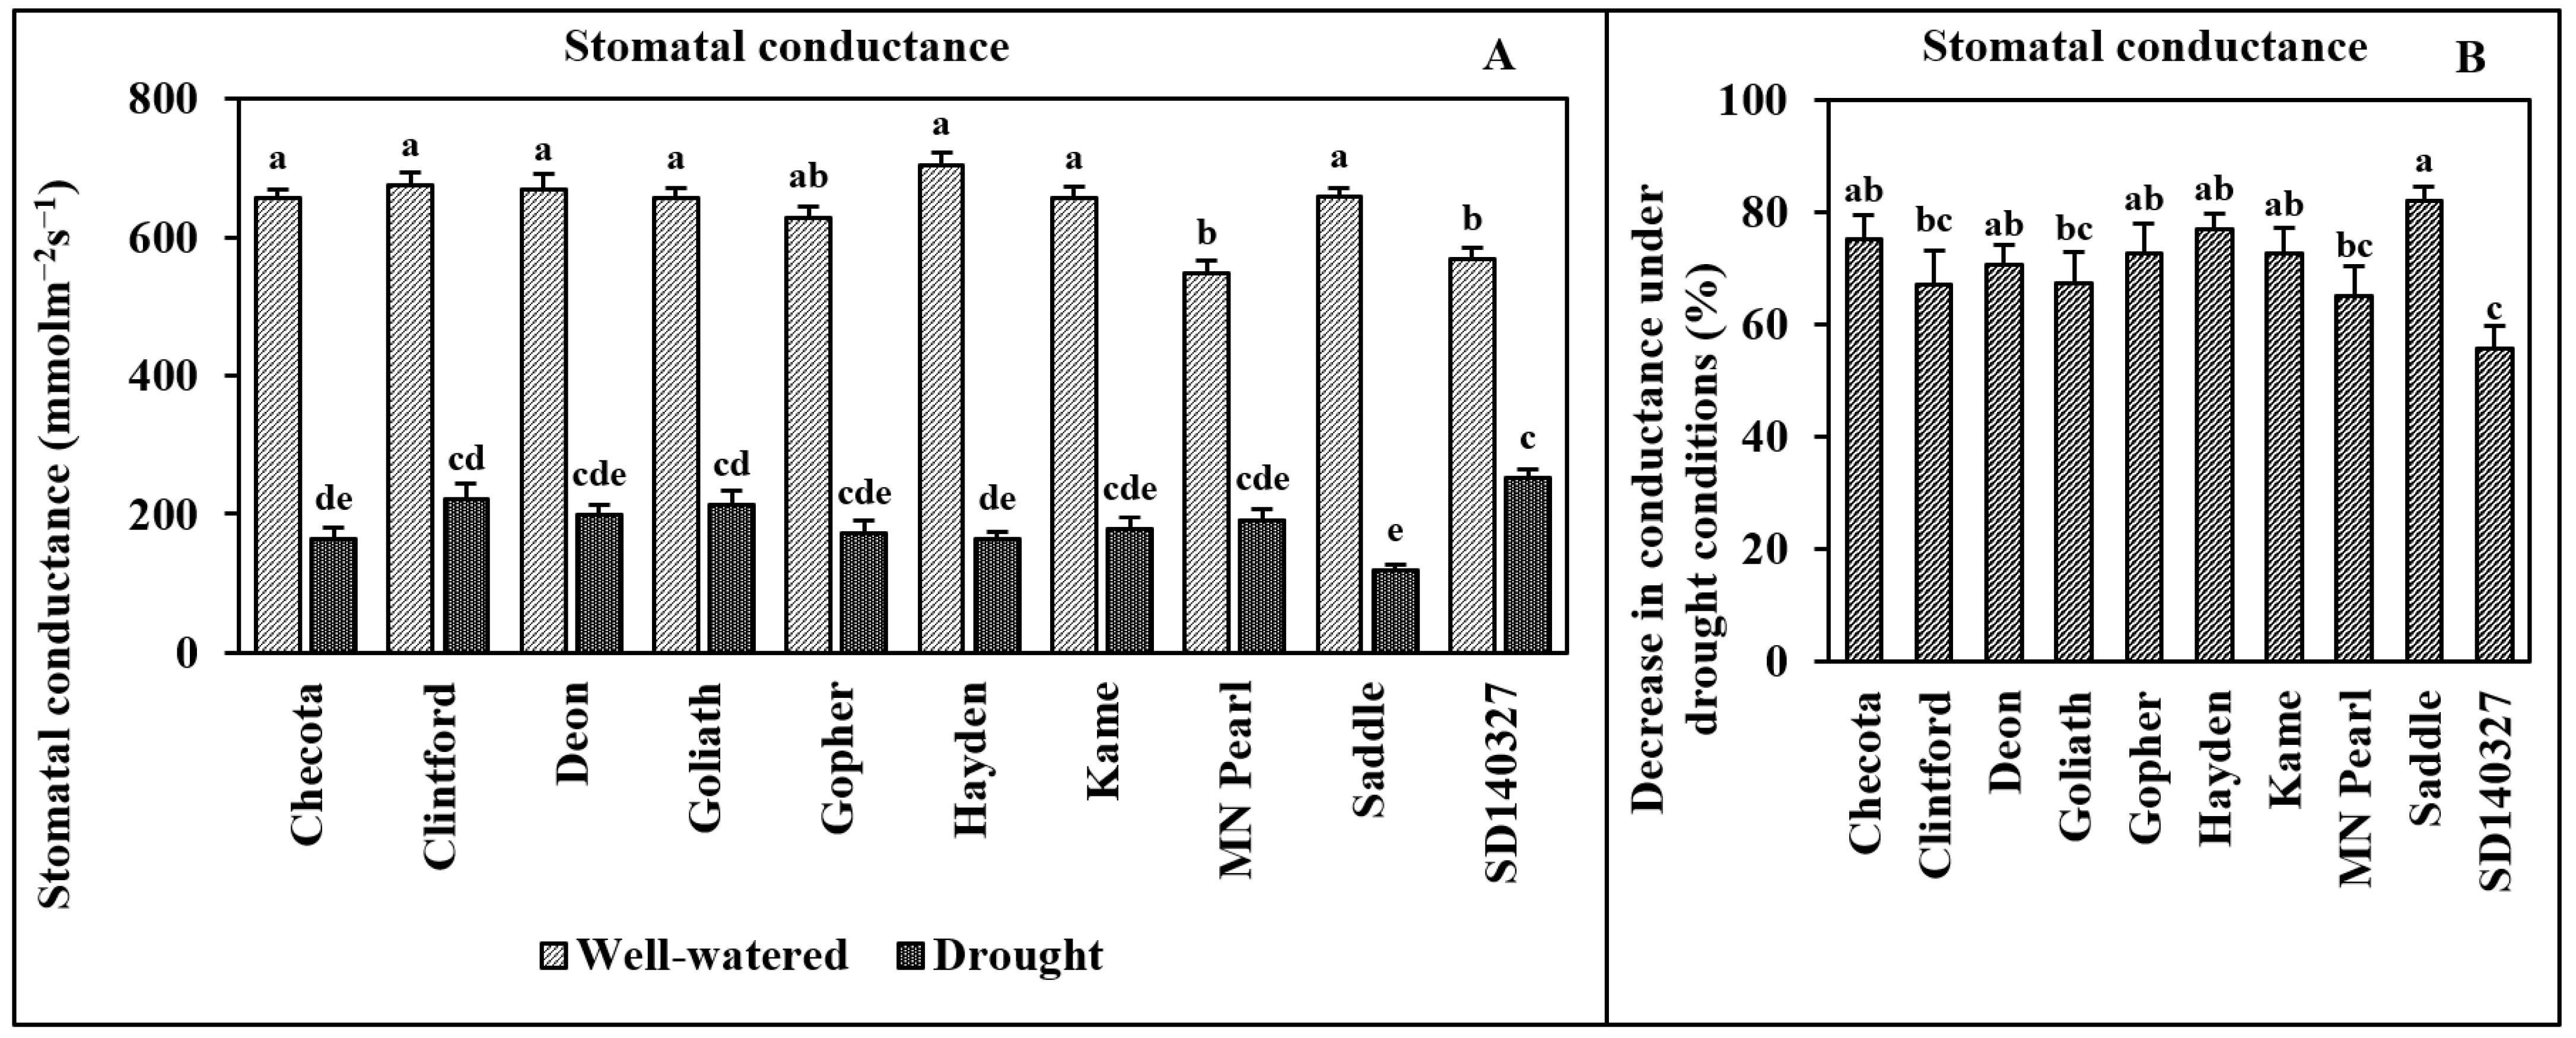
2.5. Stomatal Conductance

The stomatal conductance was measured using a portable SC-1 leaf porometer (Decagon Devices, Pullman, WA, USA). The fully expanded youngest leaves from each plant were chosen for measuring stomatal conductance. A stomatal conductance reading was taken in 3 random plants from each treatment (3 readings per genotype per treatment per run of the experiment).

2.6. Stomata Number

Stomata number was determined using the leaf imprints technique on the youngest fully expanded leaf, according to the method described by Hilu and Randall [30]. A thin layer of nail polish was applied to the leaf surface. One leaf imprint was made from every plant in the experiment. The nail polish was allowed to dry and the thin film of nail polish on the leaf was peeled off using a clear scotch tape. The nail polish film with the imprint of the leaf was mounted on a microscope slide and observed under a light microscope (ATC 2000, Leica, Buffalo Grove, IL, USA). The area of the field of view was determined using a stage micrometer, and the stomata were counted in a field of view with an area of 2.01 mm2. Three readings were taken at random spots from each imprint, and the average number of the three readings was used as stomata number for each leaf.

2.7. Statistical Analysis

Statistical analysis was done with the R programing language (V 4.1.2) [31]. Multiple comparisons between treatment means were performed with the least significant difference using the agricolae package (version 1.3-5) in R (V 4.1.2) [32]. The LSD.test function from the agricolae package returns the multiple comparison of treatment means and grouping of treatments by adjusting p-values for multiple comparison. The standard analysis of variance was performed for the traits that were normally distributed. For the traits that were not following a normal distribution, non-parametric statistics were used to determine the effects of the genotype, drought treatment, and their interactions. The nonparametric analysis of variance was conducted using the ARTool Package in R [33]. The ARTool Package performs aligned rank transformation for nonparametric factorial analysis of variance. The linear correlation between traits was analyzed based on Pearson correlation coefficient, and the correlation plots were generated using the performance analytics package in R, where the correlation coefficient is shown along with scatter plots for each correlation and the statistical significance of the correlation.

2.8. Drought Tolerance Indices

Four drought tolerance indices were measured for each genotype based on the control and drought stress yield per plant. The drought tolerance indices are as listed below [34,35,36,37].
Stress   tolerance   index   ( STI ) = ( Y c × Y s ) ( Y m c ) 2
Drought   resistance   index   ( DRI ) = [ Y s × Y s Y c ] Y m c
Yield   index   ( YI ) = Y s Y m s
Yield   stability   index   ( YSI ) = Y s Y c
where Ys is the average seed yield of the genotype under drought-stressed conditions, Yc is the average seed yield of the genotype under well-watered conditions, Ymc is the average seed yield of all genotypes under well-watered conditions, and Yms is the average seed yield of all genotypes under drought-stressed conditions.

3. Results

The water regime had a significant impact on all traits evaluated. The drought treatment resulted in plants with lower SDW, RDW, root length, root area, root volume, RWC, chlorophyll content, stomata number, and grain weight per plant compared to the well-watered treatment. The root-to-shoot ratio (RSR), however, was on average higher for the drought-stressed plants. The genotype had a significant effect on all traits evaluated except for stomatal conductance. The ten oat genotypes were selected to be representative of cultivars adapted to the spring oat region of the US and to maximize variability in root morphological characteristics. While the selection was based on phenotyping data collected on roots at the seedling stage, the selected genotypes also varied significantly for shoot and root traits at the adult plant stage. A significant genotype by water regime interaction was observed for RWC, chlorophyll content, stomatal conductance, grain yield, and stomata number, indicating a differential response among the 10 genotypes to drought stress. The analysis of the variance table is available in the Supplementary File, Table S1. There was no significant interaction, however, between genotype and water regime for SDW and root traits (RDW, RSR, root length, root area, and root volume).
Shoot dry weight (SDW) is an estimation of above-ground biomass production. The 10 oat genotypes were significantly different for SDW (Figure 1A) under both water treatments. SDW was on average 29.6% lower under drought stress than under well-watered conditions (Figure 1A). There was no significant difference among genotypes for the reduction in SDW in response to the drought treatment (Figure 1B).
Similarly, genotypes were significantly different for RDW under both water treatments (Figure 2A). All genotypes had lower RDW under water deficit. The intensity of RDW reduction was not significantly different among genotypes (Figure 2B).
While there was no significant difference among genotypes for their response in SDW and RDW (Figure 1B and Figure 2B), a differential response to drought treatment was observed among genotypes for RSR (Figure 3B). Checota and Gopher were the only cultivars that showed a significant increase in RSR under the drought conditions compared to the well-watered conditions (Figure 3A,B). Unlike Deon and Hayden, in which drought stress reduced the size of the above- and below-ground biomass proportionally, for Gopher and Checota, drought stress resulted in a larger decrease in SDW than in RDW (Figure 1B and Figure 2B).
The genotypes varied widely in root system characteristics. Total root length ranged from 2506 cm (SD140327) to 4387 cm (MN Pearl) under well-watered conditions (Figure 4A) and from 2097 cm (SD140327) to 2981 cm (Saddle) under drought conditions. Root length was significantly lower under drought stress for all genotypes except SD140327, but the % change in root length between the two water treatments was not significantly different among genotypes (Figure 4B). Similarly, all genotypes had significantly lower root area under the drought treatment except for SD140327 (Figure 5A). The % change in root area between the two water treatments was not significantly different among genotypes (Figure 5B).
Several genotypes (Clintford, Hayden, Kame, MN Pearl, and Saddle) had significantly lower root volume under the drought treatment than under well-watered conditions (Figure 6A). The % change in root volume between the two water treatments was significantly different among genotypes, with the highest being observed in Saddle (35.7%) (Figure 6B and Figure 7).
There was no significant difference in RWC between oat genotypes under well-watered conditions. A significant decrease in the RWC in response to drought stress was observed in all genotypes except for SD140327 (Figure 8A). The change in RWC between the two treatments was significantly different among genotypes. The strongest decrease in RWC was observed in Saddle (23%) (Figure 8B). On the other hand, the decrease in RWC was <10% for other genotypes (SD140327, Hayden, Goliath, Deon, and Clintford) (Figure 8B).
Drought stress did not affect chlorophyll content similarly for all genotypes. The chlorophyll content was significantly reduced (close to a 25% reduction) in some genotypes (Checota, Clintford, Gopher, and SD140327) but not in others (Deon, Goliath, Hayden, Kame, MN Pearl, and Saddle) (Figure 9B).
The 10 genotypes were significantly different for stomatal conductance under both well-watered and drought conditions. Drought stress significantly reduced stomatal conductance in all genotypes (Figure 10A), but the percentage of reduction varied significantly among genotypes, ranging from 55.7% for SD140327 to more than 82.0% in Saddle (Figure 10B).
Stomata numbers varied greatly under well-watered conditions, with Hayden and Checota showing a significantly higher number of stomata compared to Clintford, Deon, Gopher, Kame, Saddle, and SD140327 (Figure 11A). Under drought conditions, a significant decrease in stomata number was observed in seven genotypes (Checota, Deon, Hayden, Kame, MN Pearl, Saddle, and SD140327). The decrease in stomata number was, however, not significant in Clintford, Goliath, and Gopher. Hayden showed the greatest decrease in stomata number with 33%, followed by Saddle (24.5%) and Checota (22.6%) (Figure 11B).
Seed weight per plant varied greatly among genotypes, ranging from 2.4 to 4.6 g/plant under well-watered conditions, with the highest seed weight for Goliath, Deon, and Hayden, and the lowest for Gopher and Clintford (Figure 12A). All genotypes showed a significant decrease in seed weight under drought stress. There was a significant difference among the genotypes for the percent reduction in seed weight in response to drought stress. The greatest reduction in seed weight was observed in Saddle (45.5%), Goliath (45.2%), and Deon (42.3%), while the smallest was observed in Hayden (22.2%) (Figure 12B). The reduction in seed weight in response to water deficit was intermediate for Checota.
Several drought tolerance indices were calculated (Table 1). Hayden consistently showed the highest drought tolerance among the ten genotypes evaluated based on the four indices calculated. Inversely, Saddle and Gopher consistently ranked as least drought-tolerant.
When considering the entire dataset, most evaluated traits were positively correlated with one another. The strongest correlations were observed between root and shoot dry weight (r = 0.85) and among root traits (r = 0.70–0.94) (Figure 13). The grain weight per plant was most correlated with stomatal conductance (r = 0.55) and was significantly correlated with all other traits measured (except for the root-to-shoot ratio) (Figure 13). When the correlations among traits were evaluated for each water treatment separately, however, different correlation patterns were observed. Seed weight per plant was only weakly correlated with chlorophyll content (r = −0.23), stomata number (r = 0.21), RDW (r = 0.18), and RSR (r = 0.17). Chlorophyll content and relative water content were not significantly correlated with any other variables under well-watered conditions (Figure 14), and stomatal conductance was only significantly correlated with chlorophyll content (r = 0.28). Under drought conditions, however, RWC was significantly negatively correlated with SDW (r = −0.68), RDW (r = −0.59), and chlorophyll content (r = −0.35), and weakly positively correlated with grain yield per plant (r = 0.24) (Figure 14). RWC was the only variable significantly correlated with seed weight per plant under drought conditions (Figure 15). While under well-watered conditions chlorophyl content was only significantly correlated to stomatal conductance and seed weight, under drought conditions it was significantly correlated to SDW (r = 0.51), stomata number (r = −0.40), RWC (r = −0.35), RDW (r = 0.25), and RSR (r = −0.23).
A correlation analysis was also performed between drought tolerance indices and percentage change in traits in response to drought (Figure 16). Although the correlation was low (r < 0.4), some of the tolerance indices were significantly correlated with the response in several traits. The percent change in relative water content was negatively correlated with the yield index and drought resistance index. The percent change in chlorophyll content was negatively correlated with the yield index and stress tolerance index. This means that the more the drought resulted in a decrease in RWC and chlorophyll content, the less the plants were able to tolerate the drought. Inversely, the change in stomata number was positively correlated with the yield index, drought resistance index, and stress tolerance index (Figure 16). This means that plants with a larger reduction in stomata number as a result of drought stress were better able to tolerate the drought stress.

4. Discussion

In this study, we investigated the impact of drought stress on the physiological and morphological parameters of ten US oat genotypes. We found that high relative water content under drought is necessary for maintaining yield under drought. We observed a differential response of oat cultivars to drought stress for multiple physiological parameters, including relative water content, stomatal conductance, stomata number, and chlorophyll content.
With an increase in the occurrence of drought throughout the world and in North America, improving drought tolerance in oats is an urgent need. Drought tolerance is a complex quantitative trait controlled by several small-effect genes, confounded by different plant phenology [38,39]. Many traits can be affected by drought, and thus evaluating diverse morphological and physiological root and shoot traits in multiple genotypes under drought stress is necessary to understand plant response to drought.
All oat genotypes tested in this study showed a significant reduction in SDW in response to drought treatment. A reduction in SDW is common for plants facing drought stress because of a reduction in photosynthetic capacity [40]. A decrease in photosynthesis can be due to the biochemical decline of the photosynthetic process or due to stomatal closure which reduces the CO2 entry into the leaf [41]. Drought-tolerant cultivars typically show a smaller reduction in SDW under drought compared to susceptible cultivars [42,43]. In our study, the decrease in SDW was not significantly different among genotypes.
We observed a significant decrease in RDW in seven out of ten cultivars. Both a decrease [44] and an increase [45] in RDW have been reported under drought in the literature. Fang et al. [46] summarized the contrasting arguments about the importance of the root system for grain yield under drought. One argument is that a relatively large root system is essential for a crop to absorb more soil water and relieve drought stress. The alternative view is that reducing root biomass increases the availability of photosynthate for above-ground parts including grain yield. In our study, cultivars with larger root system did not show higher yield under drought.
The root-to-shoot biomass ratio can account for the size of the root system relative to plant size. The size of the root system is an important factor in the acquisition of soil resources but only when considered with whole-plant size [47]. In our study, two genotypes, including the drought-resistant check Checota, showed a significant increase in RSR. The other eight genotypes did not show significant differences in RSR under drought conditions. This suggests that the genotypes have different strategies in allocating photosynthates to root and shoot. A higher RSR was reported as a factor in drought tolerance, and selecting genotypes with higher RSR in a greenhouse was considered a viable method for improving field drought tolerance in tall fescue [48].
In our study, Saddle and MN Pearl showed a relatively larger root system (higher RDW, root area, root volume, and root length) compared to other genotypes. While all cultivars except SD140327 showed reduced root length under drought, no significant difference was observed for % change in root length and area among cultivars, but we observed significant differences for the change in root volume. A reduction in root length, root area, and RDW in response to drought has been reported in oats, and oat cultivars tolerant to drought have been reported to exhibit a smaller reduction in root length, root area, and root weight compared to susceptible cultivars [19]. Contrary to the other genotypes, SD140327, which had the smallest root system (smallest root length, area, and volume) did not show any significant reduction in root characteristics under drought conditions. However, the seed production was significantly reduced under drought for this genotype. The root system of this genotype may have less plasticity than other genotypes because of its small size. A decrease in root length under drought has also been reported in both winter and spring wheat. Drought tolerance in winter wheat is associated with a deeper root system and in spring wheat with a well-branched shallow root system [49]. In our study, a larger root length, root area, and root volume were associated with seed weight when correlations were analyzed across both treatments but not when evaluated within treatments, suggesting that the total root length, root area, and root volume did not contribute to a higher yield under drought in our study. A strong positive correlation between SDW and RDW was observed, and a similar result was reported by Tolley et al. [50]. The correlation coefficient between SDW and RDW was 0.85 under well-watered conditions but 0.61 under drought, suggesting that oat genotypes had different ability to allocate photosynthates into root and shoot under drought conditions. Further investigation into the distribution of roots into upper and lower soil levels may reveal the relative importance of shallow versus deeper root system in oats. A higher root biomass and root length density in the subsoil layer are thought to be possible features for wheat adaptation to water stress, as they boost the subsoil water extraction capacity for grain filling and increased grain yield [51]. However, the ten oat genotypes evaluated in this study did not show a significant difference in root biomass reduction in response to drought. Although the ten evaluated oat cultivars differed significantly for root traits at the seedling and adult stages, the effect of drought on root traits in this study was similar among the ten cultivars (no genotype by treatment interaction). It is possible that a longer drought duration and/or a larger soil volume may have resulted in variation in root trait responses to drought among the cultivars. A field study would be valuable to fully determine if a genotype-specific response in root traits under drought exists in oats and if some root characteristics should be targeted for improving tolerance to drought. In oats, Wen et al. [52] reported that drought-tolerant oat genotypes could allocate more biomass into root and grain, and had higher chlorophyll content and better root structure than drought-sensitive genotypes. The stimulation of root branching and fine root growth has been reported to mediate the capacity of drought-tolerant oats to cope with water stress [19]. During drought stress, the RWC decreases. Maintaining RWC under drought stress is considered a drought tolerance character [53,54]. The osmotic adjustment or the accumulation of solutes in response to drought is well recognized to play a role in plant adaptation to drought [55]. In our study, the highest decrease in RWC was found in Saddle, which also showed the highest decrease in seed yield in response to drought. RWC was the only trait significantly associated with seed weight per plant under the drought treatment in our study. As opposed to Saddle, SD140327 and Hayden showed a smaller decrease in RWC in response to the drought treatment. Gong et al. [56] reported that drought-tolerant oat genotypes maintained a significantly higher RWC and osmotic potential in roots and leaves. While it is difficult to find a single trait responsible for yield advantage in different crops under drought conditions, Blum [55] reported that osmotic adjustments can sustain yield under drought in many crops. The variability in RWC under drought conditions suggests that oat genotypes have different abilities to produce soluble sugars for osmotic adjustment under drought.
Drought has an impact on leaf chlorophyll content, and we observed a significant effect of oat genotype, water regime, and their interaction on chlorophyll content. Similar results were reported in wheat and maize [57,58]. Although Saddle showed no reduction in chlorophyll content under drought compared to the control treatment, it showed the highest reduction in seed weight. The reduction in seed weight produced per plant in Saddle might be due to the decrease in photosynthesis as a result of the reduced entry of CO2 into the leaf due to rapid stomatal closure and not to biochemical decline in photosynthesis (reduced rate of enzyme functions in Calvin cycle). This is supported by the largest reduction in stomatal conductance between the two treatments for the cultivar Saddle. Saddle also showed a large reduction in stomata number under drought conditions, thus decreasing the amount of CO2 flow into the leaf. A rapid increase in abscisic acid, leading to a rapid reduction in stomatal conductance, was reported in drought-sensitive oat cultivar ‘Flega’ [59]. Flexas and Medrano [41] suggested that stomatal closure is the earliest response and primary limitation to photosynthesis at moderate drought stress. A decrease in plant photosynthesis will also impact root growth and the allocation of photosynthates to the root. One of the first responses of plants to drought is to close the stomata to reduce transpiration. Stomata are small apertures that open and close to absorb photosynthetic carbon dioxide and to limit water loss through transpiration. Both an increase and a decrease in stomata number in response to drought have been reported [42,60,61]. We observed a significant decrease in stomata number under drought in seven out of ten cultivars, with Hayden showing the highest decrease. A decrease in stomata number is one of the morphological responses of plants to drought [62], and a decrease in stomatal density is shown to improve drought tolerance in barley [63]. Similarly, reduced stomata numbers can improve drought tolerance and reduce water use in rice [64]. Thus, reducing stomata numbers may also help oat plants with water conservation and drought tolerance.
Although stomata numbers can impact transpiration, the degree of stomatal opening is also an important factor that determines the resistance of CO2 and water vapor between the leaf and the atmosphere. The increase in stomata number under drought can be accompanied by a decrease in stomatal aperture [42], and smaller stomata are more dynamic in opening and closing and thus regulating transpiration more efficiently [65]. The decrease in overall plant growth under drought can be attributed to a decrease in stomatal conductance that limits CO2 entry into the leaf. Thus, having an optimal number of stomata that can open and close more dynamically in response to environmental cues such as light and drought can help oat cultivars optimize the leaf stomatal conductance and thus optimize water use and photosynthesis under drought. Further studies on the size of stomata and how responsive the stomata are to the drought-induced abscisic acid might help better understand the role of stomata in drought tolerance in oats. Since the plant can produce abscisic acid under drought to initiate stomatal closure, the sensitivity of stomata to abscisic acid can determine the effectiveness of stomata in controlling gaseous exchanges. The response of stomata to abscisic acid controls the stomatal pore, and drought-resistant plants have stomata which are more responsive to abscisic acid [42]. The cultivar Checota was included in this study as a resistant check based on previous reports of its drought tolerance in field evaluation under rainfed and irrigated conditions [12,26]. In our greenhouse study, Checota was intermediate for reduction in grain yield under drought conditions compared to other cultivars. It showed a sharp decrease in chlorophyll content, a relatively small decrease in RWC, a decrease in stomatal conductance, and a significantly higher decrease in stomata number than some of the other genotypes. Checota also showed a strong increase in RSR. Like Checota, Hayden was among the genotypes with the highest decrease in stomata number and in stomatal conductance. But unlike Checota, Hayden maintained its chlorophyl content. Hayden, which had the lowest reduction in grain yield from the drought treatment, was able to maintain RWC relatively well in comparison to other cultivars. Hayden also showed a higher drought tolerance compared to all other genotypes based on all four drought tolerance indices. These results are consistent with our observations in multi-environment trials in the Northern Great Plains, where Hayden is able to outyield other adapted cultivars under moderate drought conditions and exhibits stable yield performance in the absence of crown rust infection. On the other hand, the cultivar Saddle had the largest decrease in grain weight produced per plant. As opposed to Checota and Hayden, Saddle showed a large reduction in RWC when subjected to drought stress. But the change in stomata number and stomatal conductance of Saddle in response to drought was not significantly different than that of Hayden and Checota. As Hayden, Saddle maintained its chlorophyll content under drought. In multi-environment trials, however, Saddle has displayed unstable performance, exhibiting high yield in optimal environments but low performance under stressed environments. In this study, the relative water content was the only trait significantly correlated with yield under drought. Thus, our results suggest that selecting genotypes that are able to maintain relative water content under drought can help oat breeders develop cultivars which are less susceptible to drought stress and more stable in the changing climate. Hayden can be used as parent in crossing where it can provide both yield and drought tolerance characteristics to its progeny. A significant negative correlation between changes in RWC and chlorophyll content under drought and yield indices indicates that maintaining these traits under drought is important for drought tolerance. Similarly, a positive correlation between changes in stomata number and yield indices suggest that a reduction in stomata number is important for drought tolerance.
Although drought-tolerant oat cultivars have been shown to exhibit higher root length, surface area, and root branching [19], the size of the root system did not seem to provide a yield advantage under drought conditions in our study. Further studies with a longer drought duration and the evaluation of root density distribution at various soil depths may provide additional insight into the role of roots in drought tolerance in oats. Our results show the importance of evaluating a large number of genotypes to understand the mechanisms involved in drought tolerance to develop oat cultivars able to maintain a high yield under moderate drought stress. Although the field phenotyping of roots has limitations, a field experiment may be necessary to study the importance of roots in drought tolerance and further confirm the findings of this study.

Supplementary Materials

The following supporting information can be downloaded at: https://www.mdpi.com/article/10.3390/agriculture14010109/s1, Table S1: Analysis of variance table of traits evaluated.

Author Contributions

Conceptualization, K.G., M.C. and I.M.; methodology, K.G., M.C. and I.M.; software, K.G.; validation: K.G. and M.C.; formal analysis: K.G. and M.C.; resources: M.C.; data curation, K.G.; writing—original draft preparation K.G. and M.C.; writing—review and editing K.G., M.C. and I.M.; supervision, M.C.; project administration, M.C.; funding acquisition, M.C. All authors have read and agreed to the published version of the manuscript.

Funding

This research was supported by South Dakota Crop Improvement Association, the South Dakota Agricultural Experiment Station, and the USDA NIFA under hatch project (project number SD00H529-14).

Institutional Review Board Statement

Not applicable.

Data Availability Statement

The data supporting the finding of this study are available from the corresponding author upon reasonable request.

Acknowledgments

The root scanner used in this study is supported by funding from the National Science Foundation/EPSCoR Cooperative Agreement #IIA-1355423, and the State of South Dakota.

Conflicts of Interest

The authors declare no conflicts of interest.

References

  1. Clemens, R.; van Klinken, B.J. Oats, more than just a whole grain: An introduction. Br. J. Nutr. 2014, 112, S1–S3. [Google Scholar] [CrossRef] [PubMed]
  2. Webster, H.H. Chapter 17: Oat Utilization: Past, Present, and Future. In Oats: Chemistry and Technology; Webster, H.H., Wood, P.J., Eds.; AAAC International Press: St. Paul, MN, USA, 2011; pp. 347–361. [Google Scholar]
  3. Broeck, H.C.; Londono, D.M.; Timmer, R.; Smulders, M.J.M.; Gilissen, L.J.W.J.; Meer, I.M. Profiling of nutritional and health-related compounds in oat varieties. Foods 2016, 5, 2. [Google Scholar] [CrossRef]
  4. Paudel, D.; Dhungana, B.; Caffe, M.; Krishnan, P. A Review of Health-Beneficial Properties of Oats. Foods 2021, 10, 2591. [Google Scholar] [CrossRef]
  5. Statista, Market Revenue Forecast of Oats Worldwide from 2018 to 2028. 2019. Available online: https://www.statista.com/statistics/1073693/global-oat-market-revenue (accessed on 1 October 2023).
  6. Isidro-Sánchez, J.; Prats, E.; Howarth, C.; Langdon, T.; Montilla-Bascón, G. Genomic Approaches for Climate Resilience Breeding in Oats. In Genomic Designing of Climate-Smart Cereal Crops; Kole, C., Ed.; Springer: Berlin/Heidelberg, Germany, 2020; pp. 133–169. [Google Scholar]
  7. Klink, K.; Crawford, C.J.; Wiersma, J.J.; Stuthman, D.D. Climate Variability and the Productivity of Barley and Oats in Minnesota. CURA Rep. 2011, 41, 12–18. Available online: http://www.cura.umn.edu/sites/cura.advantagelabs.com/files/publications/41-1-Klink_et_al_0.pdf (accessed on 1 October 2023).
  8. Statistics Canada, Estimated Areas, Yield, Production, Average Farm Price and Total Farm Value of Principal Field Crops, in Metric and Imperial Units, September 2023. 2023. Available online: https://www150.statcan.gc.ca/t1/tbl1/en/tv.action?pid=3210035901 (accessed on 1 October 2023).
  9. Strychar, R.; Webster, F.H.; Wood, P.J. World oat production, trade, and usage. In Oats: Chemistry and Technology; Academic Press: Cambridge, MA, USA, 2011; pp. 77–94. [Google Scholar]
  10. USDA Foreign Agricultural Service, Grain: World Marktes and Trade. 2023. Available online: https://apps.fas.usda.gov/psdonline/circulars/grain.pdf (accessed on 1 September 2023).
  11. Mahadevan, M.; Calderini, D.F.; Zwer, P.K.; Sadras, V.O. The critical period for yield determination in oat (Avena sativa L.). Field Crops Res. 2016, 199, 109–116. [Google Scholar] [CrossRef]
  12. Akcura, M.; Ceri, S. Evaluation of drought tolerance indices for selection of Turkish oat (Avena sativa L.) landraces under various environmental conditions. Zemdirb. Agric. 2011, 98, 157–166. [Google Scholar]
  13. Mall, R.K.; Gupta, A.; Sonkar, G. Effect of Climate Change on Agricultural Crops. In Current Developments in Biotechnology and Bioengineering: Crop Modification, Nutrition, and Food Production; Dubey, S.K., Pandey, A., Sangwan, R.S., Eds.; Elsevier: Amsterdam, The Netherlands, 2017; pp. 23–46. [Google Scholar]
  14. Sterk, R. Oat Prices Skyrocket as Supply Wanes Due to Drought, Demand. Food Business News. 2021. Available online: https://www.foodbusinessnews.net/articles/19903-oat-prices-skyrocket-as-supply-wanes-due-to-drought-demand#:~:text=KANSAS%20CITY%20%E2%80%94%20Oat%20supplies%20in,reported%20by%20Sosland%20Publishing%20Co (accessed on 1 October 2023).
  15. Hirtzer, M.; Carey, D. Drought Pushes U.S. Oat Crop to Lowest in Records Back to 1866. Bloomberg. 2021. Available online: https://www.bloomberg.com/news/articles/2021-07-12/drought-pushes-u-s-oat-crop-to-lowest-in-records-back-to-1866 (accessed on 1 September 2023).
  16. Zhang, X.; Liu, W.; Lv, Y.; Li, T.; Tang, J.; Yang, X.; Bai, J.; Jin, X.; Zhou, H. Effects of drought stress during critical periods on the photosynthetic characteristics and production performance of naked oat (Avena nuda L.). Sci. Rep. 2022, 12, 11199. [Google Scholar] [CrossRef]
  17. Zhao, B.; Ma, B.-L.; Hu, Y.; Liu, J. Source–sink adjustment: A mechanistic understanding of the timing and severity of drought stress on photosynthesis and grain yields of two contrasting oat (Avena sativa L.) genotypes. J. Plant Growth Regul. 2021, 40, 263–276. [Google Scholar] [CrossRef]
  18. Gupta, A.; Rico-Medina, A.; Caño-Delgado, A.I. The Physiology of Plant Responses to Drought. Science 2020, 368, 266–269. [Google Scholar] [CrossRef]
  19. Canales, F.J.; Nagel, K.A.; Müller, C.; Rispail, N.; Prats, E. Deciphering Root Architectural Traits Involved to Cope with Water Deficit in Oat. Front. Plant Sci. 2019, 10, 1558. [Google Scholar] [CrossRef]
  20. Schachtman, D.P.; Goodger, J.Q. Chemical root to shoot signaling under drought. Trends Plant Sci. 2018, 13, 281–287. [Google Scholar] [CrossRef] [PubMed]
  21. Hasan, M.M.; Gong, L.; Nie, Z.; Feng, X.; Ahammed, G.J.; Fang, X.W. ABA-induced stomatal movements in vascular plants during dehydration versus rehydration. Environ. Exp. Bot. 2021, 186, 104436. [Google Scholar] [CrossRef]
  22. Grzesiak, M.T.; Marcińska, I.; Janowiak, F.; Rzepka, A.; Hura, T. The relationship between seedling growth and grain yield under drought conditions in maize and triticale genotypes. Acta Physiol. Plant. 2012, 34, 1757–1764. [Google Scholar] [CrossRef]
  23. Patterson, F.; Schafer, J.; Roberts, J. Registration of Clintford Oat 1 Reg. No.(292). Crop Sci. 1979, 19, 294–295. [Google Scholar] [CrossRef]
  24. Caffe-Treml, M.; Hall, L.; Bauer, R.; Kleinjan, J.; Hall, N.; Ingemansen, J.A. Registration of oat cultivar ‘Hayden’. J. Plant Regist. 2017, 11, 95–99. [Google Scholar] [CrossRef]
  25. Edwards, L.H.; Smith, E.L.; Pass, H.; Evans, C.L. Registration of Checota Oats (Reg. No. 240). Crop Sci. 1971, 11, 134. [Google Scholar]
  26. Benlioglu, B.; Ozkan, U. The influence of salinity and drought stress on some oat cultivars (Avena sativa L.) by determining some stress indexes and growth performances at the germination stage. Fresen Environ. Bull. 2021, 30, 771–778. [Google Scholar]
  27. Wasson, A.P.; Richards, R.A.; Chatrath, R.; Misra, S.C.; Prasad, S.V.; Rebetzke, G.J.; Kirkegaard, J.A.; Christopher, J.; Watt, M. Traits and selection strategies to improve root systems and water uptake in water-limited wheat crops. J. Exp. Bot. 2012, 63, 3485–3498. [Google Scholar] [CrossRef]
  28. Turner, N.C. Imposing and Maintaining Soil Water Deficits in Drought Studies in Pots. Plant Soil 2019, 439, 45–55. [Google Scholar] [CrossRef]
  29. Smart, R.E.; Bingham, G.E. Rapid Estimates of Relative Water Content. Plant Physiol. 1974, 53, 258–260. [Google Scholar] [CrossRef]
  30. Hilu, K.W.; Randall, J.L. Convenient method for studying grass leaf epidermis. Taxon 1984, 33, 413–415. [Google Scholar] [CrossRef]
  31. R Core Team. R: A Language and Environment for Statistical Computing; R Foundation for Statistical Computing: Vienna, Austria, 2020. [Google Scholar]
  32. De Mendiburu, F. Agricolae: Statistical Procedures for Agricultural Research; R Package Version 1.3-5. 2021. Available online: https://www.vps.fmvz.usp.br/CRAN/web/packages/agricolae/vignettes/tutorial.pdf (accessed on 1 June 2023).
  33. Kay, M.; Wobbrock, J.O. ARTool: Aligned Rank Transform for Nonparametric Factorial ANOVAs. R Package Version 0.11.1. 2015. Available online: https://cran.r-project.org/web/packages/ARTool/ (accessed on 1 August 2023).
  34. Fernandez, G.C.J. Effective selection criteria for assessing plant stress tolerance. In Proceedings of the International Symposium on Adaptation of Vegetables and other Food Crops in Temperature and Water Stress, Shanhua, Taiwan, 13–16 August 1992. [Google Scholar]
  35. Mousavi, S.S.; Yazdi Samadi, B.; Naghavi, M.R.; Zali, A.A.; Dashti, H.; Pourshahbazi, A. Introduction of new indices to identify relative drought tolerance and resistance in wheat genotypes. Desert 2008, 12, 165–178. [Google Scholar]
  36. Gavuzzi, P.; Rizza, F.; Palumbo, M.; Campanile, R.G.; Ricciardi, G.L.; Borghi, B. Evaluation of field and laboratory predictors of drought and heat tolerance in winter cereals. Can. J. Plant Sci. 1997, 77, 523–531. [Google Scholar] [CrossRef]
  37. Bouslama, M.; Schapaugh, W.T. Stress Tolerance in Soybeans. I. Evaluation of Three Screening Techniques for Heat and Drought Tolerance. Crop Sci. 1984, 24, 933–937. [Google Scholar] [CrossRef]
  38. Barnabás, B.; Jäger, K.; Fehér, A. The effect of drought and heat stress on reproductive processes in cereals. Plant Cell Environ. 2008, 31, 11–38. [Google Scholar] [CrossRef] [PubMed]
  39. Fleury, D.; Jefferies, S.; Kuchel, H.; Langridge, P. Genetic and genomic tools to improve drought tolerance in wheat. J. Exp. Bot. 2010, 61, 3211–3222. [Google Scholar] [CrossRef] [PubMed]
  40. Chaves, M.M.; Maroco, J.P.; Pereira, J.S. Understanding plant responses to drought—From genes to the whole plant. Funct. Plant Biol. 2003, 30, 239–264. [Google Scholar] [CrossRef]
  41. Flexas, J.; Medrano, H. Drought inhibition of photosynthesis in C3 plants: Stomatal and non-stomatal limitations revisited. Ann. Bot. 2009, 89, 183–189. [Google Scholar] [CrossRef]
  42. Ghimire, K.; Gupta, S.; Geng, S.; Chen, S.; Boe, A.; Wu, Y. Identification of physiological and morphological traits governing high water use efficiency in alfalfa. J. Agron. Crop Sci. 2021, 207, 644–653. [Google Scholar] [CrossRef]
  43. Ahmed, H.G.M.; Sajjad, M.; Li, M.; Azmat, M.A.; Rizwan, M.; Maqsood, R.H.; Khan, S.H. Selection criteria for drought-tolerant bread wheat genotypes at seedling stage. Sustainability 2019, 11, 2584. [Google Scholar] [CrossRef]
  44. Almaghrabi, O.A. Impact of drought stress on germination and seedling growth parameters of some wheat cultivars. Life Sci. J. 2012, 9, 590–598. [Google Scholar]
  45. Lozano, Y.M.; Aguilar-Trigueros, C.A.; Flaig, I.C.; Rillig, M.C. Root trait responses to drought are more heterogeneous than leaf trait responses. Funct. Ecol. 2020, 34, 2224–2235. [Google Scholar] [CrossRef]
  46. Fang, Y.; Du, Y.; Wang, J.; Wu, A.; Qiao, S.; Xu, B.; Zhang, S.; Siddique, K.H.M.; Chen, Y. Moderate drought stress affected root growth and grain yield in old, modern and newly released cultivars of winter wheat. Front. Plant Sci. 2017, 8, 672. [Google Scholar] [CrossRef] [PubMed]
  47. Comas, L.H.; Becker, S.R.; Cruz, V.M.; Byrne, P.F.; Dierig, D.A. Root traits contributing to plant productivity under drought. Front. Plant Sci. 2013, 4, 442. [Google Scholar] [CrossRef]
  48. Karcher, D.E.; Richardson, M.D.; Hignight, K.; Rush, D. Drought tolerance of tall fescue populations selected for high root/shoot ratios and summer survival. Crop Sci. 2008, 48, 771–777. [Google Scholar] [CrossRef]
  49. Djanaguiraman, M.; Prasad, P.V.V.; Kumari, J.; Rengel, Z. Root length and root lipid composition contribute to drought tolerance of winter and spring wheat. Plant Soil 2019, 439, 57–73. [Google Scholar] [CrossRef]
  50. Tolley, S.; Mohammadi, M. Variation in root and shoot growth in response to reduced nitrogen. Plants 2020, 9, 144. [Google Scholar] [CrossRef]
  51. Palta, J.; Chen, X.; Milroy, S.; Rebetzke, G.; Dreccer, M.; Watt, M. Large root systems: Are they useful in adapting wheat to dry environments? Funct. Plant Biol. 2011, 38, 347–354. [Google Scholar] [CrossRef] [PubMed]
  52. Wen, G.; Ma, B.L.; Shi, Y.; Liu, K.; Chen, W. Selection of oat (Avena sativa L.) drought-tolerant genotypes based on multiple yield-associated traits. J. Sci. Food Agric. 2023, 103, 4380–4391. [Google Scholar] [CrossRef] [PubMed]
  53. Soltys-Kalina, D.; Plich, J.; Strzelczyk-Zyta, D.; Sliwka, J.; Marczewski, W. The effect of drought stress on the leaf relative water content and tuber yield of a half-sib family of ‘Katahdin’-derived potato cultivars. Breed. Sci. 2016, 66, 328–331. [Google Scholar] [CrossRef]
  54. Rahman, H.; Ramanathan, V.; Nallathambi, J.; Duraialagaraja, S.; Muthurajan, R. Over-expression of a NAC 67 transcription factor from finger millet (Eleusine coracana L.) confers tolerance against salinity and drought stress in rice. BMC Biotechnol. 2016, 16, 7–20. [Google Scholar] [CrossRef] [PubMed]
  55. Blum, A. Osmotic adjustment is a prime drought stress adaptive engine in support of plant production. Plant Cell Environ. 2017, 40, 4–10. [Google Scholar] [CrossRef] [PubMed]
  56. Gong, D.S.; Xiong, Y.C.; Ma, B.L.; Wang, T.M.; Ge, J.P.; Qin, X.L.; Li, P.F.; Kong, H.Y.; Li, Z.Z.; Li, F.M. Early activation of plasma membrane H+-ATPase and its relation to drought adaptation in two contrasting oat (Avena sativa L.) genotypes. Environ. Exp. Bot. 2010, 69, 1–8. [Google Scholar] [CrossRef]
  57. Ahmad, A.; Aslam, Z.; Javed, T.; Hussain, S.; Raza, A.; Shabbir, R.; Mora-Poblete, F.; Saeed, T.; Zulfiqar, F.; Ali, M.M.; et al. Screening of wheat (Triticum aestivum L.) genotypes for drought tolerance through agronomic and physiological response. Agronomy 2022, 12, 287. [Google Scholar] [CrossRef]
  58. Majid, K.; Roza, G. The effect of drought stress on leaf chlorophyll content and stress resistance in maize cultivars (Zea mays). Afr. J. Microbiol. Res. 2012, 6, 2844–2848. [Google Scholar]
  59. Canales, F.J.; Rispail, N.; Garcia, T.O.; Arbona, V.; Perez, L.A.; Prats, E. Drought resistance in oat involves ABA-mediated modulation of transpiration and root hydraulic conductivity. Environ. Exp. Bot. 2021, 182, 104333. [Google Scholar] [CrossRef]
  60. Changhai, S.; Baodi, D.; Yunzhou, Q.; Yuxin, L.; Mengyu, S.; Changhai, L.; Yuxin, L.; Lei, L.; Haipei, L. Physiological regulation of high transpiration efficiency in winter wheat under drought conditions. Plant Soil Environ. 2010, 56, 340–347. [Google Scholar] [CrossRef]
  61. Li, Y.; Li, H.; Li Zhang, S. Improving water-use efficiency by decreasing stomatal conductance and transpiration rate to maintain higher ear photosynthetic rate in drought-resistant wheat. Crop J. 2017, 5, 231–239. [Google Scholar] [CrossRef]
  62. Pirasteh-Anosheh, H.; Saed-Moucheshi, A.; Pakniyat, H.; Pessarakli, M. Stomatal responses to drought stress. In Water Stress and Crop Plants: A Sustainable Approach; Wiley Blackwell: Oxford, UK, 2016; Volume 1. [Google Scholar]
  63. Hughes, J.; Hepworth, C.; Dutton, C.; Dunn, J.A.; Hunt, L.; Stephens, J.; Waugh, R.; Cameron, D.D.; Gray, J.E. Reducing Stomatal Density in Barley Improves Drought Tolerance without Impacting on Yield. Plant Physiol. 2017, 174, 776–787. [Google Scholar] [CrossRef]
  64. Caine, R.S.; Yin, X.; Sloan, J.; Harrison, E.L.; Mohammed, U.; Fulton, T.; Biswal, A.K.; Dionora, J.; Chater, C.C.; Coe, R.A.; et al. Rice with reduced stomatal density conserves water and has improved drought tolerance under future climate conditions. New Phytol. 2019, 221, 371–384. [Google Scholar] [CrossRef]
  65. Raven, J.A. Speedy small stomata? J. Exp. Bot. 2014, 65, 1415–1424. [Google Scholar] [CrossRef] [PubMed]
Figure 1. (A) Shoot dry weight under well-watered and drought conditions, and (B) decrease in shoot biomass in response to drought stress. Data are presented as mean ± standard error. Different letters indicate a significant difference (p < 0.05).
Agriculture 14 00109 g001
Figure 2. (A) Root dry weight under well-watered and drought conditions, and (B) decrease in root dry weight in response to drought stress. Data are presented as mean ± standard error. Different letters indicate a significant difference (p < 0.05).
Agriculture 14 00109 g002
Figure 3. (A) Root-to-shoot ratio under well-watered and drought conditions, and (B) decrease in root-to-shoot biomass ratio in response to drought stress. Data are presented as mean ± standard error. Different letters indicate a significant difference (p < 0.05).
Agriculture 14 00109 g003
Figure 4. (A) Root length under well-watered and drought conditions, and (B) decrease in root length in response to drought stress. Data are presented as mean ± standard error. Different letters indicate a significant difference (p < 0.05).
Agriculture 14 00109 g004
Figure 5. (A) Root area under well-watered and drought conditions, and (B) decrease in root area in response to drought stress. Data are presented as mean ± standard error. Different letters indicate a significant difference (p < 0.05).
Agriculture 14 00109 g005
Figure 6. (A) Root volume under well-watered and drought conditions, and (B) decrease in root volume in response to drought stress. Data are presented as mean ± standard error. Different letters indicate a significant difference (p < 0.05).
Agriculture 14 00109 g006
Figure 7. Root images. (A) Gopher under control, (B) Gopher under drought, (C) Saddle under control, and (D) Saddle under drought.
Agriculture 14 00109 g007
Figure 8. (A) Relative water content under well-watered and drought conditions, and (B) decrease in relative water content in response to drought stress. Data are presented as mean ± standard error. Different letters indicate a significant difference (p < 0.05).
Agriculture 14 00109 g008
Figure 9. (A) Chlorophyll content under well-watered and drought conditions, and (B) decrease in chlorophyll content in response to drought stress. Data are presented as mean ± standard error. Different letters indicate a significant difference (p < 0.05).
Agriculture 14 00109 g009
Figure 10. (A) Stomatal conductance under well-watered and drought conditions, (B) Decrease in stomatal conductance content in response to drought stress. Data are presented as mean ± standard error. Different letters indicate a significant difference (p < 0.05).
Agriculture 14 00109 g010
Figure 11. (A) Stomata number under well-watered and drought conditions, and (B) decrease in stomata number in response to drought stress. Data are presented as mean ± standard error. Different letters indicate a significant difference (p < 0.05).
Agriculture 14 00109 g011
Figure 12. (A) Grain yield under well-watered and drought conditions, and (B) decrease in grain yield in response to drought stress. Data are presented as mean ± standard error. Different letters indicate a significant difference (p < 0.05).
Agriculture 14 00109 g012
Figure 13. Correlation matrix among root and shoot traits for ten oat genotypes grown under well-watered and drought conditions. Scatter plots are shown in the lower left quadrant, and values in the upper right quadrant are Pearson correlation coefficients. Significant codes: ‘***’ 0.001 ‘**’ 0.01 ‘*’ 0.05 ‘.’ 0.1.
Agriculture 14 00109 g013
Figure 14. Correlation matrix among root and shoot traits for ten oat genotypes grown under well-watered conditions. Scatter plots are shown in the lower left quadrant, and values in the upper right quadrant are Pearson correlation coefficients. Significant codes: ‘***’ 0.001 ‘*’ 0.05 ‘.’ 0.1.
Agriculture 14 00109 g014
Figure 15. Correlation matrix among root and shoot traits for ten oat genotypes grown under drought conditions. Scatter plots are shown in the lower left quadrant, and values in the upper right quadrant are Pearson correlation coefficients. Significant codes: ‘***’ 0.001 ‘**’ 0.01 ‘*’ 0.05 ‘.’ 0.1.
Agriculture 14 00109 g015
Figure 16. Correlation matrix for the correlation between drought tolerance indices and percent changes in traits in response to drought. Scatter plots are shown in the lower left quadrant, and values in the upper right quadrant are Pearson correlation coefficients. Significant codes: ‘***’ 0.001 ‘**’ 0.01 ‘*’ 0.05 ‘.’ 0.1.
Agriculture 14 00109 g016
Table 1. Drought tolerance indices (DTI) of ten oat genotypes evaluated under control and drought stress conditions.
GenotypeStress Tolerance IndexYield IndexDrought Resistance IndexYield Stability IndexMean DTI
Checota0.701.050.460.670.72
Clintford0.390.810.380.710.57
Deon0.941.120.410.560.76
Goliath0.921.090.390.540.74
Gopher0.320.720.320.690.51
Hayden1.141.440.730.781.02
Kame0.591.000.470.720.70
MN Pearl0.761.140.540.730.79
Saddle0.500.800.280.540.53
SD1403270.470.820.330.620.56
Disclaimer/Publisher’s Note: The statements, opinions and data contained in all publications are solely those of the individual author(s) and contributor(s) and not of MDPI and/or the editor(s). MDPI and/or the editor(s) disclaim responsibility for any injury to people or property resulting from any ideas, methods, instructions or products referred to in the content.

