Article

Advancing Early Fault Diagnosis for Multi-Domain Agricultural Machinery Rolling Bearings through Data Enhancement

1
School of Mechanical Electrical and Vehicle Engineering, East China Jiaotong University, Nanchang 330013, China
2
State Key Laboratory of Performance Monitoring Protecting of Rail Transit Infrastructure, East China Jiaotong University, Nanchang 330013, China
*
Author to whom correspondence should be addressed.
Agriculture 2024, 14(1), 112; https://doi.org/10.3390/agriculture14010112
Submission received: 6 December 2023 / Revised: 29 December 2023 / Accepted: 8 January 2024 / Published: 10 January 2024

Abstract

:
In the context of addressing the challenge posed by limited fault samples in agricultural machinery rolling bearings, especially when early fault characteristics are subtle, this study introduces a novel approach. The proposed multi-domain fault diagnosis method, anchored in data augmentation, aims to discern early faults in agricultural machinery rolling bearings, particularly within an imbalanced sample framework. The methodology involves determining early fault signals throughout the life cycle, constructing early fault datasets with varying imbalance rates for different fault types, and subsequently employing the Synthetic Minority Oversampling Technique (SMOTE) to balance the fault data. The study then extracts relative wavelet packet energy and time-domain sensitive features (variance, peak to peak) from the original and generated fault data to form a multi-domain fault feature vector. This vector is utilized for fault state recognition using a Support Vector Machine (SVM). Evaluation metrics such as accuracy, recall, and F1 values assess the recognition effectiveness for each rolling bearing state, with the overall model recognition evaluated based on accuracy. The proposed method is rigorously analyzed and validated using the XJTU-SY rolling bearing accelerated life test dataset. Comparative analysis is conducted with non-data enhanced fault feature vectors, specifically the relative energy of the wavelet packet, both with and without time-domain features. Experimental results underscore the superior performance of multi-domain fault features in providing a comprehensive description of signal information, leading to enhanced classification performance. Furthermore, the study demonstrates improved classification accuracy and recall rates for the balanced dataset compared to the imbalanced dataset. This research significantly contributes to an effective identification method for the early fault diagnosis of small sample rolling bearings in agricultural machinery.

1. Introduction

In the 21st century, global concerns over food security and environmental preservation have escalated. Agricultural mechanization, integral to the entire production process, ensures the production of high-quality food [1]. Notably, during grain production and harvesting, agricultural machinery operates at high intensity, posing potential health risks [2]. Machinery reliability issues not only result in a decline in production efficiency but also pose significant safety hazards, putting agricultural practitioners at potential risk. Through thorough and extensive research, it has been revealed that injuries caused by agricultural machinery are widespread [3]. The consistently high rates of injuries in agricultural activities are a matter of global concern [4]. In this context, acquiring a deeper understanding of the inherent threats posed by mechanical reliability issues in agricultural machinery is imperative. This understanding serves as a crucial foundation for ensuring that agricultural activities are not only efficient but, more importantly, safe for those involved. Consequently, the field of agricultural machinery fault diagnosis is gaining heightened attention [5]. Bearings, as extensively used components in agricultural machinery, face challenges due to their intricate working conditions, often leading to damage [6]. Furthermore, the early fault signals of rolling bearings exhibit a low signal-to-noise ratio, with weak fault characteristics. Neglecting timely detection of early bearing faults can result in substantial losses and, in severe cases, even casualties [7]. Therefore, the prompt diagnosis of bearing faults holds paramount importance in ensuring the efficient operation of agricultural machinery equipment.
The prevailing methods for diagnosing faults in agricultural machinery predominantly rely on balanced datasets. The key procedures involve extracting signal features—encompassing time-domain, frequency-domain, and time-frequency domain features—selecting suitable classifier algorithms to categorize these features, and ultimately diagnosing the operational status of the equipment. In a study by Li et al. [8], permutation entropy (PE) was employed for feature extraction, and vector machines and random forest classification models were utilized for recognizing tractor statuses. Zhao et al. [9] proposed a fault diagnosis method for green feed corn harvester headers, combining the response surface method with artificial neural networks. Extensive research has been dedicated to fault diagnosis within the agricultural domain. Choe et al. [10] devised and implemented a system leveraging recurrent neural network algorithms to detect and predict abnormal data. They incorporated ontology technology for fault diagnosis, aiming to prevent potential farm damage caused by errors, malfunctions, and aging-related downtime. Liu et al. [11] introduced a fault diagnosis method based on Time Association Rule Mining (TARM) to identify clogging faults in threshing drums. Wang et al. [12] employed BP neural networks and convolutional neural networks for fault diagnosis of HMCVT hydraulic systems, offering valuable insights into the reliability of hydraulic CVT shifting. In a distinctive approach, Hao et al. [13] established a vibration system model for the threshing drum. They conducted vibration signal testing on the slipping and blockage of the threshing drum under belt transmission mode using a multi-stage threshing drum vibration test bench. The research outcomes disclosed the vibration characteristics of the threshing drum under various abnormal working conditions, serving as a theoretical foundation for combine harvester threshing drum fault diagnosis. Despite the extensive research, it is noteworthy that the current landscape lacks substantial exploration in small sample data and early fault diagnosis.
In practical applications, the abundance of normal data far exceeds that of fault data, leading to imbalanced datasets [14]. Applying methods designed for balanced datasets to imbalanced ones often yields high recognition rates for normal samples but struggles with recognizing minority classes, particularly fault samples [15]. Given the significance of effectively identifying fault samples in fault diagnosis, enhancing the classification accuracy of these samples has become a key focus in current research [16]. Current efforts in fault diagnosis of imbalanced data primarily center around two aspects [17]:
(1) Improving Classification Algorithms: Cost-sensitive methods bias classifiers toward minority classes, prioritizing effective identification of fault samples.
Ensemble classification methods integrate results from multiple weak classifiers, aiming to achieve high classification accuracy by leveraging diverse perspectives.
(2) Data Preprocessing: Sampling methods and adversarial networks are employed in data preprocessing to balance minority and majority class data, addressing the challenges posed by imbalanced datasets.
In the realm of enhancing classification algorithms, the challenge lies in appropriately assigning weights to different sample types, making data preprocessing a more prevalent focus in most studies [18]. One notable technique in this domain is the Synthetic Minority Oversampling Technique (SMOTE), introduced by Chawla et al. [19]. SMOTE aims to address imbalances by oversampling minority samples. For instance, Fan Yuqiang et al. successfully employed SMOTE to balance fault samples in chillers, enabling a model initially designed for diagnosing faults in centrifugal chillers to effectively diagnose faults in screw chillers. Another approach, as demonstrated by Qi et al. [20], involved using a combination of the Tomek link removal algorithm and SMOTE to augment the number of minority class samples. This strategy proved effective in diagnosing transformer faults using a BP neural network.
Building upon the insights discussed earlier, this article introduces a novel approach for early fault diagnosis of multi-domain rolling bearings, leveraging the power of data augmentation. The proposed method follows a three-step process: (1) Data augmentation using SMOTE: Employing the Synthetic Minority Oversampling Technique (SMOTE) to augment early fault data in rolling bearings under fault conditions. This step aims to rebalance the imbalanced dataset, transforming it into a more equitable and representative balanced dataset. (2) Feature extraction: Extracting fault feature vectors from the balanced dataset by capturing both relative wavelet packet energy and time-domain features. These feature vectors serve as crucial indicators for the early fault diagnosis of rolling bearings. (3) Classification using SVM: Utilizing the SVM classifier to categorize the proposed fault feature vectors, enabling an effective and accurate diagnosis of early faults in rolling bearings.
Experimental results from comparative analyses demonstrate the effectiveness and superiority of the proposed method for the early fault diagnosis of rolling bearings, particularly when dealing with unbalanced data. This innovative approach holds promise for enhancing the reliability and efficiency of fault diagnosis in multi-domain rolling bearings. Furthermore, this research zeroes in on small sample data and early fault diagnosis—areas seldom explored in other studies on agricultural machinery failures. Nevertheless, this research holds substantial practical value for agricultural equipment. Given the scarcity of data on mechanical failures, an early diagnosis of faults can prove instrumental in mitigating potential losses.

2. Basic Principles

2.1. Basic Principles of SMOTE

SMOTE, an advanced algorithm building upon Random Oversampling (ROS), distinguishes itself by addressing the limitations of ROS. While ROS simply replicates minority class samples for data augmentation, SMOTE takes a more sophisticated approach. It inserts new sample points between existing minority class samples and their adjacent points, effectively mitigating the overfitting issues associated with ROS. This innovative technique seamlessly integrates synthesized minority class data with the original dataset, creating a more robust set of faulty data.
The procedural steps of the SMOTE algorithm are as follows:
(1)
Distance Calculation:
Utilizing Euclidean distance as the metric, calculate the distance from each sample point in the minority class to other points within the minority class dataset. Identify the k-nearest neighbors for each sample.
(2)
Sampling Rate Determination:
Establishing the sampling rate for the minority class based on the imbalance rate of the samples. Randomly selecting several samples from the k-nearest neighbors of each minority class sample.
(3)
New Sample Generation:
Generating a new sample point for the neighboring samples of each sample point, according to the specified equation. This process contributes to the creation of a more diverse and balanced dataset for improved model training and performance.
x n e w = x + r a n d ( 0 , 1 ) ( x j x )
In this context, where x represents a sample point in the imbalanced fault dataset, and xj is the jth neighboring sample of x (with j taking values of 0, 1,…, N), the SMOTE algorithm generates a new sample point xnew through oversampling. The generation process is determined by a randomly generated number, Rand(0,1), falling between 0 and 1. The final step involves merging the newly generated minority class sample set with the original imbalanced dataset. This integration results in the creation of a balanced dataset, ensuring a more equitable representation of both minority and majority class samples.

2.2. Relative Wavelet Packet Energy

Wavelet packet decomposition is characterized by its excellent time-frequency characteristics, enabling the simultaneous decomposition of both high-frequency and low-frequency components within a signal. This feature enhances the signal’s overall time-frequency analysis capability. Using the example of a three-layer wavelet packet decomposition, Figure 1 illustrates the structural diagram depicting the decomposition of the original signal through wavelet packet analysis. This method provides a comprehensive view of the signal’s frequency components at different scales, contributing to a more detailed and nuanced analysis.
In the figure, the notation is as follows: L represents the low-frequency component, H represents the high-frequency component, and 1, 2, and 3 represent the components obtained from the 1st, 2nd, and 3rd decomposition, respectively.
When applying the N-layer wavelet packet decomposition to the signal for processing, it yields 2N components. The energy of each component obtained in this decomposition is:
E j = k | C j ( k ) | 2
Among them, j = 0 , 1 , , 2 N 1 , C j ( k ) is the k-th wavelet packet coefficient corresponding to the j-th component after wavelet packet decomposition.
The total energy E1 of each component under the decomposition of this layer is obtained as follows:
E 1 = E j
Finally, the relative wavelet packet energy ρ j of each component is obtained as:
ρ j = E j E 1

2.3. Evaluation Indicators

Fault diagnosis in imbalanced datasets fundamentally involves the classification of such imbalanced data [21]. In practical engineering applications, the emphasis on the accurate diagnosis of minority class samples surpasses that of majority class samples [22]. Consequently, this article places primary focus on the classification performance of classifiers concerning minority classes, with overall classification performance considered subsequently.
In fault diagnosis on balanced datasets, fault accuracy typically serves as the evaluation metric. However, in imbalanced datasets, where the proportion of minority class samples is small, its impact on the overall recognition rate is limited. Consequently, relying solely on recognition rate is deemed unreasonable for assessing diagnostic model performance. Drawing inspiration from references [1,18,22], this article adopts a multi-classification evaluation index based on the confusion matrix. The chosen classifier evaluation metrics include precision, recall, and F1 score for assessing the classification performance of minority class samples. Additionally, the recognition rate is employed to gauge the overall classification performance of the classifier. Equations (5)–(8) outline the corresponding calculation formulas for these indicators.
p r e c i s i o n = T P T P + F P
r e c a l l = T P T P + F N
F 1 = 2 1 p r e c i s i o n + 1 r e c a l l = 2 × p r e c i s i o n × r e c a l l p r e c i s i o n + r e c a l l
a c c u r a c y = T P + T N T P + T N + F N + F P
In this context, the evaluation metrics for classifier performance are defined as follows: TP (True Positive) signifies the number of correctly recognized minority class samples, FP (False Positive) indicates the number of samples that mistakenly identify the majority class as the minority class, FN (False Negative) represents the number of samples that erroneously identify minority classes as majority classes, and TN (True Negative) denotes the number of correctly identified majority class samples. These metrics serve as crucial elements in assessing the effectiveness of classifiers, particularly in the context of imbalanced datasets.

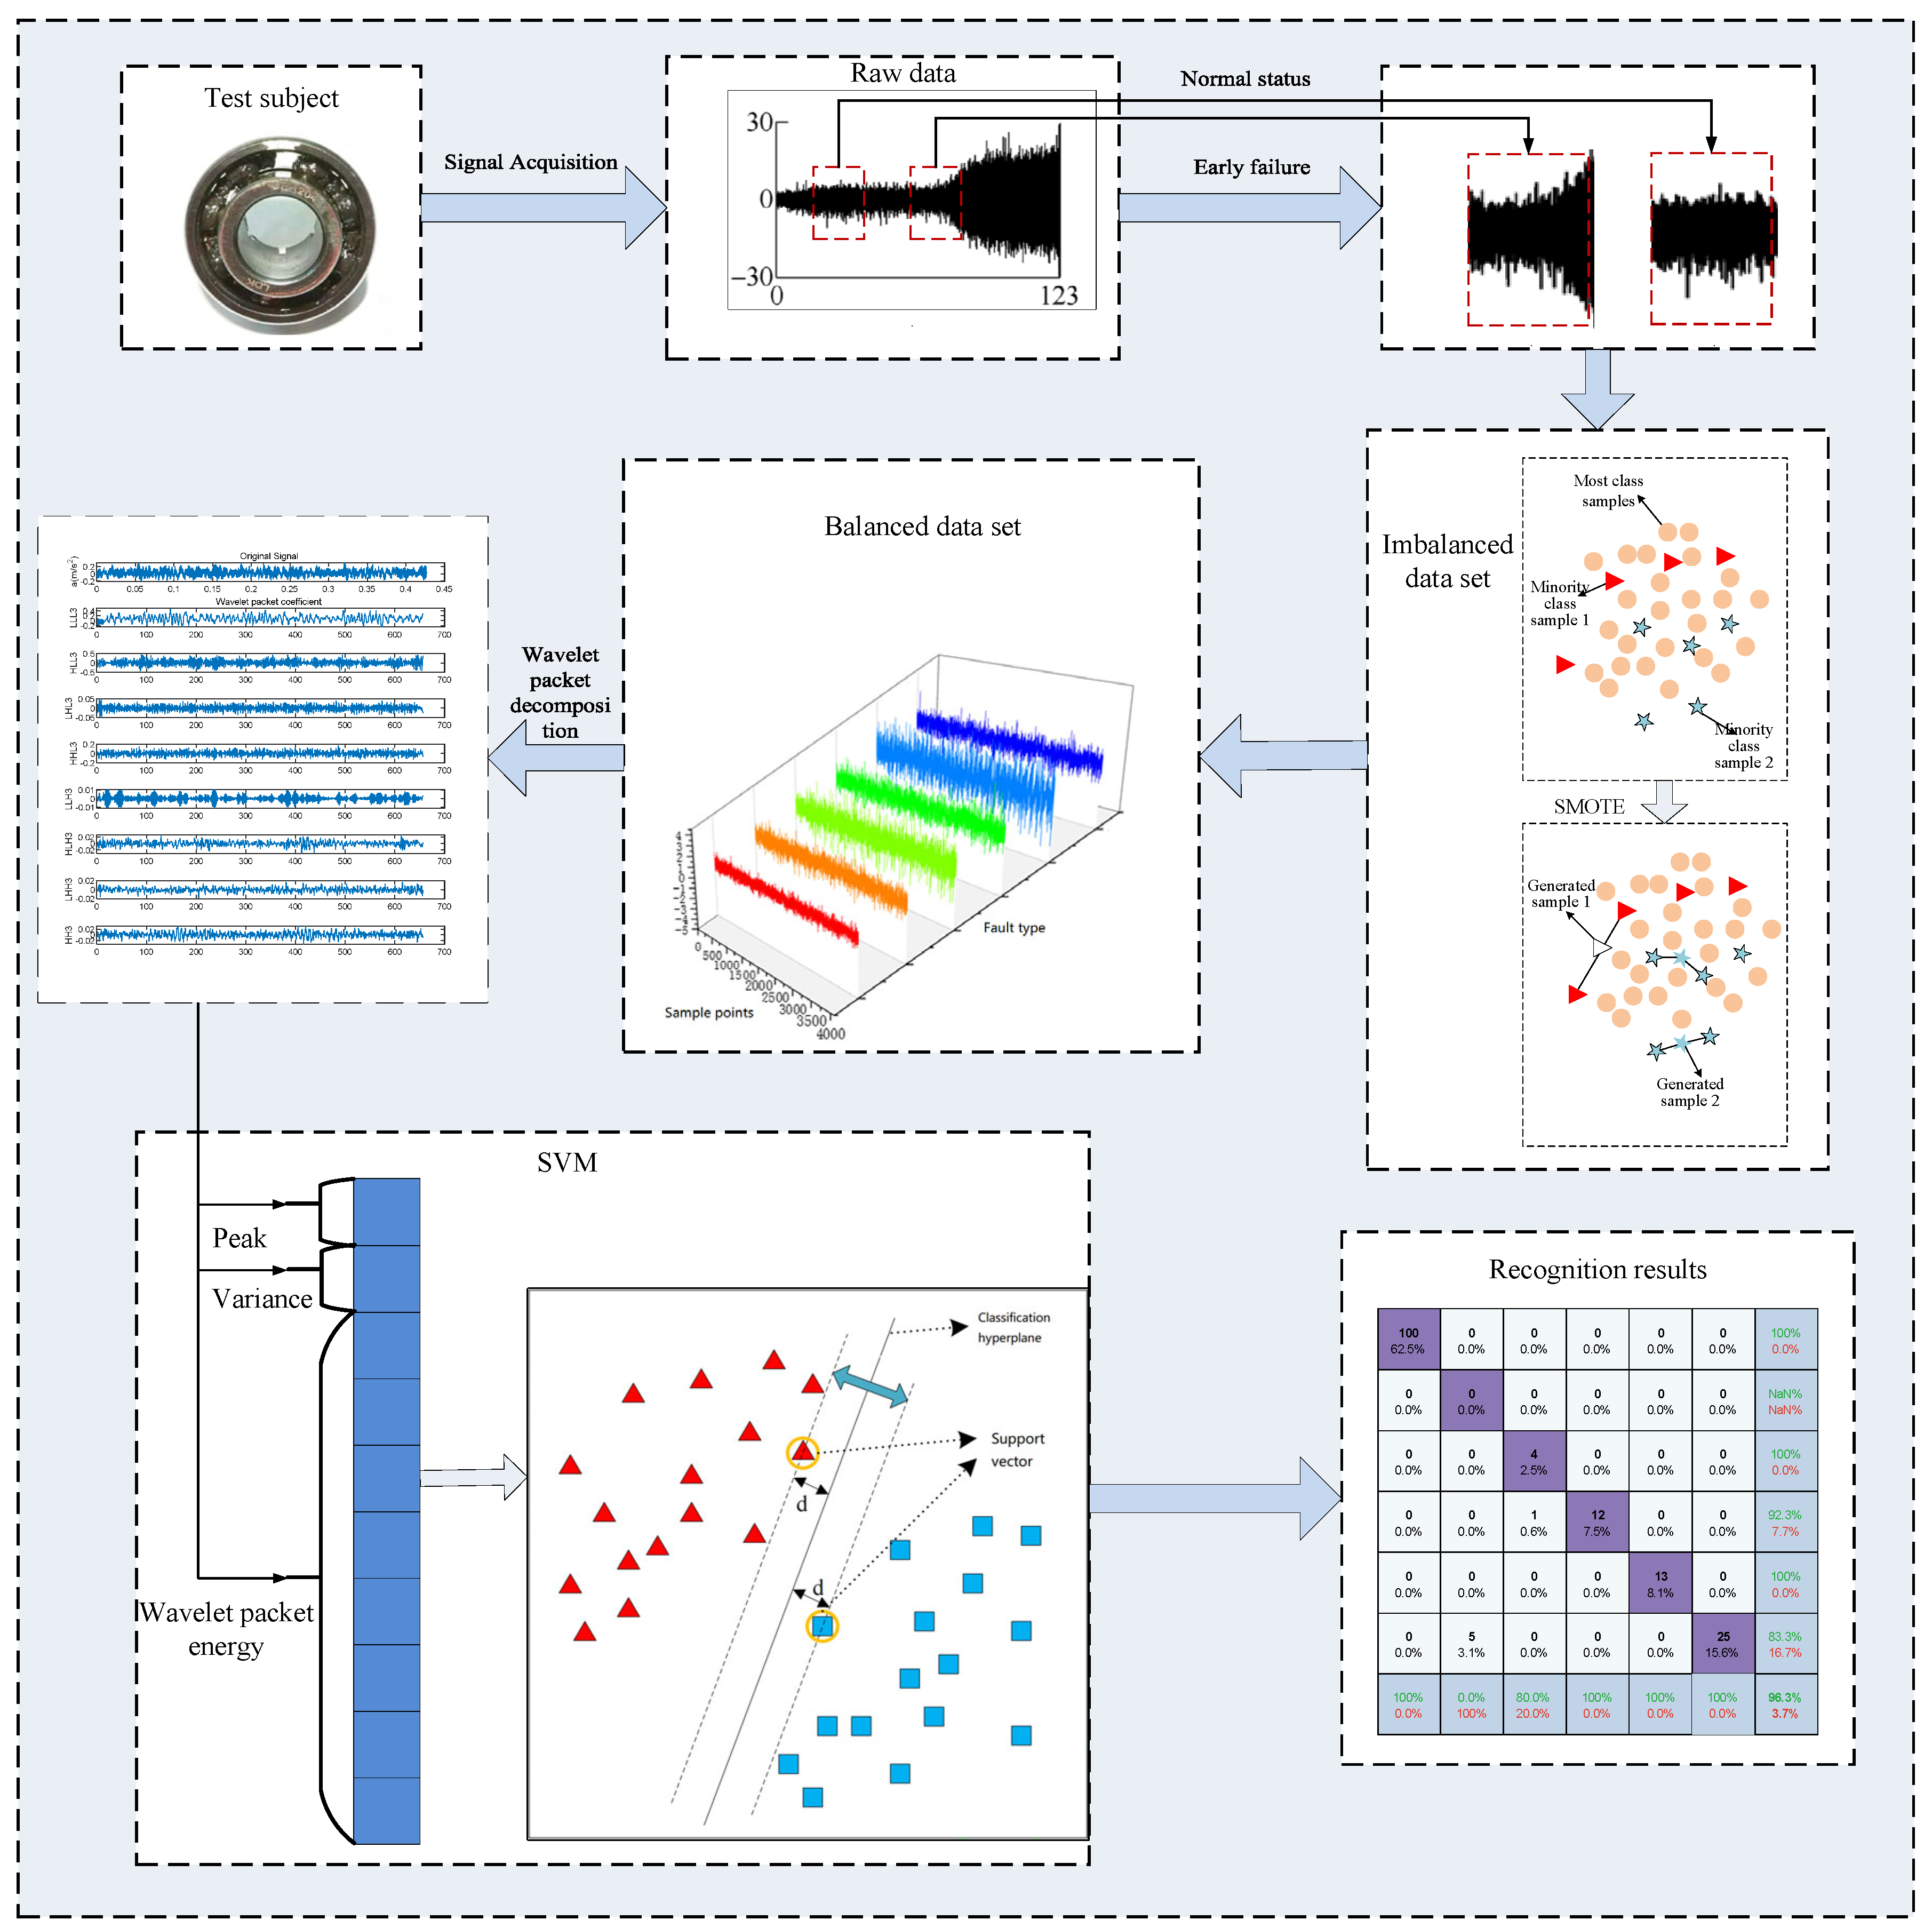
3. Advanced Early Fault Diagnosis Method for Agricultural Machinery Rolling Bearings

This article introduces a novel early fault diagnosis method for rolling bearings utilizing data augmentation. The accompanying Figure 2 illustrates the comprehensive flowchart of this innovative approach, which involves the following specific steps:
(1) Identify early fault signals from vibration signals spanning the entire life cycle of rolling bearings.
(2) Establish imbalanced datasets representing various fault types with distinct imbalanced rates (Q), as Table 1 outlines. The number of sample groups for normal data is set at 200.
Q = F M
In this context, F represents the number of groups containing faulty samples, while M represents the number of groups comprising normal samples.
(3) Employ SMOTE to rectify the imbalance within the constructed dataset.
(4) Extract essential time-domain features, such as peak and variance, alongside relative wavelet packet energy from the now balanced dataset as fault feature vectors.
(5) Split the fault feature vectors obtained in (4) into two sets: 50% for training the SVM model and the remaining 50% for testing. Finally, output the operational status of rolling bearings based on the test set data. This step ensures a comprehensive evaluation of the proposed method’s efficacy in diagnosing early faults in rolling bearings.

4. Experimental Platform and Experimental Analysis

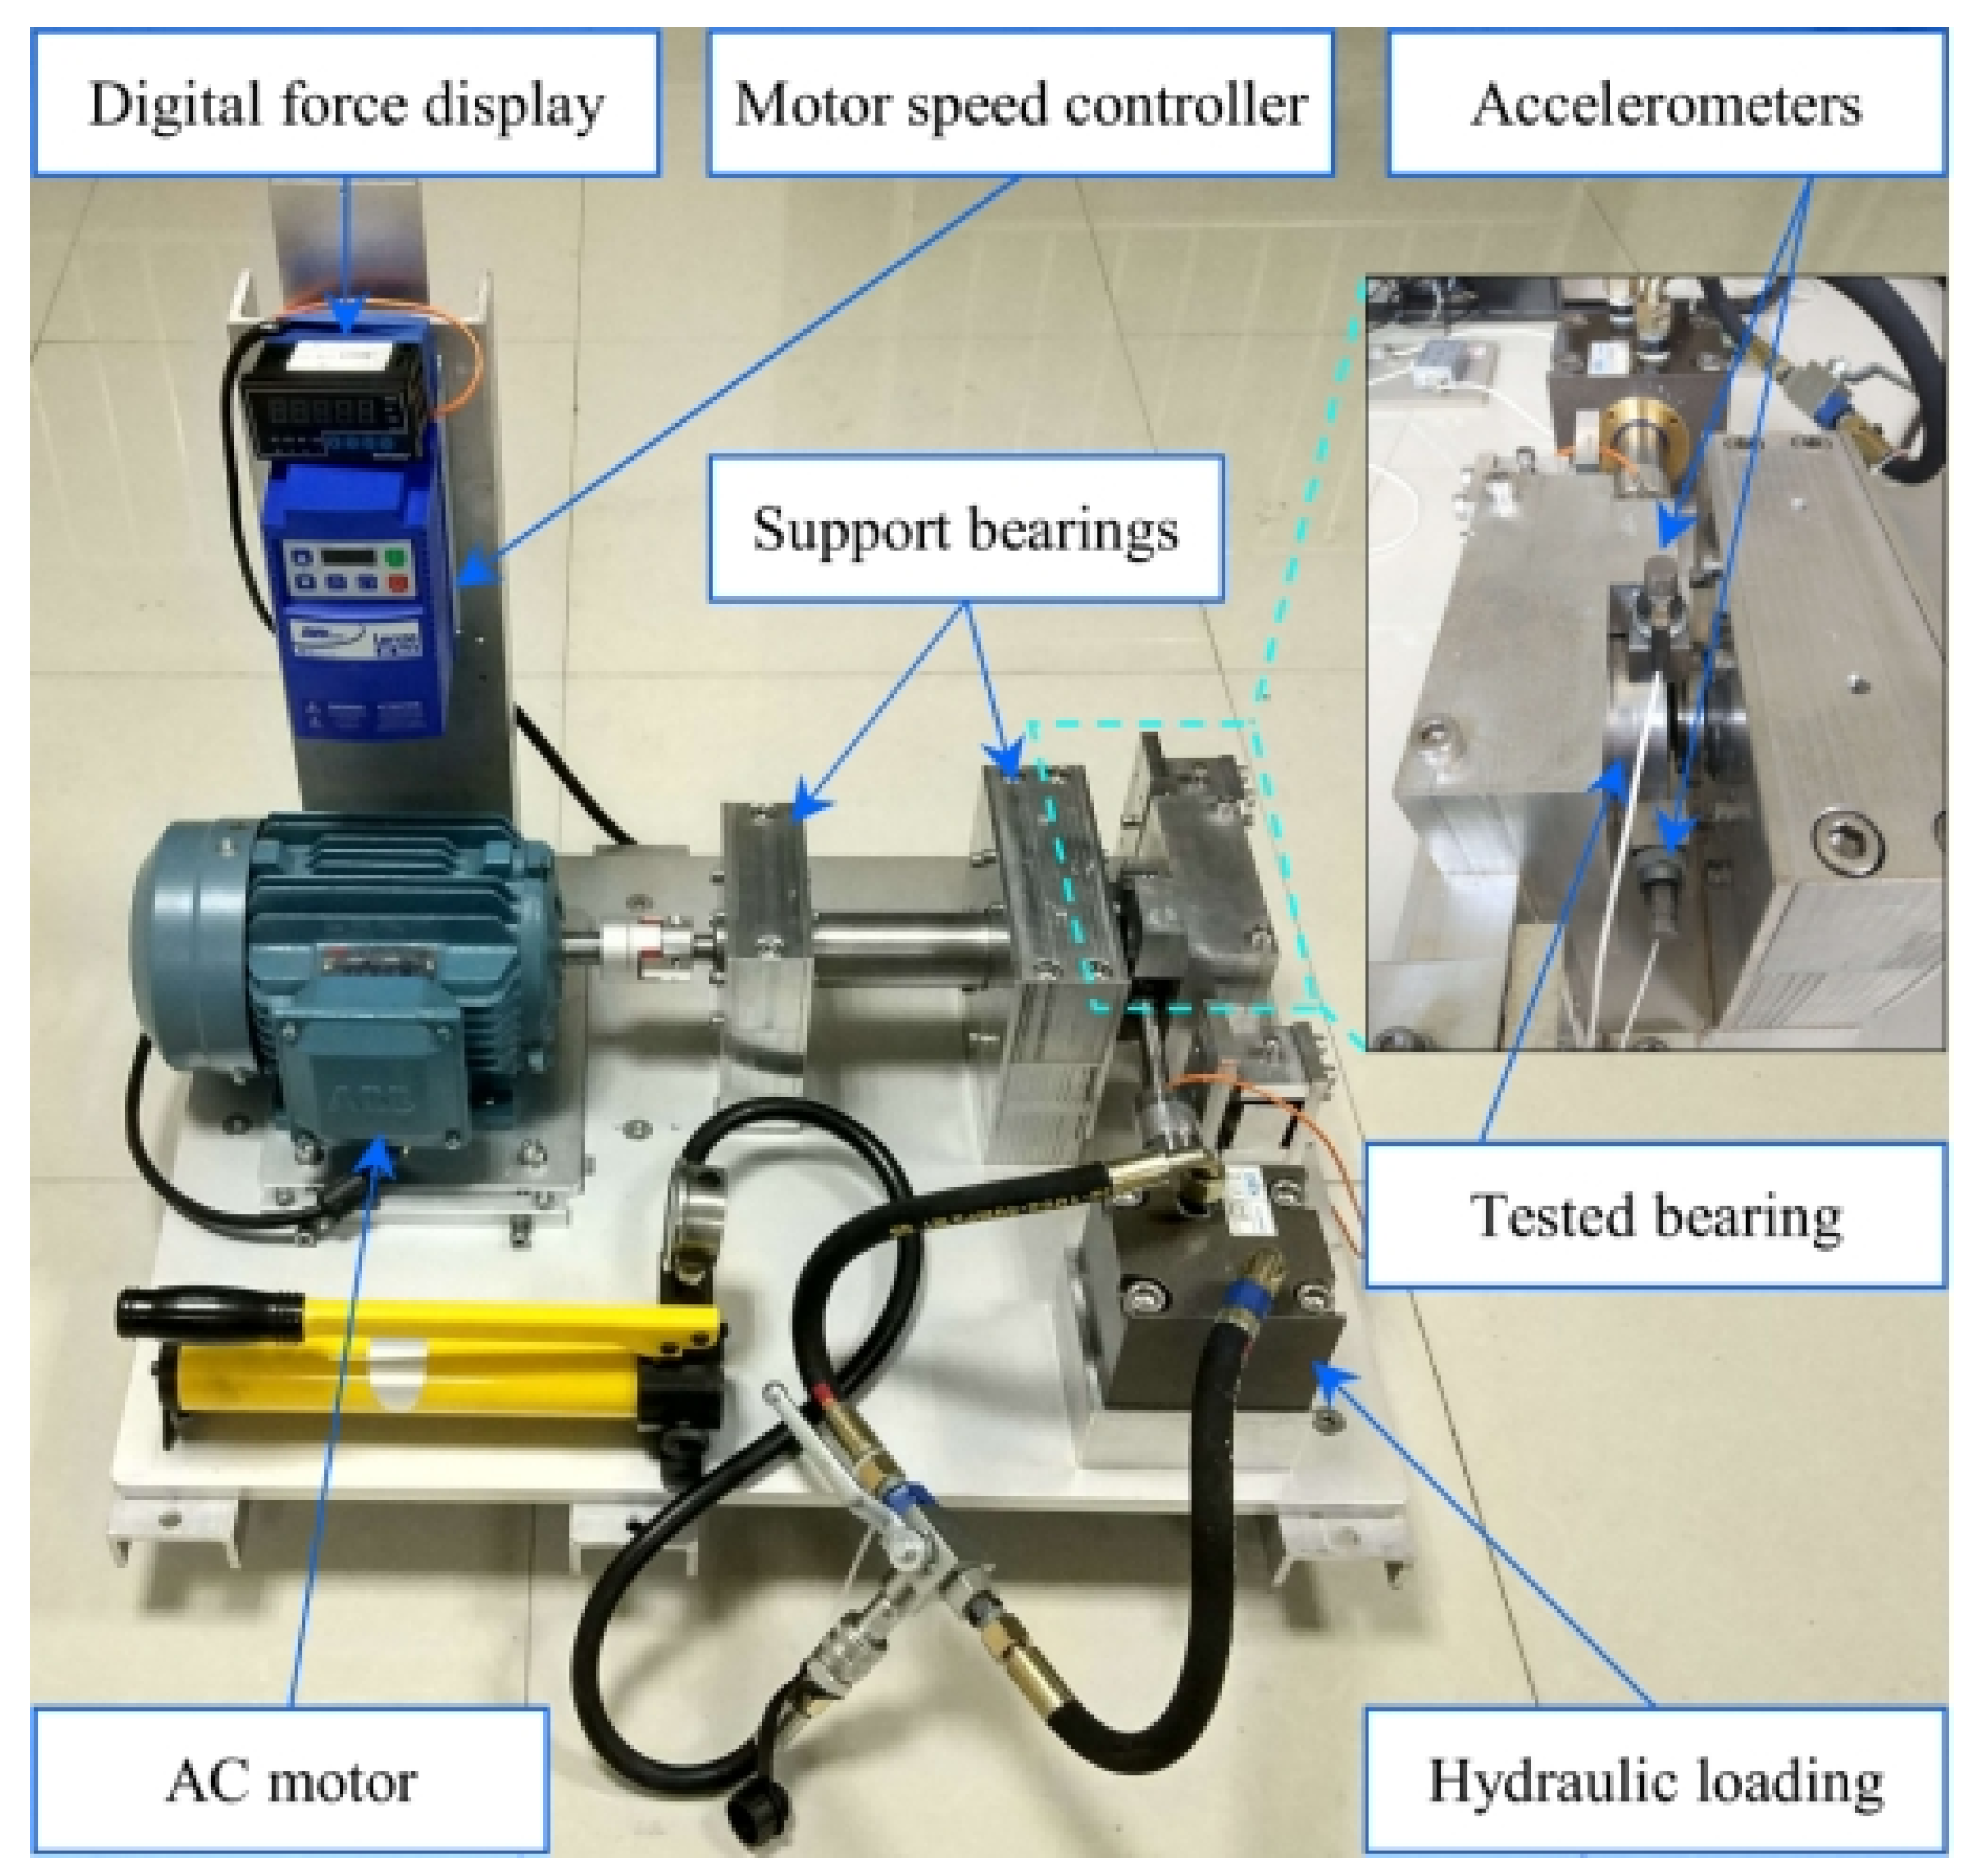
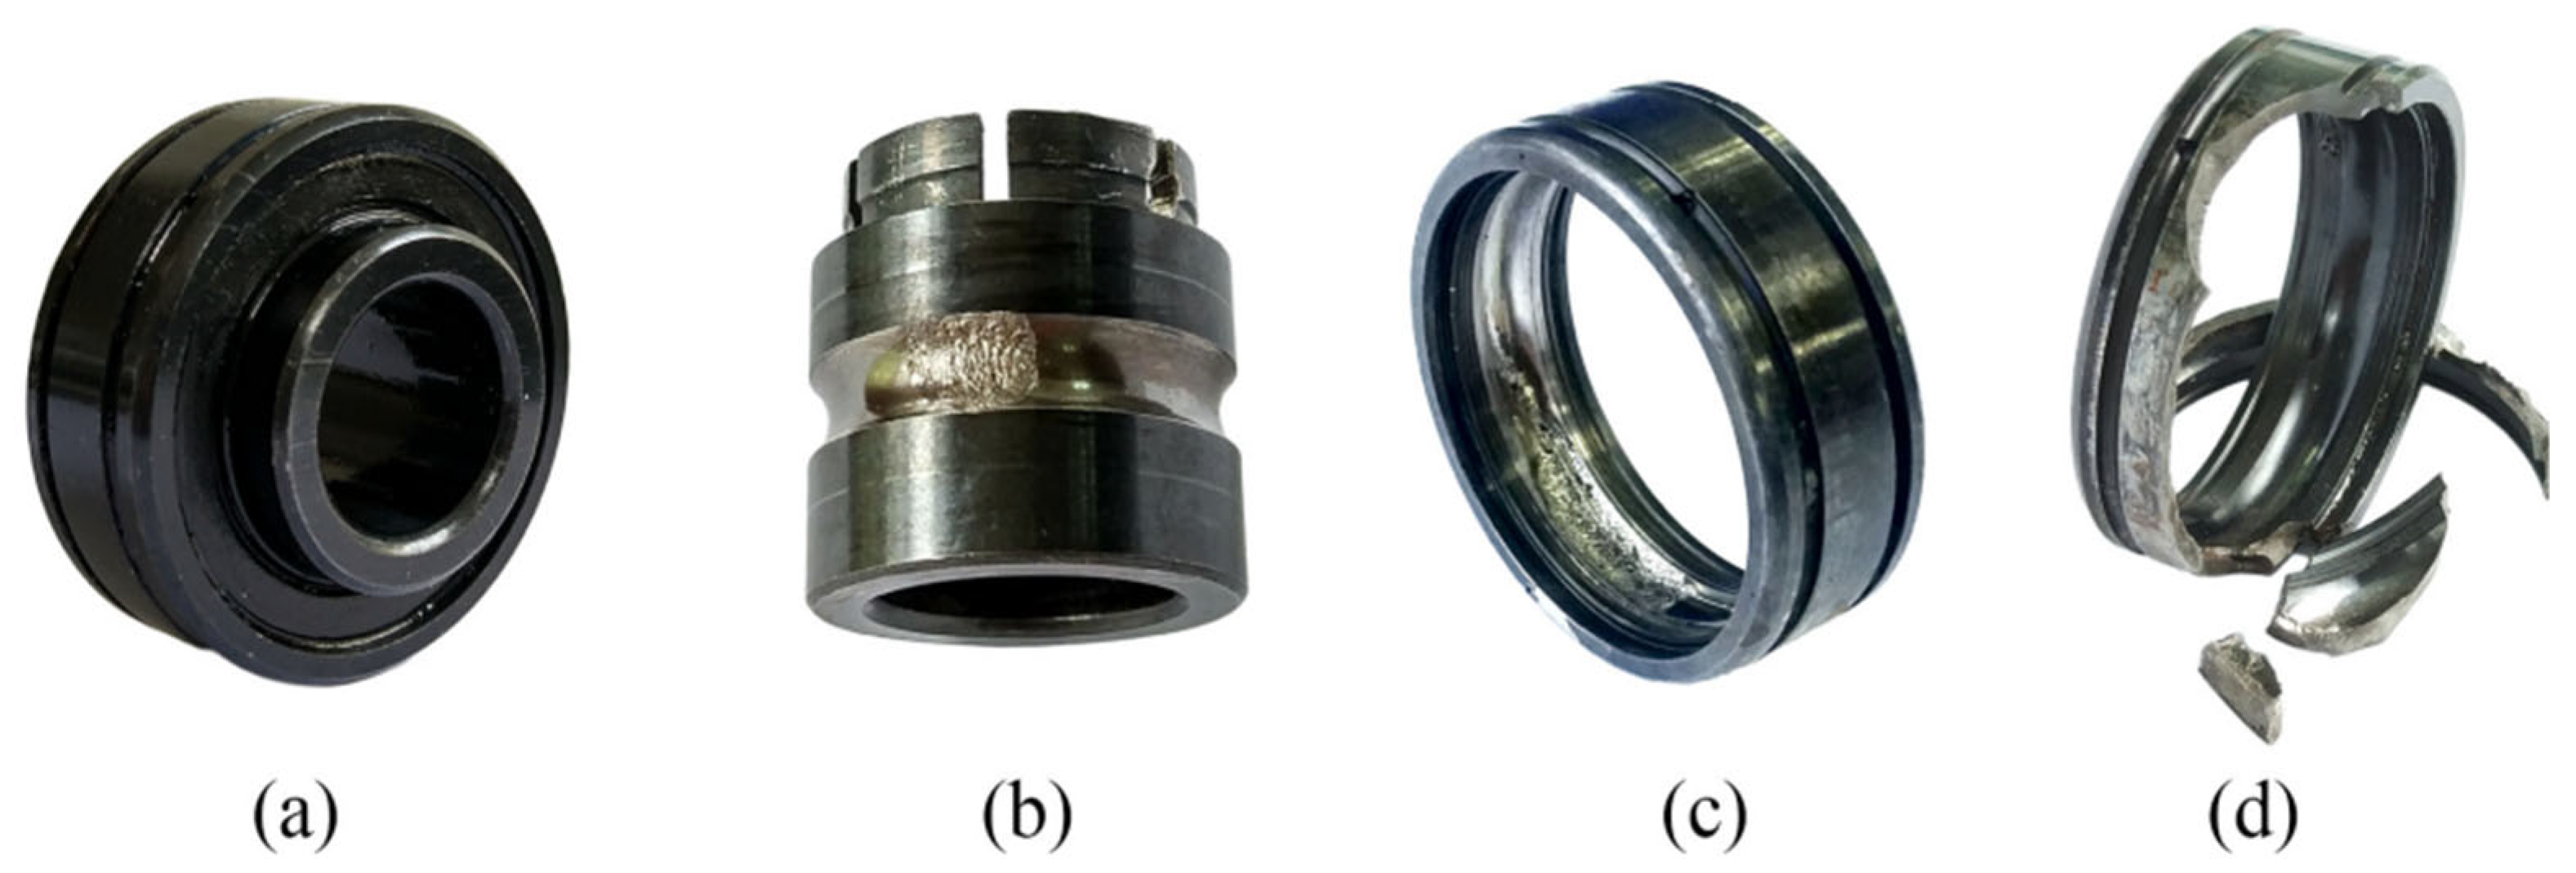
4.1. Experimental Platform

To confirm the efficacy of this study’s proposed method for early fault diagnosis of rolling bearings with unbalanced datasets, this section discusses the rolling bearing full life cycle dataset collected in the literature [23] for verification and elucidation. The platform enables the collection of comprehensive monitoring data throughout the entire life cycle of the test bearings. Figure 3 illustrates the composition of the experimental setup. The platform comprises AC motors, motor speed controllers, rotating shafts, support bearings, hydraulic loading systems, and test bearings. It is designed for conducting accelerated life tests on various rolling or sliding bearings under diverse working conditions, allowing for comprehensive monitoring of the test bearings’ complete life cycle data. The adjustable working parameters of the test platform primarily encompass radial force and rotational speed. The hydraulic loading system generates radial force, applying it to the bearing seat of the test bearing. Meanwhile, the rotational speed is precisely set and adjusted through the AC motor’s rotational speed controller. The experiment’s sampling frequency was 25.6 KHZ, with a 1 min sampling interval; each sampling lasted 1.28 s.
Table 2 outlines the details of the data used in this experiment. The early fault signal was selected from the initial fault signal of the dataset in Table 2. The rolling bearing’s normal operation data were extracted from the Bearing2_1 dataset, encompassing six operating states. Figure 4 illustrates the test bearings’ diverse health states, providing specific details for each fault.
In the pursuit of thorough data analysis, Figure 5 attempts to depict the time-domain signals associated with the six states of the bearing.
Figure 5 reveals subtle changes in the time-domain indicator waveform diagrams between the bearing damage state and the bearing normal state. Despite these changes, the contrast may not be immediately evident. To enhance signal differentiation, the approach of segmenting every 4096 data points from the collected time-domain vibration signals has been employed. Figure 6 illustrates the extraction of 10 features, including variance, peak value, and wavelet packet energy from these segments for a more nuanced analysis.
In Figure 6, the distinctive distribution of vibration signal characteristics for a faulty bearing is clearly discernible compared to the characteristic distribution of the normal state. Moreover, notable differences exist among the characteristics of various fault groups, primarily attributed to variations in the degree of fault at each point. While the 10 characteristics provide an initial understanding of the relationship with bearing failure, determining the specific type of vibration bearing failure requires further identification. The utilization of an SVM model becomes imperative for a more precise classification in this regard.
The model was trained on an 11th Gen Intel(R) Core(TM) [email protected] GHz with 16 GB of memory, using Matlab R2020a as the training software. The SVM model parameters were configured as follows: SVM type (s) is set to 0 (C-SVC), kernel type (t) is set to 0 (linear), and other parameters are left at their default values. Training samples were input into the SVM model for training, resulting in the acquisition of a trained SVM model. Subsequently, test samples were input into the trained SVM model to obtain recognition results. Correct identification is determined when the actual label output by the model matches the predicted label for the same sample; otherwise, the identification is deemed unsuccessful.

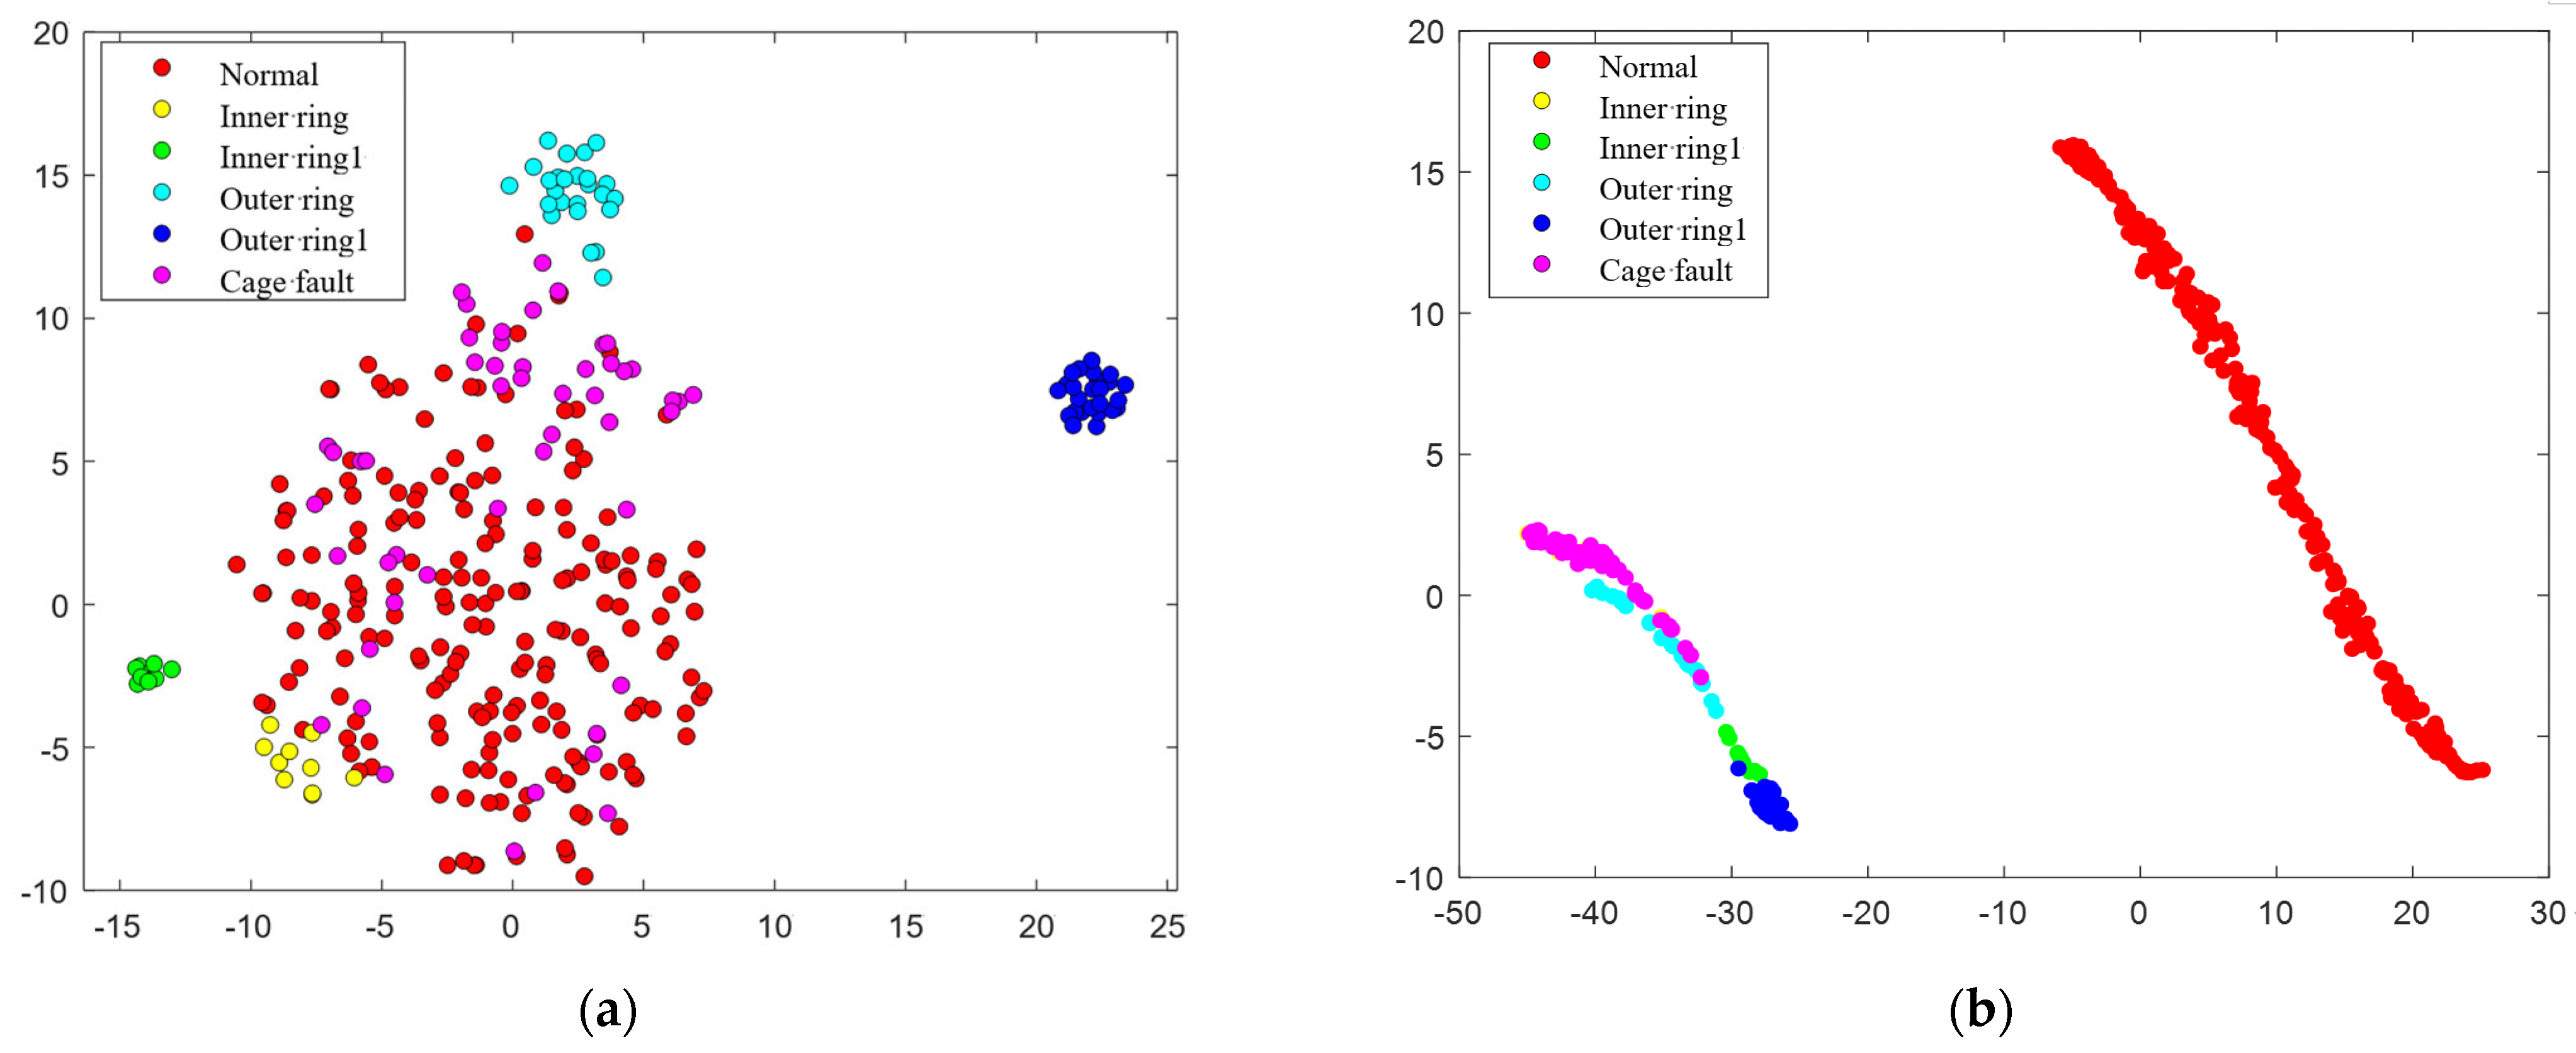
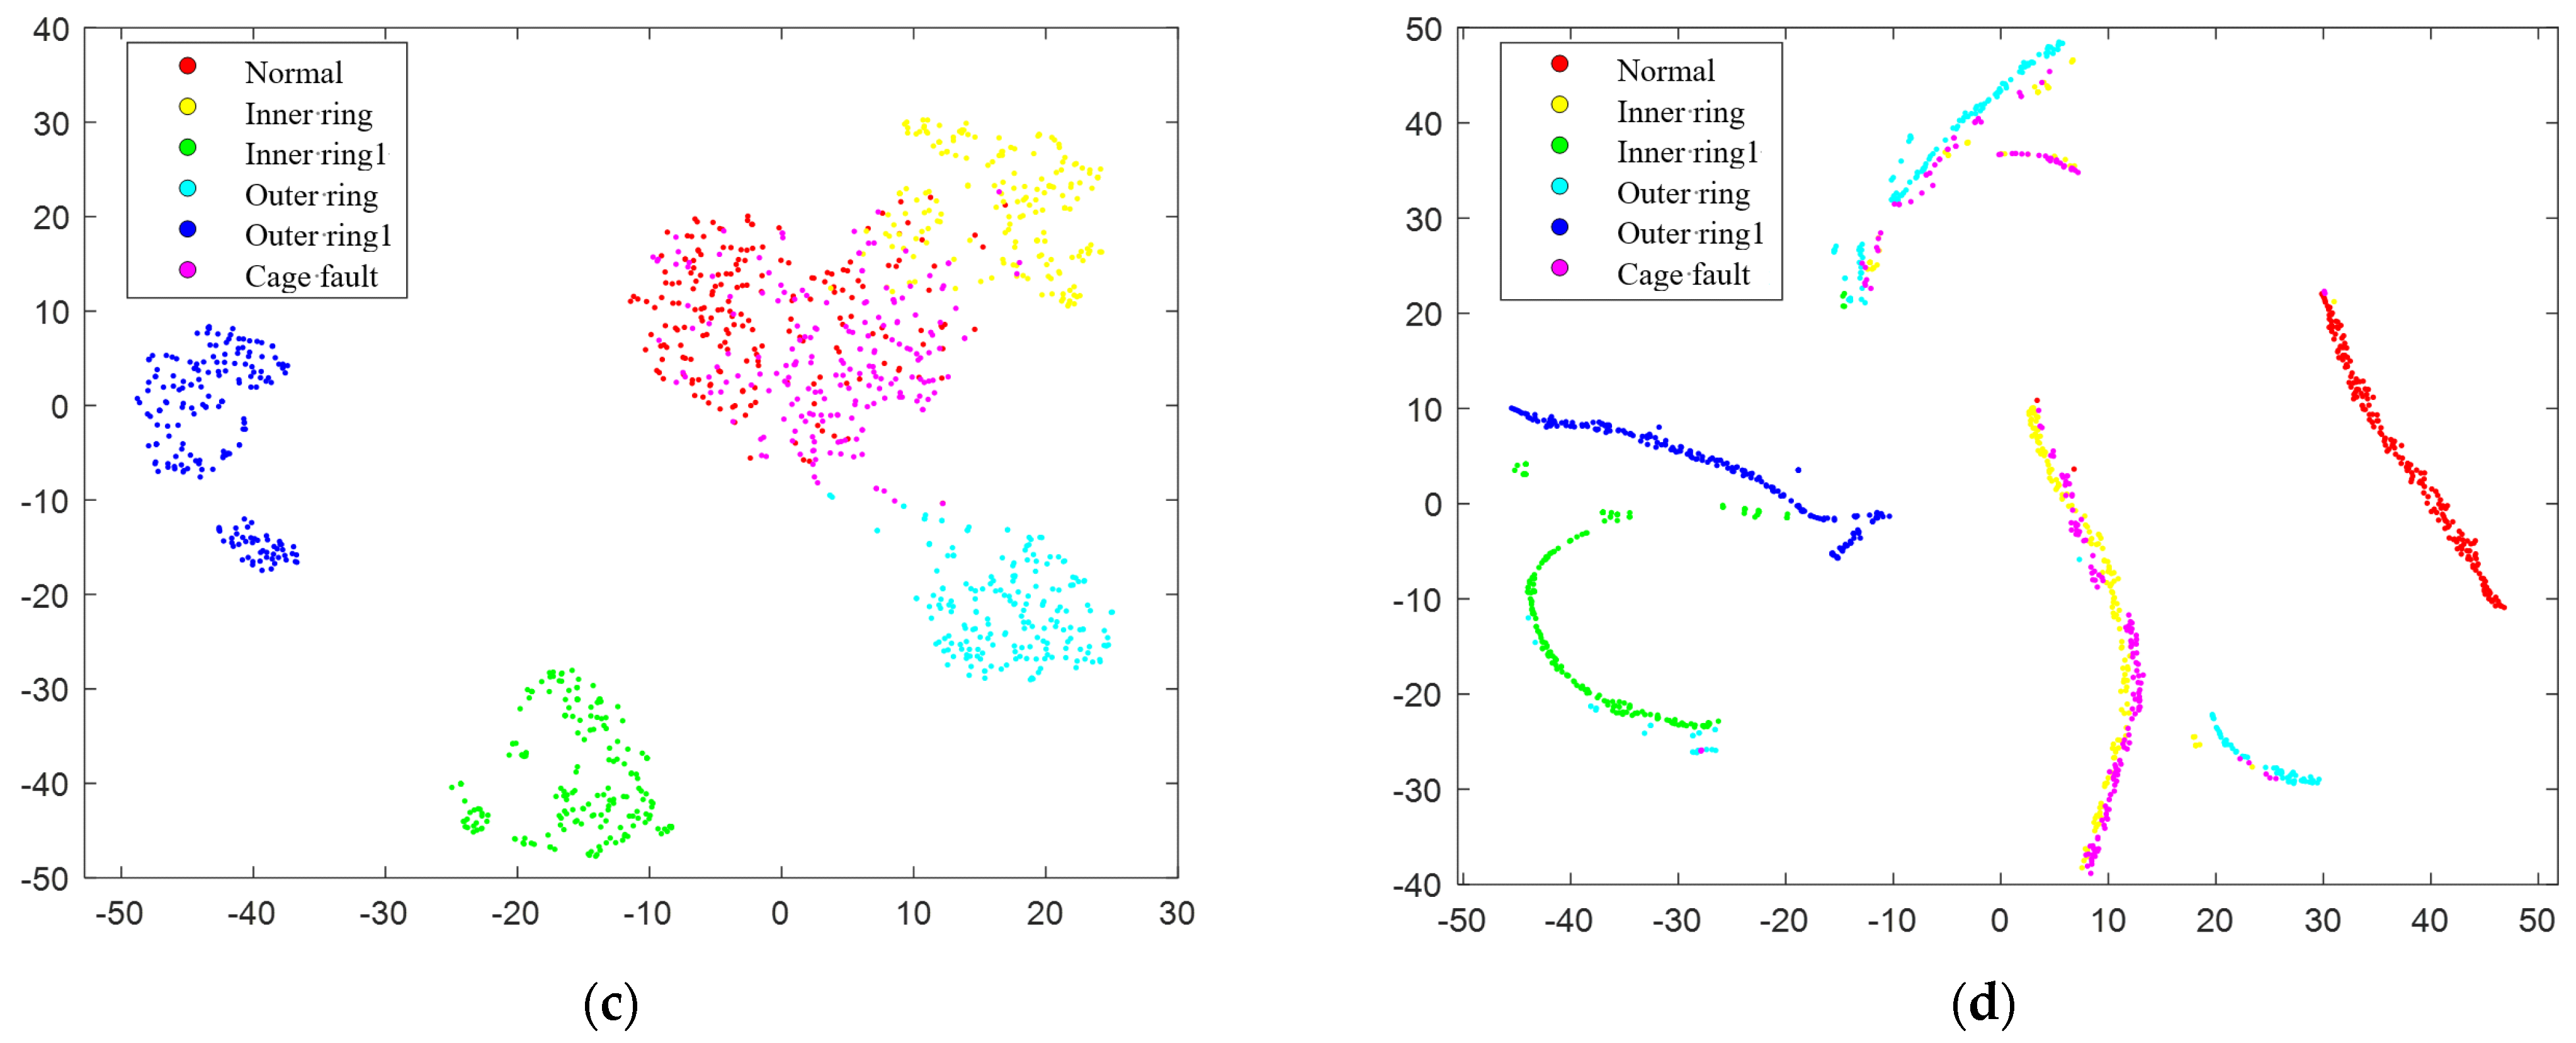
4.2. Refinement of Experimental Data Processing and Visualization Analysis

Referring to reference [24], this study determines the time of occurrence of faults in the dataset provided in Table 2. Subsequently, an early fault imbalance dataset for rolling bearings is constructed based on various imbalanced rates (Q) corresponding to different types of faults.
Acknowledging the inevitable presence of noise signals during data collection in real-world working environments, this study introduces Gaussian white noise (with a signal-to-noise ratio of 3 dB) to the original dataset to simulate environmental noise. All subsequent data processing is conducted on the dataset post noise addition.
Leveraging the desirable regularity and orthogonality of the Daubchies wavelet basis, particularly the db10 wavelet basis, a three-layer wavelet packet decomposition is applied to the signal. This decomposition helps calculate the relative wavelet packet energy for each frequency band, enhancing the feature extraction process. Concurrently, time-domain features are extracted from the balanced dataset. Notably, this article carefully selects peak-to-peak and variance as sensitive time-domain indicators due to their distinct significance and minimal overlap in representation.
Combining the relative wavelet packet energy and the selected time-domain features yields fault feature vectors. To visualize the effectiveness of the proposed model, these extracted fault feature vectors undergo dimensionality reduction to a two-dimensional plane using the T-distribution Random Adjacency Embedding (t-SNE) algorithm. Model comparisons are conducted by representing non-data-enhanced fault feature vectors using relative wavelet packet energy (Model 1), a combination of relative wavelet packet energy and time-domain features (Model 2), and t-SNE dimensionality-reduced fault feature vectors after data augmentation (Model 3). Figure 5 depicts the t-SNE visualization of fault features across the four models, providing a comprehensive view of the model’s effectiveness.
The t-SNE visualization in Figure 7 offers insights into the fault characteristics of the four models:
Model 1, focusing solely on relative wavelet packet energy, exhibits a chaotic distribution of fault characteristics. Close distances or overlaps between different state data (normal, inner race fault, out race fault, and cage fault) make fault diagnosis challenging.
Model 2, incorporating both relative wavelet packet energy and time-domain features, shows a dense distribution in the feature visualization graph. Clear interclass distances between normal and fault class data enable effective distinction, though inner race faults are obscured by other fault types.
Model 3, with balanced data representation, improves interclass distances for specific fault states (inner race fault 1, out race fault, and out race fault 1). However, there is some overlap and smaller distances between normal, inner race fault, and cage fault characteristics, impacting optimal distinction.
In Model 4, the proposed model, fault characteristics of various rolling bearing states are clustered into one or more blocks with dense intra-class distribution. Nonetheless, challenges persist in distinguishing some inner race faults and cage faults with small interclass distances, indicating the need for further research to enhance distinguishability in these cases.

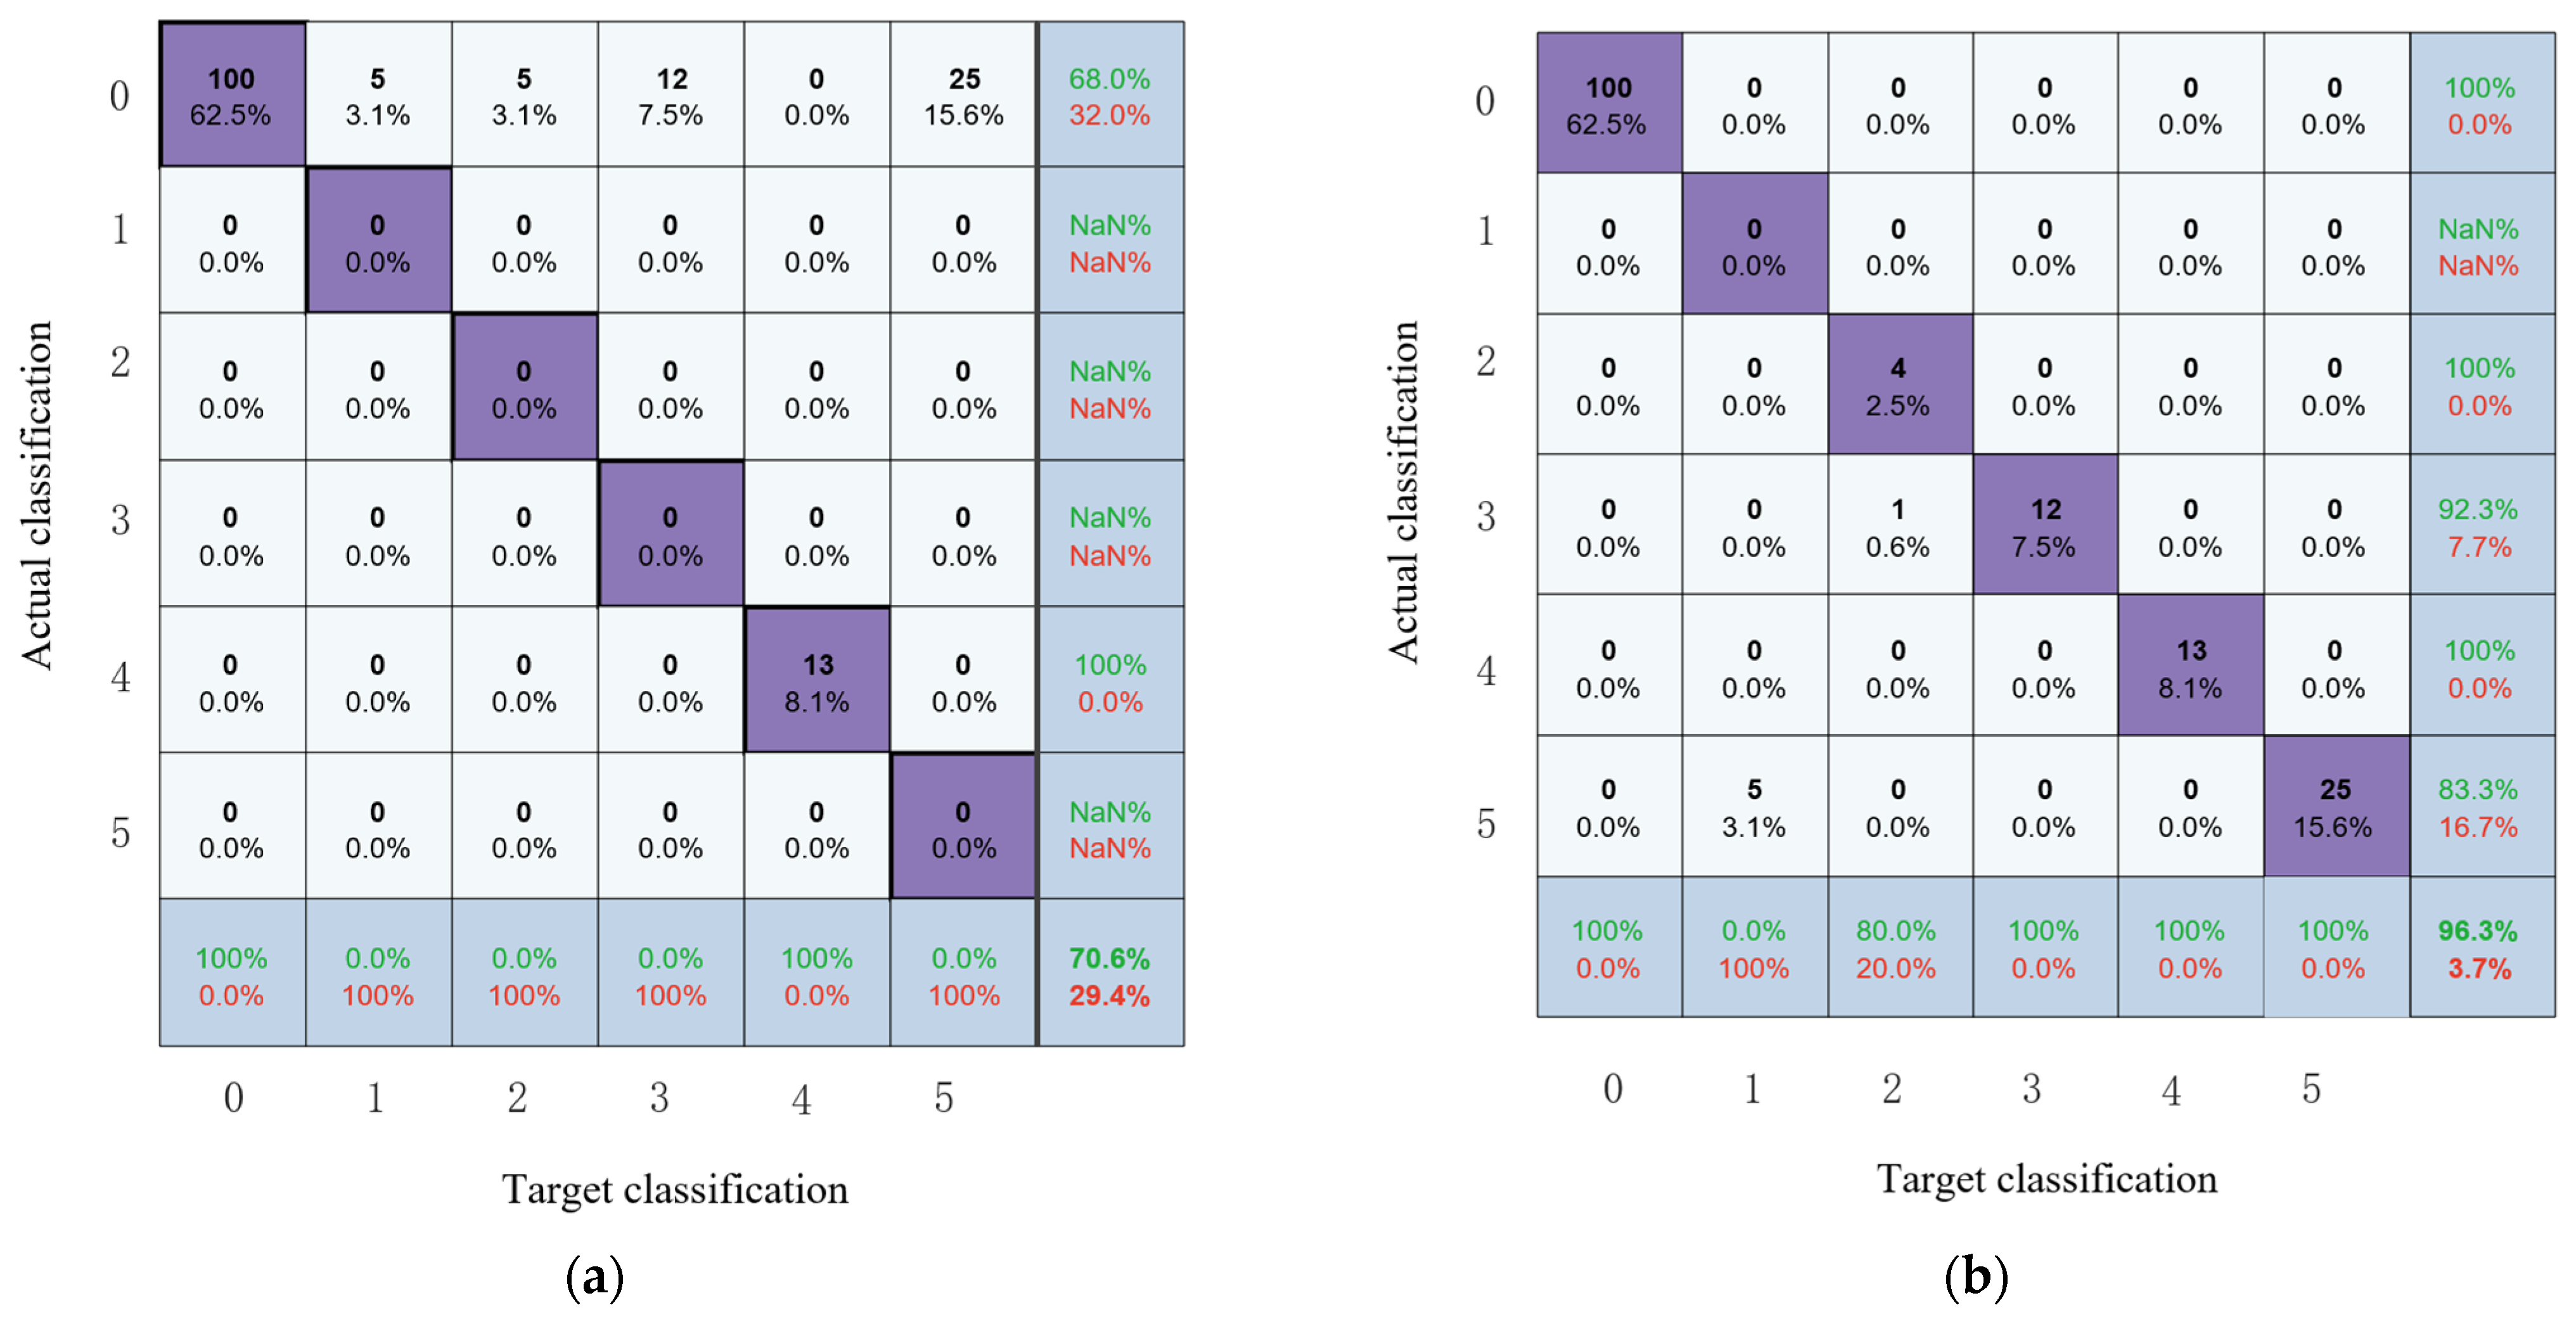
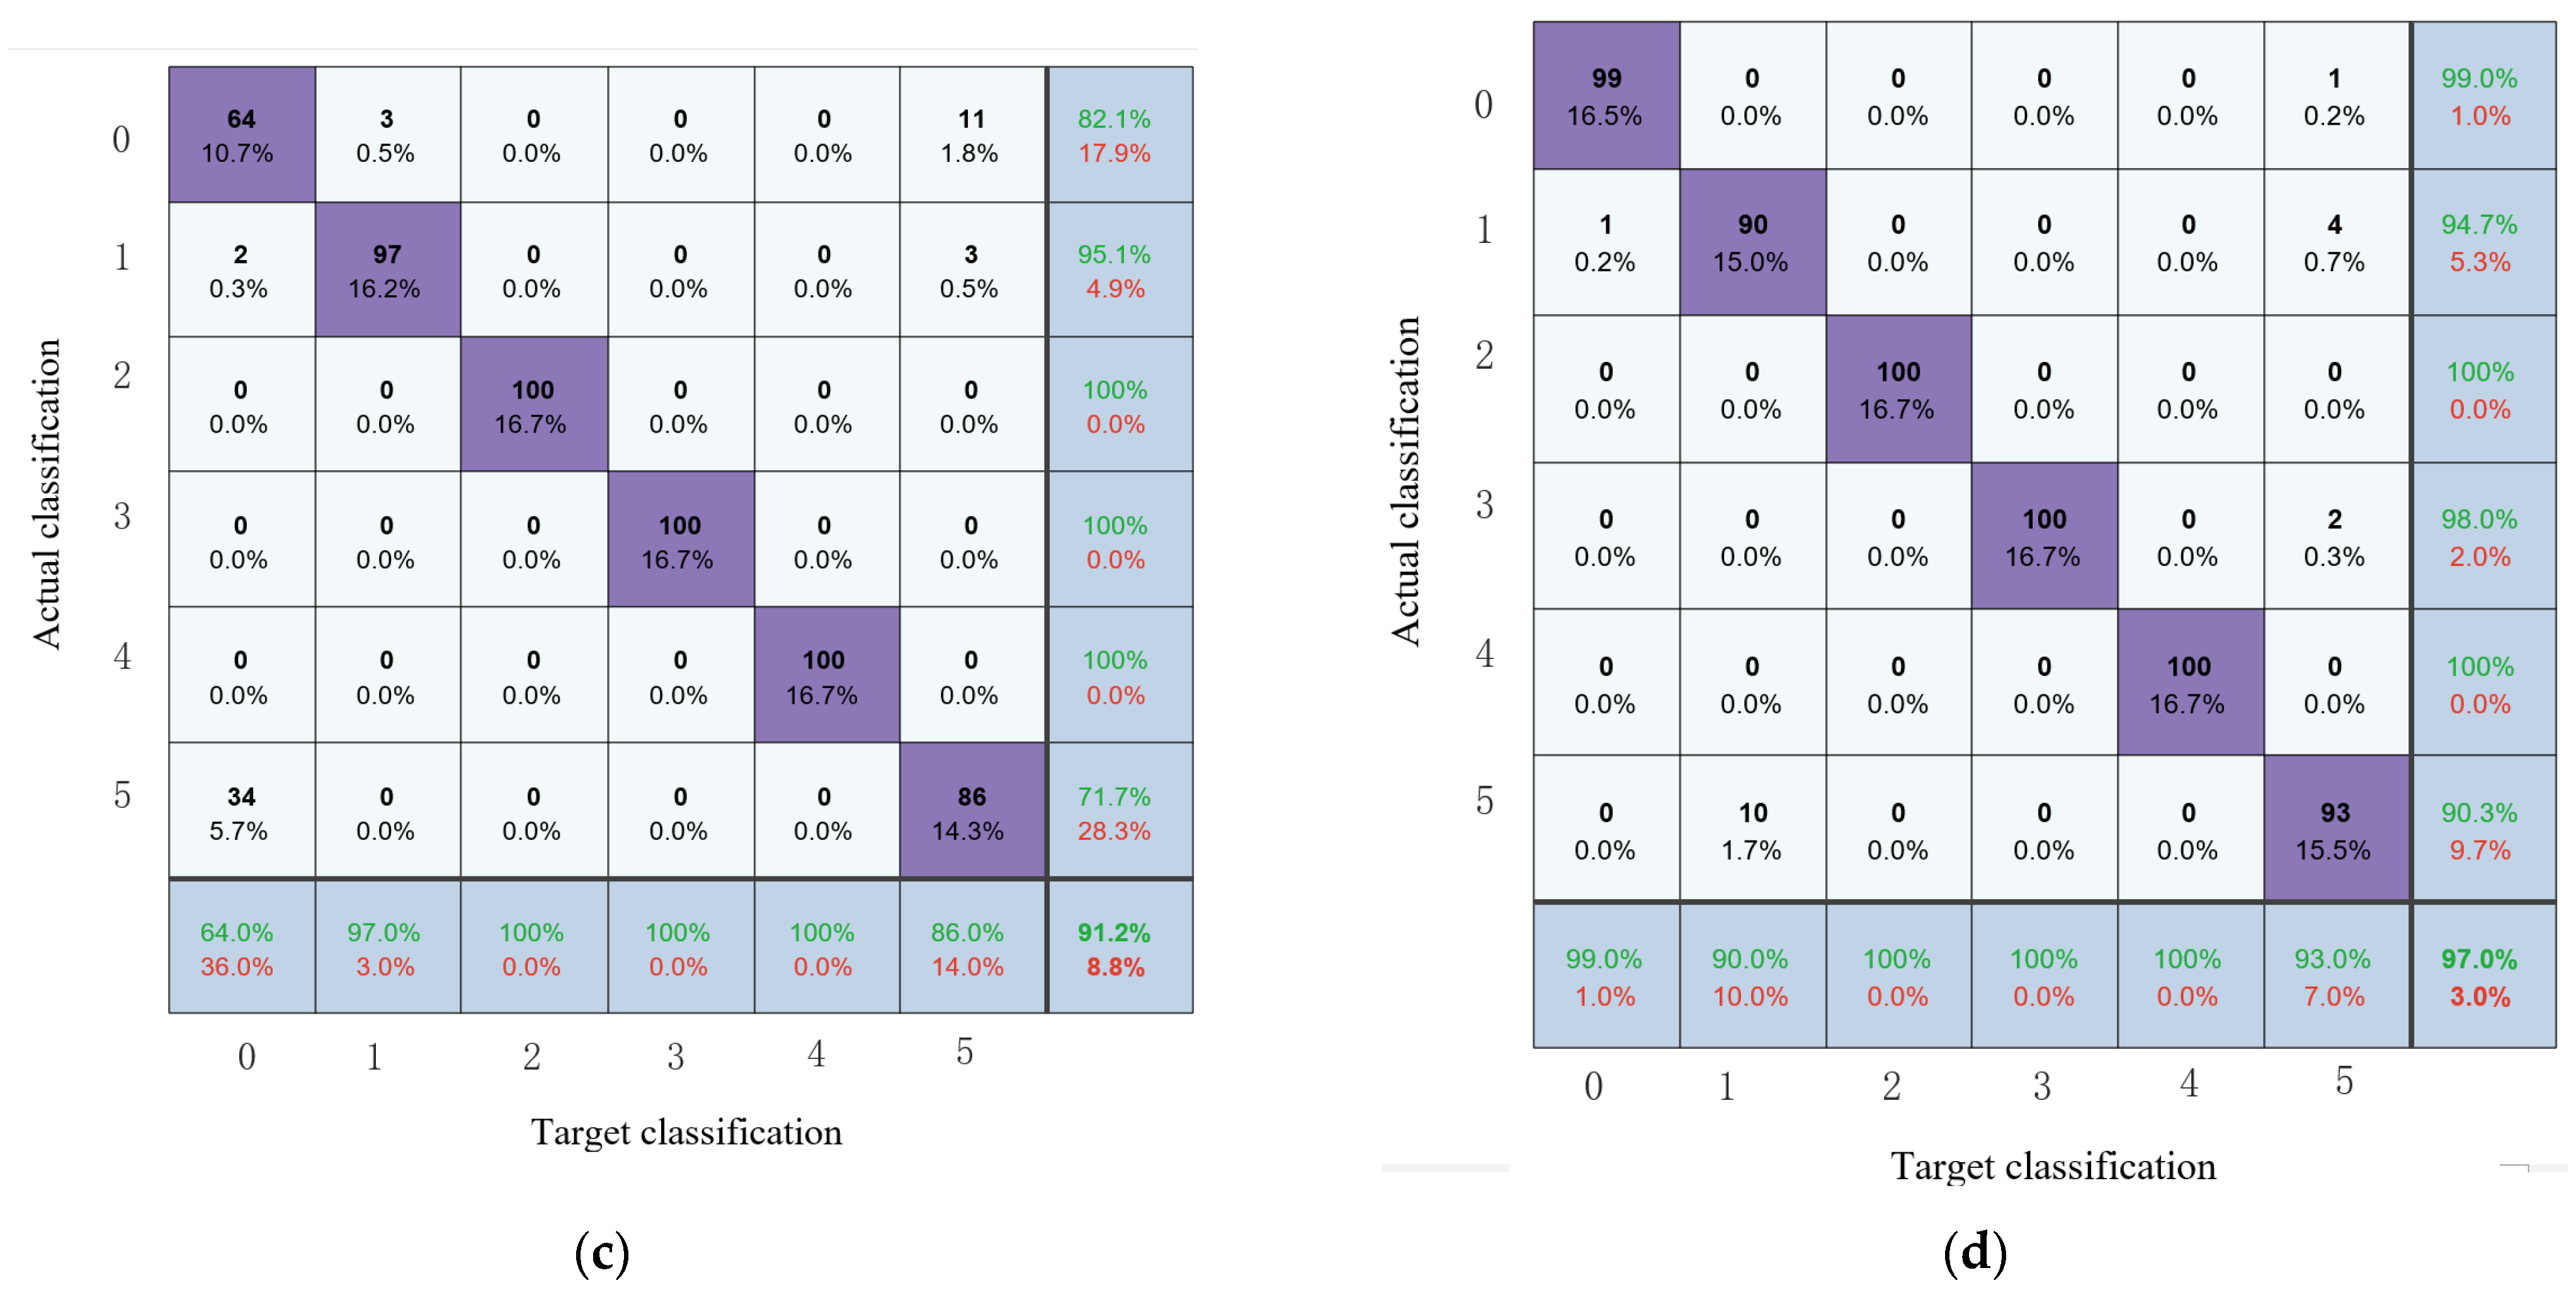
4.3. Analysis of Results
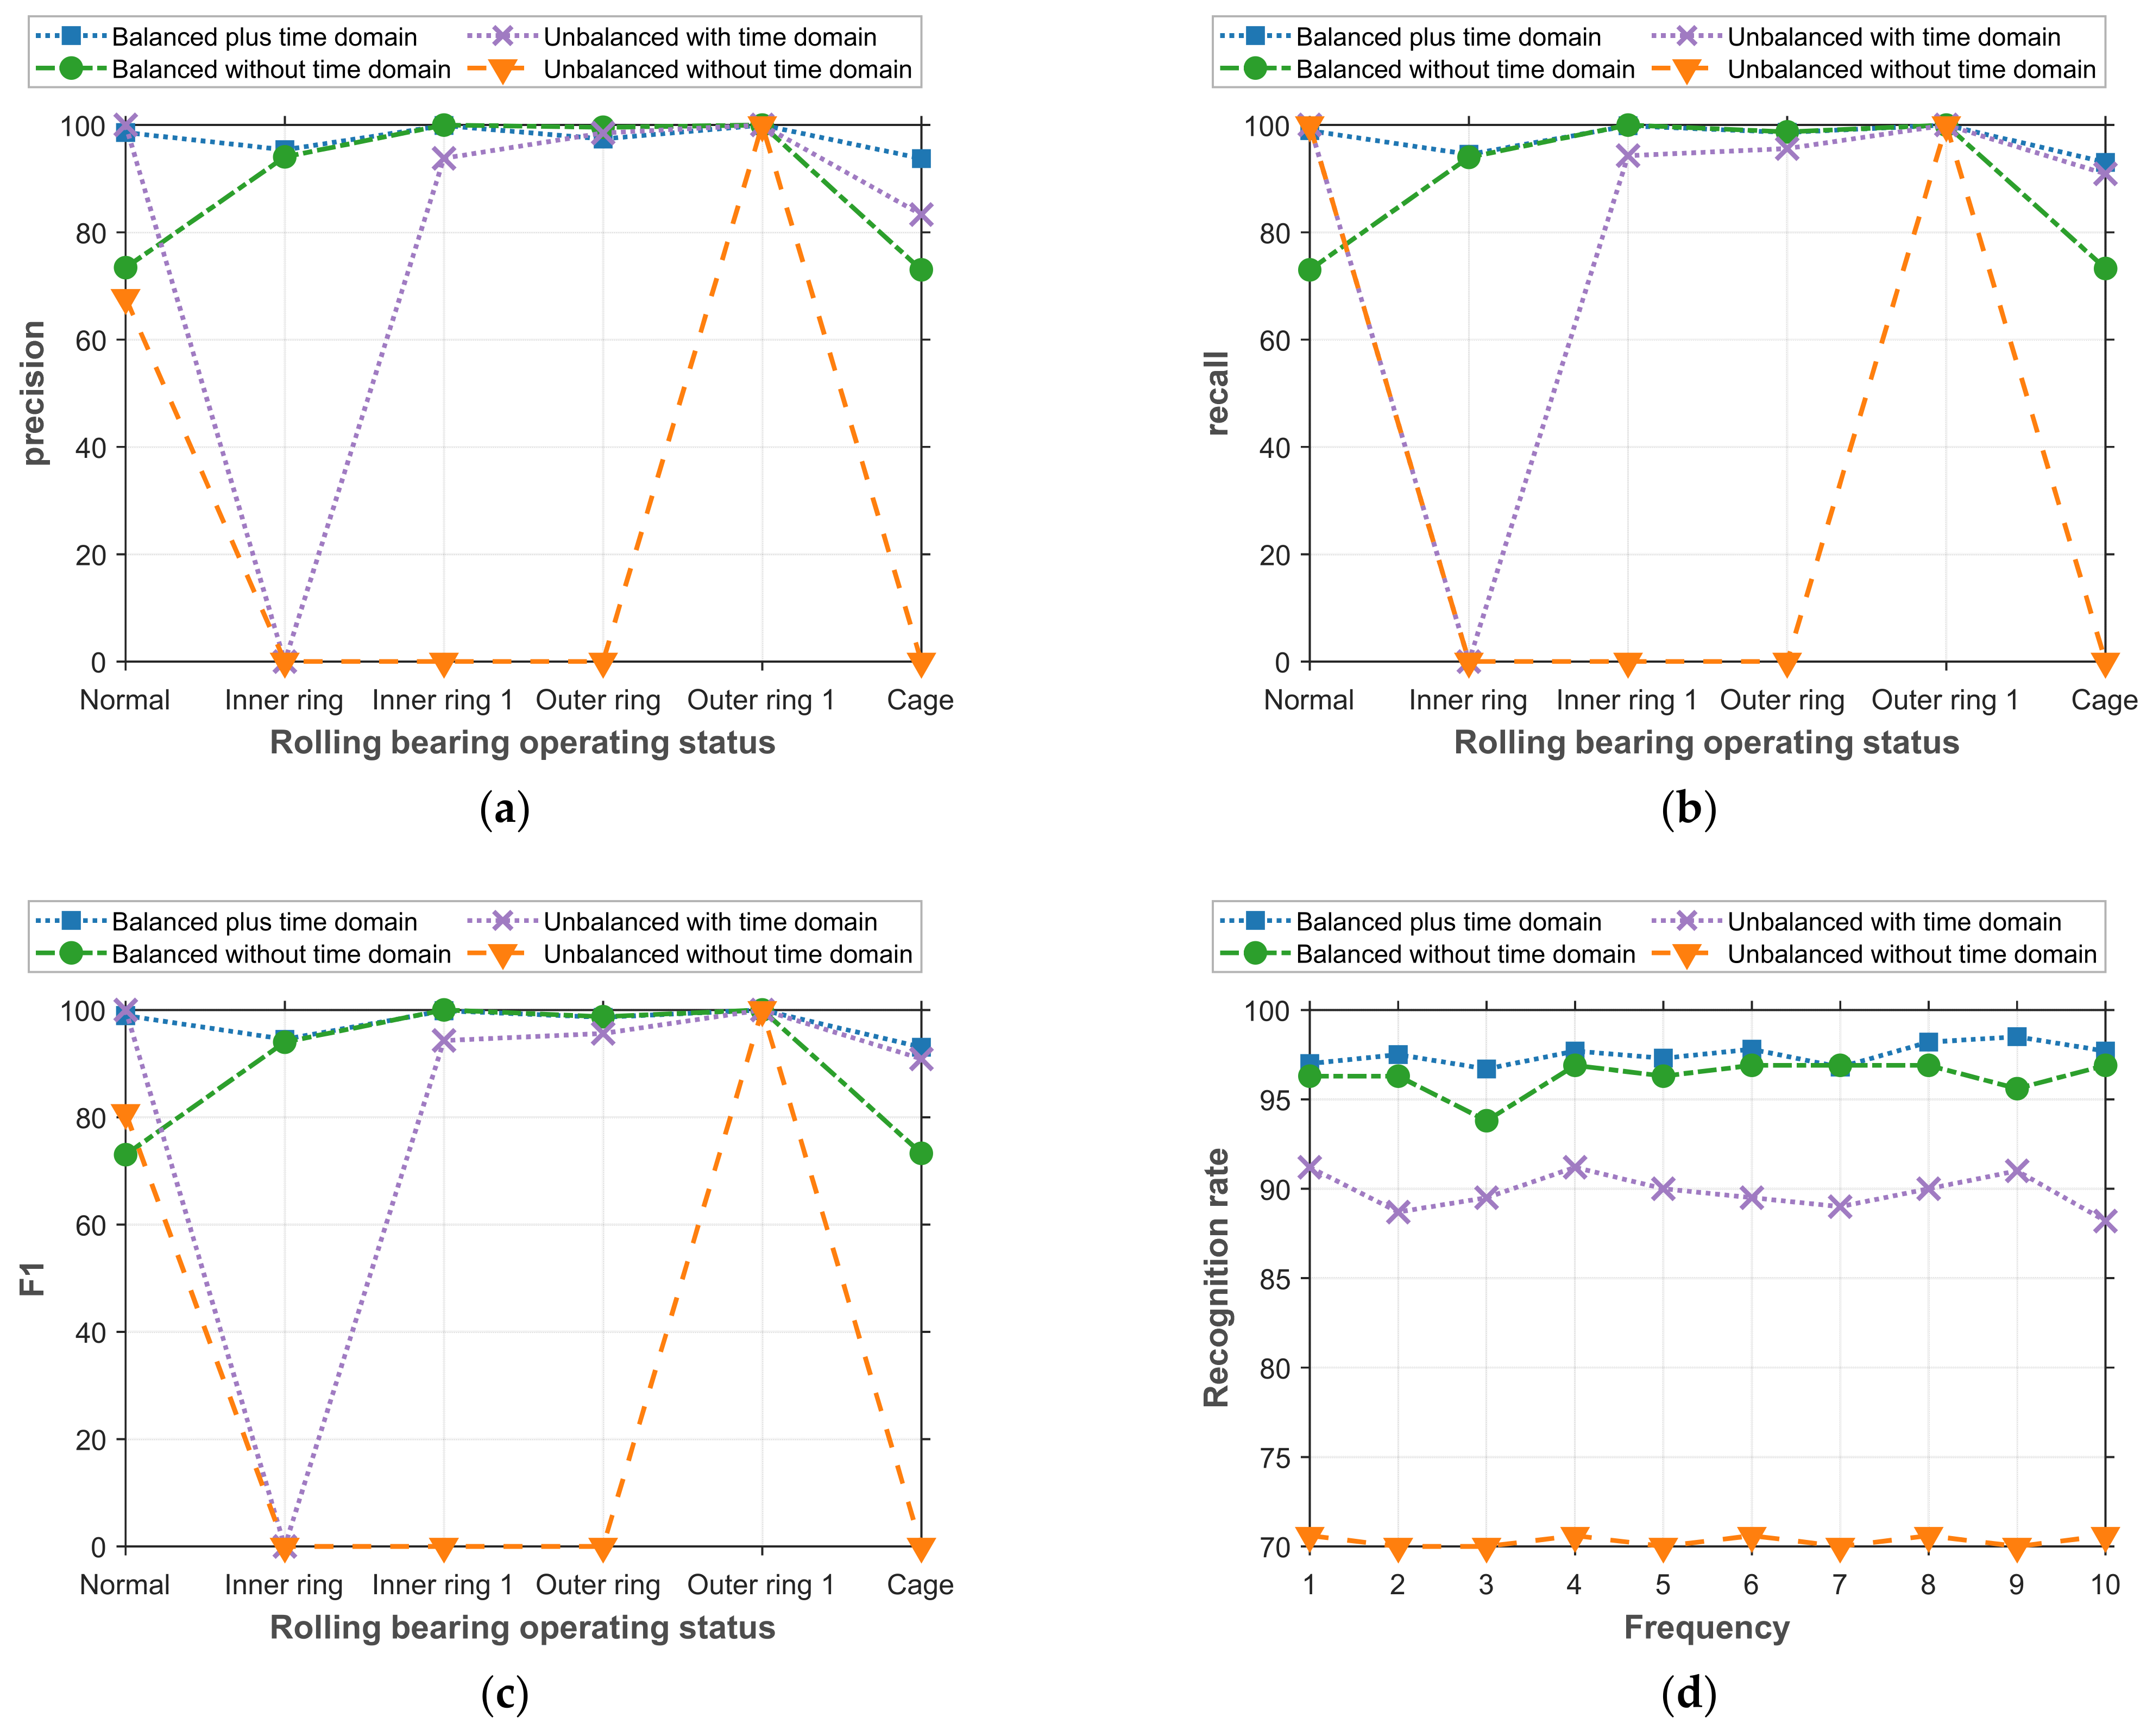
Section 4.2 employs the proposed fault characteristics to conduct a visual analysis of the model suggested in this article and other models. This section delves into a thorough analysis of the model’s effectiveness, particularly from the perspective of pattern recognition.
The process involves randomly selecting 50% of the fault feature data extracted in Section 4.2 to train the SVM classification model, with the remaining 50% utilized for testing. To ensure result reliability and mitigate the impact of chance, this verification process is repeated 10 times. The final evaluation index is derived from the average of these 10 runs for comprehensive comparison. Figure 6 presents the confusion matrix diagrams obtained by the four models during any one of these runs. In Figure 8, the numerical labels ‘0 to 5’ correspond to the following categories: normal, inner race, out race, cage, inner race 1, and out race 1.
The examination of Figure 8 provides a nuanced understanding of the performance disparities among the four models:
Model 1 exhibits notable limitations, correctly identifying only normal data and one specific fault type. All other fault types consistently receive incorrect classifications. Model 2 represents an improvement in fault identification rates. While overall identification has enhanced, challenges persist in accurately identifying inner race faults, leading to consistent misclassifications. Model 3 showcases a commendable ability to identify all fault types, achieving recall rates above 86%. However, a decline in the recall rate for normal data introduces some misclassifications. Model 4, the proposed model, stands out with superior performance, achieving recall rates exceeding 90% for various states of rolling bearings. This model excels in accurately identifying most faults, resulting in the highest overall recognition rate.
Further scrutiny of the confusion matrix for Model 4 reveals high accuracy in the normal category, correctly classifying 99 samples and misclassifying only 1 as a cage failure. In the inner race fault category, accuracy slightly diminishes, with 90 samples correctly classified and 5 misclassified as other categories. Notably, Model 4 demonstrates impeccable accuracy in the inner race fault 1, out race fault, and out race fault 1 categories, correctly classifying all samples. In the cage fault category, high accuracy persists, with 93 samples correctly classified and 10 misclassified as inner race faults. Despite these achievements, some confusion remains in the inner race fault category.
To offer a comprehensive perspective, a line chart in Figure 9 meticulously presents the average precision rate, recall rate, F1 value, and overall recognition rate for each state of the rolling bearing across the four models.
Figure 9 encapsulates the results of a comprehensive analysis conducted in this study, evaluating the classification performance under various conditions. The assessment encompasses precision value, recall value, F1 value, and the average recognition rates across 10 runs. The experiment spans diverse fault types, including normal, inner race fault, inner race fault 1, out race fault, out race fault 1, and cage. Additionally, considerations extend to both balanced and unbalanced datasets, incorporating feature extraction with and without the utilization of time-domain methods.
The results reveal notable variations in precision values under different conditions. When balancing with and without the inclusion of time domain, the model exhibits relatively high precision, demonstrating a robust ability to accurately predict positive samples. However, in scenarios involving imbalance with and without time domain, the precision value diminishes, potentially leading to misclassification due to the model’s challenges in processing imbalanced categories and features.
Examining recall values across conditions, the model performs exceptionally well in scenarios of balancing with and without time domain, showcasing higher recall values that enable the capture of more positive samples. Conversely, in cases of imbalance with and without time domain, the recall value is lower, indicating the model’s weaker ability to classify certain fault types. The amalgamation of F1 values, precision, and recall further elucidates the performance picture. Balancing with and without time domain yields higher F1 values, showcasing commendable performance concerning accuracy and recall rate. However, scenarios involving imbalance with and without time domain exhibit lower F1 values, signifying a need for improvement in classification performance.
Additionally, a comprehensive analysis of the average recognition rate over 10 runs is undertaken to assess the model’s stability. Balancing with and without time domain reveals a higher recognition rate, indicating superior stability. Conversely, in scenarios involving imbalance with and without time domain, the recognition rate is lower, suggesting potential instability influenced by data imbalance and feature differences. Addressing these factors may contribute to enhancing the overall stability of the model.
In conclusion, a thorough analysis of the experimental results, encompassing precision value, recall value, F1 value, and the average recognition rates over 10 runs, underscores several key observations. Firstly, the extraction of multi-domain fault features outperforms single-domain fault features, offering a more comprehensive and thorough analysis of signal information. This, in turn, leads to a more effective classification outcome. Moreover, comparing the fault diagnosis performance of the model under balanced and imbalanced data conditions reveals a substantial improvement in classification precision and recall rates when employing a balanced dataset. In scenarios of data imbalance, the SVM classifier tends to prioritize the majority class, potentially misclassifying the minority class as the majority class to achieve a higher overall recognition rate. The introduction of data balancing mitigates this issue, resulting in a more accurate and reliable fault diagnosis.

4.4. Discussion

4.4.1. Comparison of Different Models

To highlight the effectiveness of our proposed method in the article, we will conduct a comprehensive comparison between two distinct data scenarios. The first approach involves balancing the dataset, employing training techniques with both back propagation (BP) neural networks and convolutional neural networks (CNN). On the input side, BP utilizes a blend of multi-scale permutation entropy (MPE), particle swarm optimization (PSO), and complete ensemble empirical mode decomposition with adaptive noise (CEEMDAN) to extract essential features. Notably, the parameters for MPE are fixed at m = 6, s = 12, t = 1. In the case of POS + MPE, optimization through particle swarm optimization determines the values of m, s, and t. CEEMDAN plays a crucial role in noise reduction, and CNN leverages the denoised data from CEEMDAN as its input.
The second data scenario involves an imbalanced dataset, which we address by implementing techniques to balance the datasets—specifically, SMOTE + CNN and SMOTE + SVM. Table 3 meticulously presents the accuracy of each method, offering a lucid and concise overview of their respective performances.
Examining Table 3, it is evident that the methodology proposed in this article surpasses BP by over 7% in accuracy, underscoring the superiority of the featured extraction method. Noteworthy is the substantial performance enhancement compared to the balanced dataset, while the variance with CNN is negligible. This underscores SMOTE + SVM’s remarkable adaptability in addressing class imbalance, placing it on par with CNN in terms of performance.
Crucially, CNN’s commendable accuracy is offset by its relatively prolonged training time—a factor demanding careful consideration. In this regard, SMOTE + SVM shines, efficiently completing training without compromising accuracy. This renders it a more appealing choice for practical applications.
In the holistic evaluation of both accuracy and training efficiency, SMOTE + SVM emerges as a comprehensive and effective solution. When tackling imbalanced data, its overall efficacy positions it as a highly anticipated methodology, warranting further in-depth exploration and practical implementation.

4.4.2. Comparison with Other Studies on Similar Topics

To assess the efficacy of the proposed method for diagnosing faults in agricultural machinery, this study conducts a comparative analysis with various research methodologies. In reference [25], the focus lies on unveiling structural defects in the cleaning screen of a track-type combine harvester through durability testing and analysis of vibration and strain signals. While significant for enhancing the cleaning screen’s service life, this study exclusively explores vibration signals without delving into a comprehensive analysis. In reference [26], a fault diagnosis method utilizing composite scale variable dispersion entropy (CSvDE) and self-optimization variational mode decomposition (SoVMD) is presented, showcasing superiority in balancing datasets but lacking applicability to small sample data. Moving on to reference [27], DDS Adash software is employed for signal processing, utilizing the Demodulation Fast Fourier Transform (FFT) root mean square (RMS) method and the DDS Adash Fault Source Identification Tool (FASIT) technique. However, this method falls short in early fault diagnosis of bearings. Reference [28] introduces the refined composite multiscale sample entropy (RCmvMSE) into fault extraction for rolling bearings. While exhibiting advantages, existing methods in the literature face limitations in their applicability to imbalanced datasets and early fault diagnosis.
In summary, the proposed method not only accurately identifies faults in agricultural machinery but also addresses the challenges of small sample data and early fault diagnosis, setting it apart from other methodologies. The significance of handling small sample data is crucial for practical applications, particularly given the scarcity of fault data compared to normal data in bearings. Moreover, early fault diagnosis proves pivotal in minimizing losses and hazards. Consequently, the proposed method demonstrates clear superiority in its comprehensive approach.

5. Conclusions

In response to the inherent challenge of data imbalance between fault and normal data in real-world operational settings, this paper introduces a multi-domain early fault diagnosis method for rolling bearings based on data augmentation. The approach is validated using early fault data pairs extracted from the comprehensive life cycle dataset of rolling bearings at Xi’an Jiaotong University.
The study reveals noteworthy outcomes:
(1) The impact of balancing the data is evident in the observed enhancements across various metrics. The overall recognition rate, precision rate for different fault types, recall rate, and F1 value all exhibit steady improvements when compared to unbalanced data. This underscores the effectiveness of data balancing in refining the performance of the fault diagnosis method.
(2) In a comparative analysis with other models discussed in the article, the proposed model emerges as particularly adept at recognizing minority types of fault data. It demonstrates superior judgment capabilities, especially in identifying early failures in rolling bearings. This attests to the model’s robustness and effectiveness in handling imbalanced datasets.
In summary, the study underscores the efficacy of the proposed multi-domain early fault diagnosis method, emphasizing its ability to address the challenges posed by imbalanced datasets and enhance the accuracy of fault diagnosis in rolling bearings.

Author Contributions

Conceptualization, F.X. and G.L.; methodology, F.X. and H.L.; validation, F.X. and E.S.; investigation, F.X. and Y.W.; writing—original draft preparation, F.X.; writing—re-view and editing, F.X. and G.L. All authors have read and agreed to the published version of the manuscript.

Funding

This research was funded by the National Natural Science Foundation of China (52265068, 52065022), the Natural Science Foundation of Jiangxi Province (20224BAB204050, 20224BAB204040), the Project of Jiangxi Provincial Department of Education (GJJ2200627), and the Jiangxi Provincial Graduate Innovation Special Fund Project (YC2022-s481).

Institutional Review Board Statement

Not applicable.

Data Availability Statement

Data available in a publicly accessible repository that does not issue DOIs. Publicly available datasets were analyzed in this study. This data can be found here: http://biaowang.tech/xjtu-sy-bearing-datasets.

Conflicts of Interest

The authors declare no conflict of interest.

References

  1. Zhao, S.; Li, T.; Wang, G.; Zhang, Y. Adjustment of Meat Consumption Structure under the Dual Goals of Food Security and Carbon Reduction in China. Agriculture 2023, 13, 2242. [Google Scholar] [CrossRef]
  2. Li, C.; Wu, J.; Pan, X.; Dou, H.; Zhao, X.; Gao, Y.; Yang, S.; Zhai, C. Design and Experiment of a Breakpoint Continuous Spraying System for Automatic-Guidance Boom Sprayers. Agriculture 2023, 13, 2203. [Google Scholar] [CrossRef]
  3. Fargnoli, M.; Lombardi, M. Safety Vision of Agricultural Tractors: An Engineering Perspective Based on Recent Studies (2009–2019). Safety 2020, 6, 1. [Google Scholar] [CrossRef]
  4. Fargnoli, M.; Vita, L.; Gattamelata, D.; Laurendi, V.; Tronci, M. A reverse engineering approach to enhance machinery design for safety. In Proceedings of the DS 70: DESIGN 2012, the 12th International Design Conference, Dubrovnik, Croatia, 12 August 2012; pp. 627–636. [Google Scholar]
  5. Woo, S.; O’Neal, D.L.; Hassen, Y.M.; Mebrahtu, G. Enhancing the Fatigue Design of Mechanical Systems Such as Refrigerator to Reserve Food in Agroindustry for the Circular Economy. Sustainability 2023, 15, 7010. [Google Scholar] [CrossRef]
  6. Cecchini, M.; Piccioni, F.; Ferri, S.; Coltrinari, G.; Bianchini, L.; Colantoni, A. Preliminary Investigation on Systems for the Preventive Diagnosis of Faults on Agricultural Operating Machines. Sensors 2021, 21, 1547. [Google Scholar] [CrossRef] [PubMed]
  7. Zhang, J.; Ding, K.; Wang, H. Rolling bearing early weak fault intelligent diagnosis based on VMD and CNN. Modul. Mach. Tool Autom. Manuf. Tech. 2020, 11, 15–19. [Google Scholar]
  8. Li, J.; Li, X.; Li, Y.; Zhang, Y.; Yang, X.; Xu, P. A New Method of Tractor Engine State Identification Based on Vibration Characteristics. Processes 2023, 11, 303. [Google Scholar] [CrossRef]
  9. Xue, Z.; Fu, J.; Fu, Q.; Li, X.; Chen, Z. Modeling and Optimizing the Performance of Green Forage Maize Harvester Header Using a Combined Response Surface Methodology—Artificial Neural Network Approach. Agriculture 2023, 13, 1890. [Google Scholar] [CrossRef]
  10. Choe, H.O.; Lee, M.-H. Artificial Intelligence-Based Fault Diagnosis and Prediction for Smart Farm Information and Communication Technology Equipment. Agriculture 2023, 13, 2124. [Google Scholar] [CrossRef]
  11. Liu, Y.; Wang, X.; Dai, D.; Tang, C.; Mao, X.; Chen, D.; Zhang, Y.; Wang, S. Knowledge Discovery and Diagnosis Using Temporal-Association-Rule-Mining-Based Approach for Threshing Cylinder Blockage. Agriculture 2023, 13, 1299. [Google Scholar] [CrossRef]
  12. Wang, J.; Lu, Z.; Wang, G.; Hussain, G.; Zhao, S.; Zhang, H.; Xiao, M. Research on Fault Diagnosis of HMCVT Shift Hydraulic System Based on Optimized BPNN and CNN. Agriculture 2023, 13, 461. [Google Scholar] [CrossRef]
  13. Hao, S.; Tang, Z.; Guo, S.; Ding, Z.; Su, Z. Model and Method of Fault Signal Diagnosis for Blockage and Slippage of Rice Threshing Drum. Agriculture 2022, 12, 1968. [Google Scholar] [CrossRef]
  14. Fan, Y.; Cui, X.; Han, H. Chiller fault diagnosis with the technology of imbalanced data. J. Eng. Thermophys. 2019, 40, 1219–1228. [Google Scholar]
  15. Kaur, H.; Pannu, H.S.; Malhi, A.K. A systematic review on imbalanced data challenges in machine learning: Applications and solutions. ACM Comput. Surv. 2019, 52, 1–36. [Google Scholar] [CrossRef]
  16. Li, Y.; Chai, Y.; Hu, Y.; Yin, H. Review of imbalance data classification methods. Control Decis. 2019, 34, 673–688. [Google Scholar]
  17. Vaishal, G. An overview of classification algorithms for imbalanced datasets. Emerg. Technol. Adv. Eng. 2012, 2, 42–47. [Google Scholar]
  18. Meng, Z.; Guan, Y.; Pan, Z.; Sun, D.; Fan, F.; Cao, L. Fault diagnosis of rolling bearing based on secondary data enhancement and deep convolutional network. J. Mech. Eng. 2021, 57, 106–115. [Google Scholar]
  19. Chawla, N.V.; Bowyer, K.W.; Hall, L.O.; Kegelmeyer, W.P. SMOTE: Synthetic minority over-sampling technique. J. Artif. Intell. Res. 2002, 16, 321–357. [Google Scholar] [CrossRef]
  20. Qi, S.; Hu, R.; Wang, W.; Wu, M.; Zhang, Y. Transformer fault diagnosis method based on SMOTE balanced data set and BP neural network. Shangdong Electr. Power 2022, 49, 15–22. [Google Scholar]
  21. Huang, H.; Wei, J.; Ren, Z.; Wu, J. Rolling bearing fault diagnosis based on imbalanced sample characteristics oversampling algorithm and SVM. J. Vibr. Shock 2020, 39, 65–74+132. [Google Scholar]
  22. Liu, Y.; Xu, Z.; He, J.; Wang, Q.; Gao, S. Data augmentation method for power transformer fault diagnosis based on conditional Wasserstein fenerative adversarial network. Power Syst. Technol. 2020, 44, 1505–1513. [Google Scholar]
  23. Wang, B.; Lei, Y.; Li, N.; Li, N. A hybrid prognostics approach for estimating remaining useful life of rolling element bearings. IEEE Trans. Reliab. 2018, 69, 401–412. [Google Scholar] [CrossRef]
  24. Zixu, C.; Zhenjie, Z.; Guoliang, L. Novel early fault detection and diagnosis for rolling element bearings in graph spectrum domain. J. Vibr. Shock 2022, 41, 51–59. [Google Scholar]
  25. Ma, Z.; Zhang, Z.; Zhang, Z.; Song, Z.; Liu, Y.; Li, Y.; Xu, L. Durable Testing and Analysis of a Cleaning Sieve Based on Vibration and Strain Signals. Agriculture 2023, 13, 2232. [Google Scholar] [CrossRef]
  26. Jiang, W.; Shan, Y.; Xue, X.; Ma, J.; Chen, Z.; Zhang, N. Fault Diagnosis for Rolling Bearing of Combine Harvester Based on Composite-Scale-Variable Dispersion Entropy and Self-Optimization Variational Mode Decomposition Algorithm. Entropy 2023, 25, 1111. [Google Scholar] [CrossRef] [PubMed]
  27. Bhandari, S.; Jotautienė, E. Vibration Analysis of a Roller Bearing Condition Used in a Tangential Threshing Drum of a Combine Harvester for the Smooth and Continuous Performance of Agricultural Crop Harvesting. Agriculture 2022, 12, 1969. [Google Scholar] [CrossRef]
  28. Yang, G.; Cheng, Y.; Xi, C.; Liu, L.; Gan, X. Combine Harvester Bearing Fault-Diagnosis Method Based on SDAE-RCmvMSE. Entropy 2022, 24, 1139. [Google Scholar] [CrossRef]
Figure 1. Three-layer wavelet packet decomposition structure diagram.
Agriculture 14 00112 g001
Figure 2. Flowchart of the proposed fault diagnosis method.
Agriculture 14 00112 g002
Figure 3. Experimental platform.
Agriculture 14 00112 g003
Figure 4. Photos of tested bearings: (a) Normal bearing; (b) Inner race wear; (c) Outer race wear; (d) Outer race fracture.
Agriculture 14 00112 g004
Figure 5. Six vibration signals of bearings: (a) Cage; (b) Inner race; (c) Inner race 1; (d) Outer race; (e) Outer race1; (f) Normal.
Agriculture 14 00112 g005
Figure 6. Characteristic values of six vibration signals of bearings: (a) Cage; (b) Inner race; (c) Inner race 1; (d) Outer race; (e) Outer race1; (f) Normal.
Agriculture 14 00112 g006
Figure 7. t-SNE visual comparison of 4 models: (a) t-SNE visualization of Model 1; (b) t-SNE visualization of Model 2; (c) t-SNE visualization of Model 3; (d) t-SNE visualization of Model 4.
Agriculture 14 00112 g007aAgriculture 14 00112 g007b
Figure 8. Confusion matrix processed by four models: (a) Confusion matrix obtained by Model 1 processing; (b) Confusion matrix obtained by Model 2 processing; (c) Confusion matrix obtained by Model 3 processing; (d) Confusion matrix obtained by Model 4 processing.
Agriculture 14 00112 g008aAgriculture 14 00112 g008b
Figure 9. Identification results of various states of rolling bearings: (a) Comparison of average accuracy; (b) Comparison of average recall rates; (c) Average F1 value comparison; (d) Overall recognition rate comparison.
Agriculture 14 00112 g009
Table 1. Unbalanced distribution of fault data.
Fault TypeInner RaceInner Race1Out RaceOut Race1Cage Fault
Number of sample groups1010252550
Q1:201:201:81:81:4
Table 2. Related data details.
Data SetFault TypeBasic Rating LifeActual Life
Bearing2_1Inner race6.786~11.726 h8 h 11 min
Bearing2_2Out race2 h 41 min
Bearing2_3Cage8 h 53 min
Bearing3_3Inner race18.468~14.632 h6 h 11 min
Bearing3_5Out race11 h 54 min
Table 3. The accuracy of each model.
MethodsAccuracy Rate
MPE + BP73.3%
CEEMD + MPE + POS + BP80.0%
MPE + POS + BP90.0%
CEEMD + CNN98.3%
SMOTE + CNN98.6%
SMOTE + SVM97.0%
Disclaimer/Publisher’s Note: The statements, opinions and data contained in all publications are solely those of the individual author(s) and contributor(s) and not of MDPI and/or the editor(s). MDPI and/or the editor(s) disclaim responsibility for any injury to people or property resulting from any ideas, methods, instructions or products referred to in the content.

