Article

Calibration and Testing of Parameters for the Discrete Element Simulation of Soil Particles in Paddy Fields

1
College of Engineering, South China Agricultural University, Guangzhou 510642, China
2
College of Electronic Engineering (College of Artificial Intelligence), South China Agricultural University, Guangzhou 510642, China
3
Key Laboratory of Key Technology on Agricultural Machine and Equipment, Ministry of Education, South China Agricultural University, Guangzhou 510642, China
4
Basic Experiment and Practical Training Center, South China Agricultural University, Guangzhou 510642, China
*
Author to whom correspondence should be addressed.
Agriculture 2024, 14(1), 118; https://doi.org/10.3390/agriculture14010118
Submission received: 27 November 2023 / Revised: 11 January 2024 / Accepted: 11 January 2024 / Published: 12 January 2024
(This article belongs to the Section Agricultural Technology)

Abstract

:
The parameters of the discrete element simulation model for rice field soils serve as valuable data references for investigating the dynamic characteristics of the walking wheel of high-speed precision seeding machinery in paddy fields. The research specifically targets clay loam soil from a paddy field in South China. Calibration of essential soil parameters was achieved using EDEM_2022 software (and subsequent versions) discrete element simulation software, employing the Edinburgh Elasto-Plastic Adhesion (EEPA) nonlinear elastic-plastic contact model. The tillage layer and plough sub-base layer underwent calibration through slump and uniaxial compression tests, respectively. Influential contact parameters affecting slump and axial pressure were identified through a Plackett–Burman test. The optimal contact parameter combinations for the discrete element model of the tillage layer and plough sub-base layer were determined via a quadratic rotational orthogonal test. The accuracy of the discrete element simulation model’s parameters for paddy field soils was further validated through a comparative analysis of the simulation test’s cone penetration and the field soil trench test. Results indicate that the Coefficient of Restitution, surface energy, Contact Plasticity Ratio, and Tensile Exp significantly influence slump (p < 0.05). Additionally, the Coefficient of Restitution, Contact Plasticity Ratio, coefficient of rolling friction, and Tangential Stiff Multiplier significantly impact axial pressure (p < 0.05). Optimal contact parameters for the plough layer were achieved with a particle recovery coefficient of 0.49, a surface energy of 18.52 J/m2, a plastic deformation ratio of 0.45, and a tensile strength of 3.74. For the plough subsoil layer, optimal contact parameters were a particle recovery coefficient of 0.47, a coefficient of interparticle kinetic friction of 0.32, a plastic deformation ratio of 0.49, and a tangential stiffness factor of 0.31. Results from the cone penetration test reveal no significant disparity in compactness between the actual experiment and the simulation test. The calibrated discrete element model’s contact parameters have been verified as accurate and reliable. The findings of this study offer valuable data references for understanding the dynamic characteristics of the walking wheel of the entire machinery in high-speed precision seeding in paddy fields.

1. Introduction

Rice cultivation constitutes approximately 25% of the total cultivated land dedicated to food crops in this nation [1]. The mechanization of paddy fields plays a pivotal role in advancing the modernization of our agriculture [2]. Nevertheless, current operations of paddy field machinery encounter challenges due to the resistance generated by mud and the interaction between the driving wheels and the paddy field plough subsoil. These factors result in soil pressure and shearing forces, potentially causing soil deformation and failure. The muddy terrain presents a formidable obstacle for machinery, leading to issues such as wheel slippage, head warping, and wheel entrapment in the mud, among other failure phenomena.
In recent years, significant attention has been directed towards advancing agricultural modernization. Consequently, the discrete element method has been employed to optimize and analyze agricultural machinery and the interactions between particles in the law of motion [3]. This method proves particularly advantageous and has been instrumental in constructing a soil model for paddy fields, facilitating the design and optimization of technical aspects related to paddy field machinery operation [4,5,6]. The discrete element method is utilized to explore the interaction between paddy field operating machinery and soil. Ensuring the reliability of the model necessitates precise calibration of simulation parameters, with scholars recommending the implementation of both actual and simulation tests for accuracy [7,8,9,10,11].
Shi et al. [12] combined the benefits of the Hysteretic Spring Contact Model (HSCM) and the Linear Cohesion Model (LCM), utilizing the soil accumulation angle as the response value to construct a model of farmland in the Northwest Dry Zone. Zhang et al. [13], employing the Hertz-Mindlin (no slip) contact model, developed a discrete elemental model of sandy soil, calibrating parameters through the angle of stacking test. Li et al. [14] modeled clay-heavy black soil particles in the northeast region using the Hertz-Mindlin with JKR contact model, with the simulated accumulation angle of soil particles serving as the response surface. Xiang et al. [15] combined Hertz-Mindlin with JKR contact models, calibrated parameters through stacking tests, and obtained accurate contact parameters for the discrete element simulation model of southern clay loam soil. Zhou et al. [16], selecting the Hertz-Mindlin model with JKR contact, calibrated parameters through a soil slump test, and derived optimum contact parameters for discrete elements of soil with high moisture content using the steepest-climbing test and central composite test. Xie et al. [17] opted for the Edinburgh Elasto-Plastic Adhesion contact model, acquiring the best contact parameter combinations for discrete elements in viscous and plastic deformation-prone soil through the uniaxial confined compression test and the unconfined compressive strength test, subsequently constructing a discrete element model of viscoelastic soil.
In summary, we propose the Edinburgh Elasto-Plastic Adhesion (EEPA) contact model, incorporating soil elasticity and viscosity, building upon the work of Thakur et al. [18]. However, there is a notable lack of literature addressing the calibration of discrete elemental parameters for the integration of cultivated and ploughed subsoil layers in paddy fields in South China. To address this gap, our study employs a combination of physical tests and discrete element simulation tests to calibrate parameters for clay loam soil with high water content. The discrete element soil bed is established using the EEPA contact model, and the particle contact parameters of the model are refined by comparing actual and simulated results from the slump test and axial compression test. This calibration process leads to the development of a discrete element simulation model specifically tailored for paddy field soil. To validate parameter accuracy, cone penetration tests are conducted. Our objective is to create a preliminary discrete element model of clay loam soil in paddy fields, providing valuable data references for optimizing the structural design of lightweight power chassis in paddy fields.

2. Materials and Methods

2.1. Soil Basic Parameters

Soil samples were selectively extracted from the experimental plot situated at the teaching and research center of South China Agricultural University (SCAU). The analysis of the soil texture identified it as clay loam, characterized by elevated levels of porosity, water content, and plasticity. A total of nine distinct soil sample groups were randomly procured from the experimental field. The determination of moisture content, density, and liquid-plastic limit of the soil samples was conducted using the drying method, ring knife method, and liquid-plastic limit measurement, respectively. The outcomes of these analyses are depicted in Figure 1.

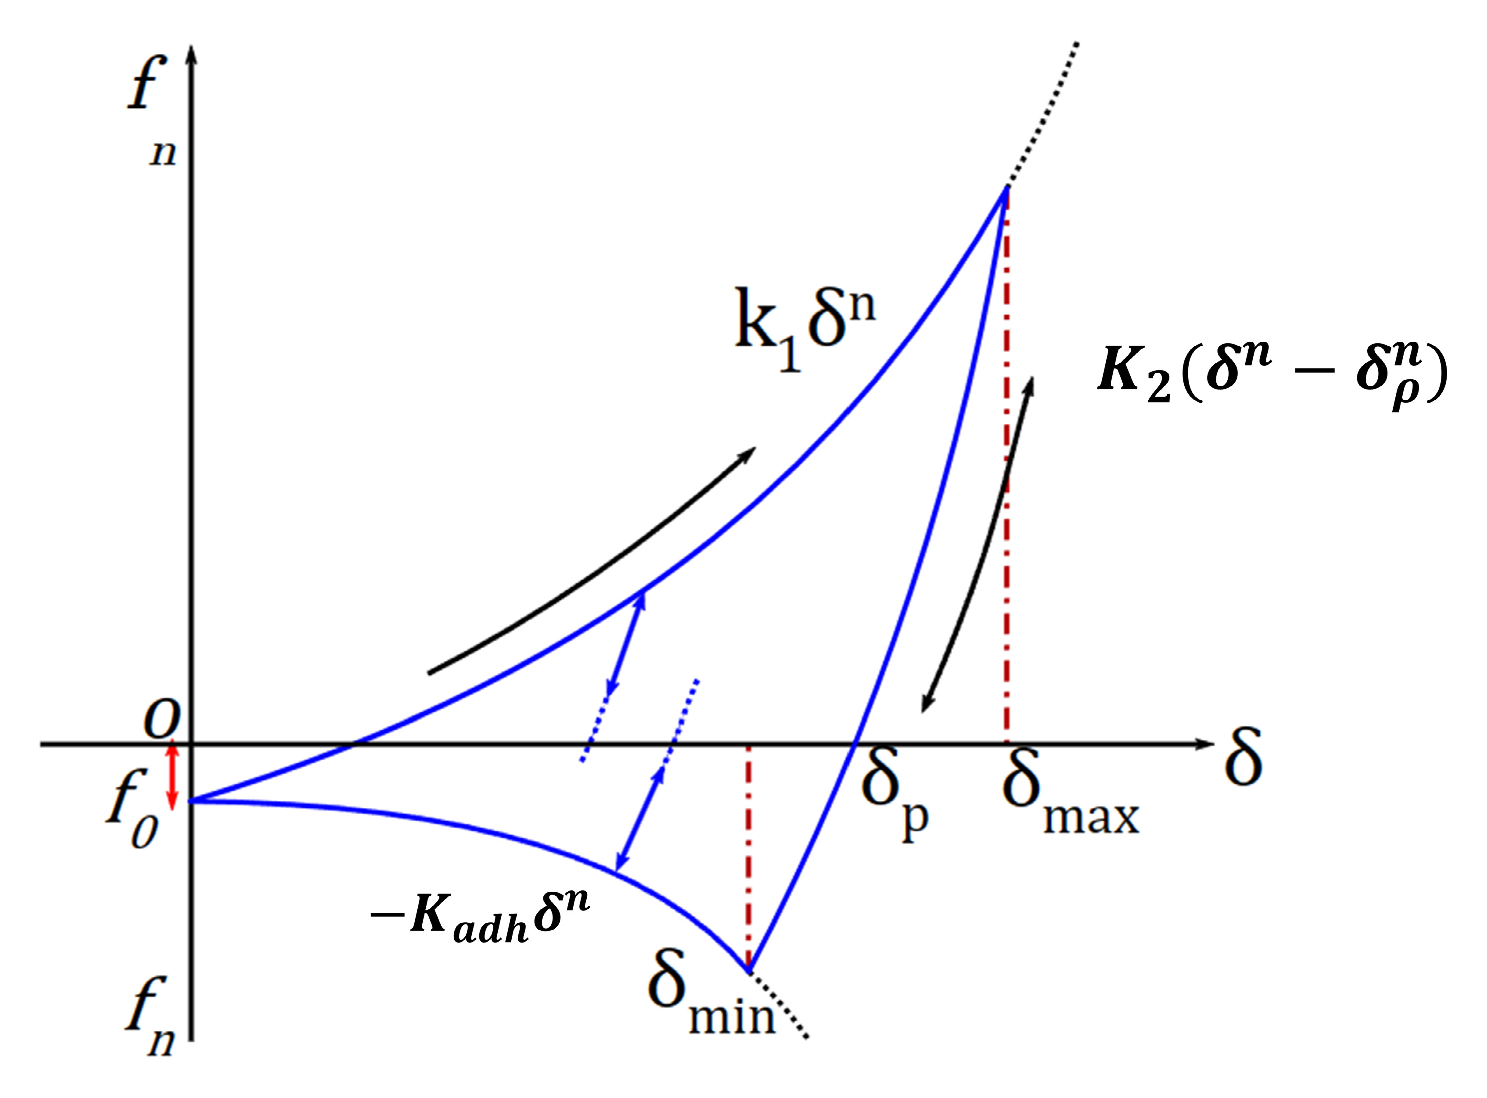
2.2. Contact Model Theory and Parameters to Be Calibrated

The clay present in paddy field planting exhibits robust adhesion and elasticity. The Edinburgh Elasto-Plastic Adhesion (EEPA) non-linear elastic-plastic contact model, employed in the EDEM software, aptly captures the characteristics of soil particles both before and after compaction. Post-compaction, the particles acquire a cohesive and deformable nature yet retain a discrete state when in an uncompacted condition [19].
The normal spring force of the EEPA contact model, seamlessly integrated into the EDEM_2022 software (and subsequent versions), is illustrated in Figure 2 and mathematically expressed by the following equation [18].
The comprehensive standard normal force f n results from the combination of the hysteresis elastic force f h y s and the normal damping force f n d . The particle overlap relationship governing the normal contact force is expressed as follows [18]:
f n = f h y s + f n d
f h y s = f 0 + k 1 δ n         i f   k 2 δ n δ p n k 1 δ n f 0 + k 2 δ n δ p n                       i f   k 1 δ n >   k 2 δ n δ p n > k a d h δ n f 0 k a d h δ n         i f k a d h δ n k 2 δ n δ p n
where   u   represents the unit normal vector from the contact point to the center of mass, f 0 denotes the initial bond strength of the particles, k 1 refers to the loading stiffness coefficient, k 2 is the unloading stiffness coefficient, δ p represents the contact overlap of the particles, and k a d h is the coefficient of viscous strength.
f n d = β n v n
β n = 4 m k 1 1 + π ln e 2
m = m i · m j / m i + m j
where the normal velocity is represented by v n , the damping coefficient by β n , the contact particle by m , and the coefficient of recovery by e .
Tangential damping is calculated by multiplying the interparticle tangential damping coefficient β t with the relative tangential velocity v t . The t description of the tangential damping coefficient can be found in reference [18].
β t = 4 m k t 1 + π ln e 2
The computation of the maximum tangential friction adheres to the Coulomb friction criterion, with adjustments made to the tangential normal force based on the bonding force specified in this equation:
f c t u f h y s + k a d h δ n f 0
where f c t represents the maximum tangential friction and u denotes the friction coefficient.
In summary, when applying the EEPA contact model, the requisite input parameters include the Coefficient of Recovery (e), coefficient of static friction (μs), coefficient of rolling friction ( μ r), Constant pull-off force ( f 0 ), surface energy ( Δ γ ), Contact Plasticity Ratio (λρ), Tensile Exp (Rm), Slope Exp (n), and Tangential Stiff Multiplier (Ktm). It is crucial to utilize this set of parameters for the accurate implementation of the EEPA contact model. To streamline calibration, the value of f 0 is set to 0. The loading branch index can be either 1 or 1.5, with the latter being optional for a more precise representation of the nonlinear stress-strain properties of the soil. Therefore, the selection of n is recommended to be 1.5 [19].

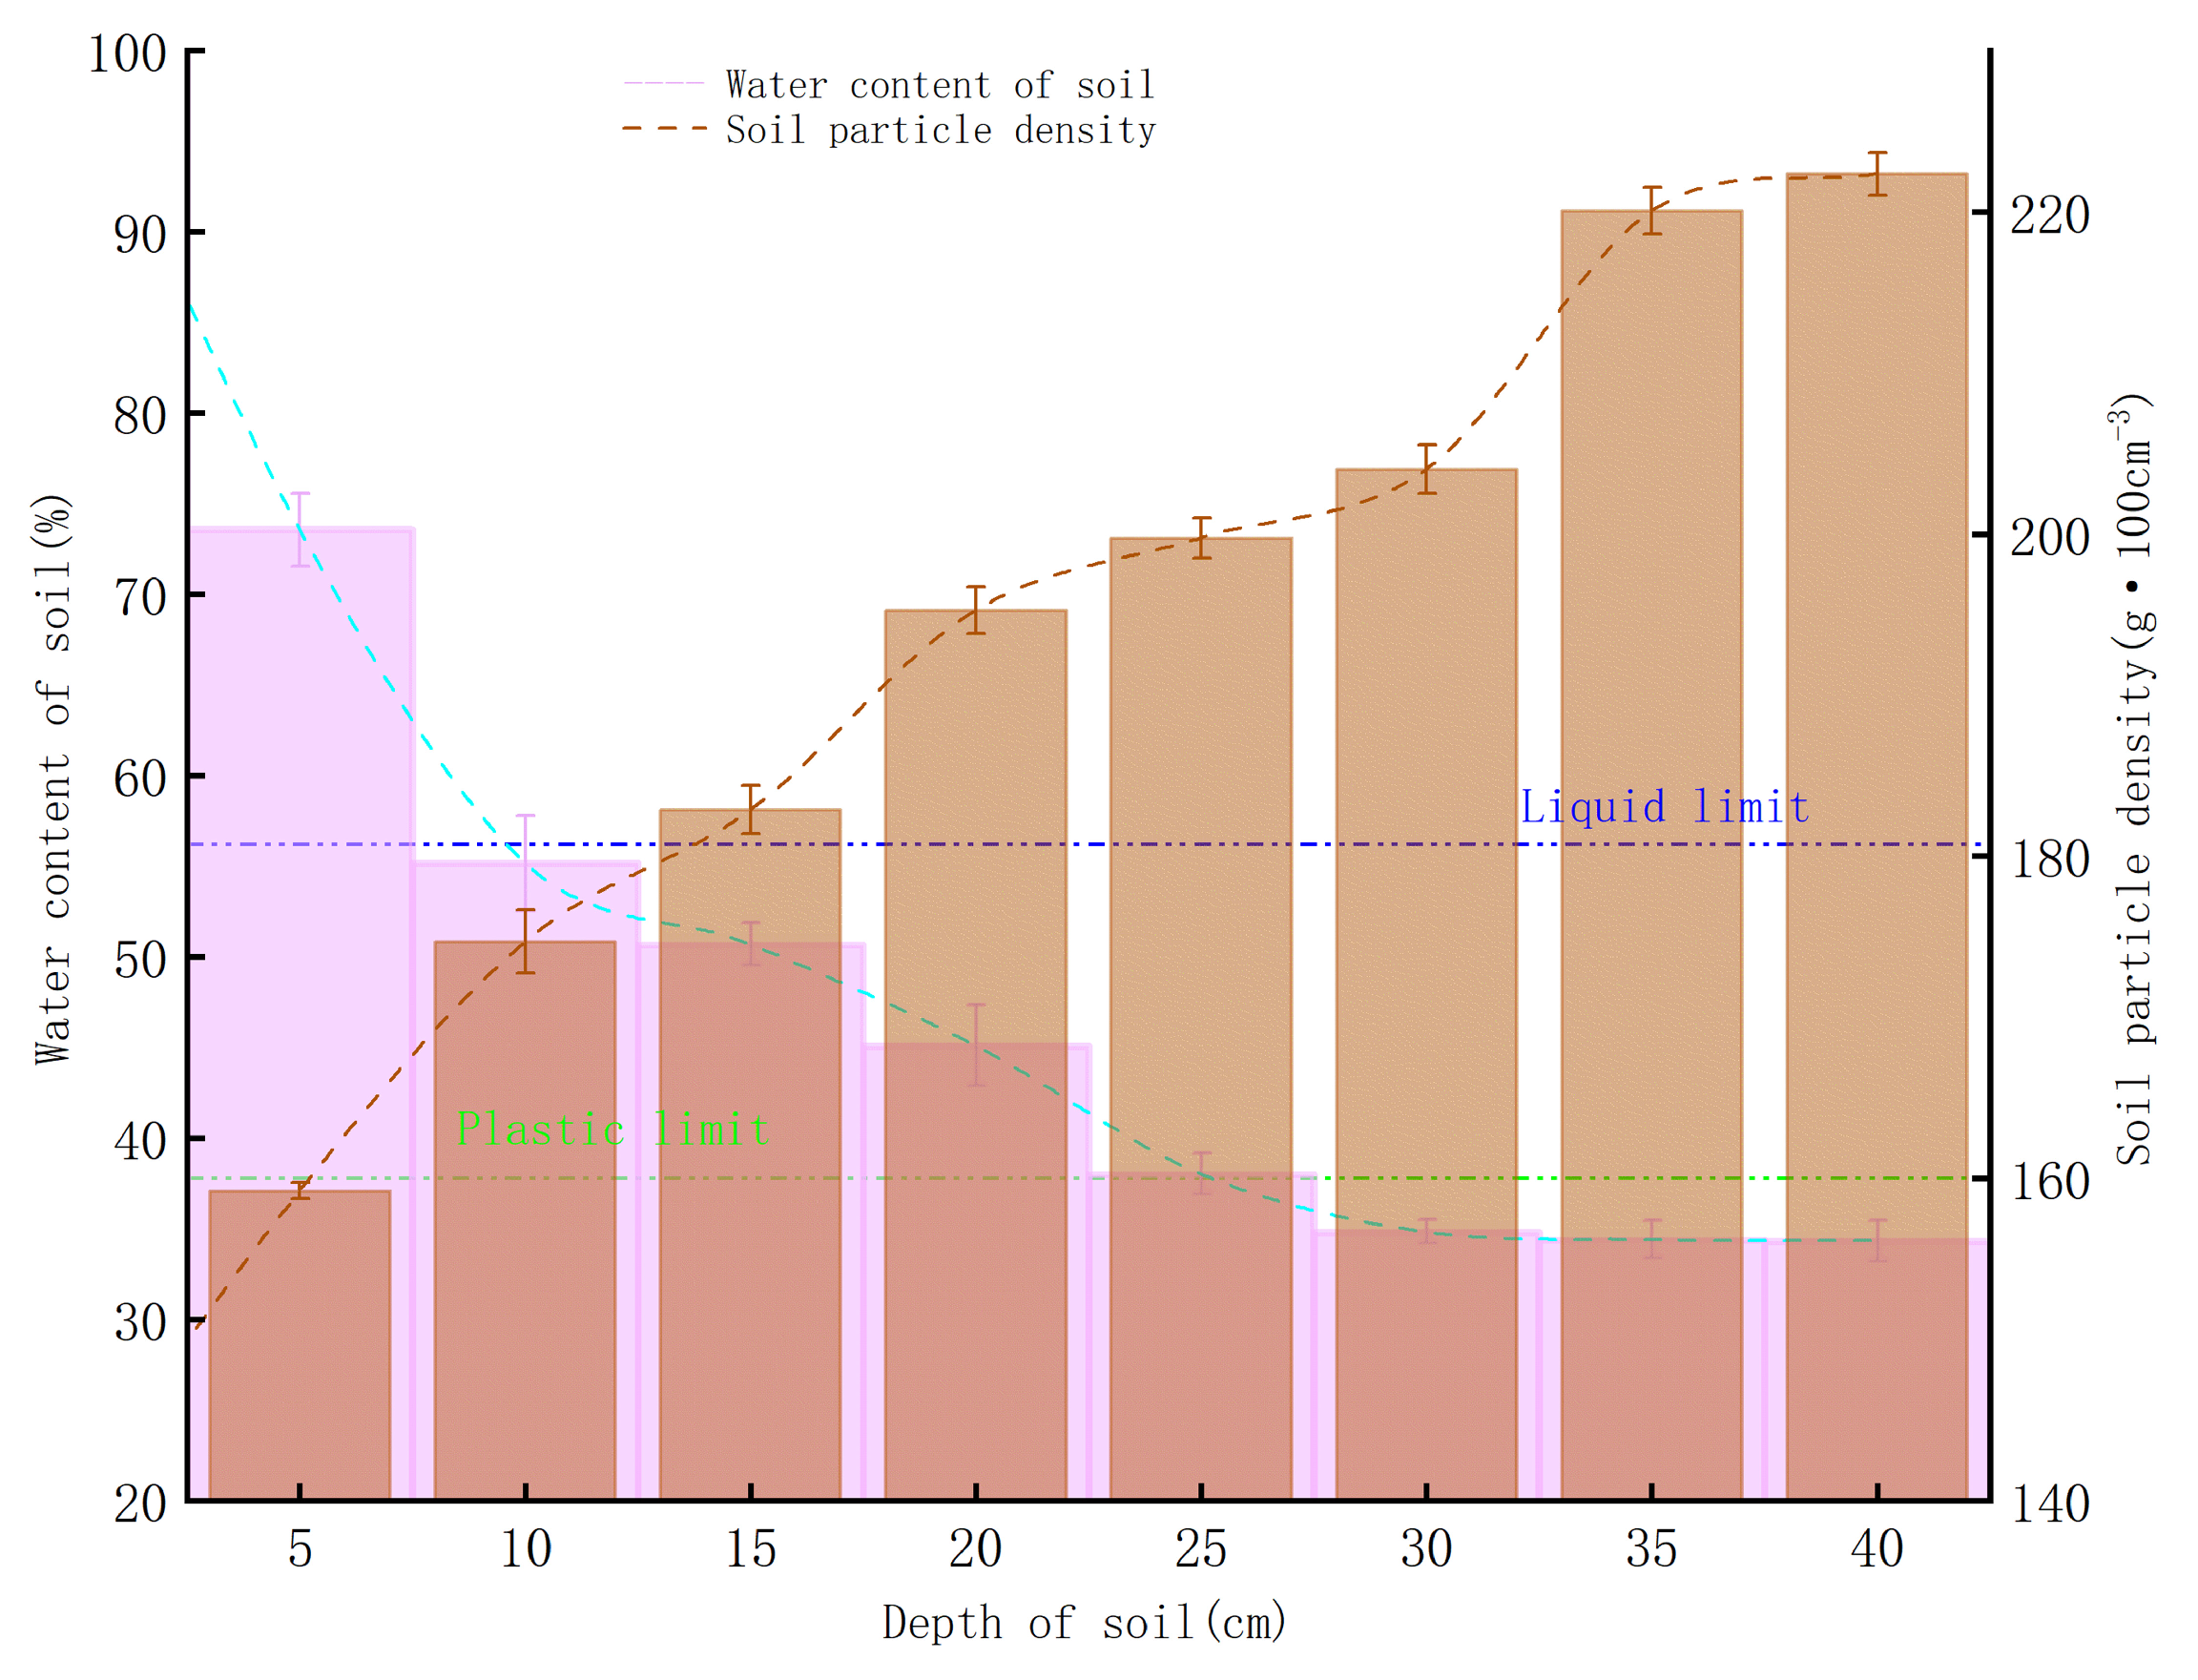
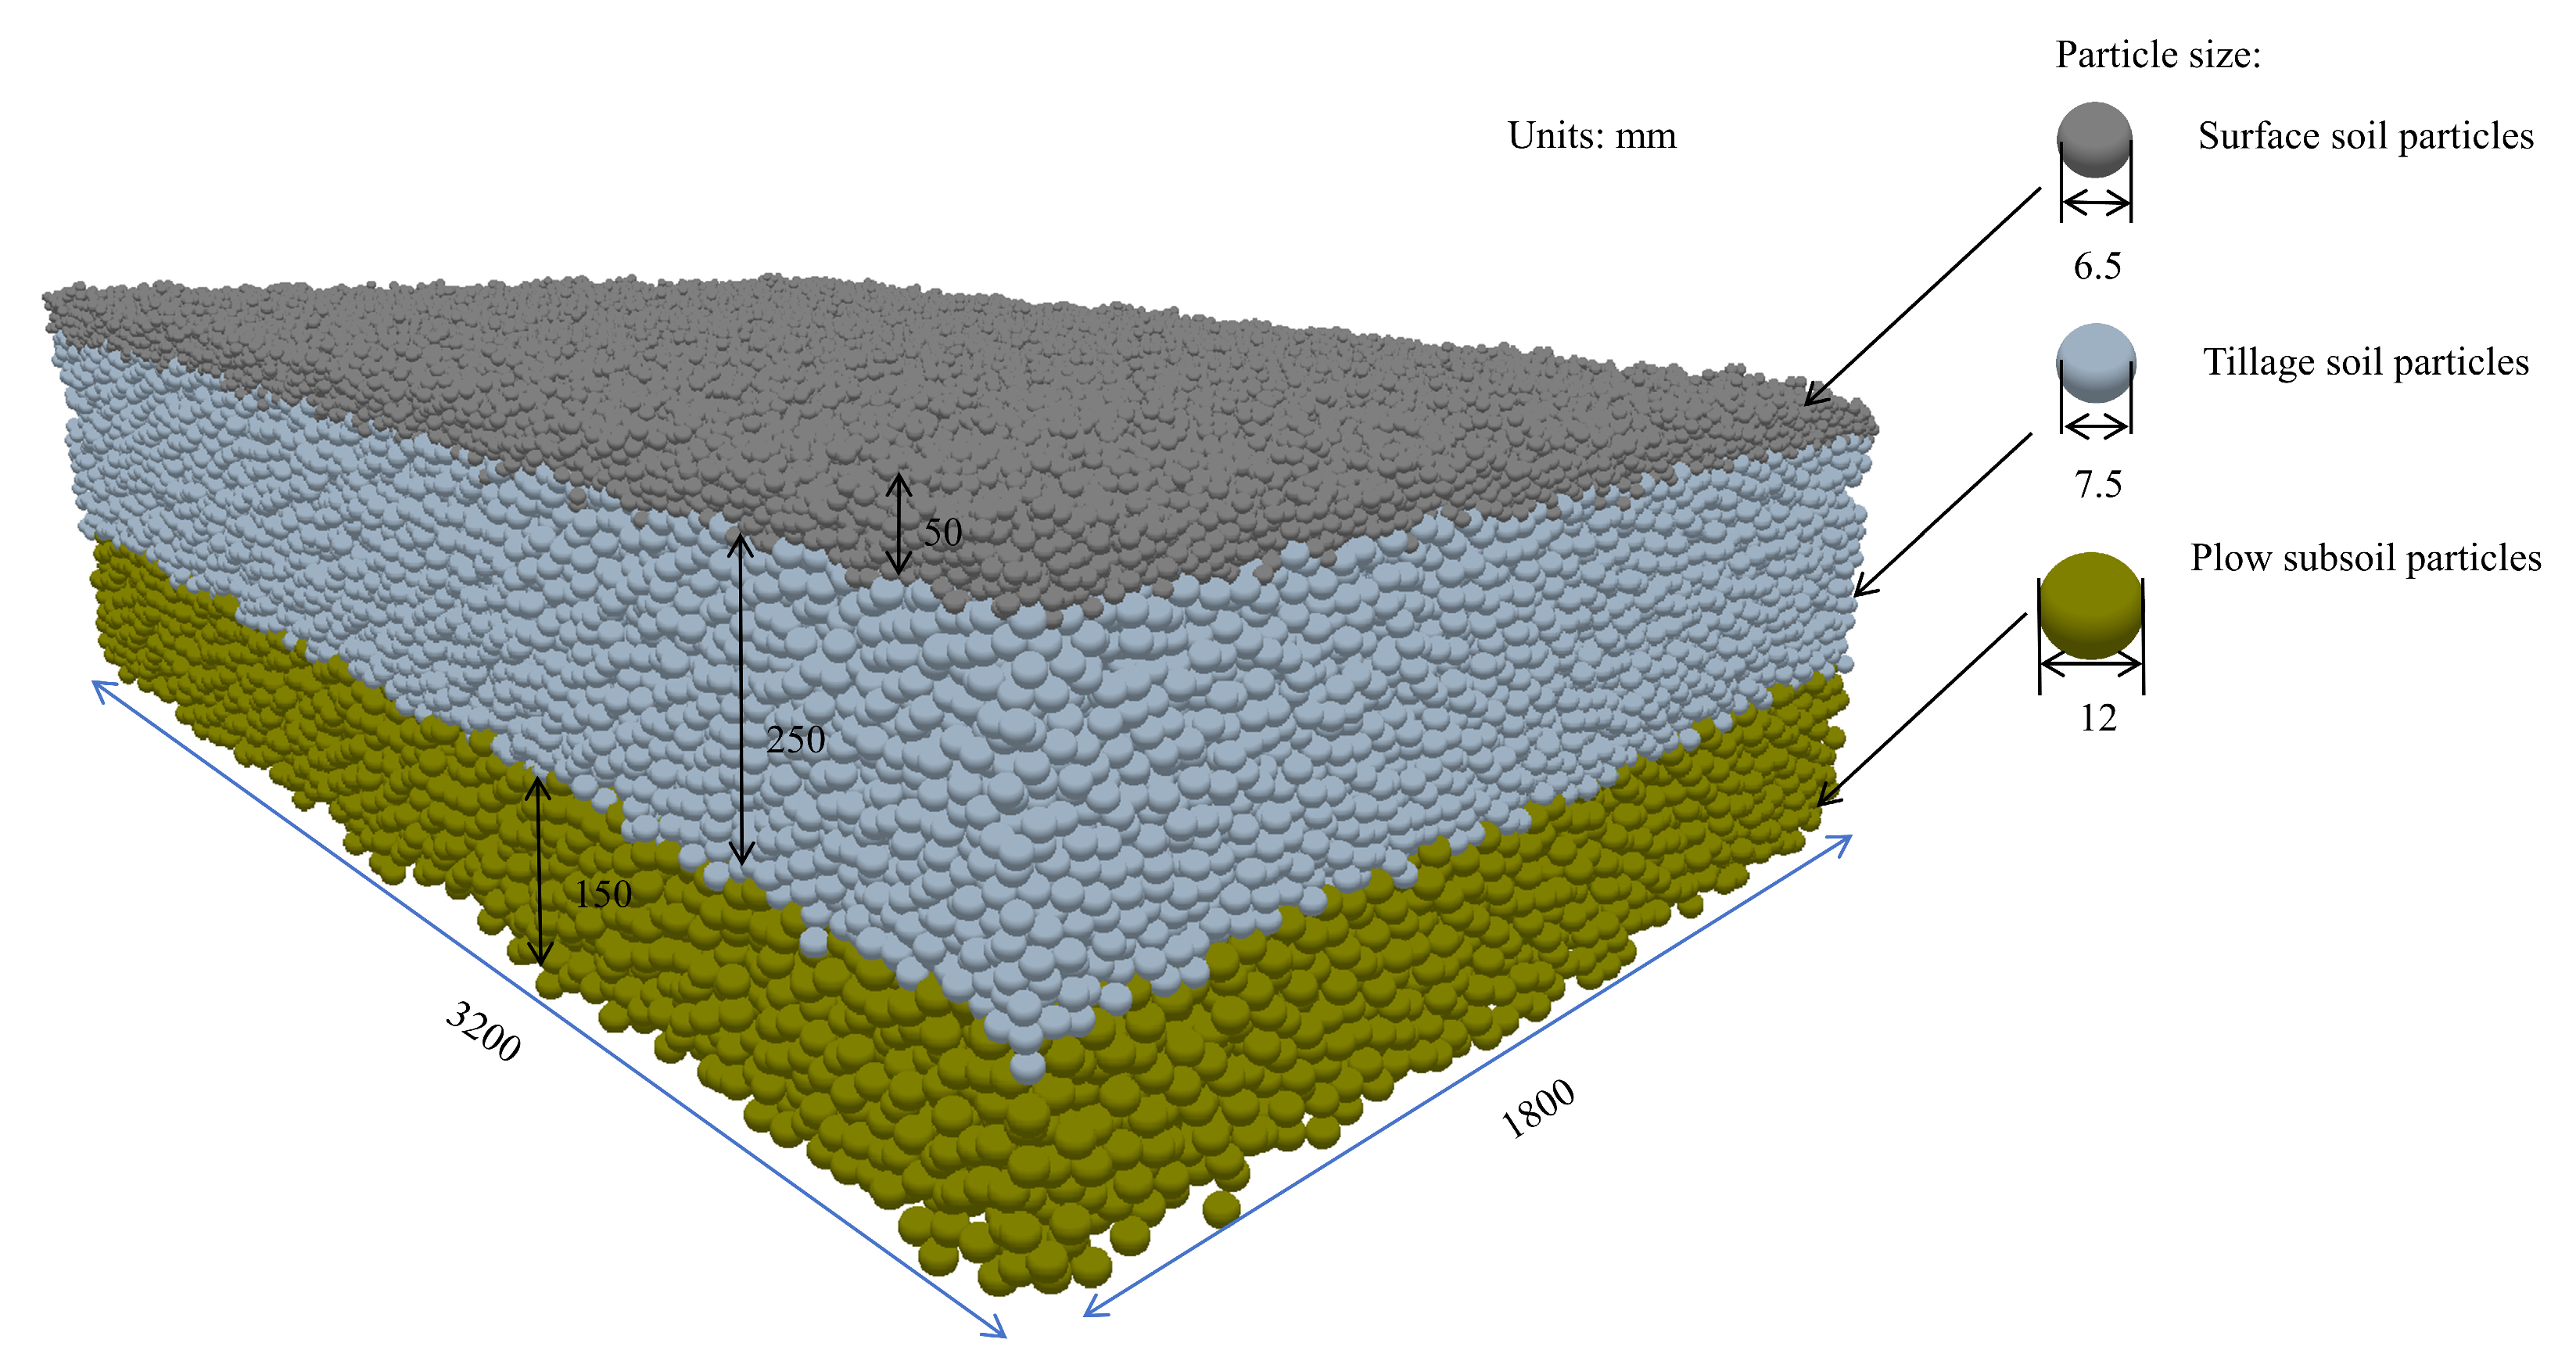
2.3. Characteristics of Soil Layers in Paddy Fields

2.3.1. Tillage Calibration Test

The angle of repose test is a common method for calibrating model parameters for discrete elements [20,21,22,23]; However, its applicability is limited in soils with high water content. Consequently, the slump test was chosen for its ability to provide a reliable representation of the soil’s cohesion, friction properties, and mobility. The testing apparatus, as illustrated in Figure 3, utilizes a slump barrel tester with a height of 300 mm, an upper diameter of 100 mm, and a lower diameter of 200 mm. Tillage layer soil samples are placed into the standard cone slump barrel according to the prescribed method and thoroughly scraped. The barrel is then lifted vertically, and the soil samples naturally slump due to gravity. The downward slumping is measured, with this dimension (mm) serving as the slump, indicating fluidity, where a larger slump signifies better fluidity.
The simulation parameters for the slump test are detailed in Table 1, with the EEPA contact model chosen for particle-particle contact. The particle-contact component is selected as the Hertz-Mindlin (no slip) contact model to simplify the simulation, with the contact component and particle viscosity factor excluded. The simulation generates particles to fill a cylinder that is 300 mm in height and has an upper diameter of 100 mm and a lower diameter of 200 mm. The cylinder is raised at a rate of 30 mm/s. The simulation concludes once the particles cease movement, and the slump is determined by measuring the cylinder’s height and calculating H = 300 − h.

2.3.2. Calibration Test for Plough Base Layer

As the machine traverses the paddy field, it compacts the soil particles, inducing plastic deformation and generating reaction forces toward the wheels. When subjected to the uniaxial confined compression test, the soil undergoes elastic-plastic deformations, resulting in an axial stress-strain curve that reflects the load-bearing characteristics of the subsoil under the plough.
In the experiment, a soil specimen was placed into a 45 mm diameter cylinder and tested using a WD-E precision micro-control electronic universal testing machine. The pressure disc was connected to the pressure meter of the universal tester and subjected to a constant downward load of 10 mm/s. The load pressure was recorded when the downward compression depth reached 8 mm. Subsequently, the original sample was extracted, and the axial stress-strain chart was generated using the universal testing machine (Figure 4a).
For the axial compression simulation test, the simulation parameters are outlined in Table 1. A cylindrical model with a height of 250 mm and a bottom diameter of 45 mm (adjusted from the actual testing cylinder height of 100 mm) is simulated, as depicted in Figure 4b. The loading rate is maintained at 10 mm/s, consistent with the actual rate. The platen halts downward motion when the cylinder particles are compressed to 102 mm, and the axial stress-strain curves are obtained through the post-processing function of EDEM.

2.4. Significance of DEM Parameters on Particle Response

Considering the characteristics of the EEPA contact model, the associated parameters underwent screening via a Plackett–Burman test. Viscous and elastic-plastic indicators were employed as response values during the simulation test. The levels of each of the seven factors were established, as outlined in Table 2. Additionally, four virtual parameters were included for blank control error analysis, with each parameter assuming both high and low levels within its range of values.

2.5. Center Composite Design Experiment

The Central Composite Design (CCD) employs a 2-level factorial design with extra centroids and axial points to fit a quadratic model. The conventional CCD typically comprises five levels for each factor, but this can be adjusted by selecting an axial distance of 1.0, resulting in a centered composite design on the face with only three levels per factor. Reproducing the centroid enhances the accuracy of predictive capabilities in the vicinity of the factor space’s center. CCD experiments were conducted with the simulation parameters to anticipate the correlation between the particles’ physical features and the key factors influencing the Discrete Element Method (DEM) parameters. The simulation setup remained consistent with the description in Section 2.3, and the coding tables for the compression test factor levels are presented in Table 3, while the coding table for the axial compression test factor levels is shown in Table 4.

3. Results

3.1. Measurements of Soil Physical Parameters

The settlement test was replicated three times in Section 2.3.1 with a settlement (H) of 140 mm, as illustrated in Figure 3a. Additionally, in Section 2.3.2, the axial pressure was recorded at 180.24 N when the soil sample was compressed to 8 mm, as depicted in Figure 4b. The outcomes of these two sets of tests serve as the target response values calibrated to the simulation parameters.

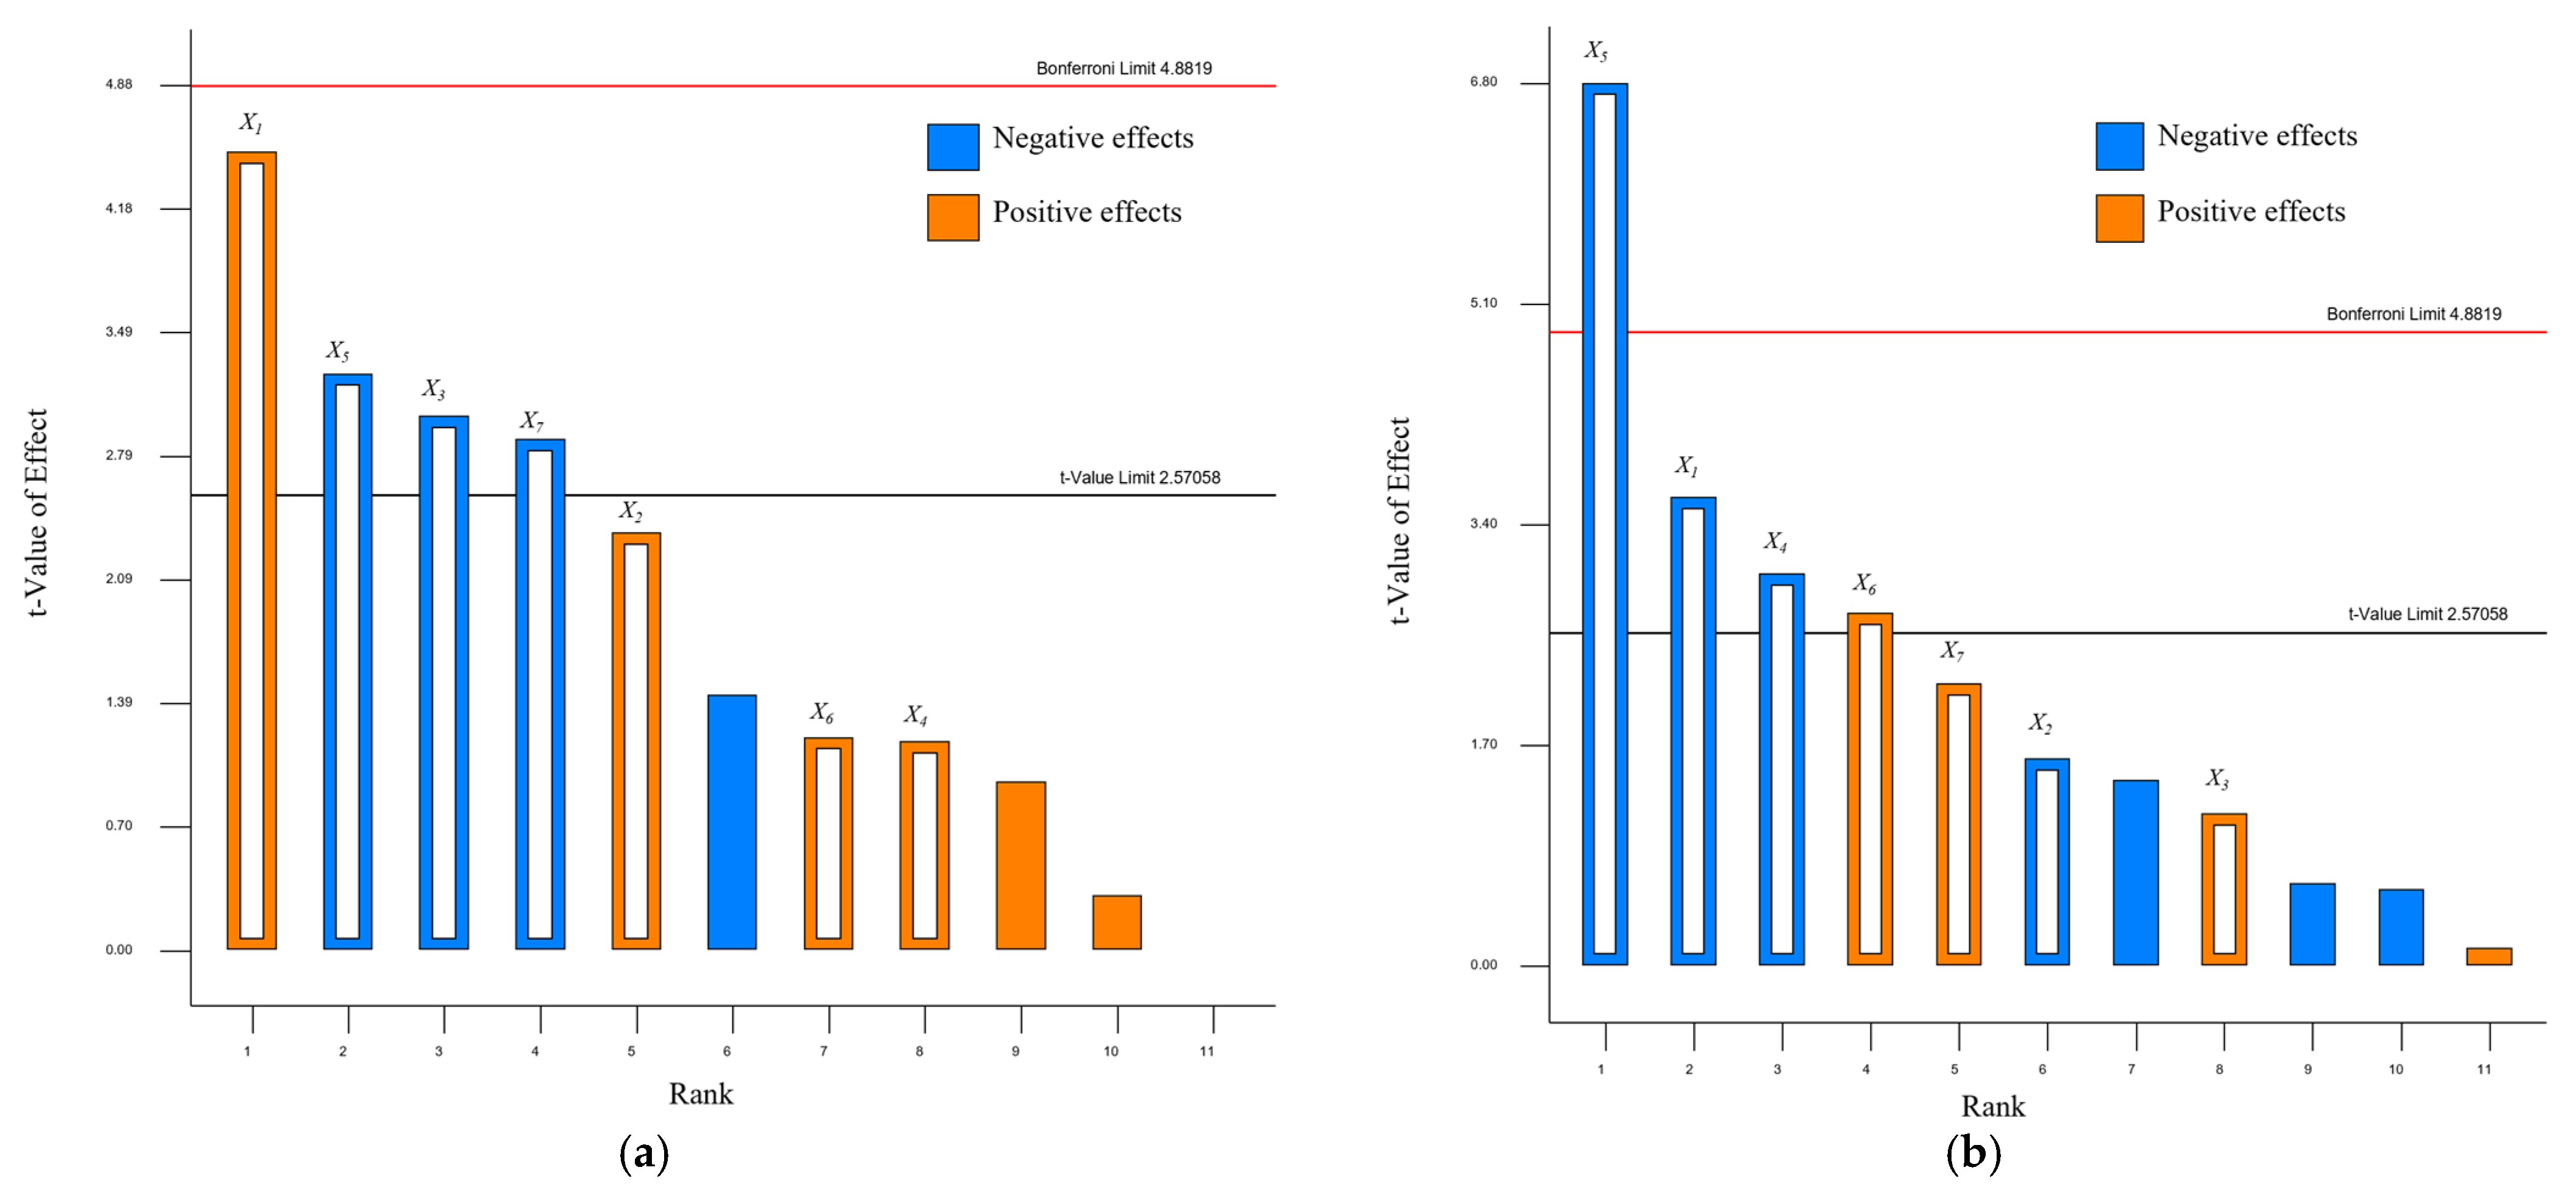
3.2. Significance of the Effect of DEM Parameters on Particles

The results of the Plackett–Burman test were analyzed using Design-Expert_10 software to generate Pareto plots and elucidate the impact of Discrete Element Method (DEM) parameters on the response values. A DEM parameter is deemed to have a highly significant effect on the response value when its contribution surpasses the Bonferroni limit. Conversely, it has almost no effect when its contribution falls below the t-value limit.
Figure 5 illustrates that the Coefficient of Restitution, Contact Plasticity Ratio, coefficient of rolling friction, and Tangential Stiff Multiplier exhibit significance for axial compression. Additionally, the Contact Plasticity Ratio is highly significant for deflection, while the Coefficient of Restitution, surface energy, Contact Plasticity Ratio, and Tensile Exp are significant for slump. The coefficient of static friction has a minimal effect on both axial pressure and deflection. Consequently, the Coefficient of Restitution, Contact Plasticity Ratio, coefficient of rolling friction, and Tangential Stiff Multiplier were utilized as independent parameter variables to predict axial pressure variation. Moreover, the Coefficient of Restitution, surface energy, Contact Plasticity Ratio, and Tensile Exp were used as single parameter variables to predict changes in slump.

3.3. Calibration Parameters

3.3.1. Tillage Parameters

Quadratic multiple regression analysis, conducted with Design Expert software, was employed to generate response surfaces and contour plots (Figure 6) depicting the interactions among parameters influencing the sink. In Figure 6a, the impact of the X1X4 interaction on the sink is illustrated. The response surface curve for X1 is steeper than that of X4, and the contour density along X1 is slightly higher than the density along X4. This observation signifies that X1 has a more substantial effect on the sink.
For the experimental results presented in Table 5, the regression equation was retained using Design Expert software under the condition of non-significance (p > 0.05) in the Analysis of Variance (ANOVA):
S = 134.61159 + 220.47096 X 1 + 2.60565 X 4 17.56948 X 5 + 10.48493 X 6 10.52633 X 1 X 4 623.2684 X 1 X 5 + 21.09022 X 1 X 6 3.94737 X 4 X 5 + 0.2 X 4 X 6 21.05263 X 5 X 6 + 67.54763 X 1 2
where S is the slump.
By solving Equation (8) with the measured S as the objective, 73 sets of solutions were obtained. These solutions are essentially indistinguishable from each other. Utilizing the desirability values as a reference, a set of parameters X1 = 0.49, X4 = 18.52 J/m2, X5 = 0.45, and X6 = 3.74 is selected, as it has the desirability values closest to 1, indicating the highest degree of reliability.

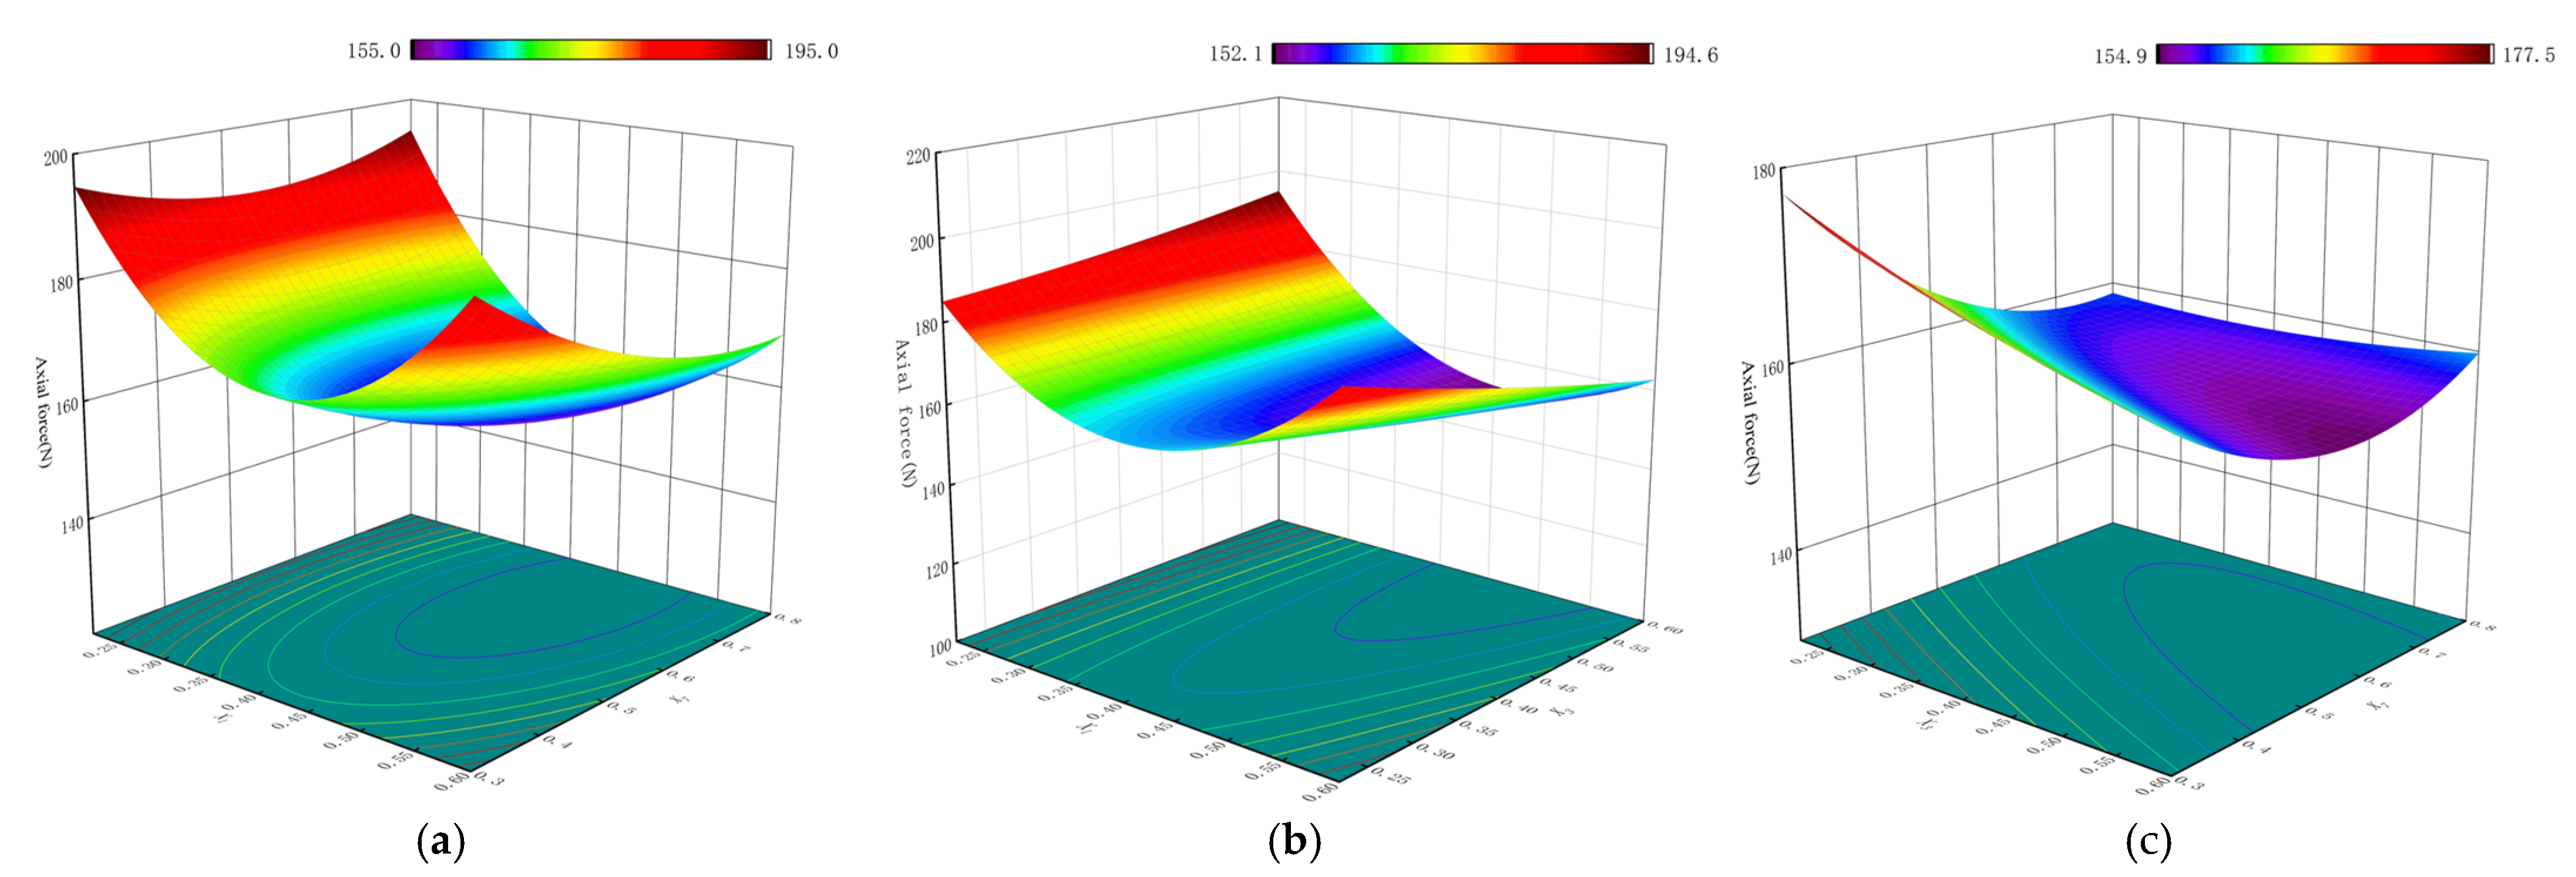
3.3.2. Parameters of the Plough Substrate

Quadratic multiple regression analysis, facilitated by Design Expert software, was employed to create response surfaces and contour plots illustrating the interactions among parameters influencing slump (Figure 7). For the experimental results detailed in Table 6, the regression equation was retained using Design Expert software under the condition of non-significance (p > 0.05) in the Analysis of Variance (ANOVA):
F = 440.9886 498.1707 X 1 293.14681 X 3 120.85088 X 5 116.49822 X 7 70.34421 X 1 X 3 165.56581 X 1 X 5 58.54055 X 1 X 7 + 36.90254 X 3 X 5 89 . 76986 X 3 X 7 137.86172 X 5 X 7 + 704.06121 X 1 2 + 704.06121 X 3 2 + 83.69084 X 5 2 + 77.56852 X 7 2
where F is the axial pressure.
Several sets of solutions are obtained by solving Equation (9) with the measured F objective. These solutions are almost indistinguishable from each other, and using the desirability values as a reference, a set of parameters X1 = 0.47, X3 = 0.48, X5 = 0.32, and X7 = 0.31 is chosen, as it possesses desirability values closest to 1, signifying the highest reliability.

3.4. Simulation Verification of an Optimal Parameter Set

Discrete element simulation modeling was conducted using EDEM2021 software, leveraging the outcomes of cohesion and elastic-plastic parameter calibration tests. To assess the precision of the calibration results, slump and axial compression tests were executed. The slump measured 143 mm, with a minimal error of only 2.14%, while the axial compression registered 175.613 N, with an error of merely 2.57%. These results suggest that a combination of significance analysis and the response surface method can effectively optimize the physical parameters of soil particle simulation.

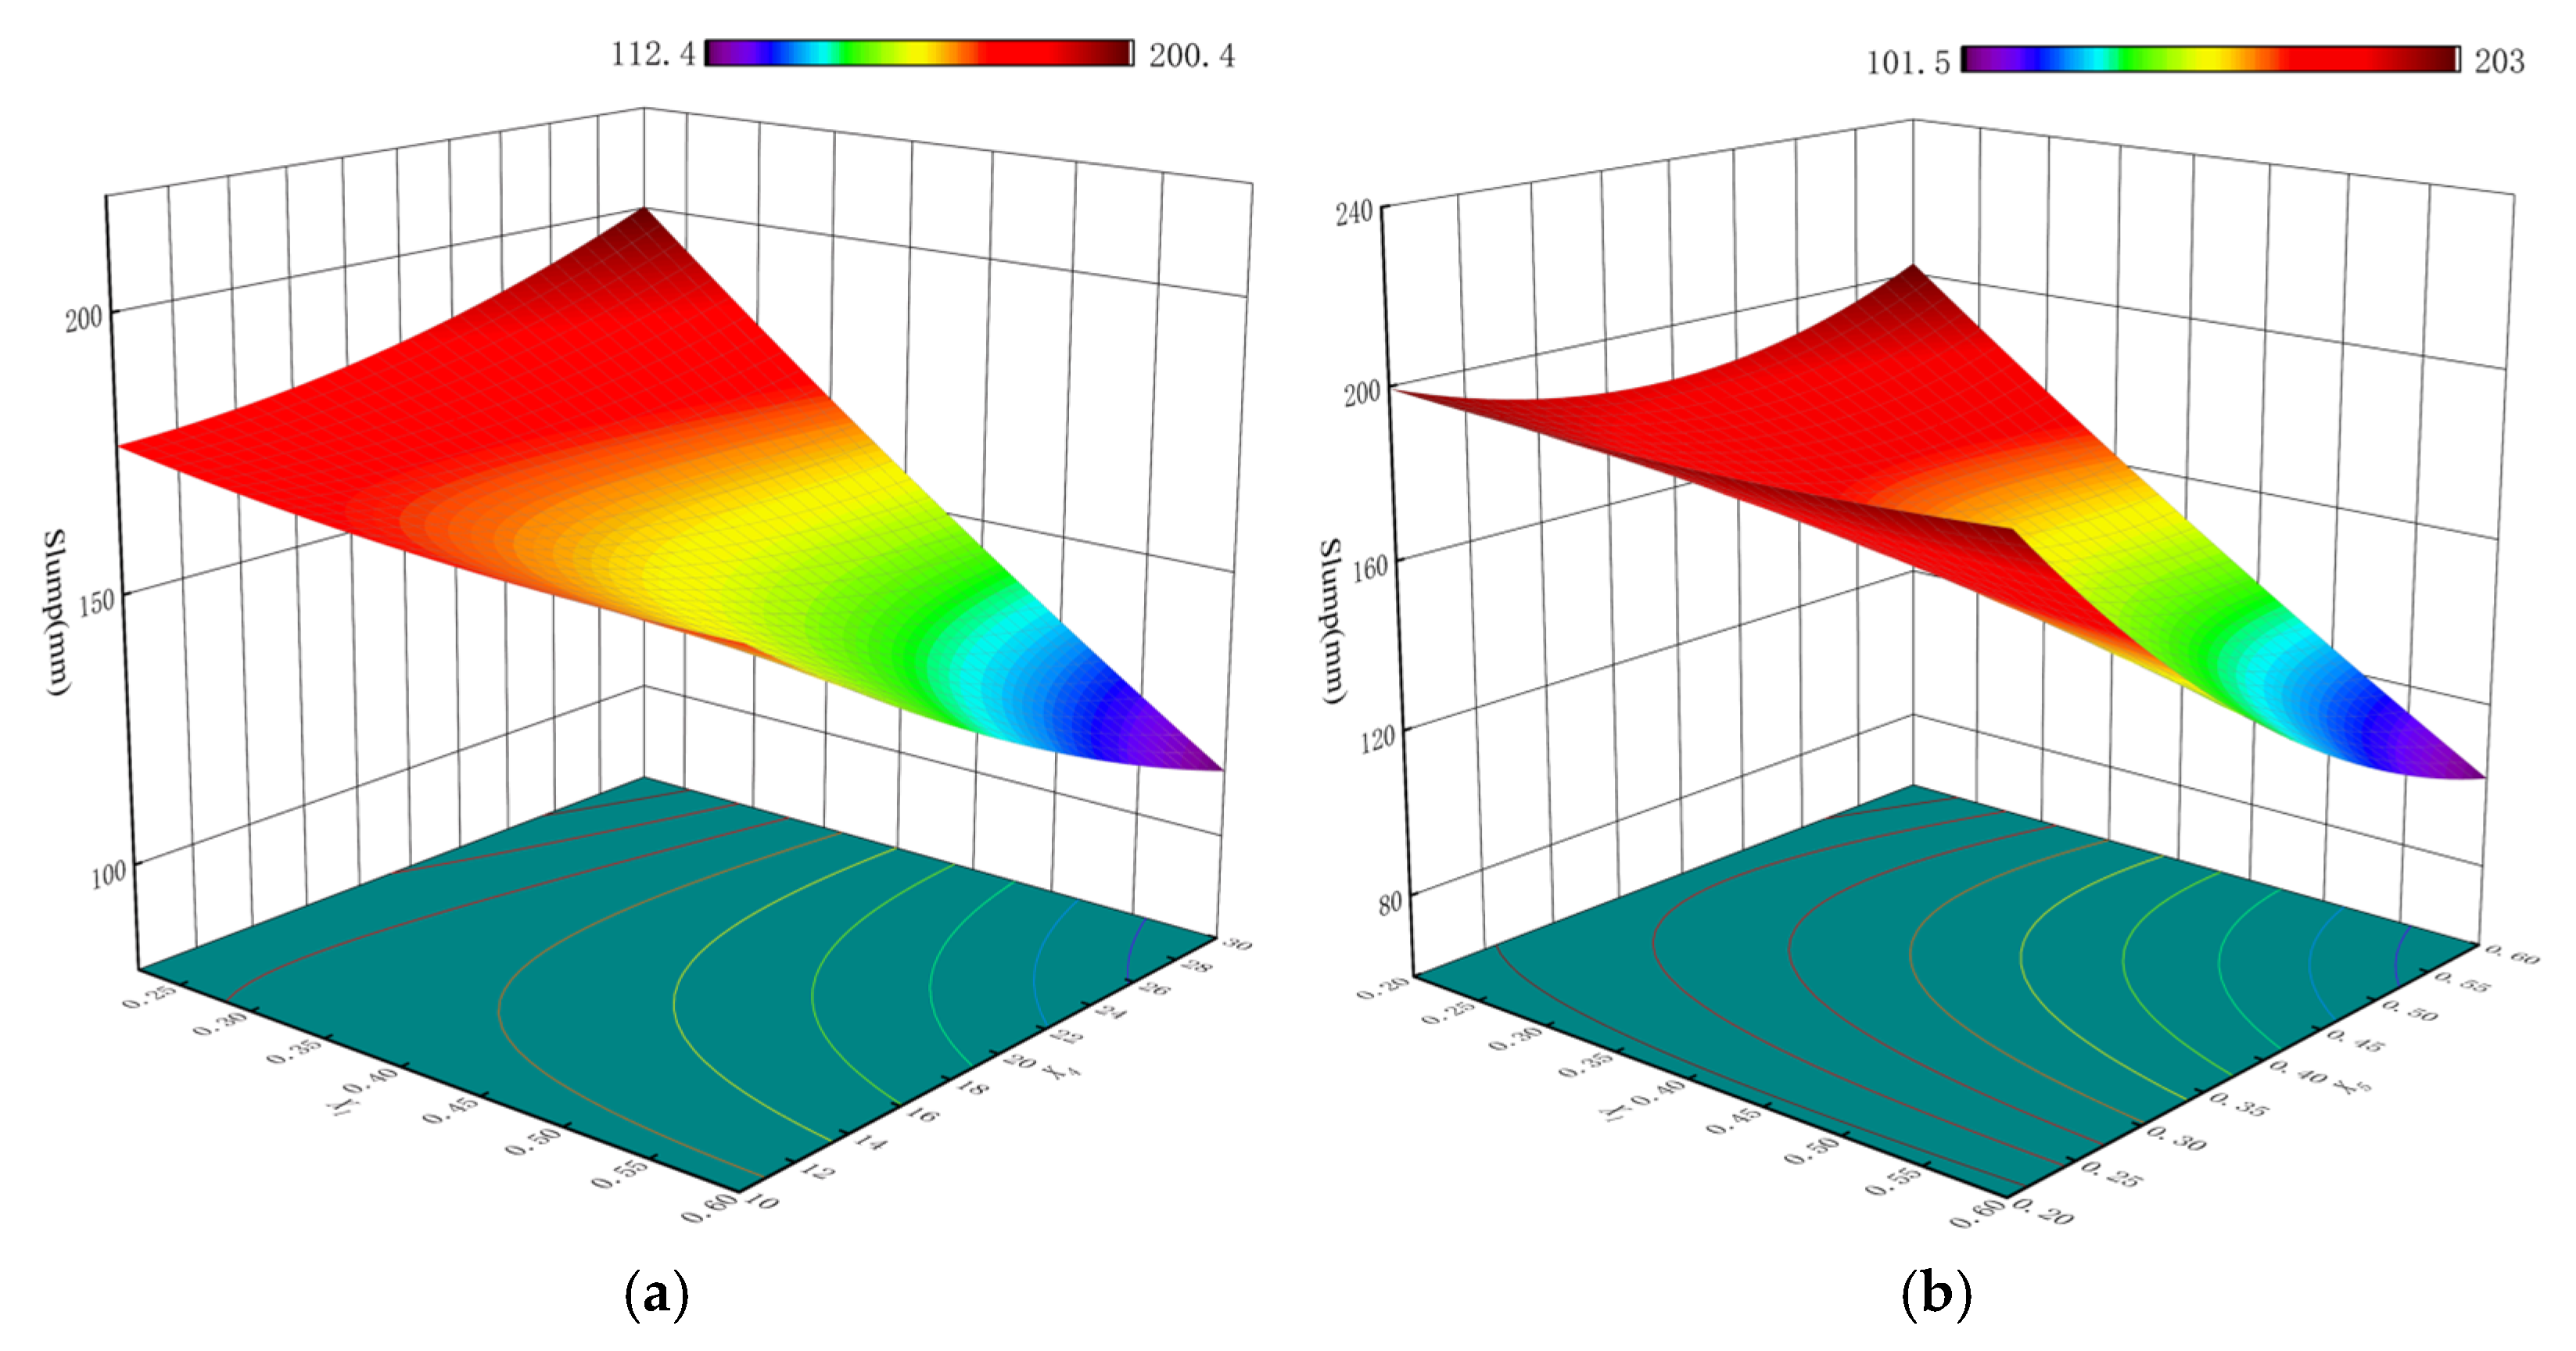
3.5. Simulation Results and Discussion

3.5.1. DEM Modelling

The soil layer in the paddy field is primarily divided into three layers, necessitating the establishment of a three-layer DEM model. The tillage layer and the plough subsoil layer directly interact with agricultural equipment and carriers. The tillage layer has a thickness of 180–220 mm, the plough subsoil layer ranges from 60–100 mm, and the combined thickness of the two layers is 240–320 mm. For ease of observing mechanical-particle interactions, minimizing soil particle extrusion by the soil trough shell, and optimizing computational efficiency, the soil trough dimensions were set to length: 3200 mm and width: 1800 mm, as depicted in Figure 8. This configuration is designed to establish a DEM model suitable for clay loam soils in South China.

3.5.2. Testing for Model Validation

To further validate that the discrete element particle model, constructed after parameter optimization, accurately reflects the physico-mechanical parameters of actual field soils, the cone penetration test is employed. Cone penetration is a highly intuitive indicator of the overall mechanical properties of the soil. This test, in conjunction with soil trench field tests and discrete element simulation tests [26], enables a comprehensive assessment. Therefore, the relative error value between the measured value and the simulation result in the cone penetration test is utilized to judge the accuracy of the discrete element particle model (Figure 9).
Compaction tests were conducted to validate the mechanical accuracy of the constructed discrete element model. A soil stiffness meter was utilized to measure the stiffness at various soil depths (0–40 cm), with data collected from five points in the test field and averaged. In EDEM, a 1:1 soil compactometer probe model was imported, and the probe was positioned on the surface of the soil particles with a descent rate of 30 mm/s2. At the conclusion of the simulation test, the total contact force between the probe model and the soil particles in the vertical direction was exported to the post-processing module. The comparison results revealed no significant difference in tightness, affirming the suitability of this DEM model for the test field.

4. Discussion

(1) The static and rolling friction coefficients between soil particles play a pivotal role in shaping their behavior. Wang et al. [27] established a method for acquiring the coefficient of static friction between particles and plates using a platform. However, determining the static and rolling friction coefficients in particle-particle interactions through experimental means poses challenges. To enhance simulation accuracy and alleviate computational demands, a common strategy is to select a subset of crucial parameters. Su et al. [28] found that the combination of factors is a significant parameter for designing experiments using Plackett–Burman.
Initially, we employed the Plackett–Burman experiment to identify the noteworthy influencing factors. Subsequently, we determined specific parameter values using the Central Composite Design (CCD) method. The study underscores that the rolling friction coefficient between soil particles significantly impacts axial pressure, while none of the static friction coefficients exert a notable effect. The parameters governing soil particle interactions were discerned through a blend of experimental measurements and simulation optimization.
(2) The angle of repose test is a widely employed method for calibrating discrete elemental model parameters [20,21,22,23]. Nevertheless, its applicability is constrained when dealing with soils characterized by high water content, primarily due to inherent limitations. Zhou’s [16] findings revealed that the slump test is an accurate calibration method for soils with high water content. Consequently, we selected this test method for calibrating soils with high water content in the till layer. However, in our approach, we chose the EEPA contact model over the JKR contact model. The discrete element slump simulation, calibrated through the Plackett–Burman test and the Central Composite Design (CCD), exhibited a relative error of 2.14% compared to the actual test results. This confirms the suitability of the obtained parameters for constructing the discrete element model. To ensure accurate representation of soil particles, validation of the physical and mechanical parameters of the model was conducted through cone penetration testing, performed subsequent to the establishment of the DEM simulation model.

5. Conclusions

In this study, the parameters of the soil layer EEPA model were calibrated using the Plackett–Burman test and the quadratic rotated orthogonal test. The results of the calibration and validation tests were analyzed, leading to the following conclusions:
(1)
The results of the Plackett–Burman test showed that the Coefficient of Restitution, Contact Plasticity Ratio, coefficient of rolling friction, and Tangential Stiff Multiplier in the contact model were significant for axial pressure. Contact Plasticity Ratio was highly significant for deflection. The Coefficient of Restitution, surface energy, Contact Plasticity Ratio, and Tensile Exp were significant for deflection. The coefficient of static friction had almost no effect on axial pressure and slump.
(2)
The regression model was solved and fitted to the measured values to give the Coefficient of Restitution, Contact Plasticity Ratio, Tensile Exp, and surface energy of 0.49, 0.45, 3.74, and 18.52 J/m2, respectively; The Coefficient of Restitution, Contact Plasticity Ratio, coefficient of rolling friction, and Tangential Stiff Multiplier were 0.47, 0.49, 0.32, and 0.31, respectively. The slump obtained through constructing the discrete element soil model with the optimal parameter set exhibits a relative error of 2.14% compared to the measured value, while the axial pressure demonstrates a relative error of 2.57% from the measured value.
(3)
The optimized discrete element model underwent cone penetration tests and validation through field trials. The results of the validation test revealed no significant difference in soil particle compactness, indicating that the model can accurately simulate soil mechanical properties. This model serves as a valuable reference for further research on the dynamic characteristics of the entire traveling wheel of high-speed precision seeding machinery in paddy fields.
This study makes a significant contribution to the ongoing research on constructing a soil model for paddy fields and analyzing the kinetic characteristics of the entire walking wheel of high-speed precision seeding machinery in paddy fields. Its specific emphasis lies in investigating the mechanical characteristics and physical traits of soil particles during the operational process of agricultural machinery. However, the primary focus of this paper is on presenting a method for constructing a discrete element particle contact model for soil and calibrating its parameters. It’s noteworthy that the model parameters exhibit complexity and variability across different soil properties and water content conditions in various regions. Therefore, reconstruction and calibration become essential, considering factors such as soil type, particle size composition, and water content.

Author Contributions

Conceptualization, P.Z., W.J., W.Y., J.H., E.Z., D.Y., J.C., F.P., G.Z., C.Z., S.Z., B.G., Y.X., H.P. and Z.W.; methodology, P.Z. and W.J.; software, P.Z. and W.J.; validation, Z.W.; investigation, P.Z. and Z.W.; writing—original draft preparation, P.Z. and W.J.; writing-review and editing, P.Z., W.J., W.Y. and Z.W. formal analysis, P.Z. and W.J.; supervision, D.Y., Y.X., B.G., J.H., and G.Z.; project administration, Z.W. and J.H.; funding acquisition, Z.W. All authors have read and agreed to the published version of the manuscript.

Funding

The Guangdong Basic and Applied Research Foundation (Grant No. 2020B1515020034) and the National Science Foundation of China (Grant No.32171903), supported by the earmarked found for CARS (Grant No. CARS-01).

Institutional Review Board Statement

Not applicable.

Data Availability Statement

The data reported in this study are contained within the article.

Conflicts of Interest

The authors declare no conflict of interest.

References

  1. Nawaz, A.; Rehman, A.U.; Rehman, A.; Ahmad, S.; Siddique, K.H.M.; Farooq, M. Increasing sustainability for rice production systems. J. Cereal Sci. 2022, 103, 103400. [Google Scholar] [CrossRef]
  2. Zhang, M.H.; Luo, X.W.; Wang, Z.M.; Wang, B.; Xue, Z. Optimization design and experiment of profiling and slide board mechanism of precision rice hill-drop drilling machine. Trans. Chin. Soc. Agric. Eng. 2017, 33, 18–26. [Google Scholar]
  3. Zeng, Z.W.; Ma, X.; Cao, X.L. Critical review of applications of discrete element method in agricultural engineering. Trans. Chin. Soc. Agric. Mach. 2021, 52, 1–20. [Google Scholar]
  4. Ding, Q.S.; Ren, J.; Belal, E.A. DEM Analysis of Subsoiling Process in Wet Clayey Paddy Soil. Trans. Chin. Soc. Agric. Mach. 2017, 48, 38–48. [Google Scholar]
  5. Li, F.Y.; Ma, X.; Tan, S.Y. Simulative Calibration and Experiment on Main Contact Parameters of Discrete Elements for Rice Bud Seeds. Trans. Chin. Soc. Agric. Mach. 2018, 49, 93–99, (In Chinese with English abstract). [Google Scholar]
  6. Zhao, J.K.; Ding, Q.S.; Zhang, W.Y. Coupling Analysis of Transplanter Wheel and Paddy Soil in Steering Process. Chin. J. Soil Sci. 2018, 49, 1319–1325. [Google Scholar]
  7. Mak, J.; Chen, Y.; Sadek, M.A. Determining parameters of a discrete element model for soil-tool interaction. Soil Tillage Res. 2012, 118, 117–122. [Google Scholar] [CrossRef]
  8. Li, B.; Chen, Y.; Chen, J. Modeling of soil-claw interaction using the discrete element method (DEM). Soil Tillage Res. 2016, 158, 177–185. [Google Scholar] [CrossRef]
  9. Chen, Y.; Munkholm, L.J.; Nyord, T. A discrete element model for soil-sweep interaction in three different soils. Soil Tillage Res. 2013, 126, 34–41. [Google Scholar] [CrossRef]
  10. Xiao, X.W.; Tan, Y.Q.; Zhang, H. Experimental and DEM studies on the particle mixing performance in rotating drums: Effect of area ratio. Powder Technol. 2017, 314, 182–194. [Google Scholar] [CrossRef]
  11. Liu, W.Z.; He, J.; Li, H.W. Calibration of Simulation Parameters for Potato Minituber Based on EDEM. Trans. Chin. Soc. Agric. Mach. 2018, 49, 125–135. [Google Scholar]
  12. Shi, L.R.; Zhao, W.Y.; Sun, W. Parameter calibration of soil particles contact model of farmland soil in northwest arid region based on discrete element method. Trans. Chin. Soc. Agric. Eng. 2017, 33, 181–187. [Google Scholar]
  13. Zhang, R.; Han, D.L.; Ji, Q.L. Calibration methods of sandy soil parameters in simulation of discrete element method. Trans. Chin. Soc. Agric. Mach. 2017, 48, 49–56. [Google Scholar]
  14. Li, J.W.; Tong, J.; Hu, B. Calibration of parameters of interaction between clayey black soil with different moisture content and soil-engaging component in northeast China. Trans. Chin. Soc. Agric. Eng. 2019, 35, 130–140. [Google Scholar]
  15. Xiang, W.; Wu, M.L.; Lü, J.N. Calibration of simulation physical parameters of clay loam based on soil accumulation test. Trans. Chin. Soc. Agric. Eng. 2019, 35, 116–123. [Google Scholar]
  16. Zhou, H.; Zhou, T.M.; Wang, X.Z. Determination of Discrete Element Modelling Parameters of a Paddy Soil with a High Moisture Content (>40%). Agriculture 2022, 12, 2000. [Google Scholar] [CrossRef]
  17. Xie, F.P.; Wu, Z.Y.; Wang, X.S. Calibration of discrete element parameters of soils based on unconfined compressive strength test. Trans. Chin. Soc. Agric. Eng. 2020, 39, 39–47. [Google Scholar]
  18. Thakur, S.C.; Morrissey, J.P.; Sun, J. Micromechanical analysis of cohesive granular materials using the discrete element method with an adhesive elasto-plastic contact model. Granul. Matter 2014, 16, 383–400. [Google Scholar] [CrossRef]
  19. Wang, X.L.; Zhong, X.K.; Geng, Y.L. Construction and parameter calibration of the nonlinear elastoplastic discrete element model for no-tillage soil compaction. Trans. Chin. Soc. Agric. Eng. 2021, 37, 100–107. [Google Scholar]
  20. Long, Q.; Ying, C.; Mohammad, S. Simulations of soil flow properties using the discrete element method (DEM). Comput. Electron. Agric. 2019, 157, 254–260. [Google Scholar]
  21. Thomas, R.; André, K. DEM parameter calibration of cohesive bulk materials using a simple angle of repose test. Particuology 2019, 45, 105–115. [Google Scholar]
  22. Marcos, A.M.; José, M.F.; Francisco, A. Determination of the Angle of Repose and Coefficient of Rolling Friction for Wood Pellets. Agronomy 2022, 12, 424. [Google Scholar]
  23. Ren, J.H.; Wu, T.; Mo, W.Y. Discrete Element Simulation Modeling Method and Parameters Calibration of Sugarcane Leaves. Agronomy 2022, 12, 1796. [Google Scholar] [CrossRef]
  24. Wu, Z.Y.; Wang, X.S.; Liu, D.W. Calibration of discrete element parameters and experimental verification for modelling subsurface soils. Biosyst. Eng. 2021, 212, 215–227. [Google Scholar] [CrossRef]
  25. Choi, S.R.; Bansal, N.P. Mechanical Properties of SOFC Sealglass Composites; John Wiley & Sons: Hoboken, NJ, USA, 2008. [Google Scholar]
  26. Poulsen, R.; Nielsen, B.N.; Ibsen, L.B. Correlation between cone penetration rate and measured cone penetration parameters in silty soils. In Proceedings of the 18th International Conference on Soil Melchanics and Geotechnical Engineering (18th ICSMGE), Paris, France, 2–6 September 2013; Volume 1. [Google Scholar]
  27. Wang, S.; Yu, Z.H.; Aorigele; Zhang, W.J. Study on the modeling method of sunflower seed particles based on the discrete element method. Comput. Elect. Agric. 2022, 198, 107012. [Google Scholar] [CrossRef]
  28. Su, Y.; Xu, Y.; Cui, T.; Gao, X.J.; Xia, G.Y.; Li, Y.B.; Qiao, M.M. Determination and interpretation of bonded particle model parameters for simulation of maize kernels. Biosyst. Eng. 2021, 210, 193–205. [Google Scholar] [CrossRef]
Figure 1. Different soil depth parameters.
Agriculture 14 00118 g001
Figure 2. EEPA model normal contact force-nonlinear displacement relationship.
Agriculture 14 00118 g002
Figure 3. Slump test. (a) Actual test; (b) Simulation test.
Agriculture 14 00118 g003
Figure 4. Slump test. (a) Actual test axial force; (b) Axial compression simulation.
Agriculture 14 00118 g004
Figure 5. (a) Pareto chart of axial pressure response parameters. (b) Pareto chart of slump response parameters.
Agriculture 14 00118 g005
Figure 6. Interactions between parameters affecting slump. (a) X1X4; (b) X1X5.
Agriculture 14 00118 g006
Figure 7. Interactions between parameters affecting axial force. (a) X1X3; (b) X1X7; (c) X3–X7.
Agriculture 14 00118 g007
Figure 8. DEM simulation model.
Agriculture 14 00118 g008
Figure 9. Verification of mechanical properties.
Agriculture 14 00118 g009
Table 1. Simulation test parameters.
MaterialsParameterUnitValueSource
Tillage soil-soilPoisson’ s Ratio (ν) 0.3[9]
Solids Density ( ρ )g/cm31.7measurement
Shear Modulus (G)Pa5.0 × 105[9]
Plow subsoil—soilν 0.38[24]
ρ g/cm32.2measurement
GPa1.3 × 106measurement
EquipMlaterialν 0.3[25]
ρ g/cm31.2[25]
GPa3.16 × 109[25]
Tillage soil-soilCoefficient of Restitution e To be calibrated
Coefficient of static friction (μs) To be calibrated
Coefficient of rolling friction (μr) To be calibrated
Plow subsoil—soile To be calibrated
μs To be calibrated
μr To be calibrated
Soil-EquipMlateriale 0.3[15]
μs 0.6[15]
μr 0.1[15]
Contact modelSurface energy (∆γ) To be calibrated
Contact Plasticity Ratio ( λ ρ ) To be calibrated
Tensile Exp (Rm) To be calibrated
Tangential Stiff Multiplier (Ktm) To be calibrated
Table 2. Parameters of the Plackett–Burman test.
ParameterFactorsLevels
−11
X1Coefficient of Restitution0.20.6
X2coefficient of static friction0.30.9
X3coefficient of rolling friction0.20.6
X4surface energy1030
X5Contact Plasticity Ratio0.20.6
X6Tensile Exp1.54
X7Tangential Stiff Multiplier0.30.9
X8X11Virtual parameter————
Table 3. Factor level coding table for the quadratic orthogonal rotary combination test of the tillage layer.
LevelsX1X4X5X6
γ0.6834.140.684.5
10.6300.64
00.41200.412.75
−10.22100.221.5
γ0.145.860.140.98
Table 4. Factor level coding table for the quadratic orthogonal rotary combination test of the plow pan.
LevelsX1X3X5X7
γ0.680.680.680.95
10.60.60.60.9
00.410.410.410.6
−10.220.220.220.3
γ0.140.140.140.26
Table 5. Design and results of the quadratic orthogonal rotational combination test for the slump test.
No.X1X4X5X6Slump (mm)
10.22100.221.5195
20.6100.221.5185
30.22100.61.5190
40.6100.61.5155
50.22300.221.5200
60.6300.221.5180
70.22300.61.5230
80.6300.61.540
90.22100.224200
100.6100.224195
110.22100.64160
120.6100.64145
130.22300.224205
140.6300.224195
150.22300.64215
160.6300.6450
170.14200.414170
180.68200.412.75145
190.41200.142.75210
200.41200.682.75160
210.415.860.412.75190
220.4134.140.412.75147
230.41200.411153
240.41200.414.5155
250.41200.412.75150
260.41200.412.75152
270.41200.412.75148
Table 6. Design and results of quadratic orthogonal rotational combination tests for axial force tests.
No.X1X3X5X7Axial Force (N)
10.220.220.220.3246.5
20.220.220.220.3249.7
30.220.220.60.3187.3
40.60.220.60.3179.5
50.220.60.220.3234.1
60.60.60.220.3216.6
70.220.60.60.3174.12
80.60.60.60.3143.8
90.220.220.220.8235.6
100.60.220.220.8223.95
110.220.220.60.8146.3
120.60.220.60.8135.7
130.220.60.220.8240.4
140.60.60.220.8212
150.220.60.60.8169.5
160.60.60.60.8126.36
170.140.410.410.55223.13
180.680.410.410.55190.5
190.410.410.140.55225.2
200.410.410.680.55113.7
210.410.140.410.55168.5
220.410.680.410.55154.68
230.410.410.410.2176.1
240.410.410.410.9153.9
250.410.410.410.55155.2
260.410.410.410.55153.9
270.410.410.410.55155.3
Disclaimer/Publisher’s Note: The statements, opinions and data contained in all publications are solely those of the individual author(s) and contributor(s) and not of MDPI and/or the editor(s). MDPI and/or the editor(s) disclaim responsibility for any injury to people or property resulting from any ideas, methods, instructions or products referred to in the content.

