


Autonecrotic Tomato (Solanum lycopersicum L.) Line as a Potential Model for Applications in Proximal Sensing of Biotic and Abiotic Stress

 , , ,
, , ,  , ,
, ,  and
and 
Abstract
1. Introduction
2. Materials and Methods
2.1. Tomato Material
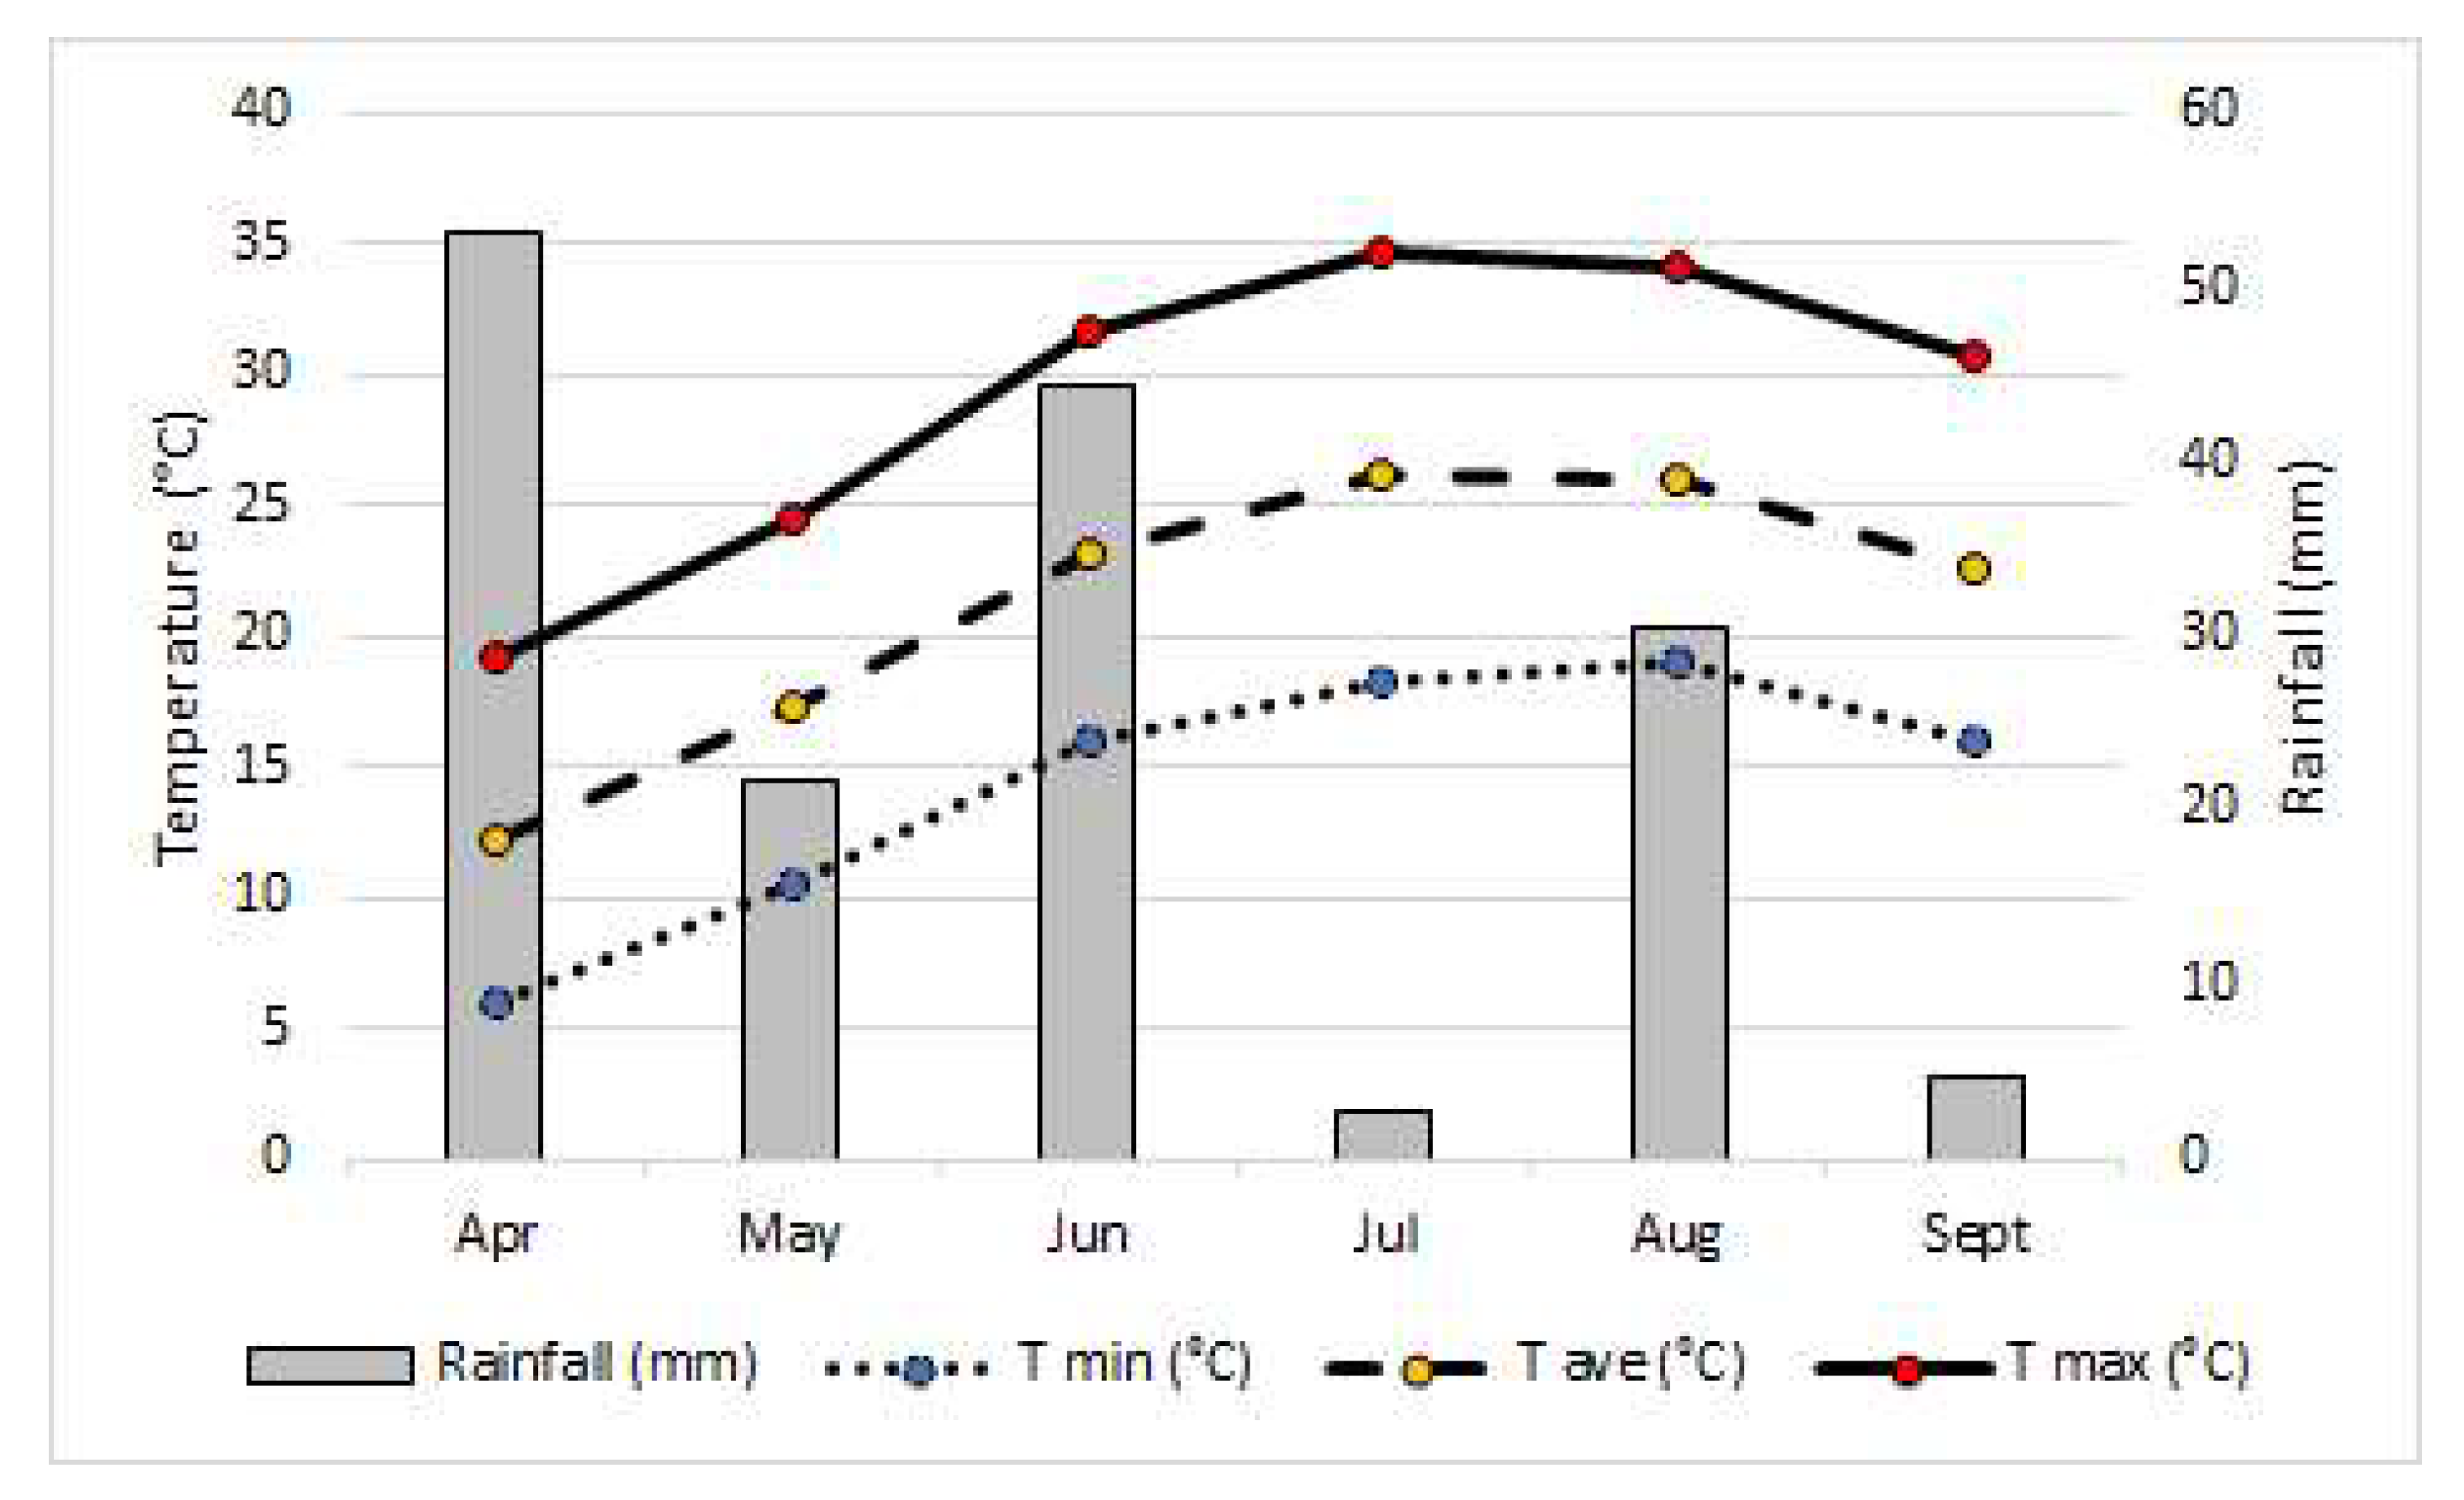
2.2. Growth Conditions
2.3. Morphological Characterization of the Autonecrotic Mutant
2.4. VIS/NIR Analysis of the Leaves
2.5. Statistical Analysis
3. Results
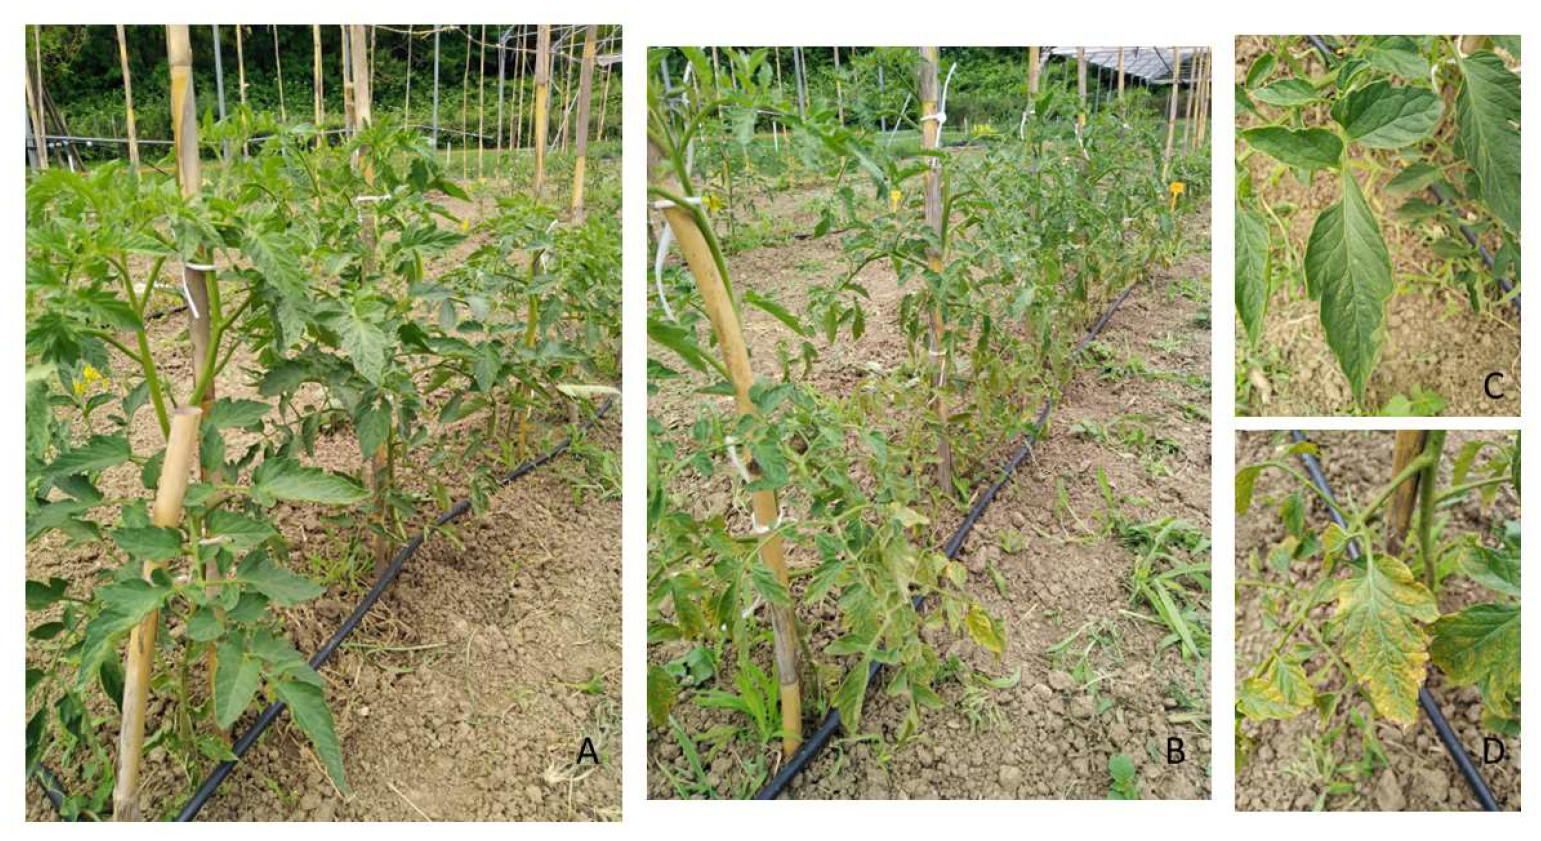
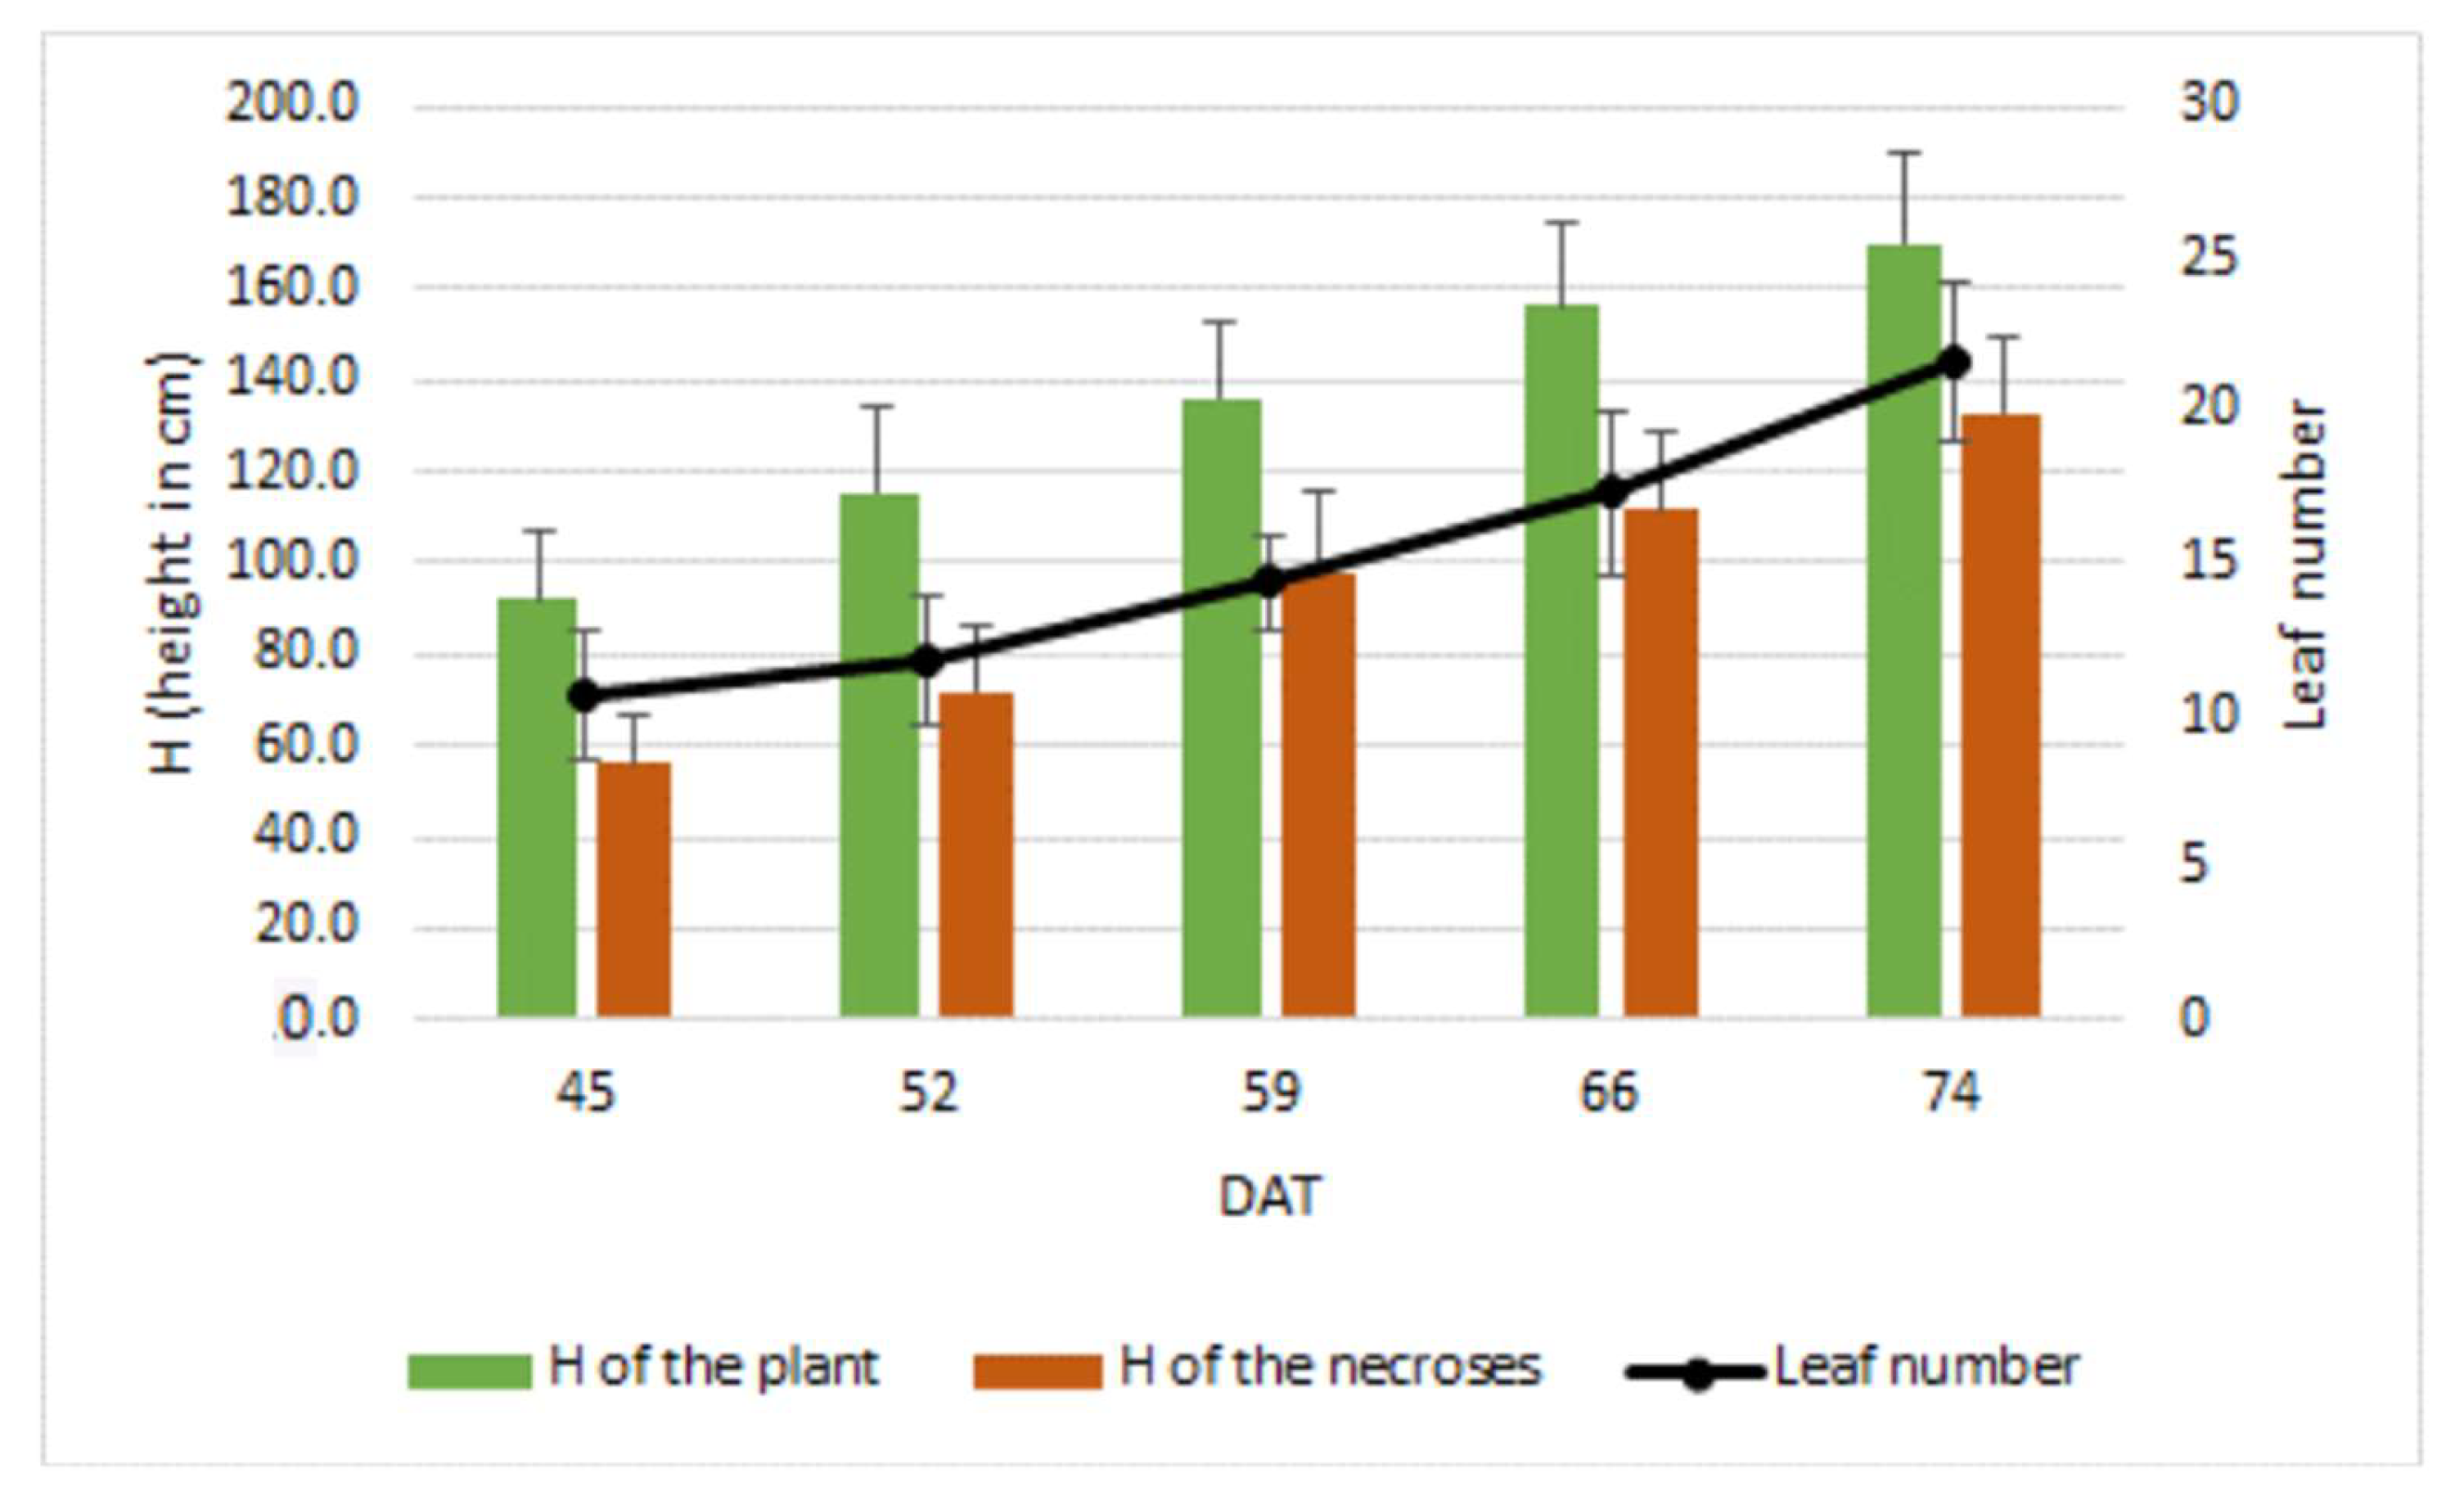
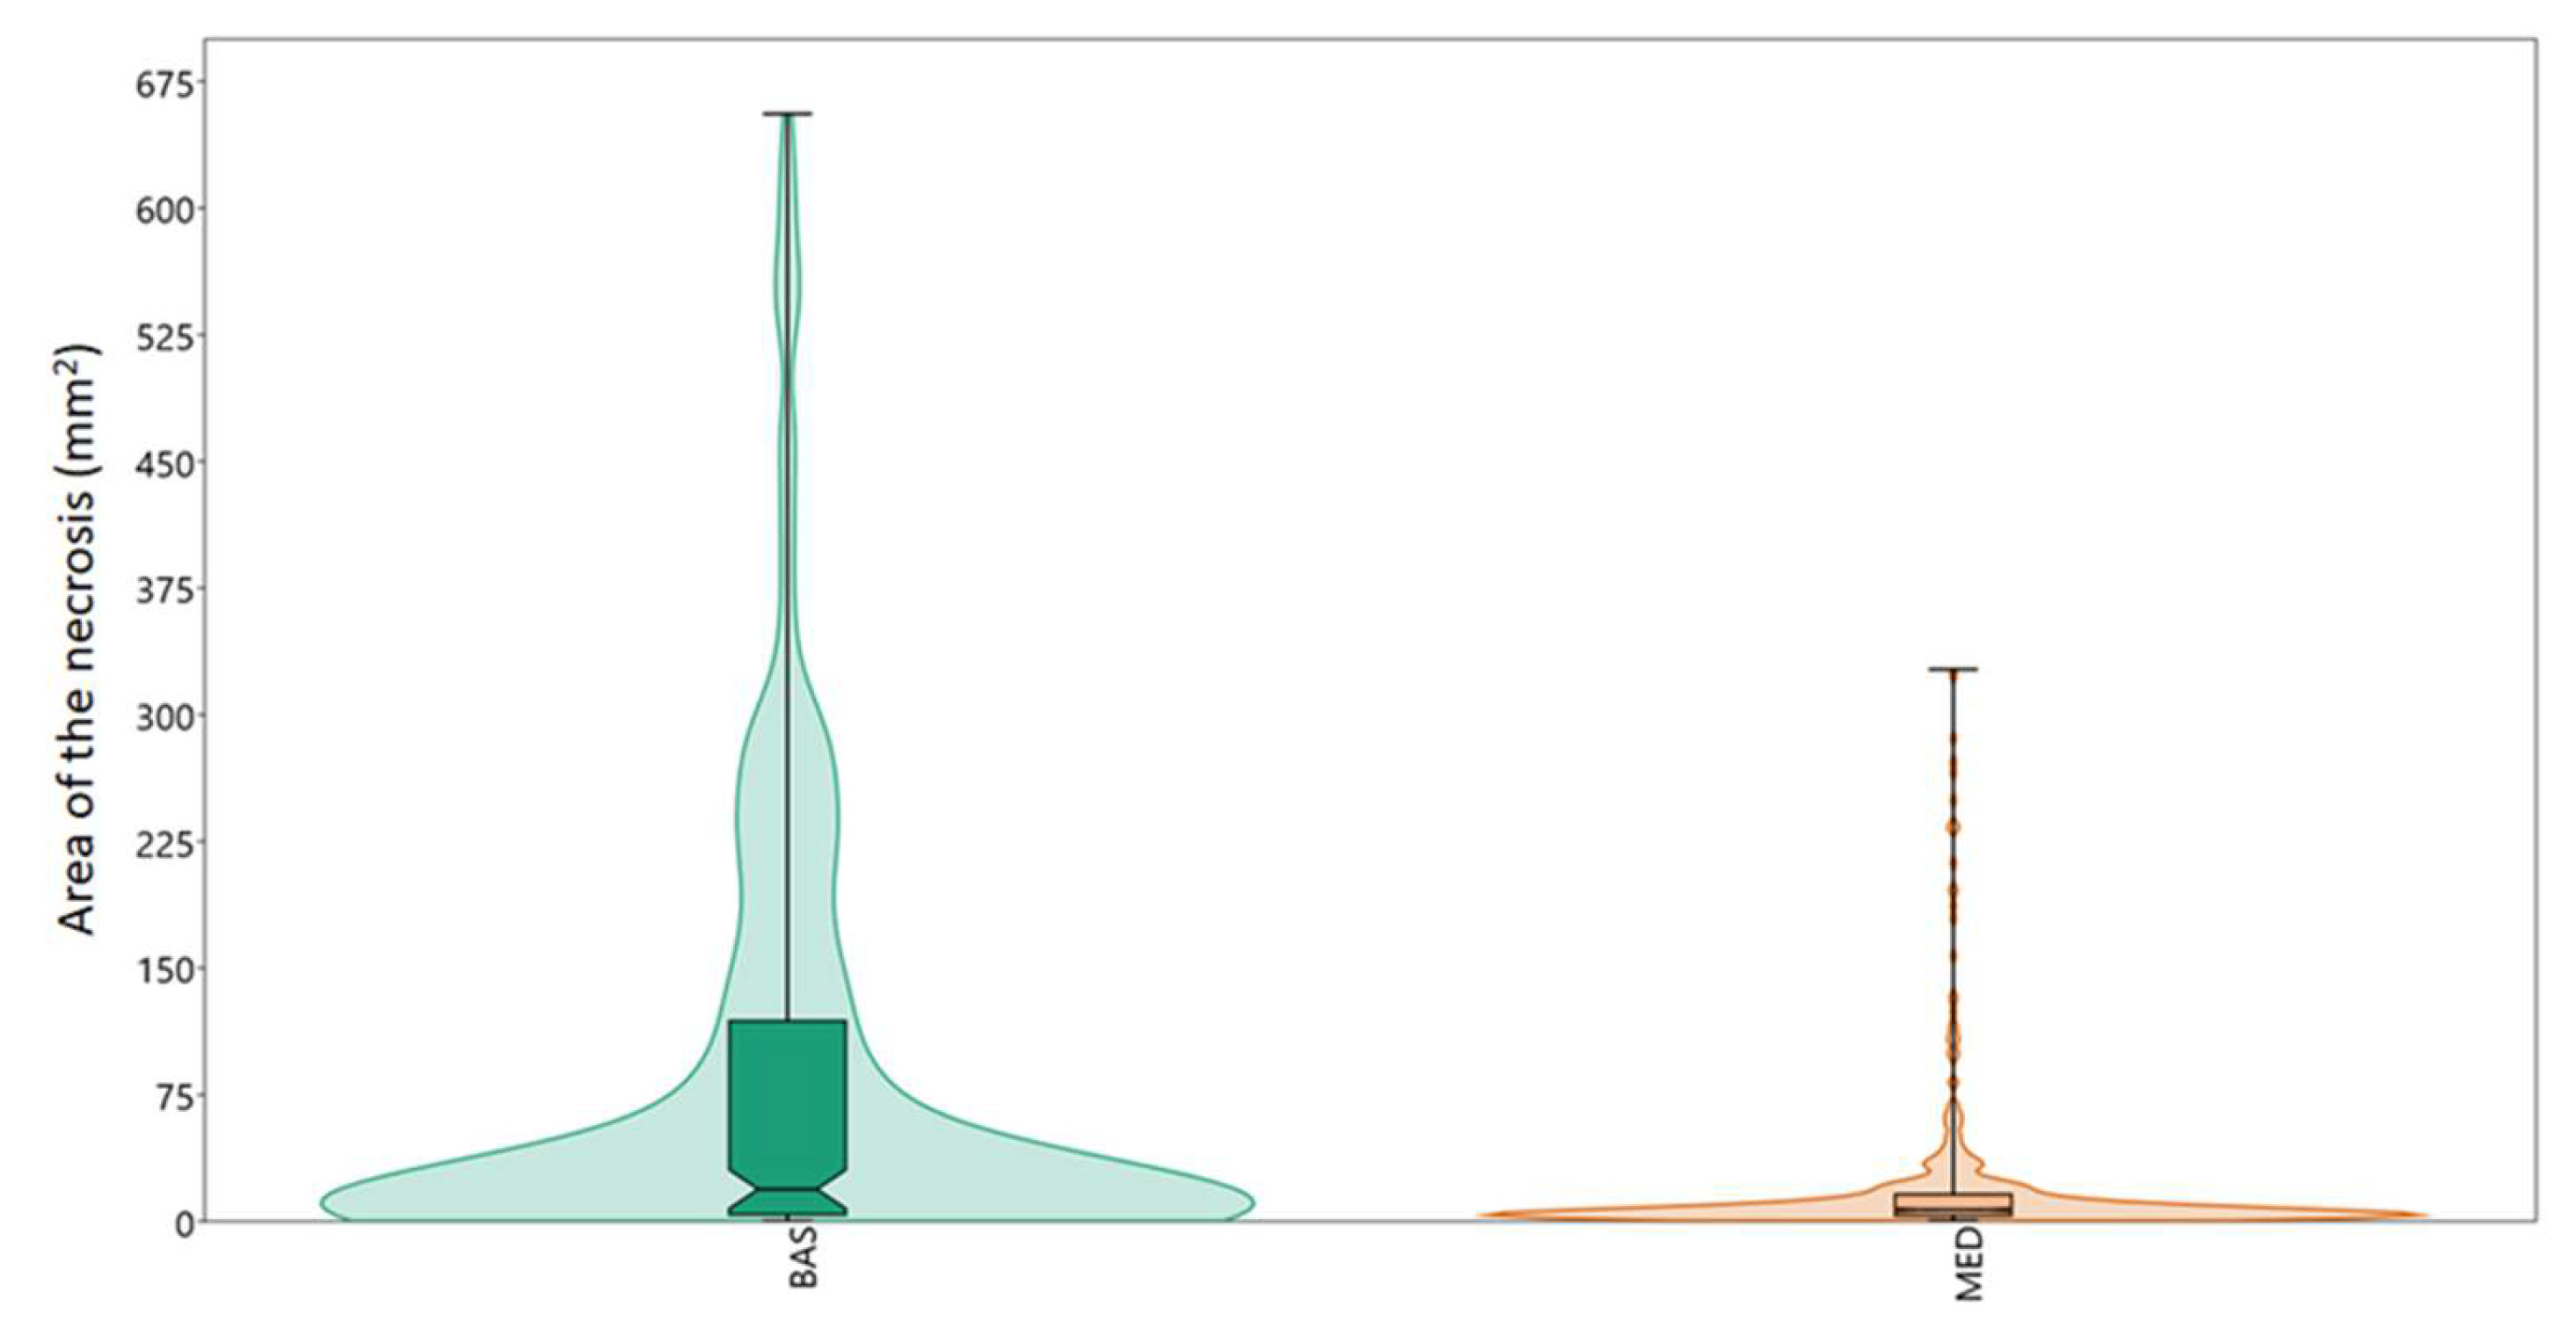
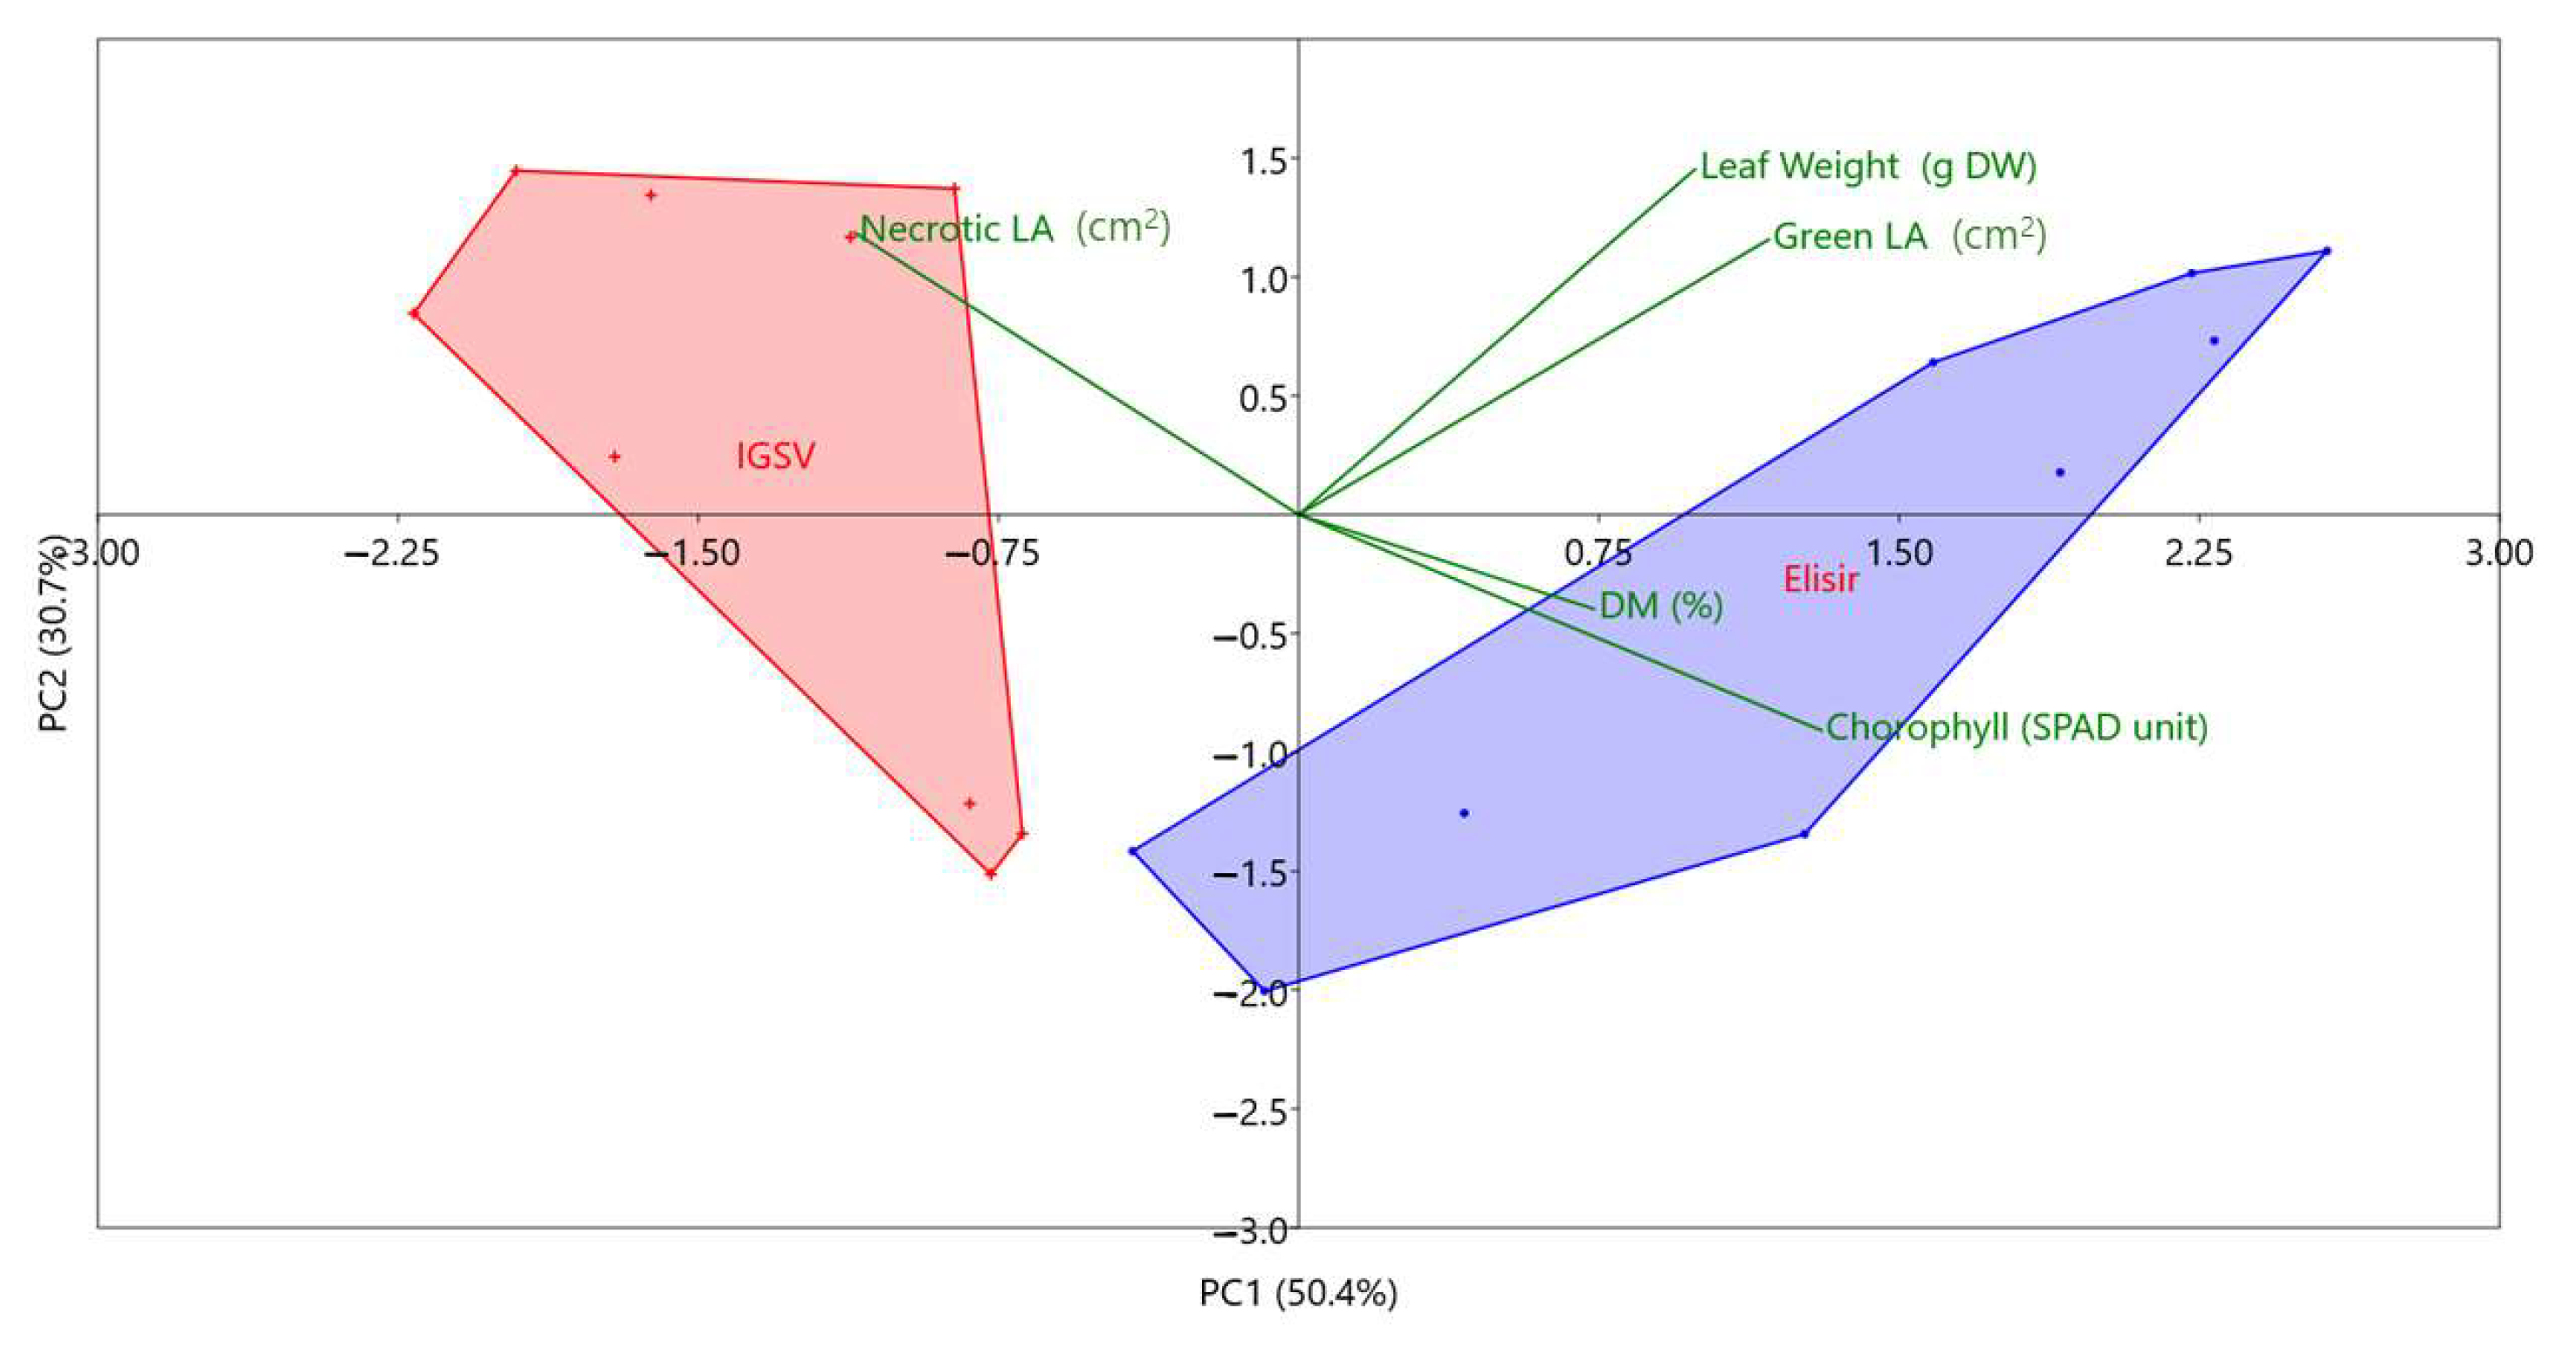
3.1. Morphological Characterization of the Autonecrotic Mutant
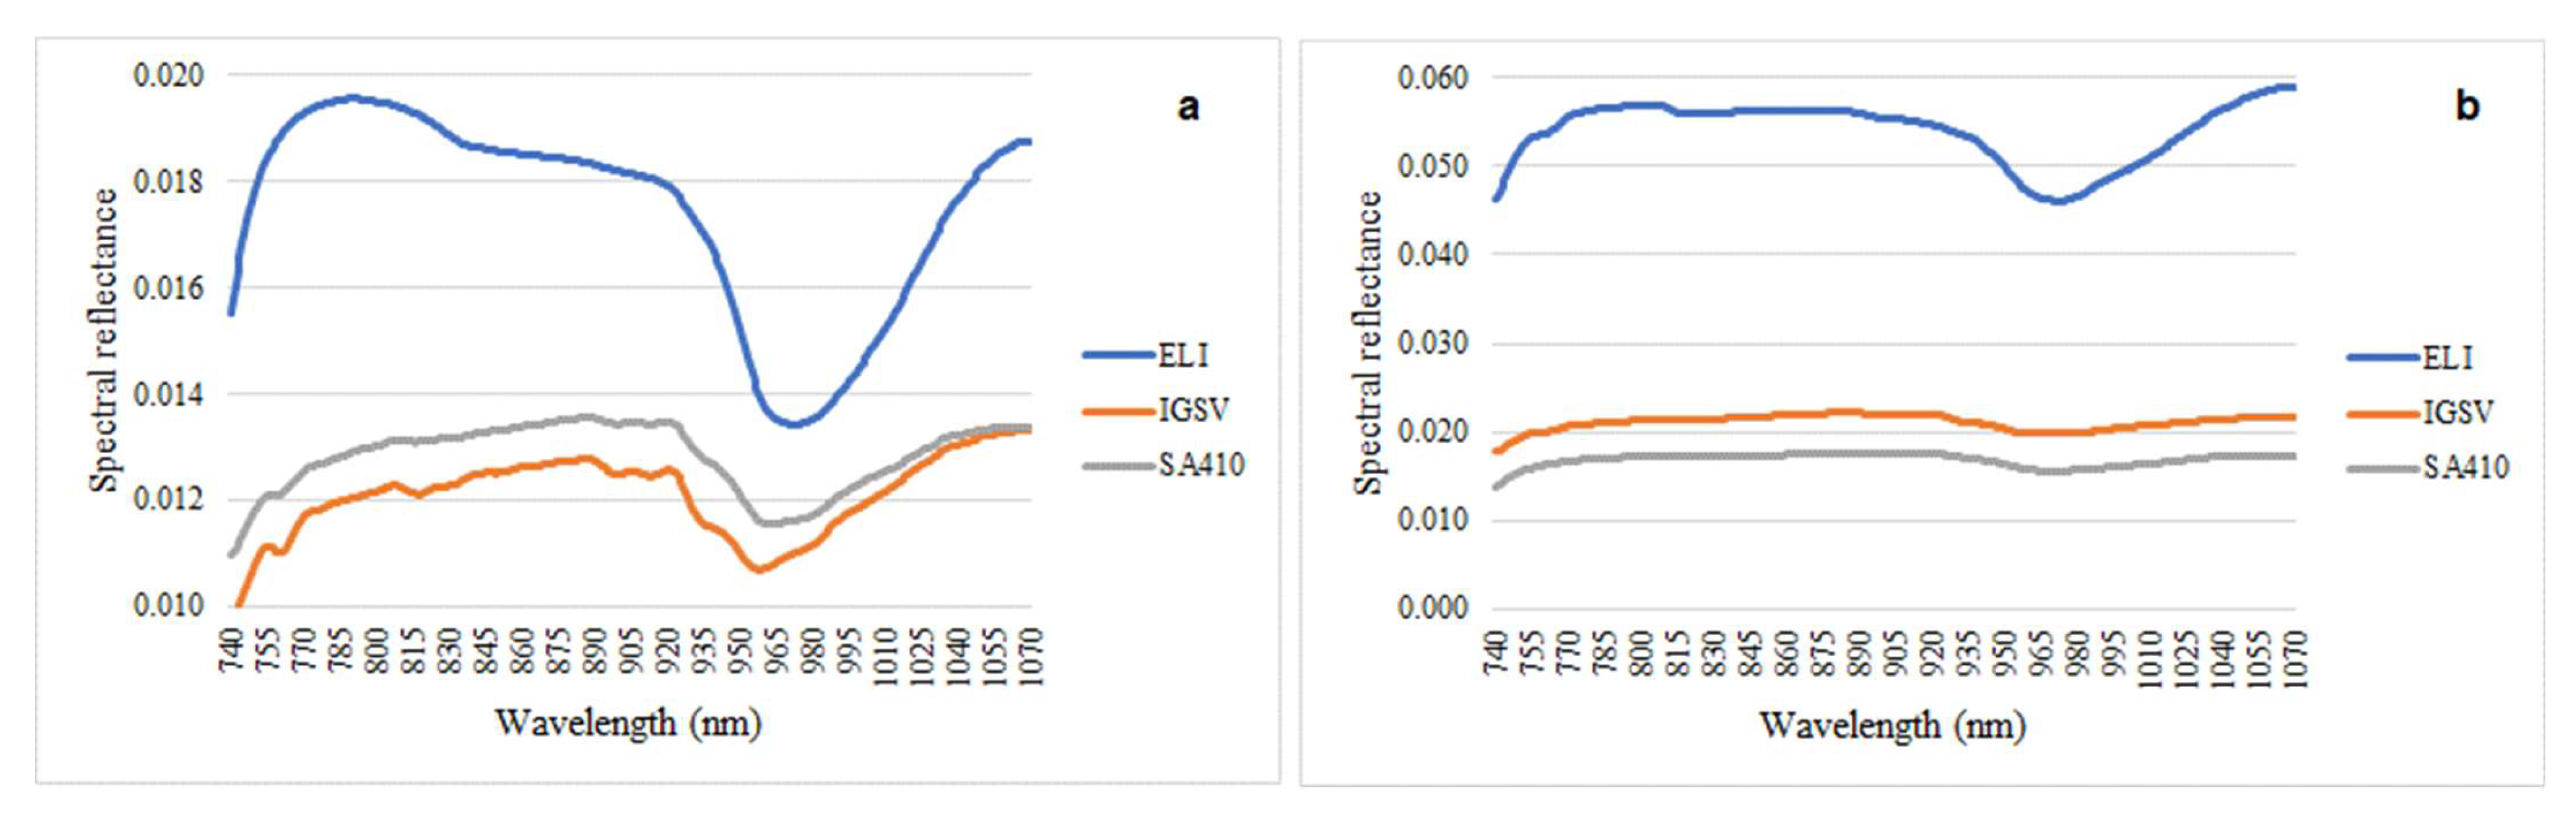
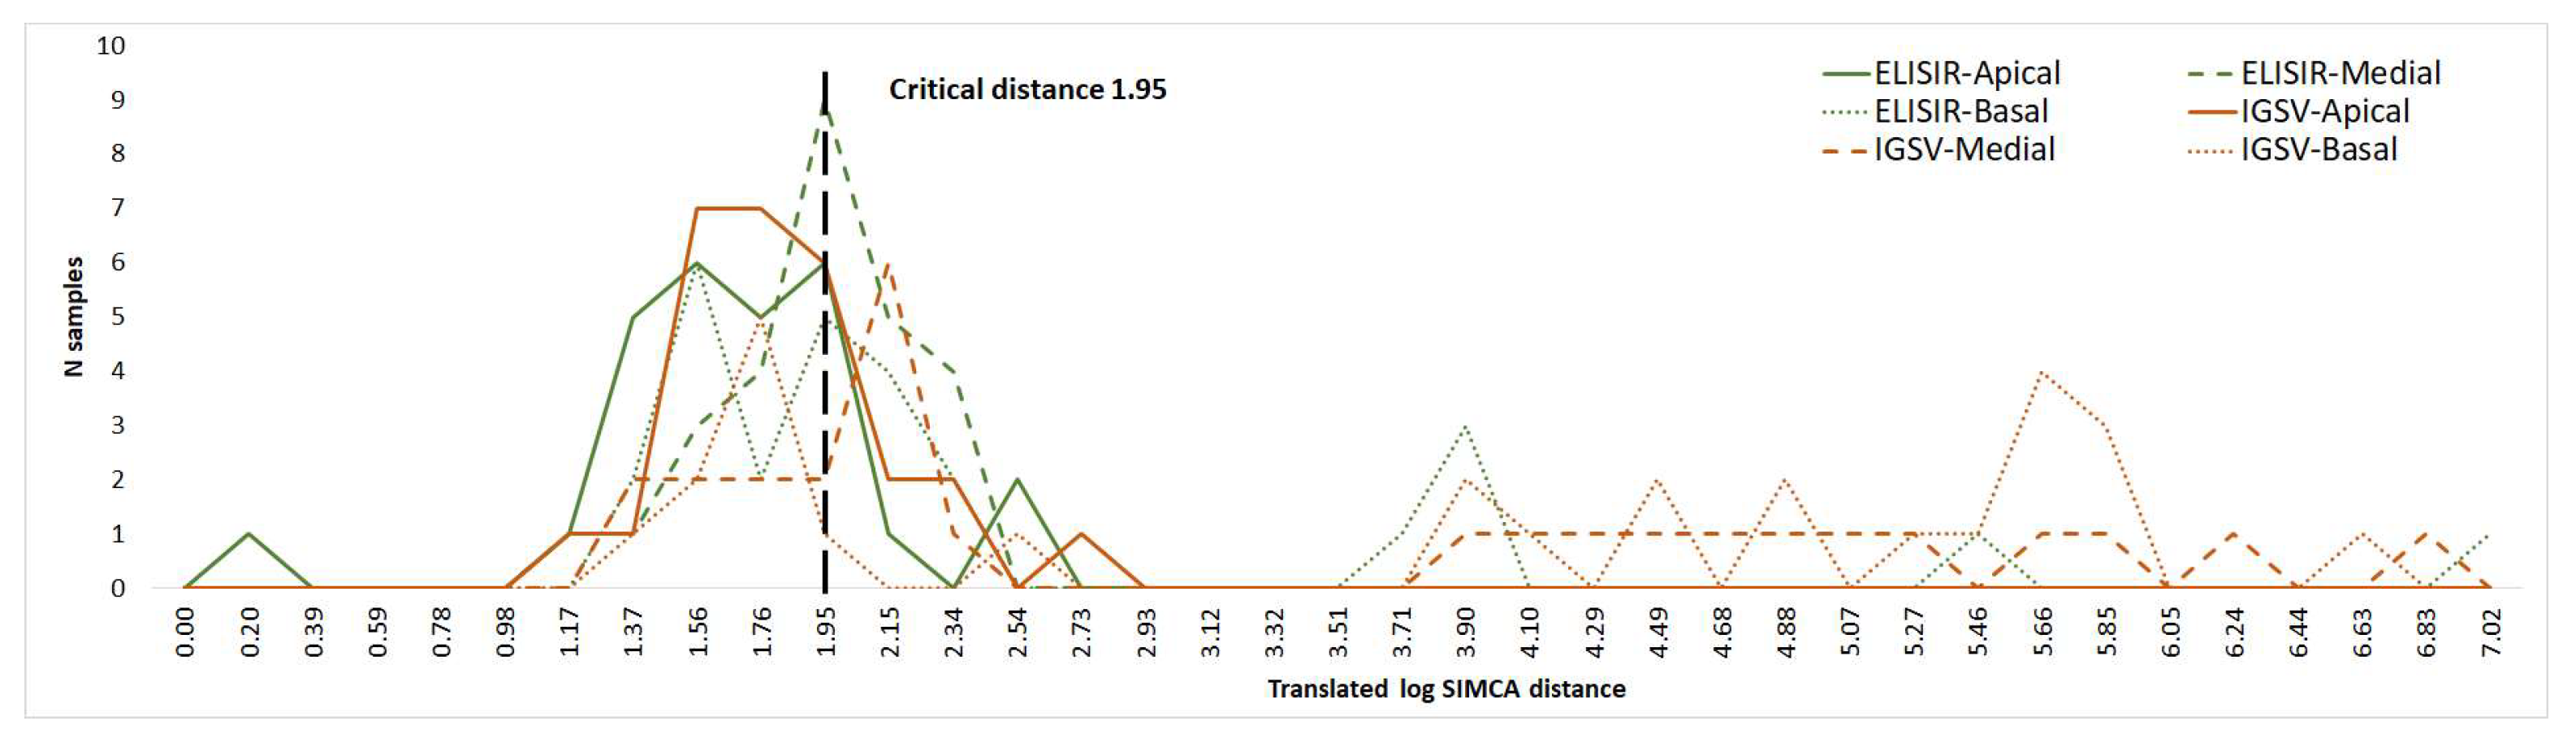
3.2. VIS/NIR Analysis of the Leaves
4. Discussion
5. Conclusions
Author Contributions
Funding
Institutional Review Board Statement
Data Availability Statement
Acknowledgments
Conflicts of Interest
References
- Dangl, J.L.; Dietrich, R.A.; Richberg, M.H. death don’t have no mercy: Cell death programs in plant-microbe interactions. Plant Cell 1996, 8, 1793–1807. [Google Scholar] [CrossRef]
- Hammond-Kosack, K.E.; Jones, J.D. Resistance gene-dependent plant defense responses. Plant Cell 1996, 8, 1773–1791. [Google Scholar] [CrossRef]
- Lamb, C.; Dixon, R.A. The oxidative burst in plant disease resistance. Annu. Rev. Plant Physiol. Plant Mol. Biol. 1997, 48, 251–275. [Google Scholar] [CrossRef]
- Beltran, P.M.J.; Federspiel, J.D.; Sheng, X.; Cristea, I.M. Proteomics and integrative omic approaches for understanding host–pathogen interactions and infectious diseases. Mol. Syst. Biol. 2017, 13, 922. [Google Scholar] [CrossRef]
- Peyraud, R.; Dubiella, U.; Barbacci, A.; Genin, S.; Raffaele, S.; Roby, D. Advances on plant–pathogen interactions from molecular toward systems biology perspectives. Plant J. 2017, 90, 720–737. [Google Scholar] [CrossRef]
- Jones, J.; Dangl, J. The plant immune system. Nature 2006, 444, 323–329. [Google Scholar] [CrossRef]
- Dangl, J.L.; Horvath, D.M.; Staskawicz, B.J. Pivoting the plant immune system from dissection to deployment. Science 2013, 341, 746–751. [Google Scholar] [CrossRef]
- Dixon, M.S.; Golstein, C.; Thomas, C.M.; van der Biezen, E.A.; Jones, J.D.G. Genetic complexity of pathogen perception by plants: The example of Rcr3, a tomato gene required specifically by Cf-2. Proc. Natl. Acad. Sci. USA 2000, 97, 8807–8814. [Google Scholar] [CrossRef]
- Rooney, H.C.; Van’t Klooster, J.W.; van der Hoorn, R.A.; Joosten, M.H.; Jones, J.D.; de Wit, P.J. Cladosporium Avr2 Inhibits Tomato Rcr3 Protease Required for Cf-2-Dependent Disease Resistance. Science 2005, 308, 1783–1786. [Google Scholar] [CrossRef] [PubMed]
- Kourelis, J.; Malik, S.; Mattinson, O.; Krauter, S.; Kahlon, P.S.; Paulus, J.K.; van der Hoorn, R.A.L. Evolution of a guarded decoy protease and its receptor in solanaceous plants. Nat. Commun. 2020, 11, 4393. [Google Scholar] [CrossRef] [PubMed]
- Krüger, J.; Thomas, C.M.; Golstein, C.; Dixon, M.S.; Smoker, M.; Tang, S.; Mulder, L.; Jones, J.D. A tomato cysteine protease required for Cf-2-dependent disease resistance and suppression of autonecrosis. Science 2002, 296, 744–747. [Google Scholar] [CrossRef]
- Wan, W.; Kim, S.; Castel, B.; Charoennit, N.; Chae, E. Genetics of autoimmunity in plants: An evolutionary genetics perspective. New Phytol. 2021, 229, 1215–1233. [Google Scholar] [CrossRef] [PubMed]
- Bomblies, K.; Weigel, D. Hybrid necrosis: Autoimmunity as a potential gene-flow barrier in plant species. Nat. Rev. Genet. 2007, 8, 382–393. [Google Scholar] [CrossRef]
- Moeder, W.; Yoshioka, K. Lesion mimic mutants. Plant Signal. Behav. 2008, 3, 764–767. [Google Scholar] [CrossRef] [PubMed]
- Bruggeman, Q.; Raynaud, C.; Benhamed, M.; Delarue, M. To die or not to die? Lessons from lesion mimic mutants. Front. Plant Sci. 2015, 6, 24. [Google Scholar] [CrossRef] [PubMed]
- Mahlein, A.-K. Plant disease detection by imaging sensors—Parallels and specific demands for precision agriculture and plant phenotyping. Plant Dis. 2016, 100, 241–251. [Google Scholar] [CrossRef]
- Pallottino, F.; Antonucci, F.; Costa, C.; Bisaglia, C.; Figorilli, S.; Menesatti, P. Optoelectronic proximal sensing vehicle-mounted technologies in precision agriculture: A review Partial Least Squares Regression. Comput. Electron. Agric. 2019, 162, 859–873. [Google Scholar] [CrossRef]
- Pane, C.; Manganiello, G.; Nicastro, N.; Ortenzi, L.; Pallottino, F.; Cardi, T.; Costa, C. Machine learning applied to canopy hyperspectral image data to support biological control of soil-borne fungal diseases in baby leaf vegetables. Biol. Control 2021, 164, 104784. [Google Scholar] [CrossRef]
- Navarro, A.; Nicastro, N.; Costa, C.; Pentangelo, A.; Cardarelli, M.; Ortenzi, L.; Pallottino, F.; Cardi, T.; Pane, C. Sorting biotic and abiotic stresses on wild rocket by leaf-image hyperspectral data mining with an artificial intelligence model. Plant Methods 2022, 18, 45. [Google Scholar] [CrossRef]
- Violino, S.; Figorilli, S.; Ferrigno, M.; Manganiello, V.; Pallottino, F.; Costa, C.; Menesatti, P. A data-driven bibliometric review on precision irrigation. Smart Agric. Technol. 2023, 5, 100320. [Google Scholar] [CrossRef]
- Mahlein, A.-K.; Kuska, M.; Behmann, J.; Polder, G.; Walter, A. Hyperspectral sensors and imaging technologies in phytopathology: State of the art. Annu. Rev. Phytopathol. 2018, 56, 535–558. [Google Scholar] [CrossRef]
- Martinelli, F.; Scalenghe, R.; Davino, S.; Panno, S.; Scuderi, G.; Ruisi, P.; Villa, P.; Stroppiana, D.; Boschetti, M.; Goulart, R.L.; et al. Advanced methods of plant disease detection: A review. Agron. Sustain. Dev. 2015, 35, 1–25. [Google Scholar] [CrossRef]
- Thomas, S.; Kuska, M.T.; Bohnenkamp, D.; Brugger, A.; Alisaac, E.; Wahabzada, M.; Behmann, J.; Mahlein, A.-K. Benefits of hyperspectral imaging for plant disease detection and plant protection: A technical perspective. J. Plant Dis. Prot. 2018, 125, 5–20. [Google Scholar] [CrossRef]
- Zhang, M.; Qin, Z.; Liu, X.; Ustin, S.L. Detection of stress in tomatoes induced by late blight disease in California, USA, using hyperspectral remote sensing. Int. J. Appl. Earth Obs. Geoinf. 2003, 4, 295–310. [Google Scholar] [CrossRef]
- Oerke, E.-C.; Herzog, K.; Toepfer, R. Hyperspectral phenotyping of the reaction of grapevine genotypes to Plasmopara viticola. J. Exp. Bot. 2016, 67, 5529–5543. [Google Scholar] [CrossRef]
- Yao, Z.; Lei, Y.; He, D. Early visual detection of wheat stripe rust using visible/near-infrared hyperspectral imaging. Sensors 2019, 19, 952. [Google Scholar] [CrossRef] [PubMed]
- Hou, B.; Hu, Y.; Zhang, P.; Hou, L. Potato Late Blight Severity and Epidemic Period Prediction Based on Vis/NIR Spectroscopy. Agriculture 2022, 12, 897. [Google Scholar] [CrossRef]
- Huang, Y.; Wang, D.; Liu, Y.; Zhou, H.; Sun, Y. Measurement of early disease blueberries based on vis/nir hyper-spectral imaging system. Sensors 2020, 20, 5783. [Google Scholar] [CrossRef]
- Jiang, Q.; Wu, G.; Tian, C.; Li, N.; Yang, H.; Bai, Y.; Zhang, B. Hyperspectral imaging for early identification of strawberry leaves diseases with machine learning and spectral fingerprint features. Infrared Phys. Technol. 2021, 118, 103898. [Google Scholar] [CrossRef]
- Li, J.; Huang, W.; Tian, X.; Wang, C.; Fan, S.; Zhao, C. Fast detection and visualization of early decay in citrus using Vis-NIR hyperspectral imaging. Comput. Electron. Agric. 2016, 127, 582–592. [Google Scholar] [CrossRef]
- Chu, X.; Zhang, K.; Wei, H.; Ma, Z.; Fu, H.; Miao, P.; Jiang, H.; Liu, H. A Vis/NIR spectra-based approach for identifying bananas infected with Colletotrichum musae. Front. Plant Sci. 2023, 14, 1180203. [Google Scholar] [CrossRef]
- Bagheri, N.; Mohamadi-Monavar, H. Early detection of fire blight disease of pome fruit trees using visible-nir spec-trometry and dimensionality reduction methods. J. Agric. Mach. 2020, 10, 37–48. [Google Scholar]
- Najjar, K. Sensing Botrytis cinerea in Tomato Using Visible/Near-Infrared (VIS/NIR) Spectroscopy. Ph.D. Dissertation, Palestine Technical University—Kadoorie, Tulkarm, Palestine, 2020. [Google Scholar]
- Berardo, N.; Pisacane, V.; Battilani, P.; Scandolara, A.; Pietri, A.; Marocco, A. Rapid detection of kernel rots and mycotoxins in maize by near-infrared reflectance spectroscopy. J. Agric. Food Chem. 2005, 53, 8128–8134. [Google Scholar] [CrossRef]
- Morellos, A.; Tziotzios, G.; Orfanidou, C.; Pantazi, X.E.; Sarantaris, C.; Maliogka, V.; Alexandridis, T.K.; Moshou, D. Non-destructive early detection and quantitative severity stage classification of Tomato Chlorosis Virus (ToCV) infection in young tomato plants using vis–NIR Spectroscopy. Remote Sens. 2020, 12, 1920. [Google Scholar] [CrossRef]
- Santangelo, E.; Fonzo, V.; Astolfi, S.; Zuchi, S.; Caccia, R.; Mosconi, P.; Mazzucato, A.; Soressi, G.P. The Cf-2/Rcr3esc gene interaction in tomato (Lycopersicon esculentum) induces autonecrosis and triggers biochemical markers of oxidative burst at cellular level. Funct. Plant Biol. 2003, 30, 1117–1125. [Google Scholar] [CrossRef]
- Violino, S.; Taiti, C.; Marone, E.; Pallottino, F.; Costa, C. A statistical tool to determine the quality of extra virgin olive oil (EVOO). Eur. Food Res. Technol. 2022, 248, 2825–2832. [Google Scholar] [CrossRef]
- Forina, M.; Oliveri, P.; Casale, M.; Lanteri, S. Multivariate range modeling, a new technique for multivariate class modeling: The uncertainty of the estimates of sensitivity and specificity. Anal. Chim. Acta 2008, 622, 85–93. [Google Scholar] [CrossRef] [PubMed]
- Ceccarelli, D.; Antonucci, F.; Costa, C.; Talento, C.; Ciccoritti, R. An artificial class modelling approach to identify the most largely diffused cultivars of sweet cherry (Prunus avium L.) in Italy. Food Chem. 2020, 333, 127515. [Google Scholar] [CrossRef]
- Barry, C.S.; Aldridge, G.M.; Herzog, G.; Ma, Q.; McQuinn, R.P.; Hirschberg, J.; Giovannoni, J.J. Altered chloroplast development and delayed fruit ripening caused by mutations in a zinc metalloprotease at the lutescent2 locus of tomato. Plant Physiol. 2012, 159, 1086–1098. [Google Scholar] [CrossRef] [PubMed]
- Regione Emilia-Romagna. Pomodoro da Industria. Parte Agronomica. 2019. Available online: http://agricoltura.regione.emilia-romagna.it/produzioni-agroalimentari/temi/bio-agro-climambiente/agricoltura-integrata/disciplinari-produzione-integrata-vegetale/Collezione-dpi/2019/orticole-2019 (accessed on 16 November 2023).
- Fan, X.-X.; Xu, Z.-G.; Liu, X.-Y.; Tang, C.-M.; Wang, L.-W.; Han, X.-L. Effects of light intensity on the growth and leaf development of young tomato plants grown under a combination of red and blue light. Sci. Hortic. 2013, 153, 50–55. [Google Scholar] [CrossRef]
- Hammer, Ø.; Harper, D.A.T.; Ryan, P.D. Past: Paleontological statistics software package for education and data analysis. Palaeontol. Electron. 2001, 4, 1–9. [Google Scholar]
- Montanari, M. Statistica ambientale. Analisi Multivariata. Metodologie di Ordinamento; SISSAD Snc: Trieste, Italy, 2012. [Google Scholar]
- Zanetti, M.; Costa, C.; Greco, R.; Grigolato, S.; Aalmo, G.O.; Cavalli, R. How wood fuels’ quality relates to the standards: A class-modelling approach. Energies 2017, 10, 1455. [Google Scholar] [CrossRef]
- Kennard, R.; Stone, L. Computer aided design of experiments. Technometrics 1969, 11, 137–148. [Google Scholar] [CrossRef]
- Sgarbossa, A.; Costa, C.; Menesatti, P.; Antonucci, F.; Pallottino, F.; Zanetti, M.; Grigolato, S.; Cavalli, R. A multivariate SIMCA index as discriminant in wood pellet quality assessment. Renew. Energy 2015, 76, 258–263. [Google Scholar] [CrossRef]
- De Biasi, M.G.; Astolfi, S.; Acampora, A.; Zuchi, S.; Fonzo, V.; Santangelo, E.; Caccia, R.; Badiani, M.; Soressi, G.P. A H2O2-forming peroxidase rather than a NAD(P)H-dependent O2•—Synthase may be the major player in cell death responses controlled by the Pto—Fen complex following fenthion treatment. Funct. Plant Biol. 2003, 30, 409–417. [Google Scholar] [CrossRef]
- Jeuken, M.J.; Zhang, N.W.; McHale, L.K.; Pelgrom, K.; Boer, E.D.; Lindhout, P.; Michelmore, R.W.; Visser, R.G.; Niks, R.E. Rin4 causes hybrid necrosis and race-specific resistance in an interspecific lettuce hybrid. Plant Cell 2009, 21, 3368–3378. [Google Scholar] [CrossRef] [PubMed]
- Deng, J.; Fang, L.; Zhu, X.; Zhou, B.; Zhang, T. A CC-NBS-LRR gene induces hybrid lethality in cotton. J. Exp. Bot. 2019, 70, 5145–5156. [Google Scholar] [CrossRef] [PubMed]
- Yu, K.-Q.; Zhao, Y.-R.; Zhu, F.-L.; Li, X.-L.; He, Y. Mapping of chlorophyll and SPAD distribution in pepper leaves during leaf senescence using visible and near-infrared hyperspectral imaging. Trans. ASABE 2016, 59, 13–24. [Google Scholar] [CrossRef]
- Rinaldi, M. Variation of Specific Leaf Area for Sugar Beet Depending on Sowing Date and Irrigation. Ital. J. Agron. 2003, 7, 23–32. [Google Scholar]
- Aguirre-Becerra, H.; García-Trejo, J.F.; Vázquez-Hernández, C.; Alvarado, A.M.; Feregrino-Pérez, A.A.; Contreras-Medina, L.M.; Guevara-Gonzalez, R.G. Effect of extended photoperiod with a fixed mixture of light wavelengths on tomato seedlings. HortScience 2020, 55, 1832–1839. [Google Scholar] [CrossRef]
- Evans, J.R.; Poorter, H. Photosynthetic acclimation of plants to growth irradiance: The relative importance of specific leaf area and nitrogen partitioning in maximizing carbon gain. Plant Cell Environ. 2001, 24, 755–767. [Google Scholar] [CrossRef]
- van Esse, H.P.; Klooster, J.W.V.; Bolton, M.D.; Yadeta, K.A.; van Baarlen, P.; Boeren, S.; Vervoort, J.; de Wit, P.J.; Thomma, B.P. The Cladosporium fulvum virulence protein Avr2 inhibits host proteases required for basal defense. Plant Cell 2008, 20, 1948–1963. [Google Scholar] [CrossRef]
- Fei, W.; Liu, Y. Biotrophic Fungal Pathogens: A Critical Overview. Appl. Biochem. Biotechnol. 2023, 195, 1–16. [Google Scholar] [CrossRef] [PubMed]
- Wahabzada, M.; Mahlein, A.-K.; Bauckhage, C.; Steiner, U.; Oerke, E.-C.; Kersting, K. Metro maps of plant disease dynamics—Automated mining of differences using hyperspectral images. PLoS ONE 2015, 10, e0116902. [Google Scholar] [CrossRef] [PubMed]
- Lowe, A.; Harrison, N.; French, A.P. Hyperspectral image analysis techniques for the detection and classification of the early onset of plant disease and stress. Plant Methods 2017, 13, 80. [Google Scholar] [CrossRef]
- Xie, C.; Shao, Y.; Li, X.; He, Y. Detection of early blight and late blight diseases on tomato leaves using hyperspectral imaging. Sci. Rep. 2015, 5, 16564. [Google Scholar] [CrossRef] [PubMed]
- Costa, C.; Antonucci, F.; Pallottino, F.; Aguzzi, J.; Sun, D.-W.; Menesatti, P. Shape analysis of agricultural products: A review of recent research advances and potential application to computer vision. Food Bioprocess Technol. 2011, 4, 673–692. [Google Scholar] [CrossRef]
- Violino, S.; Benincasa, C.; Taiti, C.; Ortenzi, L.; Pallottino, F.; Marone, E.; Mancuso, S.; Costa, C. AI-based hyperspectral and VOCs assessment approach to identify adulterated extra virgin olive oil. Eur. Food Res. Technol. 2021, 247, 1013–1022. [Google Scholar] [CrossRef]
- Janni, M.; Cocozza, C.; Birilli, F.; Pignatelli, S.; Vurro, F.; Coppede, N.; Bettelli, M.; Calestani, D.; Loreto, F.; Zappettini, A. Real-time monitoring of Arundo donax response to saline stress through the application of in vivo sensing technology. Sci. Rep. 2021, 11, 18598. [Google Scholar] [CrossRef]
- Janni, M.; Coppede, N.; Bettelli, M.; Briglia, N.; Petrozza, A.; Summerer, S.; Vurro, F.; Danzi, D.; Cellini, F.; Marmiroli, N.; et al. In vivo phenotyping for the early detection of drought stress in tomato. Plant Phenomics 2019, 2019, 6168209. [Google Scholar] [CrossRef]
- Coatsworth, P.; Gonzalez-Macia, L.; Collins, A.S.P.; Bozkurt, T.; Güder, F. Continuous monitoring of chemical signals in plants under stress. Nat. Rev. Chem. 2023, 7, 7–25. [Google Scholar] [CrossRef] [PubMed]
- Presti, D.L.; Di Tocco, J.; Massaroni, C.; Cimini, S.; De Gara, L.; Singh, S.; Raucci, A.; Manganiello, G.; Woo, S.L.; Schena, E.; et al. Current understanding, challenges and perspective on portable systems applied to plant monitoring and precision agriculture. Biosens. Bioelectron. 2023, 222, 115005. [Google Scholar] [CrossRef] [PubMed]
- Chen, S.; Zhang, L.; Cai, X.; Li, X.; Bian, L.; Luo, Z.; Li, Z.; Chen, Z.; Xin, Z. (E)-Nerolidol is a volatile signal that induces defenses against insects and pathogens in tea plants. Hortic. Res. 2020, 7, 52. [Google Scholar] [CrossRef] [PubMed]
- Aratani, Y.; Uemura, T.; Hagihara, T.; Matsui, K.; Toyota, M. Green leaf volatile sensory calcium transduction in Arabidopsis. Nat. Commun. 2023, 14, 6236. [Google Scholar] [CrossRef]
- Razo-Belman, R.; Ozuna, C. Volatile Organic Compounds: A Review of Their Current Applications as Pest Biocontrol and Disease Management. Horticulturae 2023, 9, 441. [Google Scholar] [CrossRef]


| #. | Plant Disease | Technique | References |
|---|---|---|---|
| 1 | Biocontrol of Trichoderma spp. by estimating disease severity in young small leafy vegetable plants during specific plant-pathogen-antagonist interactions | VIS-NIR spectroscopy and machine learning | [18] |
| 2 | Late blight caused by Phytophthora infestans in potato production | Visible/near-infrared (VIS/NIR) spectroscopy with machine learning (ML) and chemometric methods | [27] |
| 3 | Early disease in blueberries | Hyperspectral imaging between the spectral range of 400–1000 nm | [28] |
| 4 | Anthracnose and gray in the strawberries | Hyperspectral imaging between the spectral range of 400–1000 nm | [29] |
| 5 | Fungal infection in citrus fruit | VIS-NIR spectroscopy with range between 325–1100 nm | [30] |
| 6 | Anthracnose of banana caused by Colletotrichum species | VIS-NIR spectroscopy | [31] |
| 7 | Fire blight (FB) of pear trees | Visible-NIR spectrometry method | [32] |
| 8 | Gray mold disease caused by Botrytis cinerea in tomato | VIS-NIR spectroscopy with range between 550–1100 nm | [33] |
| 9 | Micotoxigenic fungi and their toxic metabolites produced in naturally and artificially contaminated products in maize | NIR spectroscopy | [34] |
| 10 | Tomato chlorosis virus (ToCV) | VIS-NIR in healthy and diseased leaves at a pre-symptomatic stage | [35] |
| 11 | Abiotic and biotic stresses in wild rocket (Diplotaxis tenuifolia) | ANN coupled with VIS-NIR and NIR | [19] |
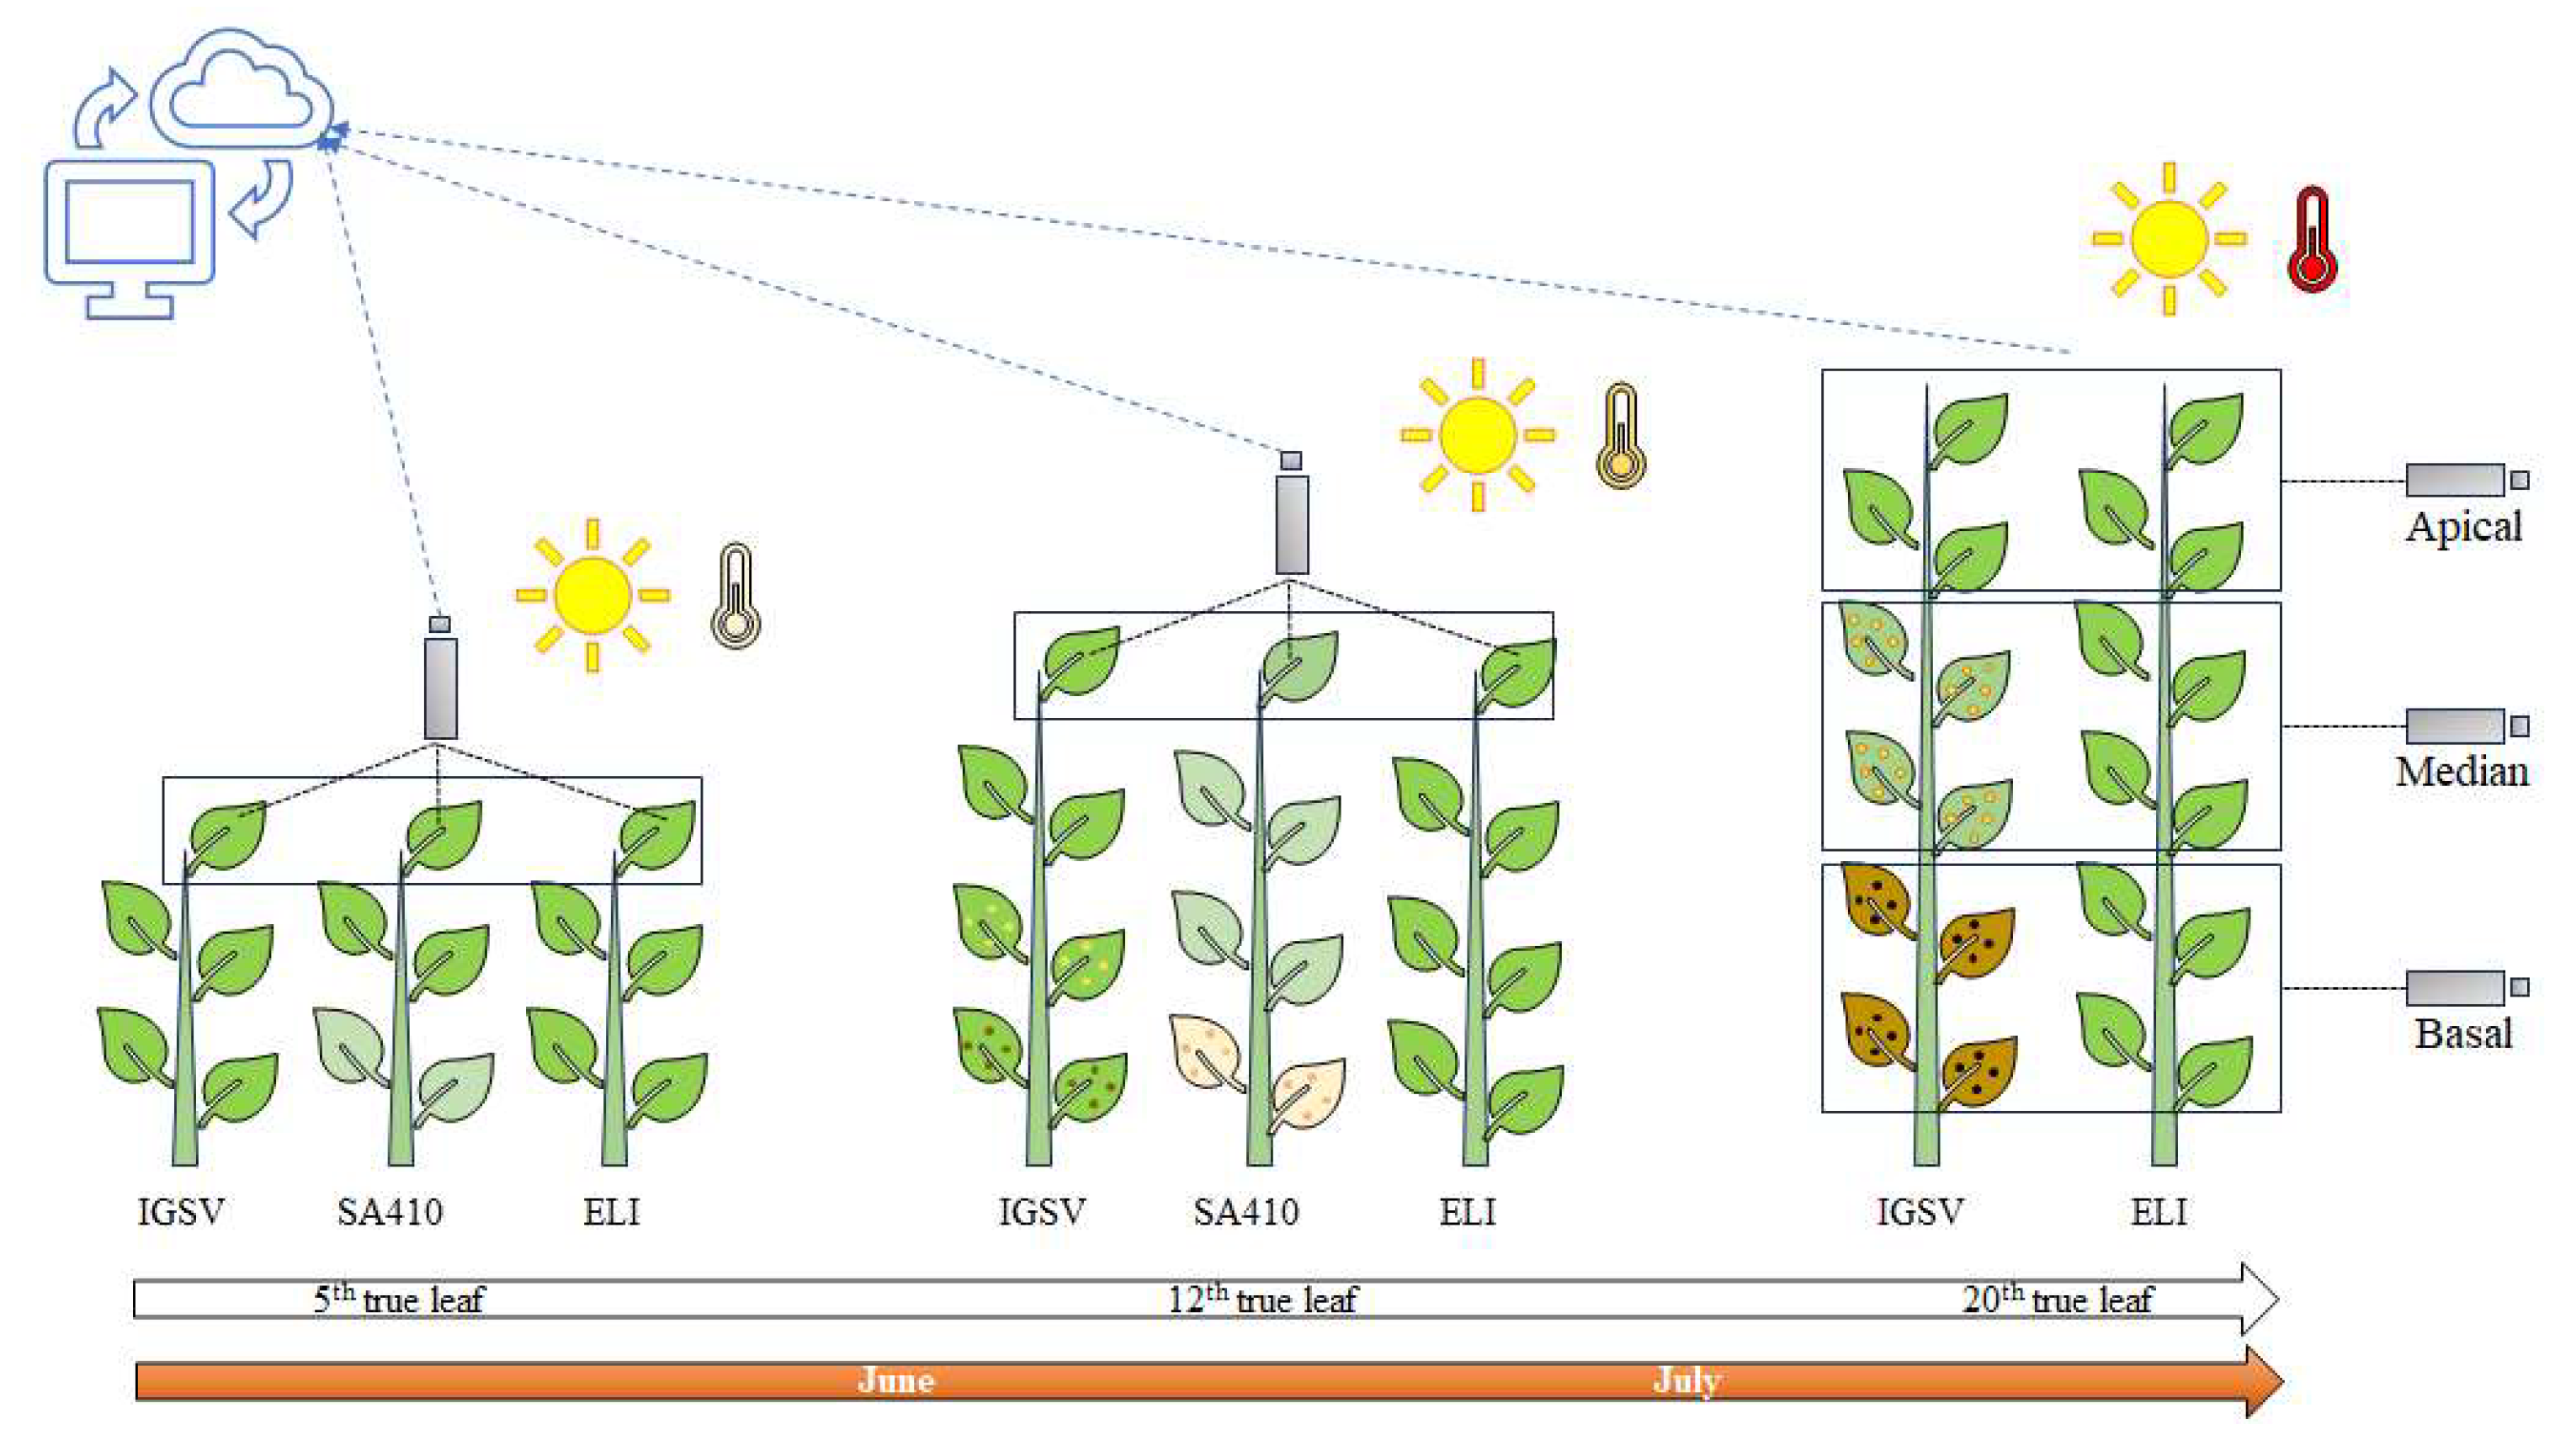
| True Leaf | Date of Analysis | DAT * | Leaf Position | Genotype |
|---|---|---|---|---|
| 5th | 10 June | 27 | Apical | Elisir, IGSV, SA410 |
| 12th | 25 June | 42 | Apical | Elisir, IGSV, SA410 |
| 20th | 20 July | 67 | Basal, median, apical | Elisir, IGSV |
| Leaf | Genotype | Chlorophyll (Spad Unit) | Dry Matter (%) | Leaf Weight (gDW) | Green LA * (cm−2) | LA | |
|---|---|---|---|---|---|---|---|
| Necrotic (%) | Specific (cm2 g−1DW) | ||||||
| Basal | IGSV | 27.0 c | 16.97 b | 1.83 | 109.03 | 34.17 | 60.49 b |
| Elisir | 56.6 a | 15.86 b | 2.58 | 218.13 | 0.45 | 86.16 a | |
| Median | IGSV | 43.5 b | 14.17 c | 2.22 | 193.42 | 14.11 | 87.18 a |
| Elisir | 56.4 a | 18.05 a | 3.74 | 275.21 | 0.00 | 76.14 a | |
| Apical | IGSV | 55.5 a | 14.90 c | 0.61 | 61.96 | 0.00 | 101.68 a |
| Elisir | 54.8 a | 18.16 a | 1.19 | 86.96 | 0.00 | 72.04 b | |
| Cultivar | Leaf | N. Accepted | N. Rejected | Accepted (%) |
|---|---|---|---|---|
| ELISIR | Apical | 24 | 3 | 88.9 |
| Median | 18 | 9 | 66.7 | |
| Basal | 15 | 12 | 55.6 | |
| IGSV | Apical | 22 | 5 | 81.5 |
| Median | 8 | 19 | 29.6 | |
| Basal | 9 | 18 | 33.4 |
Disclaimer/Publisher’s Note: The statements, opinions and data contained in all publications are solely those of the individual author(s) and contributor(s) and not of MDPI and/or the editor(s). MDPI and/or the editor(s) disclaim responsibility for any injury to people or property resulting from any ideas, methods, instructions or products referred to in the content. |
© 2024 by the authors. Licensee MDPI, Basel, Switzerland. This article is an open access article distributed under the terms and conditions of the Creative Commons Attribution (CC BY) license (https://creativecommons.org/licenses/by/4.0/).
Share and Cite
Santangelo, E.; Giudice, A.D.; Figorilli, S.; Violino, S.; Costa, C.; Bascietto, M.; Bergonzoli, S.; Beni, C. Autonecrotic Tomato (Solanum lycopersicum L.) Line as a Potential Model for Applications in Proximal Sensing of Biotic and Abiotic Stress. Agriculture 2024, 14, 136. https://doi.org/10.3390/agriculture14010136
Santangelo E, Giudice AD, Figorilli S, Violino S, Costa C, Bascietto M, Bergonzoli S, Beni C. Autonecrotic Tomato (Solanum lycopersicum L.) Line as a Potential Model for Applications in Proximal Sensing of Biotic and Abiotic Stress. Agriculture. 2024; 14(1):136. https://doi.org/10.3390/agriculture14010136
Chicago/Turabian StyleSantangelo, Enrico, Angelo Del Giudice, Simone Figorilli, Simona Violino, Corrado Costa, Marco Bascietto, Simone Bergonzoli, and Claudio Beni. 2024. "Autonecrotic Tomato (Solanum lycopersicum L.) Line as a Potential Model for Applications in Proximal Sensing of Biotic and Abiotic Stress" Agriculture 14, no. 1: 136. https://doi.org/10.3390/agriculture14010136
APA StyleSantangelo, E., Giudice, A. D., Figorilli, S., Violino, S., Costa, C., Bascietto, M., Bergonzoli, S., & Beni, C. (2024). Autonecrotic Tomato (Solanum lycopersicum L.) Line as a Potential Model for Applications in Proximal Sensing of Biotic and Abiotic Stress. Agriculture, 14(1), 136. https://doi.org/10.3390/agriculture14010136