Abstract
Tiller density is indicative of the overall health of winter wheat (Triticum aestivum L.) and is used to determine in-season nitrogen (N) application. If tiller density exceeds 538 tillers per m2 at GS 25, then an N application at that stage is not needed, only at GS 30. However, it is often difficult to obtain an accurate representation of tiller density across an entire field. Normalized difference vegetative index (NDVI) and normalized difference red edge (NDRE) have been significantly correlated with tiller density when collected from the ground. With the advent of unmanned aerial vehicles (UAVs) and their ability to collect NDVI and NDRE from the air, this study was established to examine the relationship between NDVI, NDRE, and tiller density, and to verify whether N could be applied based on these two indices. From 2018 to 2020, research trials were established across Virginia to develop a model describing the relationship between aerial NDVI, aerial NDRE, and tiller density counted on the ground, in small plots. In 2021, the model was used to apply N in small plots at two locations, where the obtained grain yield was the same whether N was applied based on tiller density, NDVI, or NDRE. From 2022 to 2023, the model was applied at six locations across the state on large scale growers’ fields to compare the amount of GS 25 N recommended by tiller density, NDVI, and NDRE. At three locations, NDVI and NDRE recommended the same N rates as the tiller density method, while at two locations, NDVI and NDRE recommended less N than tiller density. At one location, NDVI and NDRE recommended more N than tiller density. However, across all six locations, there was no difference in grain yield whether N was applied based on tiller density, NDVI, or NDRE. This study indicated that UAV-based NDVI and NDRE are excellent proxies for tiller density determination, and can be used to accurately and economically apply N at GS 25 in winter wheat production.
1. Introduction
Tiller production in winter wheat (Triticum aestivum L.) is the development of shoots from buds at the base of the main stem and is a critical factor to final yield [1]. Early leaf and tiller development is crucial because the number of tillers per plant is a critical yield component [2,3,4]. This is because tillers initiated in the fall make up the majority of spikes, compared to tillers initiated from 1 January until Zadok’s growth stage (GS) 30, and contribute up to 87% of grain yield, i.e., while tillers will continue to develop into the spring, the tillers produced in the fall will contribute the most toward yield [5]. Scharf and Alley (1993) [6] showed that when tiller density is low in spring, then N should be split and applied at GS 25 and GS 30 to stimulate additional yield. If tiller densities are not sufficient in late January to early February, then N should be applied to optimize and stimulate the needed tiller growth. Any tiller produced in March or later contributes less than 2% to the overall yield [7]. The number of tillers per square meter (tiller density) is the proper method to determine whether a crop needs a split N application at GS 25. If the crop has a tiller density of 538 tillers per m2 or greater, then a single application at GS 30 is sufficient [8]. If the tiller density is less than 538 tillers per m2, then N should be applied at GS 25. If the tiller density is 323 to 537 tillers per m2, then 45 to 56 kg N ha−1 should be applied. If tiller density is very thin with only 215 to 322 tillers per m2, then 56 to 78 K N ha−1 should be applied [8].
Worldwide, 18% of N applied to cropping systems is applied to wheat [9] and this is one of the largest expenses to producers, with the cost continuing to rise. From 2021 to 2022, the price of 24-0-0-3 (one of the most common liquid N fertilizers) increased by 267% (Gulasky, A. personal communication, 2022). However, wheat typically only uses approximately 33% of N application, with the rest being lost through leaching, volatilization, and denitrification, or immobilization which is not a loss [10]. Leaching of N can pollute to ground and surface waters causing acidification, eutrophication of aquatic systems, and toxicity to animals [11]. Therefore, a method to apply N based on need rather than a blanket application is crucial.
Even though applying N based on tiller density has been proven beneficial to wheat production, it is often not utilized due to tiller variability across the field and the amount of time involved in physically counting tillers [12]. Vegetation indices incorporating red and near-infrared (NIR) canopy reflectance, such as NDVI, are now widely used for N monitoring models for several crops [7,13]. Previous work on 22 site-years in Virginia from 2000 to 2002, has shown that ground collected NDVI was well correlated with tiller density, with r2 of 0.74, indicating that NDVI collected with hand-held optical sensors at GS 25 has the ability to predict tiller density without having to physically count the tillers [14]. While they found that there is a saturation point at which NDVI will no longer increase as tiller density increases, this occurs beyond GS 25 when an N recommendation would be needed.
Aerial indices from UAV platforms or satellite can often outperform ground measurements as they provide an overall view of the entire area, not just a small area where the hand-held reflectance sensor is being pointed. For example, in peanut, ground indices predicted leaf loss from disease at an r2 of 0.30, while aerial indices predicted leaf loss at an r2 of 0.73 [15]. Oakes and Balota (2016, unpublished data) also found that aerial NDVI was correlated with ground NDVI at an r2 of 0.89. Similarly, Zhang et al. 2021 found that image data from an UAV could non-destructively diagnose wheat N status in China. Similarly, Jiang et al. (2020b) [16] found that an active sensor mounted to an UAV platform could successfully monitor the growth and N nutrition status of winter wheat.
While abundant work has been carried out using ground NDVI and aerial sensors towards monitoring crop N status, little work has specifically examined the relationship between aerial indices and early season tiller density to determine N split application rates in winter wheat production. Therefore, the objectives of the study were to (1) determine the relationship between aerial indices and tiller density, (2) use aerial indices to develop a model for N application requirement at GS 25 in small plots, and (3) validate the model in large scale settings in growers’ fields.
2. Materials and Methods
2.1. Small Plot Design
Four site-years were selected across Virginia from 2018 to 2020 to determine the relationship between aerial NDVI/NDRE and tiller density. In the 2018–2019 growing season, research was conducted at the Eastern Virginia Agricultural Research and Extension Center (EVAREC) near Warsaw, the Southern Piedmont Agricultural Research and Extension Center (SPAREC) near Blackstone, and the Tidewater Agricultural Research and Extension Center (TAREC) near Suffolk, while in the 2019–2020 growing season, research was conducted at EVAREC only. Planting and harvest dates and soil type information for each location are shown in Table 1. GS 25 N was applied in small plot trials from 2019 to 2021 using the model developed. These trials were located at EVAREC and TAREC during the 2020–2021 growing season.

Table 1.
Location, crop, and soil information for small plot winter wheat trials in 2019 and 2020.
At each location, the cultivar “Hilliard” was planted at a seeding rate of 144 seeds m−1 with a Hege plot drill in seven row plots that measured 2.74 m long × 1.52 m wide. Plots were planted in conventionally tilled fields at EVAREC and SPAREC and no-till at TAREC. The plots from 2018 to 2020 were used for linear regression model development and they were arranged in a randomized complete block design (RCBD) with four replications, and with N rate and application timing being the main effects (Table 2). The rates and timing were selected to achieve a diverse combination of rates split among GS 25 and GS 30, and totaling 134.5 kg N ha−1, which is the optimum N recommended for high yield production of winter wheat in Virginia [1]. N applications were made using 12-0-0-1.5 at GS 25 and 24-0-0-3 at GS 30 and were applied with a backpack sprayer. In this way, seven combinations were designed (Table 2). In addition, five more N rates and timing combinations were created, with the purpose of generating differing tiller densities. Planting and harvest information for each location are shown in Table 1. Based on these data sets, two linear regression models were developed for NDVI and NDRE to predict tiller density, and these models were used to determine N rates at GS 25 in small plot trials at EVAREC and TAREC during the 2020–2021 growing season (Figure 1 and Figure 2).
Table 2.
Nitrogen rates and timing for small plot winter wheat trials in 2018–2020.
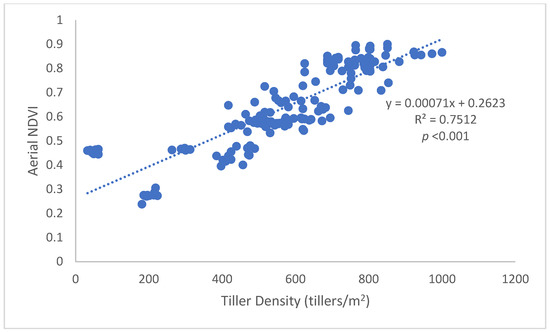
Figure 1.
The relationship between tiller density and aerial NDVI developed from small plots in 2018–2020.

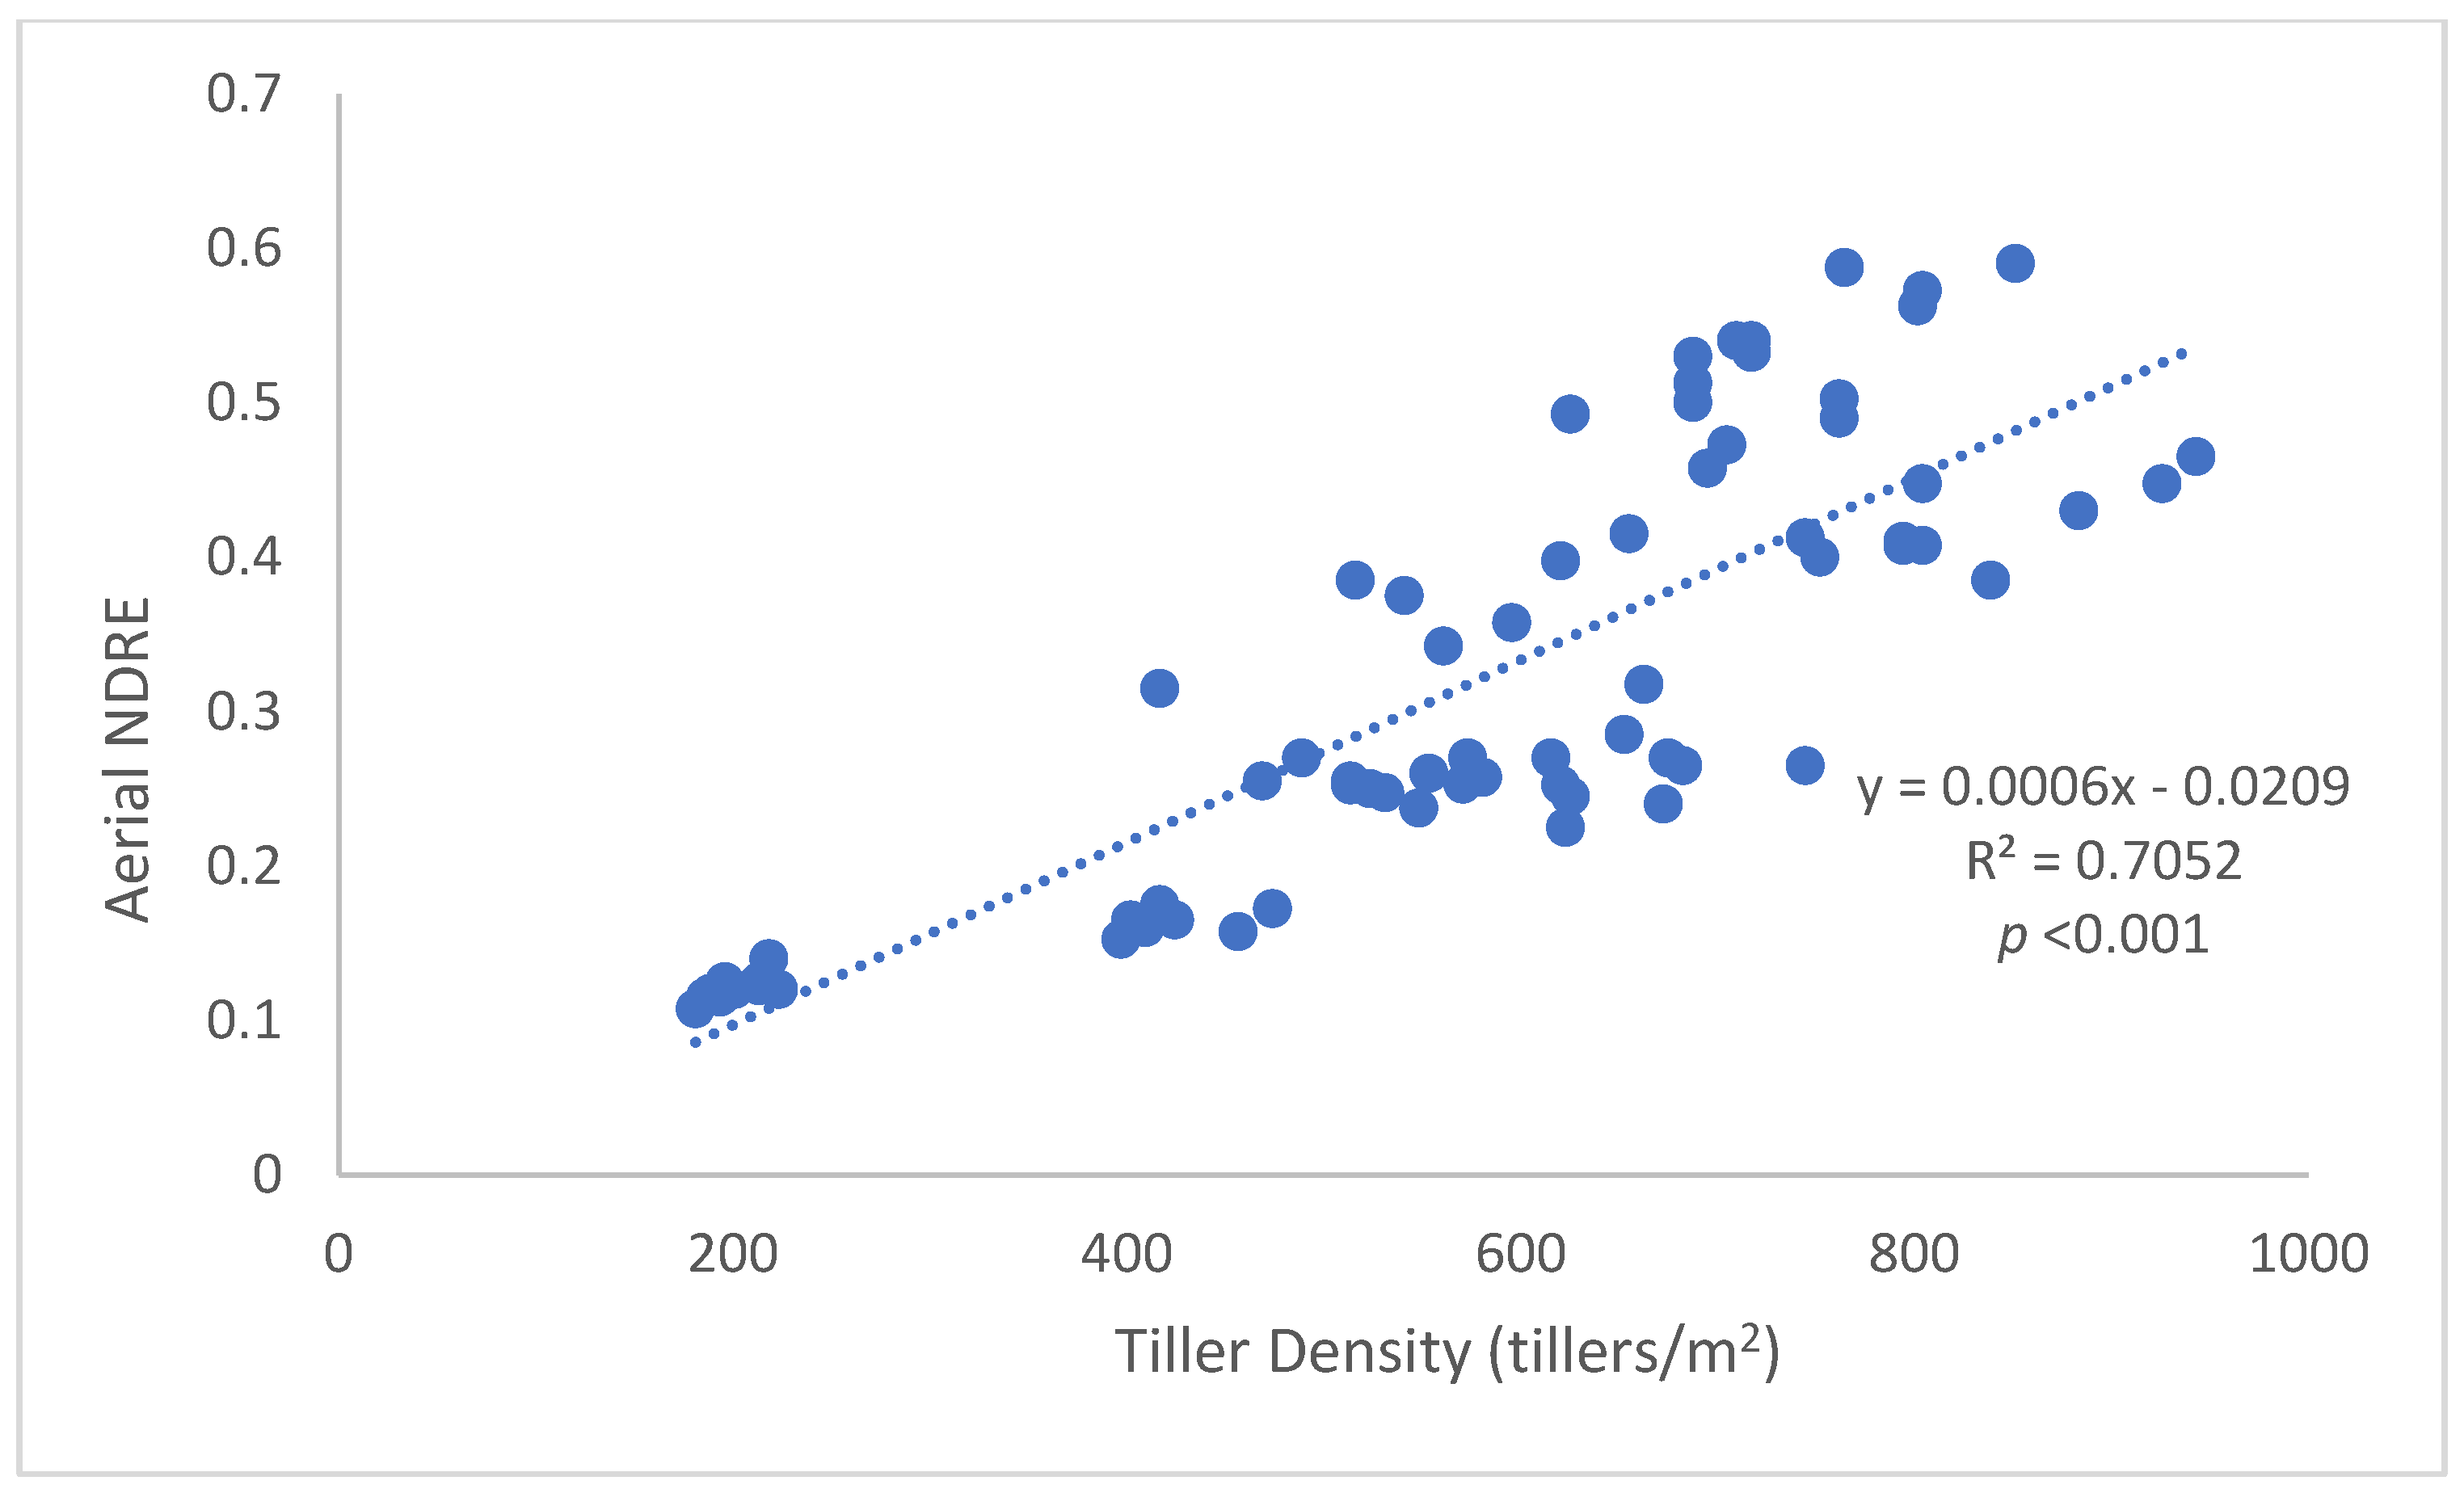
Figure 2.
The relationship between tiller density and aerial NDRE developed from small plots in 2018–2020.
2.2. Validation in Small Plots
During 2020–2021, plots received N at GS 25 based on either direct count of tiller density or aerial NDVI and NDRE imaging using the regression models previously developed. GS 30 N application was based on the amount of N applied at GS 25 in order to achieve a total of 134.5 kg N ha−1. These application methods were arranged in an RCBD with four replications. Planting and harvest information, N rates, timing, and methods for each location are presented in Table 3.
Table 3.
Location, planting, and harvest dates, as well as N rates applied at GS 25 and GS 30 winter wheat growth stages in small plot validation trials where GS 25 N was applied based on tiller density and aerial vegetation indices.
2.3. On-Farm Plot Design
After regression models between tiller density and vegetation indices were established and tested in small plots in 2020–2021, these models were validated in large scale settings in growers’ fields. Six site-year combinations were established from 2021 to 2023. In the 2021–2022 growing season, sites were established in growers’ fields near Warsaw, VA (WRVA), Champlain, VA (CHVA), and Suffolk, VA (SFVA); in 2022–2023, at WRVA, Spring Grove, VA (SGVA), and Dinwiddie, VA (DWVA). Information on location, planting and harvest dates, soil type and tillage, and plot size are shown in Table 4. The plot size was dependent on the growers’ spray equipment. Nitrogen rates were based on the direct count of tiller density and NDVI- and NDRE-based regression models developed in small plots. Strips were arranged in an RCBD with three replications for each N application at GS 25, i.e., aerial NDVI- and NDRE-based models, and direct tiller count, were implemented at all locations with the exception of DWVA 2023 where only aerial NDVI and tiller density were used due to land constraints. GS 30 N application was based on the amount of N applied at GS 25 in order to achieve a total of 134.5 kg N ha−1. The recommended N rate by each model at GS 25 was compared with the rate based on tiller density count (Table 5). Each strip was combined individually at harvest to determine grain yield differences based on the nitrogen application method.
Table 4.
Site description and cultural practices for on-farm winter wheat trials in 2022 and 2023.
Table 5.
N rate, timing, and method used for N application at GS 25 and GS 30 wheat growth stages at on-farm trials at six year-location combinations in Virginia.
2.4. Data Collection and Statistical Procedure
Tiller density was collected in three to four places, in both the small plots and large on-farm trials, throughout the growing season. Tiller density was directly counted and the number of tillers per square meter was calculated. Aerial images were collected from all research plots on the same day tiller density was collected in order to extract aerial NDVI and aerial NDRE. Dates that aerial images and tiller density were collected are shown in Table 6. A MicaSense RedEdge sensor affixed to a DJI Matrice 100 was used to collect aerial images. Images were collected at an altitude of 50 m with a 75% overlap flight plan using Atlas Flight. The UAV used its built-in GPS to navigate, acquire, and store the images. After each flight, images were merged into orthomosaics in Pix4D software. Orthomosaic images were calibrated using the MicaSense calibration panel. Using the NDVI and NDRE formulas in the Pix4D index calculator where:
both indices were extracted from each individual plot to obtain an average of NDVI and NDRE for the entire plot. Grain yield was collected with a plot combine in the small research plots and with the growers combine for on-farm trials.
NDVI = (NIR − R)/(NIR + R);
NDRE = (NIR − RE)/(NIR + RE);
Table 6.
Locations and date of flight campaigns and tiller counts in small plots, i.e., to develop linear regression models for NDVI- and NDRE-based N recommendation rates and on-farm trials, to validate the models.
Pearson correlation coefficients between tiller density and the two aerial indices were performed in SAS. Linear regression was used to fit the relationship between tiller density counts and the NDVI and NDRE. Proc GLM procedure was used to determine the effect of nitrogen rate decision tool on nitrogen applied and yield using SAS 9.4 software (SAS Institute, Cary, NC, USA).
3. Results and Discussion
3.1. Comparison of Tiller Density Count with NDVI and NDRE
Results from the small plot trials across four site-years showed that tiller density was significantly (p < 0.001) correlated with aerial NDVI with 75% (R2 = 0.75) (Figure 1). The model describing this relationship is
where NDVIa is aerial NDVI extracted from images taken at 50 m altitude with 75% forward and lateral overlay. Aerial NDRE was also significantly (p < 0.001) correlated with tiller density with an R2 = 0.71. The relationship was described by
where NDREa is aerial NDRE extracted from the same images as the NDVI.
Previous research has shown that a winter wheat crop with 538 tillers m2 or more at GS 25 does not need any N application at this time [6]. Using this base line and the linear regression equations from our small plot trials, we determined at which NDVI and NDRE values nitrogen should be applied and in what amounts. For example, these equations show that 538 tillers m2 corresponded to an aerial NDVI of 0.62, and an aerial NDRE of 0.29 (Table 7). Therefore, following recommendations from Heiniger et al. (2021) at GS 25, if the crop has an aerial NDVI of 0.62 or greater, then N should not be applied. If the NDVI is less than 0.62, then N should be applied. Table 7 shows which rates should be applied at which NDVI and NDRE values and how this corresponds to tiller density. These data show that aerial NDVI and NDRE are excellent proxies for tiller density as they can accurately determine tiller density in winter wheat.
Table 7.
Nitrogen rate recommendations for tiller density, aerial NDVI, and aerial NDRE.
3.2. Nitrogen Application to Small Plots Using Indices
Using the remote values in Table 7, GS 25 N was applied using the NDVI and NDRE and compared to tiller density at EVAREC and TAREC in 2021. At EVAREC, NDVI and NDRE recommended 56 kg N ha−1, while tiller density recommended 0 kg N ha−1. At TAREC, tiller density, NDVI, and NDRE all recommended 36 kg N ha−1 at GS 25 (Table 8). Analysis of variance showed that there was no difference in grain yield among the three nitrogen rate decision methods at either location (Table 8).
Table 8.
GS 25 N recommendation and grain yield for small plot trials in 2021 based on tiller density, NDVI, and NDRE.
3.3. On-Farm Plots
In 2021–2022 and 2022–2023, the N rates derived from aerial NDVI and NDRE in Table 7 were used for GS 25 applications in the on-farm large plots. Analysis of variance of N applied at GS 25 showed no significant location × rate decision method interaction (Table 9). At CHVA and SFVA in 2022, and at DWVA in 2023, there was no significant difference between the amount of nitrogen recommended by NDVI, NDRE, or tiller density (Table 10). There was a significant difference in the amount of nitrogen recommended at WRVA in 2022 as NDVI and NDRE recommended 67.3 kg N ha−1, and tiller density only 22.4 kg N ha−1 (Table 10). At WRVA and SGVA in 2023, tiller density recommended significantly more N to be applied at GS 25 (Table 10). The tiller density method recommended 44.8 kg N ha−1 to be applied at GS 25 at SGVA in 2023 and 26.9 kg N ha−1 at WRVA in 2023, while NDVI and NDRE recommended that no N was needed at either location (Table 10). The difference in recommended N rate between methods can be attributed to the location and field variability, which was better accounted for using aerial images than physically counting tillers, e.g., NDVI and NDRE averaged the entire strip and tiller counting was at random locations within the strip.
Table 9.
Analysis of variance for GS 25 applied N at on-farm trials.
Table 10.
Location, method, and N rates applied at GS 25 at on-farm trials in 2022 and 2023.
There were no significant differences among the N application methods across locations for grain yield and there was no location × application method interaction in these on-farm trials (Table 11). Grain yield was 6.12 t ha−1 when N was applied based on aerial NDRE, 6.05 t ha−1 when N was applied based on aerial NDVI, and 5.92 when N was applied based on tiller density (Table 12).
Table 11.
Analysis of variance for grain yield at on-farm trials.
Table 12.
Grain yield at on-farm trials.
4. Conclusions
To determine whether there was a relationship between tiller density and aerial indices (NDVI and NDRE), this study initially examined the relationship between these indices and tiller density. Aerial NDVI and aerial NDRE were significantly related with tiller density and these indices were excellent proxies for tiller density. Subsequent studies, both in small plots and in larger strips on growers’ fields, showed that these methods recommend similar amounts of N to be applied at GS 25 and that the grain yield was similar whether N was applied based on tiller density, NDVI, or NDRE. Based on the results from this study, we can recommend that aerial NDVI and NDRE can be used as proxies for tiller density using the equations reported here. Specifically, if NDVI is above 0.62, then N is not needed in that particular location and field. If below 0.62, then Table 7 should be used for N application rates at GS 25. Similarly, for aerial NDRE, the threshold was 0.29. The ability to collect aerial NDVI or NDRE from a field gives growers a valuable tool in becoming able to assess the status of their winter wheat crop in January and February and help pinpoint the N needs at early growth stages.
In summary, tiller density is an important tool for growers to determine the rate and timing of mid-winter N application in winter wheat, but using vegetation indices NDVI and NDRE sensed remotely from a UAV is even more powerful because it can save growers time and N.
Author Contributions
J.O. designed and implemented the experiments, collected tiller density, and UAV flights, analyzed UAV data, planted and harvested the trials at EVAREC. J.O. developed the models presented and wrote the manuscript. M.B. helped with the design and implementation of experiments, data collection, and edited the manuscript. A.-B.C. helped with data collection, analysis, and edited the manuscript. W.T. helped with design and implementation of the experiments, planted and harvested at TAREC and SPAREC, and edited the manuscript. All authors have read and agreed to the published version of the manuscript.
Funding
This work was funded by the Delmarva Cooperative Seed Grant program and the Virginia Agricultural Council.
International Review Board Statement
Not applicable.
Data Availability Statement
Data are available from the corresponding author upon reasonable request.
Acknowledgments
The authors wish to thank the following for technical assistance and data collection: Michelle Lee, Mark Vaughn, Austin Gulasky, and Liz Rucker. The authors thank the following for assisting with on-farm trials and use of their farm and equipment: Robbie Longest, Jay Hundley, Scott Reiter, Todd Price, Mike Parrish, and Nick Moody.
Conflicts of Interest
The authors declare no conflicts of interest.
References
- Thomason, W.; Alley, M.; Wysor, W.; Phillips, S.; Parris, D. Using the Virginia Cooperative Extension Climate Analysis Web Tool to Better Manage and Predict Wheat Development; Pub. No. 424-004; Virginia Cooperative Extension Publication: Blacksburg, VA, USA, 2009. [Google Scholar]
- Klepper, B.; Rickman, R.W.; Peterson, C.M. Quanitative Characterization of Vegetative Development in Small Grains. Agron. J. 1982, 5, 789–792. [Google Scholar] [CrossRef]
- Friend, D.J.C.; Helson, V.A.; Fisher, J.E. Leaf growth in Marquis wheat as regulated by temperature light intensity and daylength. Can. J. Bot. 1962, 40, 1299–1311. [Google Scholar] [CrossRef]
- Thiry, D.E.; Sears, R.G.; Shroyer, J.P.; Paulsen, G.M. Planting date effects on tiller development and productivity of wheat. Kansas Kans. Agric. Exp. Stn. Res. Rep. 2002, 96. [Google Scholar] [CrossRef]
- Tilley, M.S.; Heiniger, R.W.; Crozier, C.R. Tiller Initiation and Its Effects on Yield and Yield Components in Winter Wheat. Agron. J. 2019, 111, 323–332. [Google Scholar] [CrossRef]
- Alley, M.M.; Shcarf, P.; Braun, D.E.; Baethgen, W.E.; Hammons, J.L. Nitrogen Management for Winter Wheat: Principles & Recommendations; Pub. No. 424-026; Virginia Cooperative Extension: Blacksburg, VA, USA, 2009. [Google Scholar]
- Jiang, J.; Wang, C.; Wang, Y.; Cao, Q.; Tian, Y.; Zhu, Y.; Cao, W.; Liu, X. Using an active sensor to develop new critical nitrogen dilution curve for winter wheat. Sensors 2020, 20, 1577. [Google Scholar] [CrossRef] [PubMed]
- Heiniger, R.; Hicks, K.; Gaitboni, L.; Post, A. Nitrogen Management for Small Grains. In Small Grain Production Guide; North Carolina State Extension: Raleigh, NC, USA, 2021. [Google Scholar]
- Ladha, J.K.; Tirol-Padre, A.; Reddy, C.K.; Cassman, K.G.; Verma, S.; Powlson, D.S.; van Kessel, C.; Richter, D.B.; Chakraborty, D.; Pathak, H. Global nitrogen budgets in cereals: A 50-year assessment for maize, rice, and wheat production systems. Sci. Rep. 2016, 6, 1–9. [Google Scholar] [CrossRef] [PubMed]
- Raun, W.; Johnson, G.V. Improving Nitrogen Use Efficiency for Cereal Production. Agron. J. 1999, 91, 357–363. [Google Scholar] [CrossRef]
- Camargo, J.; Alonso, A. Ecological and toxicological effects of inorganic nitrogen pollution in aquatic ecosystems: A global assessment. Environ. Int. 2006, 32, 831–849. [Google Scholar] [CrossRef] [PubMed]
- Flowers, M.; Weisz, R.; Heiniger, R. Remote sensing of winter wheat density for early nitrogen application decisions. Agron. J. 2001, 92, 783–789. [Google Scholar] [CrossRef]
- Basyouni, R.; Dunn, B.L.; Goad, C. Use of nondestructive sensors to assess nitrogen status in potted poinsettia production. Sci. Hortic. 2015, 192, 47–53. [Google Scholar] [CrossRef]
- Phillips, S.B.; Keahey, D.A.; Warren, J.G.; Mullins, G.L. Estimating winter wheat tiller density using spectral reflectance sensors for early-spring, variable-rate nitrogen applications. Agron. J. 2004, 96, 591–600. [Google Scholar] [CrossRef]
- Balota, M.; Oakes, J. Exploratory use of a UAV platform for variety selection in peanut. In Autonomous Air and Ground Sensing Systems for Agricultural Optimization and Phenotyping; SPIE: Bellingham, WA, USA, 2016; Volume 9866. [Google Scholar]
- Jiang, J.; Zhang, Z.; Cao, Q.; Liang, Y.; Krienke, B.; Tian, Y.; Zhu, Y.; Cao, W.; Liu, X. Use of an Active Canopy Sensor Mounted on an Unmanned Aerial Vehicle to Monitor the Growth and Nitrogen Status of Winter Wheat. Remote Sens. 2020, 12, 3684. [Google Scholar] [CrossRef]

Disclaimer/Publisher’s Note: The statements, opinions and data contained in all publications are solely those of the individual author(s) and contributor(s) and not of MDPI and/or the editor(s). MDPI and/or the editor(s) disclaim responsibility for any injury to people or property resulting from any ideas, methods, instructions or products referred to in the content. |
© 2024 by the authors. Licensee MDPI, Basel, Switzerland. This article is an open access article distributed under the terms and conditions of the Creative Commons Attribution (CC BY) license (https://creativecommons.org/licenses/by/4.0/).