Abstract
While Kerala’s transition from an agrarian to a service-oriented economy is widely acknowledged, discussions are most often confined to material domains, overlooking overall life satisfaction, which is critical to pursue any profession. This state-wide community-based cross-sectional survey was conducted to gather data from farmers residing in three geographical zones of Kerala, India, North, South and Central, to understand their life satisfaction and how it correlates to their access to resources and social support. From each zone, we randomly chose two districts, and from each district, two panchayats. From each panchayat, we chose one ward to identify a total of 580 eligible farmers. Structured interviews were conducted using door-knock surveys to elicit information from the respondents using a set of standardized questionnaires. The results suggest that the respondents had a mean age of 54.5, with 19.8% being over 65, indicating demographic ageing in the farming sector. Only 46% chose farming as their full-time occupation. Farmers with higher levels of education who owned large plots of land experienced life satisfaction. Interpersonal relationships and social support were significant determinants of life satisfaction, as these factors were pivotal in their access to formal and informal services. With social support being pivotal in life satisfaction, it is imperative to change the social mindset towards farming. Additionally, the government should promote advanced technologies and high-yielding agricultural practises to transform the economic landscape of Kerala in favour of agriculture, which is imperative for the food security of the state.
1. Introduction
India has experienced a notable economic shift from the 1970s to the 2020s, marked by substantial growth in the service sector and a decline in the agriculture sector []. The situation is no different for the southern state of Kerala, India []. The service sector in Kerala currently contributes more than 60% of its share of GSDP (Gross State Domestic Product), while, in comparison, agriculture and its allied activities contribute only 9% []. The percentage share of the agriculture and service sector to its income in 1960, however, was 53% and 18.8%, respectively []. A time-series trend analysis conducted by the Government of Kerala in 2011 revealed that the area under cultivation for most crops in the state significantly declined from 1990 to 2010 and was projected to decrease further by 2020 []. Further, another study reported an 80% decline in the cultivation of major crops in Kerala from 2003 to 2013 []. This decline can be attributed to various factors, including, but not limited to, low income from agriculture, indebtedness, insufficient financial resources and inputs, governmental regulations, environmental challenges, limited market linkages, time pressure, inadequate housing and suboptimal social networking opportunities [,,]. Climate change and the worsening conditions of the planet’s ecosystem during the last two decades posed challenges that drew scientists’ attention to the life satisfaction of individuals employed in the agricultural sector.
The existing studies in India on farming practises [,,] have predominantly focused on the economic dimensions of farming, explicitly examining factors such as productivity, market access and rural development. However, the farmer-related literature often misses intangible and non-material dimensions such as life satisfaction and social support. Various studies have found that positive emotions are linked to increased productivity and growth in other sectors, especially the secondary (manufacturing) and tertiary (service) sectors. Even the limited number of studies conducted to explore the emotional dimensions of farming were carried out from an illness perspective, assessing mental disorders and ill-being rather than life satisfaction [,,,,]. The mental health perspective in agriculture is crucial, especially in the context of increased farmer suicides [], which are often attributed to farmers’ financial conditions due to the aggressive market dominance of large-scale dealers and huge agricultural market fluctuations, as well as natural challenges such as droughts, floods, epidemics affecting farm animals and so on [].
Studies also point to a complex interplay of financial, environmental and, notably, social support factors influencing the mental well-being of farmers []. On the economic front, the severe labour shortage and higher wages in Kerala are disincentives for many farmers who want to continue cultivation. The parity index of prices received by the farmers compared to the expenses of the farmers has always been prohibitive. An alternative option in this context is strengthening the social support networks of farmers, including immediate family, friends and neighbours, as well as broader networks of consumers, local communities, local self-governments and non-governmental organizations []. These social resources act as social, economic, emotional and cultural support to sustain the farmers’ optimal well-being [,], thereby increasing their life satisfaction.
Owing to urban expansion and infrastructure development, most farmers in Kerala, India, are smallholders who cultivate small parcels of land []. Smallholding is a barrier to using modern inputs, value-addition strategies and newer technologies and practises. Collective action is required to mitigate these barriers and enhance the productivity of smallholder agriculture []. So far, increased productivity measures have focused on scientific and economic domains and have often ignored the importance of the social and emotional aspects of farmers [,]. Life satisfaction is essential for maintaining one’s well-being in a profession, as it contributes to better mental health, greater resilience and increased motivation—factors that are crucial for perseverance, even in challenging circumstances []. In addition to economic factors, life satisfaction depends on social support, including both formal and informal, as well as interpersonal []. These factors have an impact on the cultural pride of the farmers as well. A low life satisfaction prompts farmer to contemplate a shift in their careers, and it is widely recognized that fostering life satisfaction is a pivotal determinant of professional longevity.
From a food security perspective, it is crucial to support farmers in continuing their agricultural activities despite their poor health, low quality of life, limited access to education for their children, low income and relative social isolation []. Kerala’s agriculture sector stands different to other states in India because of its diverse topography, crop diversity, fragmented landholding leading to small-scale farming and other socio-economic indicators like high literacy and education [], which make the state a unique case for identifying the life satisfaction of small-scale farmers and its socio-demographic correlates. The present study uses an innovative interdisciplinary approach, combining positive psychology, sociology and sustainable development studies [], to identify factors associated with life satisfaction to sustain their and motivation to continue in farming. The current study thus assesses the research question: how do demographic factors, access to services, and social support from significant others, friends and family influence life satisfaction among individuals, and what are the relationships between these variables? We believe that addressing the identified factors would improve various aspects of life satisfaction, including physical, social, economic, and psychological domains among farmers. This improvement is a prerequisite to fostering a farming culture that effectively addresses the country’s food needs. The current study addresses the following research questions:
- (a)
- How do demographic factors (e.g., age and socio-economic status) influence life satisfaction among individuals?
- (b)
- How do different forms of social support (from significant others, friends and family) impact life satisfaction?
- (c)
- Does social support moderate the relationship between demographic factors and life satisfaction?
2. Materials and Methods
2.1. Study Design
This study delved into the farming community of Kerala, India, employing a community-based cross-sectional study. A household survey design using a door-knock survey was chosen for data collection in the current study. After obtaining informed consent, respondents were interviewed at their households using a structured questionnaire of several standardized measurement tools prepared for the project. The completion of each questionnaire lasted between 20 and 30 min.
2.2. Participant Recruitment
Kerala was strategically segmented into three zones: North, South and Central. The north zone consists of districts like Kasaragod, Kannur, Wayanad and Kozhikode; the central zone entails the districts of Malappuram, Palakkad, Thrissur and Ernakulam; and the south zone consists of Idukki, Kottayam, Alappuzha, Pathanamthitta, Kollam and Thiruvananthapuram. Two districts from each zone—Wayanad and Kannur from the North zone; Ernakulam and Thrissur from the Central zone; and Kottayam and Alappuzha districts from the South—were randomly selected using a stratified sampling method. Further, two panchayats (local self-government bodies in each district) were randomly chosen from every district. For seamless data collection, the necessary permissions were obtained from the local governing bodies of the selected panchayats. A comprehensive list of farmers residing in these localities was obtained from the Panchayat, and farmers were selected using sequential sampling. A total of 50 farmers were selected from the list from each panchayat and were approached at their residences to obtain consent to participate. The study included all the farmers who consented to participate and were available at the data collection point. Further, only those farmers who were involved in farming practises for the last two years were included. The data collection through the door-knock survey took place between October and December 2023. The survey questionnaire is attached as Supplementary File (Table S1).
2.3. Procedural Details
The data were collected by trained post-graduate social work students under the regular supervision of the research team. The students were given two days of training on the data collection procedures, questionnaire administration and rapport-building. The data were collected with the help of local leaders and community health volunteers in the respective locations. A total of 580 farmers consented to participate in the study and were included in the analysis.
2.4. Measurements
2.4.1. Sociodemographic Variables
The socio-demographic variables included age, gender, education, economic status, marital status, ownership status of home, employment status, monthly income from farming, ownership of land and size of land owned. Participants’ age was documented in years and later categorized into the following subgroups: ‘20–34 years’, ‘35–65 years’ and ‘over 65 years’. Gender was classified as ‘Male’ and ‘Female’. Educational attainment was measured using distinct categories: ‘Uneducated’, ‘Did not complete primary education’, ‘Completed primary education’, ‘Completed secondary education’ and ‘Completed tertiary education’. The colour of the respondents’ ration cards was used to determine their financial situation. Different colours are used to denote different economic statuses in the Kerala ration card system: yellow for Antyodaya Anna Yojana (AAY) cards (the poorest households), pink for Priority Household (P.H.) cards (the households that are below the poverty line), blue for Non-Priority Subsidy or Above Poverty Line cards and white for non-priority household cards. The yellow and pink cards were categorized as ‘Below the Poverty Line (BPL)’, while the blue and white cards were categorized as ‘Above the Poverty Line (APL)’.
The marital status of the farmer respondents was recorded as ‘unmarried’, ‘married’ or ‘widowed or divorced or separated’. Home ownership status was categorized as ‘owned home’ and ‘rented home’. The employment status of the farmers was classified as ‘full-time’, ‘part-time’ (has other formal occupations along with farming) and ‘seasonal’ (farming activities during seasons, rather than year-round). Similarly, the monthly income was measured in the following categories—less than 10,000 (USD 120), between 10,000 and 20,000 (USD 120 to USD 240), between 20,000 and 40,000 (USD 240 to USD 480), between 40,000 and 60,000 (USD 480 to USD 720) and above 60,000 (USD 720). Land ownership was recorded as ‘farming on own land’ and ‘tenant’. The size of the land owned was measured as ‘below 1 acre’, ‘1–5 acres’, ‘5–10 acres’ and ‘above 10 acres’.
2.4.2. Access of Farmers to Various Services
This was assessed through a series of self-reported questions that inquired about the participants’ access to (a) mental health services and (b) healthcare resources, (c) awareness and access to schemes and services for farmers from the government, and access to (d) market linkages and (e) technical aid support. The response options were categorized as ‘Yes’ (1) or ‘No’ (0). A continuous variable on access to services was developed by combining all the individual questions, with a higher score indicating better access to services.
2.4.3. Social Support
The social support of the respondents was assessed using the Multidimensional Scale of Perceived Social Support (“MSPSS”). The MSPSS is a 12-item scale that assesses individuals’ perceptions of the support they receive from various sources. In the MSPSS, the responses were recorded on a 7-point Likert scale in the range of very strongly disagree (1), strongly disagree (2), mildly disagree (3), neutral (4), mildly agree (5), strongly agree (6) and very strongly agree (7). The scale has good internal consistency and validity, with a Cronbach’s alpha of 0.87 and 0.91 in the clinical and non-clinical samples, respectively [,].
2.4.4. Life Satisfaction
Life satisfaction was measured using the Satisfaction with Life Scale []. This scale contains five items measured in a 7-point Likert scale in the range of strongly disagree (1), disagree (2), slightly disagree (3), neither agree nor disagree (4), slightly agree (5), agree (6) and strongly agree (7). The total score is obtained by summing the responses to each item. The scale demonstrates good internal consistency and reliability, with a Cronbach’s alpha of 0.74 [,].
2.5. Data Analysis
The data were analyzed using descriptive statistics, chi-square and multiple linear regression. The study variables were described using descriptive variables like means, standard deviations, frequencies and percentages. Pearson correlation was used to determine the association between continuous variables. t-test, ANOVA, simple linear regression and multiple linear regression analyses were used to examine the relationship between the outcome variable and exposure variables. Statistical significance was determined using the appropriate significance levels (e.g., p < 0.05), indicating the presence of associations between the exposure variables and the outcome variable. Statistical analysis was performed using STATA version 15.0 (StataCorp LLC Version 15, Lakeway Drive, TX, USA).
Structural equation modelling was used to estimate the mediating effect of variables on life satisfaction. The maximum likelihood estimation method (mlmv) was used in the SEM analysis, considering measurement errors. We utilized the comparative fit index (CFI), the Tucker–Lewis fit index (TLI), the root mean square error of approximation (RMSEA), and the Standardized Root Mean Squared Residual (SRMR) as goodness of fit indices for model evaluation. The acceptable threshold for RMSEA was ≤0.06, for SRMR was ≤0.05, and for of the rest of the indices, such as CFI, was ≥0.95 []. The direct, indirect and total effects of the relationship between the variables in the model were also presented.
3. Results
The mean age of the respondents was 54.5, with 19.8% of the population above 65 years of age. The study population included 74.5% males and the rest females. A total of 81.4% of the population belonged to households above the poverty line. Further, only 2.8% of the population was uneducated, and 27.8% completed a tertiary education. A large majority of the population was married (87%). A total of 46.9% of the population were full-time farmers, 37.1% were part-time farmers, and 16% were seasonal farmers. The monthly income from farming was less than INR 10,000/-(120.6 USD) for 51% of the farmers. Although the majority of farmers engaged in cultivating their land, more than 60% of them possessed less than one acre of cultivable land.
Table 1 further describes the life satisfaction level based on the various demographic variables. The results show that farmers belonging to APL households, who owned farmland, who were married and who possessed higher educational levels reported a significantly higher level of life satisfaction.

Table 1.
Demographic information of the respondents (n = 580).
Figure 1 represents the current study’s respondents’ access to schemes, services and support networks. Connectivity and support in the study are measured through access to mental health services, awareness and access to schemes and services for farmers from the government, and support networks from friends, family and significant others. The findings show that among the participants, farmers aged above 65 years had better access to services, including mental health and health services, and better access and awareness to provisions and schemes provided by the government. However, agricultural connectivity indicated by market linkages and technical support accessed was comparatively higher among farmers aged below 35 in the current study. Middle adults had larger support networks from family and significant others, while young adults had better networks from friends.
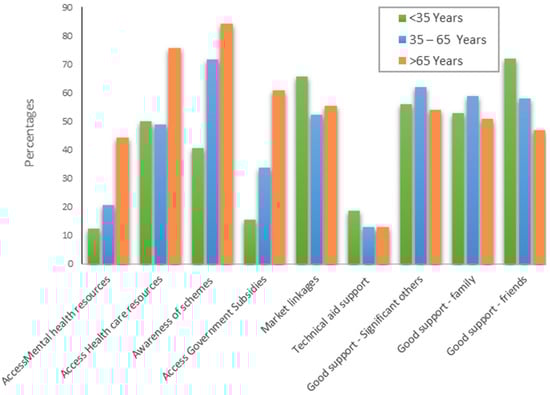
Figure 1.
Connectivity and support grouped by the age categories of farmers in the study. Data Source: Raw data collected by the author.
Table 2 describes the correlation between the major outcome variable of life satisfaction and the other continuous covariates. Table 2 suggests that there is an average positive correlation between social support from significant others, family and friends and life satisfaction, indicating life satisfaction increases with an increase in social support. Additionally, there is a low positive correlation between access to services and life satisfaction. The relationship indicates that the life satisfaction of farmers increases with an increase in access to services.
Table 2.
Correlation matrix of major variables in the study.
Table 3 describes a linear regression analysis of life satisfaction with significant independent variables. The R-squared value is 0.35, indicating that the model explains 35% of the variance in the dependent variable, suggesting a moderate fit. Simple linear regression analysis found that life satisfaction was significantly associated with social support, age, access to resources, economic status and ownership of land. One unit increase in the access to services and social support from significant others, family and friends increased life satisfaction by 0.4, 2.3, 2.4 and 1.4 times, respectively. Further, the result also revealed that compared to respondents with a monthly income of less than 120 US dollars, respondents with an income above USD 720 had a higher life satisfaction. Additionally, compared to respondents with land of less than 1 acre, respondents with land above 5 and 10 acres had 2.3 and 3.1 times higher life satisfaction. Also, compared to full-time farmers, seasonal farmers had significantly lower levels of life satisfaction.
Table 3.
Linear regression analysis of life satisfaction with other covariates.
In the multiple regression model, age; social support from significant others, family and friends; and land ownership were significant predictors of life satisfaction among farmers. The results showed that per one-unit increase in support from significant others, family and friends, the farmers’ life satisfaction increased by 1.3, 0.9 and 0.3 times, respectively, meaning support from significant others is the most crucial.
The SEM results suggested a significant relationship between variables (Figure 2). All the fit indices fell within levels of acceptable values (x2: 13.2, p > chi2: 0.038, RMSEA: 0.046, CFI: 0.993, TLI: 0.983, SRMR: 0.020). Social support (Std Coeff: 0.54, p ≤ 0.001), age (Std Coeff: 0.14, p ≤ 0.001) and socio-economic status (above poverty line households, (Std Coeff: 0.14, p ≤ 0.01) significantly predicted life satisfaction in the model. Social support in the population further mediated the relationship between economic status and life satisfaction—individuals with a high income and with higher levels of social support experienced a compounded positive effect on their life satisfaction. The direct, indirect and total effects of the relationships between the variables are described in Table 4.
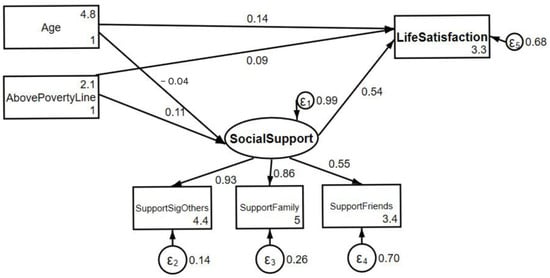
Figure 2.
Structural equation modelling social support and life satisfaction with major demographic variables.
Table 4.
Direct, indirect and total effects of the relationships with life satisfaction.
4. Discussion
The current study explores the factors associated with life satisfaction that go beyond the traditional economic and sociological indicators, providing insights into demographic and psychological elements that jointly determine longevity in the farming profession. In addition to the demographic variables of increased age, income and ownership of land, social support from significant others, family and friends was positively associated with life satisfaction in the current study. Social support in the population further mediates the relationship between economic status and life satisfaction, meaning people from a higher socio-economic status who have stronger social networks experience meaningful interactions and display greater emotional stability, leading to higher overall life satisfaction. The current study results were similar to other studies, which showed associations of life satisfaction with financial security and income, age [,] and social support []. The current study findings thus suggest that social support is a critical factor for life satisfaction, not just the financial wealth of farmers.
Farming ranks among the ten most stressful occupations in the world [], leading to negative psychological consequences. The current study shows that the mean age of the respondents was 54.5, with 19.8% of the population above 65 years of age, indicating the failure of the agricultural industry of Kerala to attract and retain younger farmers, as indicated in several other studies and reports [,]. The reason could be the diminished life satisfaction derived from farming, coupled with the higher economic, social and cultural satisfaction experienced in the service sector. This motivates the younger members of agricultural households to pursue higher education opportunities. Subsequently, they tend to prefer employment in non-agricultural sectors, and especially in the service sector. Existing statistical data showed that the percentage of cultivators declined from 17.80% in 1971 to 5.77% in 2011 and labourers from 30.70% in 1971 to 11% in 2011 [].
Additionally, the monthly income from farming is less than INR 10,000/-(120 USD) for 51% of the farmers in the current study, similar to the national average in India []. This meagre income, falling below the state government-prescribed minimum wage (average of INR 13,500/-(165 USD), acts as a significant barrier to life satisfaction in the youth and is a primary reason preventing them from considering farming as a viable career choice. Consequently, only 46.9% of respondents in the current study were engaged full-time in farming; 37.1% were part-time and 16% were seasonal farmers. To attract more younger people into agriculture in Kerala, it is imperative to address the diverse factors that impede life satisfaction in farmers.
Small landholding poses another challenge to the implementation of technological advancements for increased productivity while minimizing labour costs. The current study showed that more than 60% of the respondents possessed less than one acre (0.404 hectares) of land. Government statistics also support this finding that marginal and small cultivators constitute 98% of the total cultivators in Kerala []. Young people do not consider farming a full-time professional option []. Even among the older farmers, only those who owned larger agricultural plots considered farming as a full-time option. However, a higher level of education, with almost 97.2% of farmers having completed secondary or tertiary education, holds significant potential importance. This provides an opportunity for educating and promoting the adoption of emerging technologies and methodologies, sustainable agriculture practises, and the maximization of production to achieve economic viability in the agriculture sector, which is a prerequisite for life satisfaction.
One of the significant facilitators for full-time farmers in the current study was their strong social linkages and social support, particularly from significant others. These individuals might offer a unique kind of support that farmers do not receive from family or friends, such as professional advice, mentorship or objective emotional support. Importantly, social linkages helped them to learn about emerging technologies and enabled their access to a range of government and non-government schemes, provisions and programmes to enhance the viability of the farming profession, as reported by other studies [,]. Among social linkages, young farmers and farmers above 65 had better networking with friends and accessed government provisions. The younger farmers had a better linkage with the market and utilized technological inputs and supports. Inducting younger people into agriculture will facilitate a transition from conventional farming methods to adopting new technologies and innovations in the farms or transferring the technological advancement from the lab to the field, which is critical for increased production, economic sustainability and the life satisfaction of those who engage in it [,]. The educated younger generation creates a perfect context to introduce newer technologies like global positioning systems (GPSs), internet-connected sensors (to monitor pipe leaks), innovative machinery and farm management software to inform decision-making and reduce labour intensity and input costs.
Therefore, the farmers’ significant barriers to life satisfaction were economic nonviability and a lack of social acceptance []. Amidst constraints such as smallholding size, inadequate return on investment and negative stereotypes, the task of motivating the younger generation to engage in farming necessitates the implementation of alternative strategies. From this perspective, it is recommended that educated youth should imbibe the habit of farming. Additionally, those who own smallholding agricultural land could consider pursuing supplementary employment opportunities in the service or manufacturing sector as an additional source of income. Furthermore, they can cultivate a routine of dedicating their after-office work hours to agricultural activities. Balancing farming and other occupations would contribute to their financial stability and enhance the prestige of the farming profession, thereby allowing them to experience life satisfaction. Additionally, alternative jobs would enable social linkages, and these social networks would expose them to newer technologies, knowledge, trends and awareness of government programmes [].
In this context, the government schemes to support farmers, such as subsidies and crop support prices, advisory services and training schemes, should also consider including job portals to create multiple opportunities for the educated youth for additional jobs and enable unskilled youth to enhance their skill sets. Additional job options are plausible, as the entire state is either urban or semi-urban and has easy access to the job market. This study’s findings on the importance of social support, along with financial resources, suggest that significant measures should be introduced to not only focus on improving economic conditions but also on fostering strong social support systems, such as community-building initiatives, and other services for mental health support for farmers. Farmer support groups, especially with friends, have positive outcomes regarding access and life satisfaction [,,]. Therefore, it is imperative to focus on strengthening these groups.
This study has its limitations. First, the study’s cross-sectional nature hinders attempts to establish causal links between the relevant variables. Further, response biases and subjective interpretations are risky when relying on self-reported measures of farmers’ social support networks. Longitudinal studies that would provide researchers with a more thorough grasp of how social support changes and how that change affects farmers’ well-being can be studied.
5. Conclusions
Life satisfaction in farmers will ensure future food security and sustainable agriculture. In the current study, social support not only has a direct positive impact on life satisfaction, but it further enhances the effect of income on life satisfaction. Additionally, support from significant others was considered most valuable. Strengthening connections with trusted external individuals can provide emotional and practical support that has a stronger positive impact on farmers’ life satisfaction. In essence, these findings invite policy makers to take steps to boost the life satisfaction of farmers in order to ensure the sustainability and future of farming in the state.
Supplementary Materials
The following supporting information can be downloaded at: https://www.mdpi.com/article/10.3390/agriculture14101671/s1, Table S1: Survey Questionnaire.
Author Contributions
Conceptualization, S.M.D. and S.I.P.; methodology, S.M.D.; formal analysis, L.S.; investigation, S.V.Y.; resources, S.M.D. and S.I.P.; writing—original draft preparation, S.M.D.; writing—review and editing, S.I.P., L.S. and S.V.Y.; supervision, S.M.D. and S.I.P.; project administration, S.M.D. and S.I.P.; funding acquisition, S.M.D. All authors have read and agreed to the published version of the manuscript.
Funding
This project was financially supported by the Rajagiri College of Social Sciences, under seed money for faculty Minor Research (RCSS/IQAC/BB-S15/2023/11).
Institutional Review Board Statement
This study was conducted in accordance with the Declaration of Helsinki and approved by the Institutional Review Board of Rajagiri College of Social Sciences (Autonomous).
Data Availability Statement
The data will be made available on request to the corresponding author.
Acknowledgments
The authors would like to thank the participants for providing the information for the current study.
Conflicts of Interest
The authors declare no conflicts of interest.
References
- Newsreel Asia. Indian Economy’s Shift from Agriculture to Services. 2024. Available online: https://www.newsreel.asia/articles/indian-economys-shift-from-agriculture-to-services (accessed on 22 August 2024).
- Kumar, C.; Jayaraman, M.; Raju, P.S. Agricultural land-use change in Kerala, India: Perspectives from above and below the canopy. Agric. Ecosyst. Environ. 2017, 240, 40–52. [Google Scholar] [CrossRef]
- Kerala State Planning Board. Economic Review 2023. 2024. Available online: https://spb.kerala.gov.in/sites/default/files/2024-02/ER_English_Vol_1_2023.pdf (accessed on 22 August 2024).
- Kerala State Planning Board. Economic Review 1960. 1961. Available online: https://spb.kerala.gov.in/sites/default/files/inline-files/1960.pdf (accessed on 22 August 2024).
- Kerala State Planning Board. Time Series Analysis of the Trend in Agriculture Production, Kerala. 2011. Available online: https://spb.kerala.gov.in/sites/default/files/inline-files/EVN06.pdf (accessed on 17 August 2024).
- International Labour Organization. Asia-Pacific Sectoral Labour Market Profile: Agriculture. ILO Brief. 2022. Available online: https://www.ilo.org/resource/brief/asia-pacific-sectoral-labour-market-profile-agriculture (accessed on 5 May 2024).
- Fraser, C.E.; Smith, K.B.; Judd, F.; Humphreys, J.S.; Fragar, L.J.; Henderson, A. Farming and Mental Health Problems and Mental Illness. Int. J. Soc. Psychiatry 2005, 51, 340–349. [Google Scholar] [CrossRef] [PubMed]
- Taylor, J.E.; Charlton, D. The Farm Labor Problem: A Global Perspective; Academic Press: Cambridge, MA, USA, 2018. [Google Scholar]
- Urfels, A.; Mausch, K.; Harris, D.; McDonald, A.J.; Kishore, A.; Singh, B.; van Halsema, G.; Struik, P.C.; Craufurd, P.; Foster, T.; et al. Farm size limits agriculture’s poverty reduction potential in Eastern India even with irrigation-led intensification. Agric. Syst. 2023, 207, 103618. [Google Scholar] [CrossRef] [PubMed]
- Priyadarshini, P.; Abhilash, P.C. Agri-food systems in India: Concerns and policy recommendations for building resilience in post COVID-19 pandemic times. Glob. Food Secur. 2021, 29, 100537. [Google Scholar] [CrossRef]
- Ghosh-Jerath, S.; Kapoor, R.; Dhasmana, A.; Singh, A.; Downs, S.; Ahmed, S. Effect of COVID-19 Pandemic on Food Systems and Determinants of Resilience in Indigenous Communities of Jharkhand State, India: A Serial Cross-Sectional Study. Front. Sustain. Food Syst. 2022, 6, 724321. [Google Scholar] [CrossRef]
- Yazd, S.D.; Wheeler, S.A.; Zuo, A. Key Risk Factors Affecting Farmers’ Mental Health: A Systematic Review. Int. J. Environ. Res. Public Health 2019, 16, 4849. [Google Scholar] [CrossRef]
- Dongre, A.R.; Deshmukh, P.R. Farmers’ suicides in the Vidarbha region of Maharashtra, India: A qualitative exploration of their causes. J. Inj. Violence Res. 2012, 4, 2–7. [Google Scholar] [CrossRef]
- Feng, D.; Ji, L.; Xu, L. Effect of subjective economic status on psychological distress among farmers and non-farmers of rural China. Aust. J. Rural Health 2015, 23, 215–220. [Google Scholar] [CrossRef]
- Judd, F.; Jackson, H.; Komiti, A.; Murray, G.; Fraser, C.; Grieve, A.; Gomez, R. Help-Seeking by Rural Residents for Mental Health Problems: The Importance of Agrarian Values. Aust. N. Z. J. Psychiatry 2006, 40, 769–776. [Google Scholar] [CrossRef]
- Thomas, H.V.; Lewis, G.; Thomas, D.R.; Salmon, R.L.; Chalmers, R.M.; Coleman, T.J.; Kench, S.M.; Morgan-Capner, P.; Meadows, D.; Sillis, M.; et al. Mental health of British farmers. Occup. Environ. Med. 2003, 60, 181–186. [Google Scholar] [CrossRef]
- National Crime Records Bureau. Accidental Deaths and Suicides in India 2022. Ministry of Home Affairs, Government of India. 2022. Available online: https://ncrb.gov.in/uploads/files/AccidentalDeathsSuicidesinIndia2022v2.pdf (accessed on 4 June 2024).
- Kennedy, A.J.; Maple, M.J.; McKay, K.; Brumby, S.A. Suicide and accidental death in Australia’s rural farming communities: A review of the literature. Rural Remote Health 2014, 14, 2517. [Google Scholar] [CrossRef] [PubMed]
- Beniwal, A.; Mathur, A. Farmers’ Wellbeing: A Scoping Review of Psychological and Social Wellbeing of Farming Community. Bhartiya Krishi Anusandhan Patrika 2022, 38, 35–40. [Google Scholar] [CrossRef]
- Janker, J.; Mann, S.; Rist, S. Social sustainability in agriculture—A system-based framework. J. Rural Stud. 2019, 65, 32–42. [Google Scholar] [CrossRef]
- Deegan, A.; Dunne, S. An investigation into the relationship between social support, stress, and psychological well-being in farmers. J. Community Psychol. 2022, 50, 3054–3069. [Google Scholar] [CrossRef]
- Deneulin, S.; McGregor, J.A. The capability approach and the politics of a social conception of wellbeing. Eur. J. Soc. Theory 2010, 13, 501–519. [Google Scholar] [CrossRef]
- Innazent, A.; Jacob, D.; Bindhu, J.S.; Joseph, B.; Anith, K.N.; Ravisankar, N.; Prusty, A.K.; Paramesh, V.; Panwar, A.S. Farm typology of smallholders integrated farming systems in Southern Coastal Plains of Kerala, India. Sci. Rep. 2022, 12, 333. [Google Scholar] [CrossRef]
- Samberg, L.H.; Gerber, J.S.; Ramankutty, N.; Herrero, M.; West, P.C. Subnational distribution of average farm size and smallholder contributions to global food production. Environ. Res. Lett. 2016, 11, 124010. [Google Scholar] [CrossRef]
- Alwang, J.; Larochelle, C.; Barrera, V. Farm Decision Making and Gender: Results from a Randomized Experiment in Ecuador. World Dev. 2017, 92, 117–129. [Google Scholar] [CrossRef]
- Heo, W.; Lee, J.M.; Park, N. Financial-related psychological factors affect life satisfaction of farmers. J. Rural Stud. 2021, 82, 189–202. [Google Scholar] [CrossRef]
- Amati, V.; Meggiolaro, S.; Rivellini, G.; Zaccarin, S. Social relations and life satisfaction: The role of friends. Genus 2018, 74, 7. [Google Scholar] [CrossRef]
- Rockler, B.E.; Grutzmacher, S.K.; Garcia, J.; Braverman, M.T.; Smit, E. Something to eat: Experiences of food insecurity on the farm. Agric. Hum. Values 2023, 40, 1419–1436. [Google Scholar] [CrossRef] [PubMed]
- Cafer, A.M.; Rikoon, J.S. Adoption of new technologies by smallholder farmers: The contributions of extension, research institutes, cooperatives, and access to cash for improving tef production in Ethiopia. Agric. Hum. Values 2018, 35, 685–699. [Google Scholar] [CrossRef]
- Bukchin, S.; Kerret, D. Food for Hope: The Role of Personal Resources in Farmers’ Adoption of Green Technology. Sustainability 2018, 10, 1615. [Google Scholar] [CrossRef]
- Zimet, G.D.; Dahlem, N.W.; Zimet, S.G.; Farley, G.K. The Multidimensional Scale of Perceived Social Support. J. Pers. Assess. 1988, 52, 30–41. [Google Scholar] [CrossRef]
- Wongpakaran, T.; Wongpakaran, N.; Ruktrakul, R. Reliability and Validity of the Multidimensional Scale of Perceived Social Support (MSPSS): Thai Version. Clin. Pract. Epidemiol. Ment. Health 2011, 7, 161. [Google Scholar] [CrossRef]
- Diener, E.; Emmons, R.A.; Larsen, R.J.; Griffin, S. The Satisfaction with Life Scale. J. Personal. Assess. 1985, 49, 71–75. [Google Scholar] [CrossRef]
- López-Ortega, M.; Torres-Castro, S.; Rosas-Carrasco, O. Psychometric properties of the Satisfaction with Life Scale (SWLS): Secondary analysis of the Mexican Health and Aging Study. Health Qual. Life Outcomes 2016, 14, 170. [Google Scholar] [CrossRef]
- Ma, X.; Wang, J.; Zhao, L.; Han, J. The effects of social capital on farmers’ wellbeing in China’s undeveloped poverty-stricken areas. China Agric. Econ. Rev. 2019, 12, 108–121. [Google Scholar] [CrossRef]
- Hooper, D.; Coughlan, J.; Mullen, M.R. Structural Equation Modelling: Guidelines for Determining Model Fit. Electron. J. Bus. Res. Methods 2008, 6, 53–60. [Google Scholar]
- Kumar, P.; Kumar, P.; Garg, R.K. A study on farmers’ satisfaction and happiness after the land sale for urban expansion in India. Land Use Policy 2021, 109, 105603. [Google Scholar] [CrossRef]
- Kolstrup, C.L.; Kallioniemi, M.; Lundqvist, P.; Kymäläinen, H.-R.; Stallones, L.; Brumby, S. International Perspectives on Psychosocial Working Conditions, Mental Health, and Stress of Dairy Farm Operators. J. Agromed. 2013, 18, 244–255. [Google Scholar] [CrossRef]
- Bezu, S.; Holden, S. Are Rural Youth in Ethiopia Abandoning Agriculture? World Dev. 2014, 64, 259–272. [Google Scholar] [CrossRef]
- Food and Agriculture Organization of the United Nations. The Future of Food and Agriculture: Trends and Challenges. 2017. Available online: https://www.fao.org/policy-support/tools-and-publications/resources-details/en/c/472484/ (accessed on 6 June 2024).
- Girdziute, L.; Besuspariene, E.; Nausediene, A.; Novikova, A.; Leppala, J.; Jakob, M. Youth’s (Un)willingness to work in agriculture sector. Front. Public Health 2022, 10, 937657. [Google Scholar] [CrossRef] [PubMed]
- Ministry of Agriculture and Farmers Welfare, Government of India. Farmers Income. Available online: https://pib.gov.in/PressReleaseIframePage.aspx?PRID=1909208 (accessed on 22 August 2024).
- Abraham, M.P.; Kumar, B.P. Leading Issues and challenges in the Agriculture Sector of Kerala. Int. J. Res. Econ. Soc. Sci. 2021, 11, 138–150. Available online: https://mpra.ub.uni-muenchen.de/108759/ (accessed on 20 July 2024).
- Mohanakumar, S.; Sharma, R.K. Analysis of Farmer Suicides in Kerala. Econ. Political Wkly. 2006, 41, 1553–1558. Available online: http://www.jstor.org/stable/4418114 (accessed on 22 August 2024).
- Beacham, A.M.; Vickers, L.H.; Monaghan, J.M. Vertical farming: A summary of approaches to growing skywards. J. Hortic. Sci. Biotech. 2019, 94, 277–283. [Google Scholar] [CrossRef]
- Soosai-Nathan, L.; Fave, A.D. The Well-Being of Workers in the Agricultural Sector. In The Wiley Blackwell Handbook of the Psychology of Positivity and Strengths-Based Approaches at Work; John Wiley & Sons, Ltd.: Hoboken, NJ, USA, 2017; pp. 527–545. [Google Scholar] [CrossRef]
- Agarwal, B.; Agrawal, A. Do farmers really like farming? Indian farmers in transition. Oxf. Dev. Stud. 2017, 45, 460–478. [Google Scholar] [CrossRef]
Disclaimer/Publisher’s Note: The statements, opinions and data contained in all publications are solely those of the individual author(s) and contributor(s) and not of MDPI and/or the editor(s). MDPI and/or the editor(s) disclaim responsibility for any injury to people or property resulting from any ideas, methods, instructions or products referred to in the content. |
© 2024 by the authors. Licensee MDPI, Basel, Switzerland. This article is an open access article distributed under the terms and conditions of the Creative Commons Attribution (CC BY) license (https://creativecommons.org/licenses/by/4.0/).