Article

Carbon Footprint of a Typical Crop–Livestock Dairy Farm in Northeast China

1
College of Electrical and Information, Northeast Agricultural University, Harbin 150030, China
2
Institute of Atmospheric Environment, Chinese Research Academy of Environmental Sciences, Beijing 100012, China
*
Authors to whom correspondence should be addressed.
Agriculture 2024, 14(10), 1696; https://doi.org/10.3390/agriculture14101696
Submission received: 20 July 2024 / Revised: 26 August 2024 / Accepted: 25 September 2024 / Published: 27 September 2024

Abstract

:
Dairy farming is one of the most important sources of greenhouse gas (GHG) emissions in the livestock sector. In order to identify the key emission links and the best emission-reduction strategies for combined dairy farms, this study selected a typical large-scale combined dairy farm in northeast China, constructed a carbon emission model based on the lifecycle assessment concept, and set up different emission reduction scenarios to explore the zero-carbon pathway for combined dairy farms. The results showed that: (1) enteric fermentation and manure management of cows are important sources of carbon emissions from the seeding-integrated dairy farms, accounting for 38.2% and 29.4% of the total, respectively; (2) the seeding-integrated system showed a 10.6% reduction in carbon footprint compared with the non-seeding-integrated system; and (3) scenarios 1–4 reduced carbon emissions by 9%, 20%, 42%, and 61% compared with the baseline scenario, respectively. Therefore, the integrated-farming model is important for the green development of animal husbandry, and as the “net-zero” goal cannot be achieved at present, integrated-farming dairy farms have the potential for further emission reduction. The results of this study provide a theoretical basis for low-carbon milk production.

1. Introduction

Agriculture is one of the most important sources of global greenhouse gas (GHG) emissions, accounting for 10–12% of total global emissions. Livestock farming is one of the most important sources of these emissions. The global GHG emissions from livestock farming in 2018 were about 3.5 gigatons CO2-eq, which accounted for 66% of the total GHG emissions from agriculture [1]. Among them, dairy farming emits about 0.6 gigatons CO2-eq of GHGs [2], accounting for 17% of the total GHG emissions from livestock.
As a major consumer of dairy products, China’s GHG emissions from animal husbandry cannot be ignored. In 2018, China’s GHG emissions from animal husbandry were about 0.3 gigatons CO2-eq, accounting for 47% of its total agricultural GHG emissions, of which dairy farming emitted about 0.04 gigatons of GHGs [2], accounting for 13% of the total GHG emissions from animal husbandry. In recent years, per-capita milk consumption in China has shown a significant growth trend. According to the China Statistical Yearbook (2020), in 2019, China’s per capita milk consumption was 12.5 kg, which was six times higher than that in 2000. The demand for milk in developing countries will continue to grow rapidly in the next 20 years [3]. Therefore, dairy farms are required to improve their resource utilization efficiency and environmental benefits to ensure the sustainability of milk production in the future.
In dairy farming, the key aspects of carbon emissions include the cultivation and processing of feed, enteric fermentation of cows, the treatment of manure, and the energy consumption in dairy farms. Research has shown that the “corn silage + dairy cattle” model is a sustainable production model through the combination of corn silage planting and dairy farming, which achieves the recycling of manure, straw, and corn silage in the farm; reduces the use of chemical fertilizers in the planting of feed and the energy consumption of transporting feed and manure; and is considered to be a sustainable production model with great economic and environmental benefits [4,5].
In recent years, the “combination of planting and breeding” mode has been gradually promoted in China, forming “grain crops (silage corn) + cows + organic fertilizer”, “vegetables + cows + organic fertilizer”, “forest fruit + dairy cattle + organic fertilizer”, and other characteristic modes. Despite the wide application of the “combination of planting and breeding”, its impact on the overall carbon emissions of livestock and poultry farming still needs to be further researched. In addition, the variety of emission sources in dairy farms and the complexity of the farm production environment have put forward high requirements for monitoring technology [4,6]. At the same time, there are problems, such as methodological inconsistency, poor comparability of results, and fragmentation of research results in China’s agricultural air monitoring [7], and therefore, few published studies have quantitatively investigated the carbon emissions of the integrated-farming system.
The IPCC methodology [8] was developed by the Intergovernmental Panel on Climate Change (IPCC) to guide the preparation of national GHG inventories. These guidelines offer assessment methods for various greenhouse gasses (GHGs), including carbon dioxide (CO2), methane (CH4), and nitrous oxide (N2O), categorized by different industries and sectors. The IPCC’s fundamental calculation methodology utilizes the emission factor method, where emissions are determined by multiplying activity data with emission factors. The methodology and default values of emission factors and parameters provided by the IPCC serve as important references for national and municipal GHG emission inventories, as well as for evaluating GHG emissions of enterprises and products. At the same time, the Guidelines for Preparation of Provincial GHG Inventories, developed by the Climate Department of the National Development and Reform Commission (NDRC), align with the IPCC’s accounting methodologies and are categorized by sectors and industries. These guidelines offer guidance for measuring carbon emissions and are deemed more suitable for conducting regional-level greenhouse gas accounting in China compared to global alternatives. On the contrary, livestock and poultry farming GHG emission models, such as the dairy gas emissions model (Dairy GEM), rely on systematic carbon balance and are utilized to assess GHG emissions from dairy farming.
While studies on GHG emissions in developed countries like Europe and the United States are abundant [9,10,11,12], domestic research in China on GHG emissions at the product level is still emerging. Currently, most GHG emissions accounting from dairy farming products in China utilize the Tier 1 approach from the IPCC methodology [8]. However, there is a need for further research on the Tier 2 approach based on production data and the Tier 3 approach involving modeling techniques to enhance accuracy. Selecting scientifically sound GHG assessment methods for raw milk products and implementing relevant emission reduction strategies based on both local and international studies, as well as China’s specific circumstances, is crucial for effective environmental management and sustainability efforts.
Overseas researchers have compared the carbon footprints of conventional and organic production systems in the European dairy industry and found that the carbon footprint of organic production systems is higher than that of well-managed intensive production systems. Earlier, accounting-based carbon footprint analyses concluded that the carbon footprint of milk production in China ranged from 1.3 to 1.52 kg CO2-eq/FU, which is higher than that of Europe and the United States, which ranged from 0.69 to 1.08 kg CO2-eq/FU [5,6]. Whether this conclusion can continue to be applied to the rapidly developing Chinese dairy farming industry in recent years and whether the production mode of combining seeding and farming has an impact on this conclusion are issues that need to be focused on in this study. Compared with more studies on the carbon footprint of milk production in foreign countries, China is still in its infancy, and there is an urgent need to carry out more studies on large-scale dairy farms in China, to provide scientific assessment methods and technical support for low-carbon dairy production.
This study took typical large-scale dairy farms in the black land of northeast China as the research object and constructed its carbon emission accounting model based on the lifecycle concept. At the same time, it assumed the emission reduction scenarios of combined farming dairy farms, collaboratively designed the emission reduction path, quantified the emission reduction effect, and promoted the low-carbon and high-quality development of the dairy farming industry. The paper was structured as follows: Section 2 introduces the research object and the methodology used in this study. Section 3 describes the results of the study and further relevant discussions based on the results. Finally, Section 4 summarizes the above results.

2. Materials and Methods

2.1. Study Area

In this study, we considered the “silage maize + dairy cow” plantation system based on a single subject of dairy farms and regarded the model of dairy farms with arable land for silage maize planting as the stocking system of this study, while the model of dairy farms without arable land for planting was called the non-stocking system. Specifically, the integrated-farming system in this study meant that the dairy farms were transferred to the surrounding arable land for silage maize planting, the manure produced in the process of dairy cattle rearing was used in the arable land of the farms after composting, the urine effluent was used in the arable land of the farms after harmless treatment, and the silage maize produced in the plantation was all used as the fodder for the dairy cows, and the whole process realized the recycling of the animal and poultry manure and the silage maize.
This study selected a typical large-scale combined-breeding dairy farm on the black land of Suihua, Heilongjiang Province, China. This region has a temperate monsoon climate, which is characterized by warm and short summers and long, cold, and dry winters. The dairy farm belongs to the high-productivity system, with an inventory of 2202 head at the end of 2023, all of which are imported Holstein cows, of which 1029 are lactating cows and are housed. The product of the dairy farm is milk (annual production) and according to the actual survey, the protein content of raw milk in the dairy farm is 3.35 percent, and the fat content is 4.45 percent. The mechanical scraper board method was used to clear manure in the barn, and the manure is separated from solid and liquid by an underground irrigation canal, the solid is composted and used as bedding, and the liquid is treated by an oxidation pond and then applied to the farmland in spring and autumn. The farm produces 40,000 m3 of liquid manure and 15,000 m3 of solid compost annually. There is enough farmland around the dairy farm to absorb the organic fertilizer produced by the farm. The majority of the farm’s feed is sourced from the surrounding land, primarily in the form of maize silage. Maize silage is grown once a year over a 250-hectare area, with around 150 t fertilizer applied annually to the farmland. The farmland is 3.5 km from the dairy farm, and the maize silage is harvested each season, requiring 750 trips back to the farm.

2.2. Calculation of Carbon Emissions Equivalent

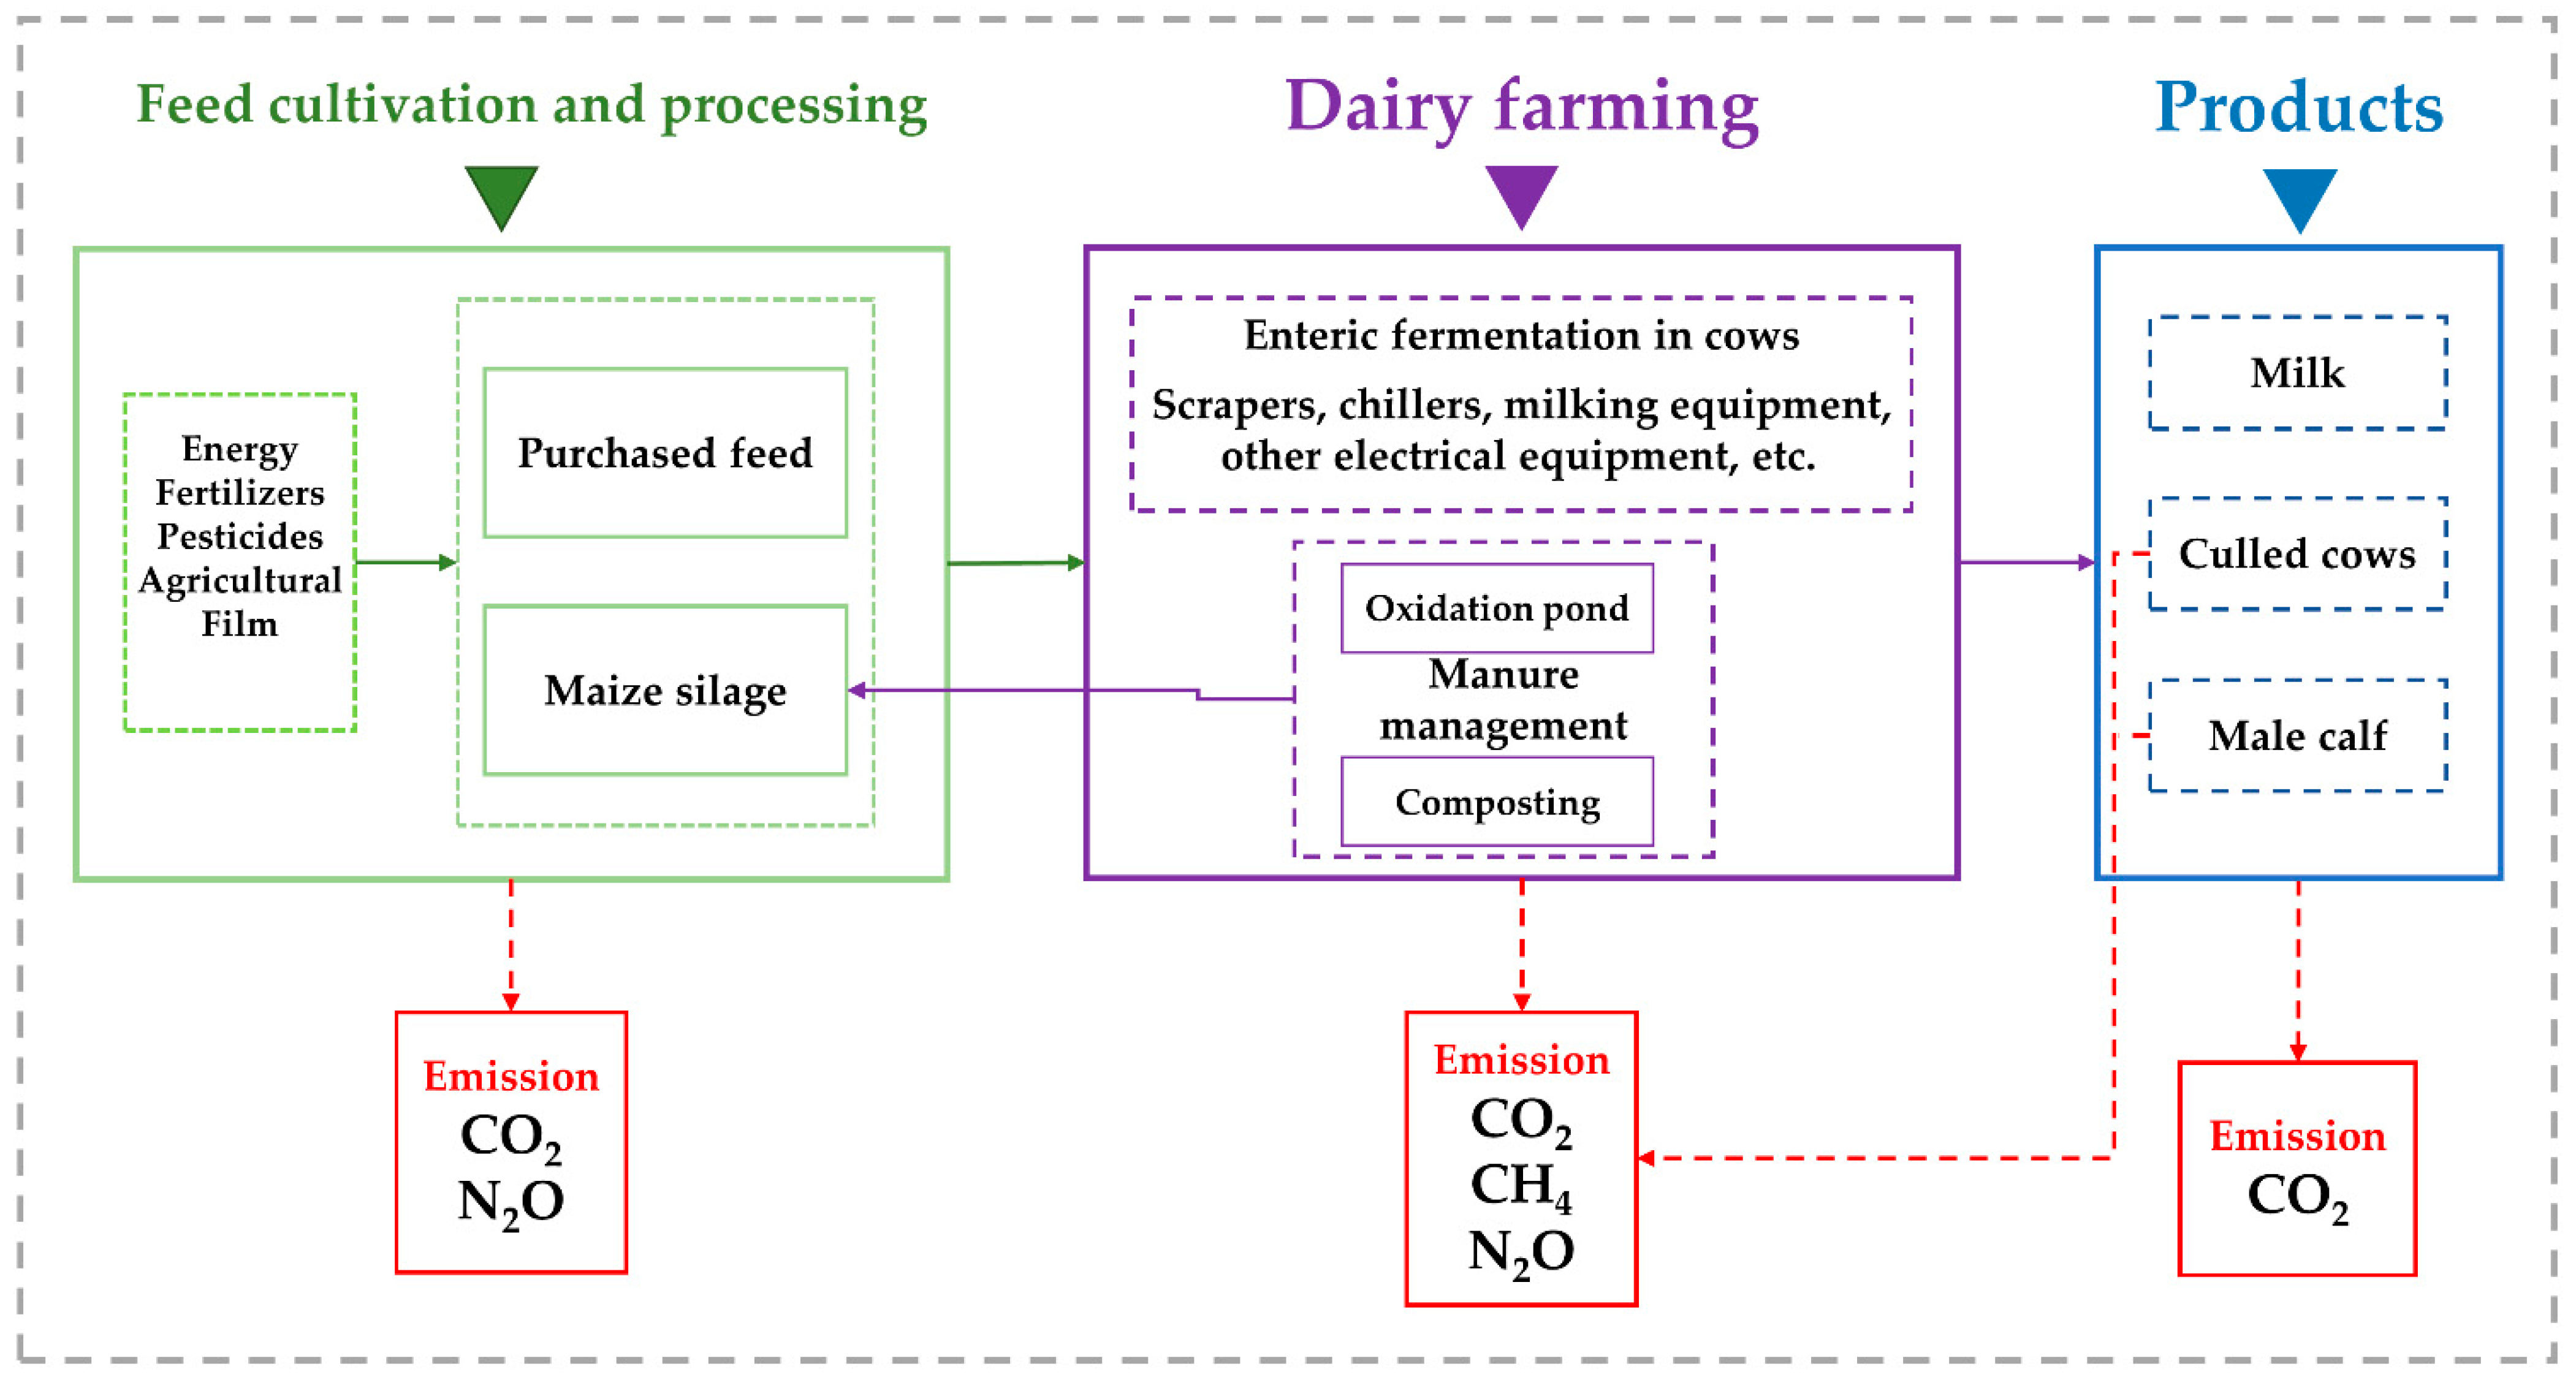
2.2.1. Functional Unit and System Boundaries

In this paper, 1 kg of Fat and Protein Corrected Milk (FPCM) was selected as the functional unit to convert milk produced on dairy farms to standard milk with mass fractions of 4.45% fat and 3.35% protein, respectively, using Equation (1):
M F P C M = M R M × 0.337 + 0.116 × M R M , F + 0.06 × M R M , P
where MFPCM is the annual production of standard milk corrected for fat and protein (t/a); MRM is the annual production of raw milk (t/a); MRM,F is the mass fraction of raw milk fat (%); and MRM,P is the mass fraction of raw milk protein (%).
The boundary of this study is “from farm to field”, and the scope of the accounting includes direct and indirect emissions from fodder cultivation and processing, cow feeding, manure management, and integrated use. This study only analyses the production process of the dairy farming system and does not consider milk processing, packaging, and distribution, nor does it analyze the slaughtering, processing, and transport of cull cows, nor does it consider the environmental impacts of other related plant and equipment, construction facilities, transport production, etc. The system boundary of this study was shown in Figure 1.
According to the boundary of this study, “from farm to field”, the GHG emissions from integrated-production systems include four components: feed production, livestock farming, manure management and integrated use, and farm management, as shown in Table 1 below:

2.2.2. Methodology for Calculating Carbon Emissions Equivalent

The carbon footprint comprises two parts, namely direct GHG emissions and indirect GHG emissions. The 2006 IPCC Inventory Guidelines calculation methodology as well as default values for emission factors and parameters were used primarily in this study. The basic IPCC calculation methodology uses the emission factor approach, where emissions are the product of activity data and emission factors. The GHG emissions from enteric fermentation and manure management of dairy cows are based on the 2006 IPCC Inventory Guide, Volume IV, Chapter 10. The formulas are shown below:
G enteric   = n N n × E F enteric , C H 4 , n 1000 × G W P C H 4
where Genteric is enteric fermentation methane emissions from cows (t CO2-eq/t); n is different dairy populations; N is stocking of cows (head); EFenteric,CH4,n is enteric fermentation methane emissions from cows factor (kg CH4/head/year); GWPCH4 is the warming potential of CH4.
N 2 O D ( m m ) = j n ( N n N e x n M S n , j ) E F 1 ( j ) 44 28
where N2OD(mm) is the direct emissions of N2O from the manure management system (kg N2O/year); Nexn is the average annual N excretion per head of livestock in different populations of dairy cows n (kg N/head/year); MSn,j is the proportion of the total annual nitrogen excretion from different populations of dairy cows managed by the manure management system j (%); EF1(j) is the emission factor for direct N2O emissions from manure management system j in the country (kg N2O-N/kg).
N 2 O G ( m m ) = N V - MMS   E F 2 44 28
where N2OG(mm) is the indirect emission of N2O due to N volatilization from manure management systems (kg N2O/year); NV-MMS is l is the loss of nitrogen from manure due to volatilization of NH3 and NOX (kg N/year). EF2 is the emission factor for N2O emissions from atmospheric deposition of nitrogen on soils and water surfaces (kg N2O-N/(kg NH3-N + NOx-N volatilization)).
N 2 O L ( m m ) = N L - MMS   E F 3 44 28
where N2OL(mm) is indirect emissions of N2O from leaching and runoff from manure management systems (kg N2O/year); NL-MMS is the amount of manure nitrogen lost through leaching in manure management systems (kg N/year); EF3 is emission factor for N2O emissions from nitrogen leaching and runoff (kg N2O-N/kg N leaching and runoff).
Dairy farms typically consume energy in the form of coal, petrol, diesel, natural gas, electricity, etc., and their greenhouse gas emissions are calculated using the following formula:
G energy   = i Q energy ,   i × E F energy , i  
where Genergy is the greenhouse gas emissions from annual energy consumption in dairy farms (t CO2); i is different energy types; Qenergy,i is the total annual consumption of different energy sources (t); EFenergy,i is the greenhouse gas emissions per unit of energy consumed (t CO2/t).
The GHG emissions from the transport process of feed fertilizers were based on the formula of Lineng Chen [13]:
G trans   = t n t × E F trans  
where Gtrans is the GHG emissions from transport; nt is the number of transports; and EFtrans is the GHG emission factor from a single transport (t CO2-eq/trip).

2.2.3. Sensitivity Analysis

Sensitivity analysis was used in this study to assess the robustness of the IPCC’s accounting methodology by looking at the impacts on the carbon footprint results of the different accounting methods chosen. Carbon emission accounting is the basic prerequisite for the effective implementation of various emission-reduction works. Currently, greenhouse gas or carbon emission reduction accounting mainly adopts the emission factor method. Due to the regional energy quality, carbon emissions industry, and regional differences, the lack of quantitative technical methods of carbon emission accounting also has greater limitations [14]. This study explored the differences in emissions under different accounting methods, which provided a certain reference for the improvement of the carbon-emission-accounting method system and the selection of accounting methods.
In this study, two methods were used to calculate greenhouse gas (GHG) emissions: the Guidelines for the Preparation of Provincial Greenhouse Gas Inventories and the Dairy GEM process model. The Provincial GHG Inventory Guidelines are based on the theory of the IPCC’S accounting methodology, which differs from the IPCC Guidelines mainly in the emission factors used for GHG accounting. These factors are more aligned with the specific situation of China’s energy consumption structure. In contrast, Dairy GEM predicts the primary GHG emissions of the production system based on the relationships between processes and emission factors. All emissions are estimated through daily modeling of feed use and manure handling. Additionally, Dairy GEM incorporates a system carbon balance that considers the effect of ambient temperature on GHG emissions and accounts for CO2 emissions and uptake from animal respiration, as well as carbon sequestration on farmland. This study compares the carbon footprints of three calculation methods for combined dairy farms, assesses the stability of the IPCC calculation methods, comprehensively evaluates the carbon emissions of combined dairy farms, accurately identifies the key emission links, and explores the emission reduction pathways for milk production.

2.3. Allocation of Carbon Emissions Equivalent

According to the principle of prioritizing the use of physical attribute allocation in the ISO 14040/14044 guidelines, and considering the main function of the dairy industry to provide edible protein [15], this study used a protein-based allocation method, which allocated a certain percentage of the system’s GHG emissions to milk and beef [16]. The calculation formula is shown in Equation (8):
A F p = M R M M R M , P 1000 M R M M R M , P + N b u l l A W b u l l P M bull   + N cow   A W cow   P M cow   M B e e f , P
where AFP is the allocation factor taken for the protein contribution of milk to system production (%); Nbull and Ncow are the numbers of male calves and culled, lactating cows (head); AWbull and AWcow are the mean body weights of male calves and culled lactating cows (kg/head); PMbull and PMcow are the net meat percentages of male calves and culled lactation cows (%); MBeef,P is the protein mass fraction of beef (%).

2.4. Data Acquisition

This study focused on a large-scale combined-breeding dairy farm situated on the black soil in Suihua, Heilongjiang Province, China. Data for the research were collected through field studies conducted at this specific dairy farm, and the relevant information is presented in Table 2 and Table 3.

2.5. Emission-Reduction Scenarios

Net zero is a state where greenhouse gas emissions from a particular region, industry, or firm cancel out the carbon emissions absorbed or offset by its abatement actions, resulting in zero emissions. To meet the net-zero target, four scenarios were set up to study emission reductions from dairy farms under the existing production conditions of the farms, and the following calculations of emissions for each scenario were based on the IPCC Guidelines methodology. Each scenario is described below (Table 4):
Scenario 1: Least-cost scenario, where treatment technologies such as acid additives and microbial agents are applied to separated livestock effluent only in the summer, which is a common abatement method used on farms because of its low cost, ease of operation, and flexibility.
Scenario 2: Manure-management emission-reduction scenario: In addition to pharmaceutical treatment of effluent in summer, the solid compost is covered with film and forced ventilation. The technology is not a high one-time investment and can effectively reduce methane and nitrous oxide emissions from the solid compost, improving the quality and efficiency of the compost; the technology is mature, simple to operate, and is a more commonly used emission reduction method.
Scenario 3: New energy replacement scenario: The energy consumption of the cattle farm includes residential energy consumption, winter heating, etc., and thus, the indirect emissions from energy consumption are high. The owner of the cattle farm has a plan to install PV panels, which are expected to generate electricity from solar energy, which will partially offset the indirect emissions from the current purchased electricity, with the specific offset amount varying according to the size of his PV installation. This scenario assumes that enough PV is installed to offset the cattle farm’s own purchased energy emissions.
Scenario 4: A combination of technologies with the highest intensity of emission reductions is currently available, assuming the highest level of improvement on the feeding side (including feed formulation and quality improvement, use of additives) is achievable with current technologies, that is, a 30% reduction in methane from animal ruminants.

3. Results and Discussion

3.1. Carbon Footprint of Typical Dairy Farms in Northeast China

In this study, the GHG emissions from various segments of the dairy farm were analyzed in detail (Table 5). The total annual GHG emissions of the dairy farm were calculated to be 13,429.5 t CO2-eq, with an average annual emission of 6.3 t CO2-eq per lactating cow and a milk production footprint of 1.18 kg CO2-eq/kg FPCM.
Figure 2 summarizes national and international studies on the contribution of different segments to the system, of which emissions from enteric fermentation contributed the most to the system, ranging from 46 to 62%; followed by feed production and processing, ranging from 14 to 34%; manure management, ranging from 11 to 33%; and dairy farm energy consumption, ranging from 4 to 18.9%. A comparison of the accounting results of this study with national and international studies shows that enteric fermentation in dairy cows in this study produced the highest carbon equivalent emissions of 5135.1 t CO2-eq, which accounted for 38.2% of the total emissions, slightly lower than the reported values (46%~62%) [17,18,19,20]. The emission equivalent of the manure management link is 3947.4 t CO2-eq, accounting for 29.4%. The emission equivalent of manure field consumption is relatively low, 491.2 t CO2-eq, accounting for 3.7% of the total emissions. For comparative analysis, the emissions from manure field consumption in this study were attributed to manure management emissions, which can be seen to be slightly higher than the reported 11–33%. The emission equivalent of the feed production and processing segment was 963.2 t CO2-eq, accounting for 7.2% of the total emissions. The emission equivalent of the energy consumption segment of the dairy farm was 2989.5 t CO2-eq, accounting for 22.3% of the total emissions, which is higher than the reported 4%~18.9%. The high energy consumption of this dairy farm is mainly because it is located in the cold region of the northeast, which requires more energy supply for warmth due to its special climatic conditions; and its electricity consumption includes the consumption of the production area and the on-farm living area, which is not exclusively a part of the consumption of the dairy cattle production.
In this study, GHG emissions from typical dairy farm in northeast China were dominated by direct emissions. The annual direct and indirect emissions were measured at 9430.2 and 3999.3 t CO2-eq, correspondingly. This translates to an average of 4.3 t CO2-eq in direct emissions and 2.0 t CO2-eq in indirect emissions per lactating cow per year. Of these emissions, all of the 5135.1 t CO2-eq emitted from enteric fermentation of dairy cows were direct emissions; 92.2% of the carbon emissions from manure management were direct (3638.5 t CO2-eq). The direct emission equivalent of manure returned to the field was 363.0 t CO2-eq, which accounted for 83.1% of the total emission equivalent of the segment. Indirect emissions from the feed production and processing segment were 293.6 t CO2-eq, accounting for 68.1% of the total equivalent emissions from this segment.

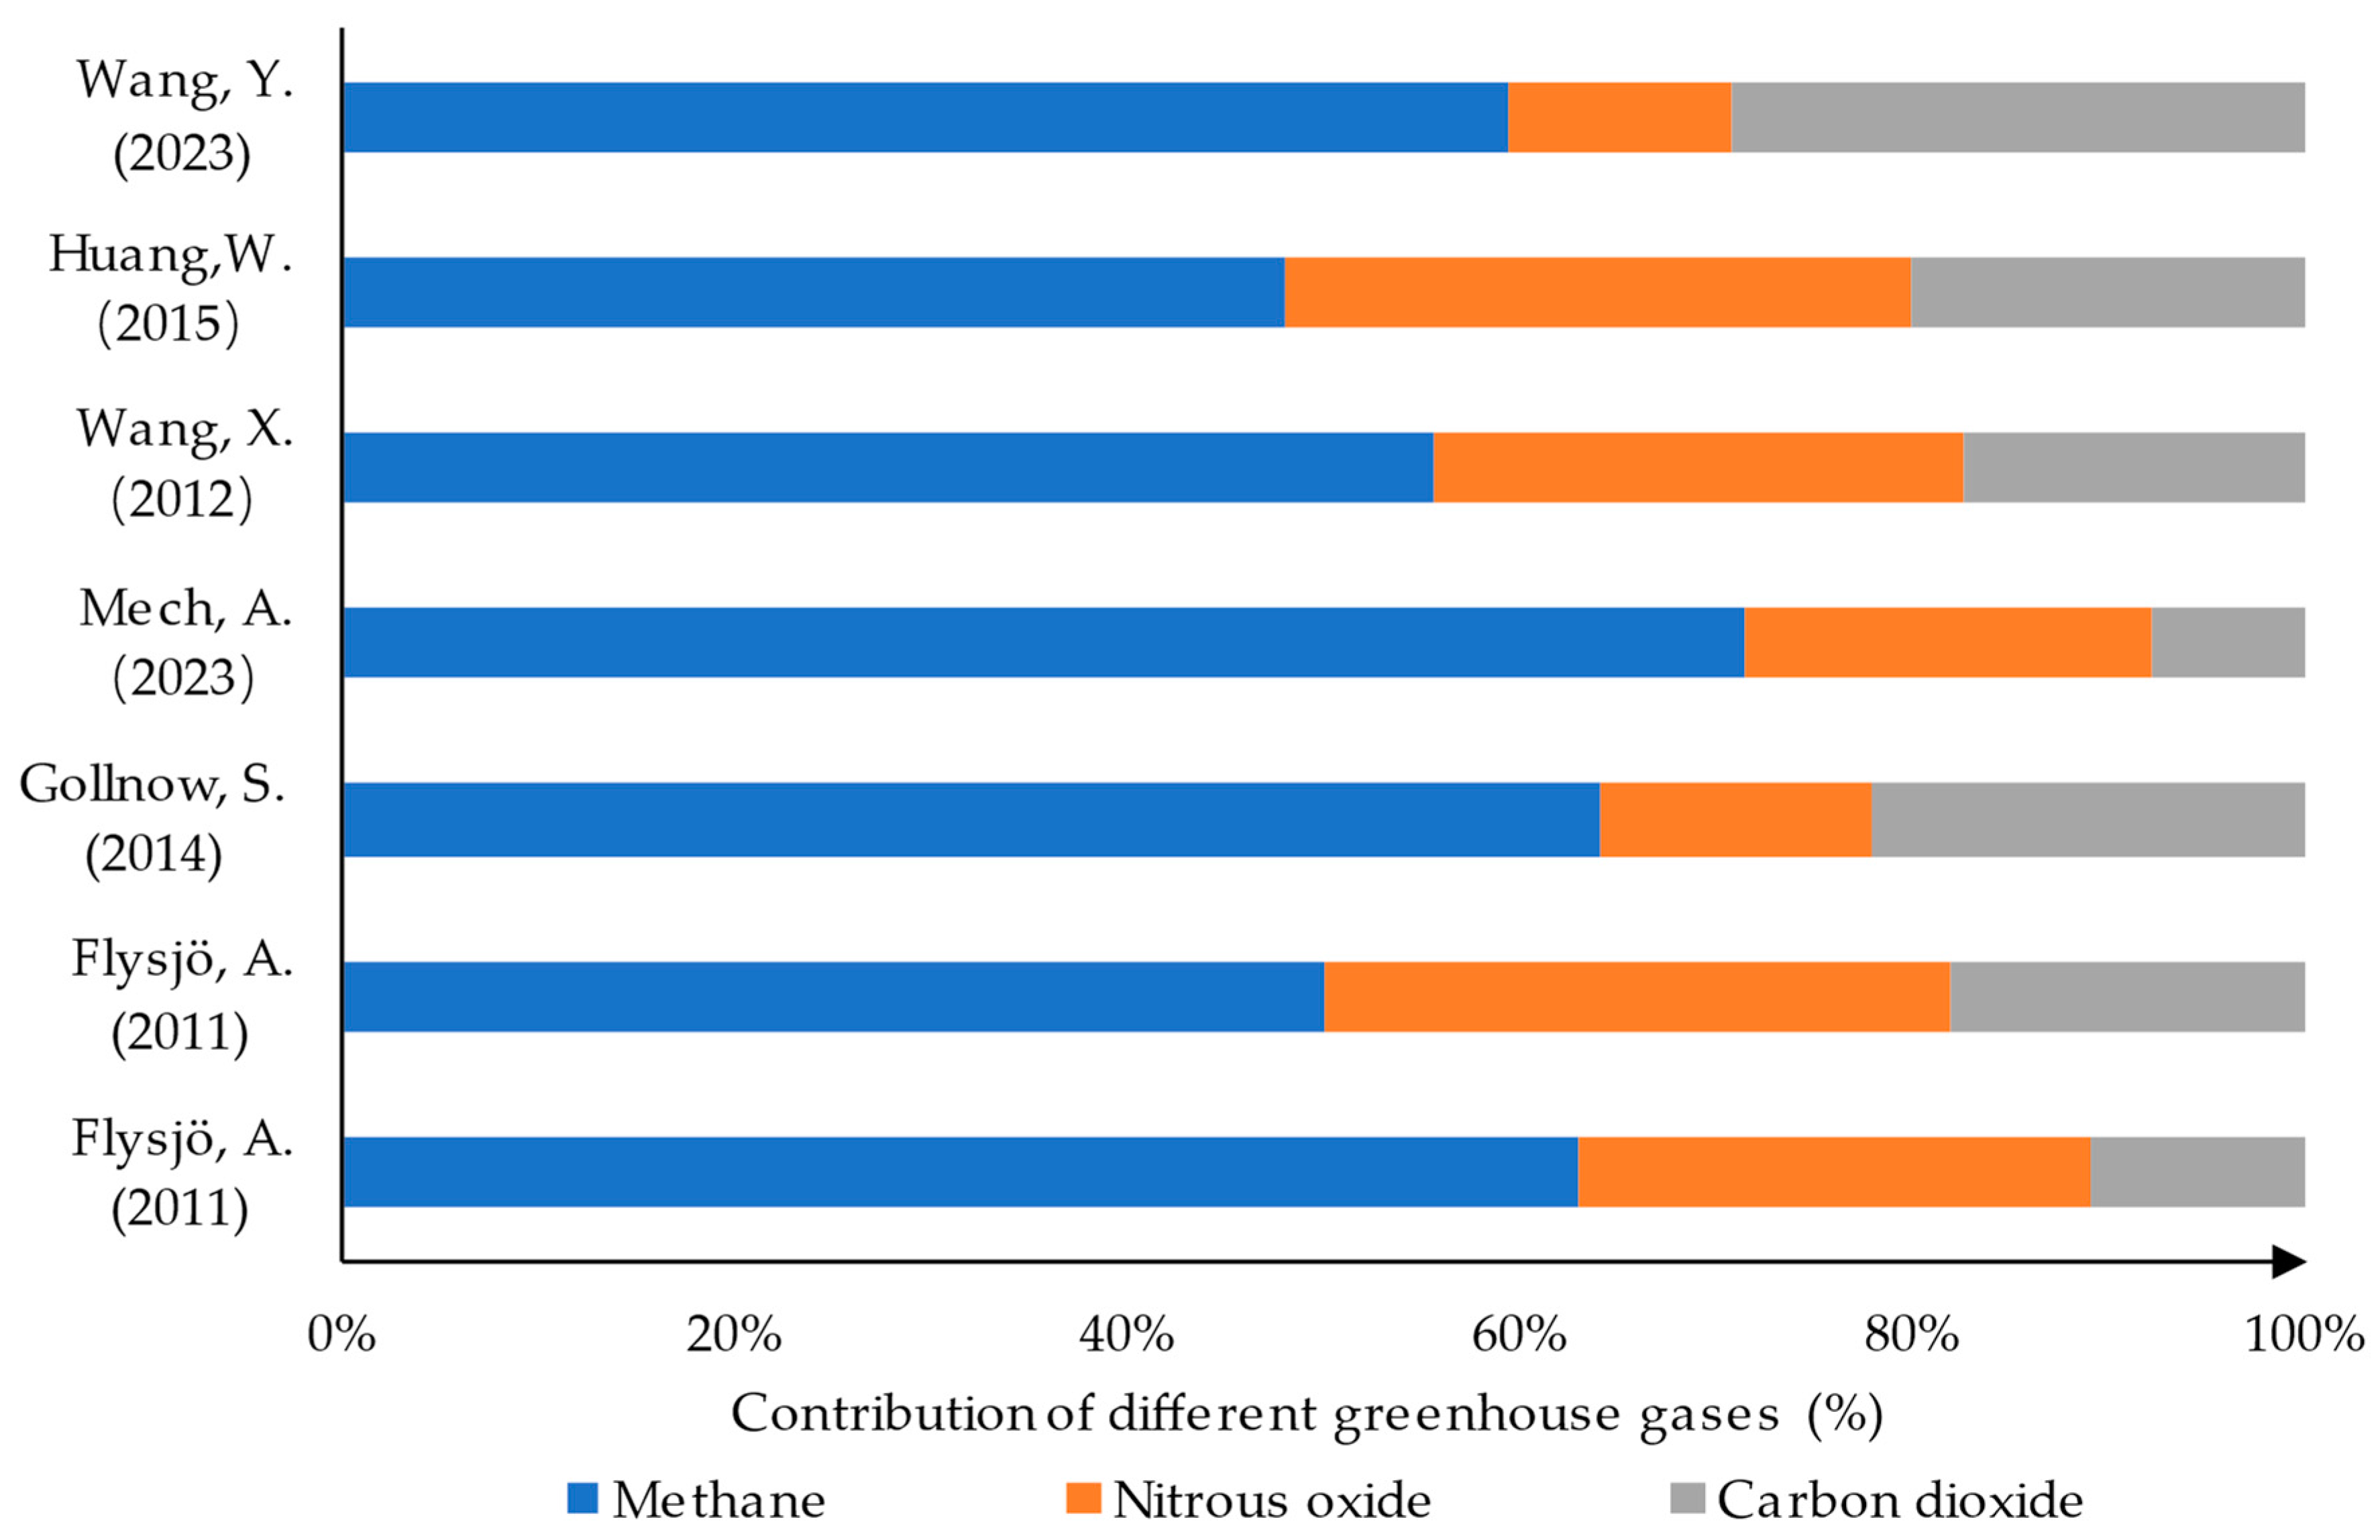
3.2. Contribution of Different Greenhouse Gases to the System

In the milk-production system, CH4 emissions were 8074.8 t CO2-eq, accounting for 60.1% of the total system emissions, and were the dominant GHG. Enteric fermentation emissions accounted for 63.6% of the total methane emissions and were the largest contributing source of methane. N2O emissions equivalent was 1785.8 t CO2-eq, accounting for 13.3% of the total GHG emissions. Emissions from manure management, manure field application, and nitrogen fertilizer field application accounted for 56.4%, 24.5%, and 19.1%, respectively, of the overall system nitrous oxide emissions. Indirect CO2 emissions were 3568.9 t CO2-eq, accounting for 26.6% of the total system emissions, of which the dairy farm feed production and processing segment and the dairy farm energy-consumption segment accounted for 16.2% and 83.8% of the CO2 emissions of the whole system, respectively.
The contributions of different greenhouse gasses to carbon emissions from dairy farming in national and international studies (Figure 3) are as follows: between 48% and 71% for CH4; between 7.5% and 32% for N2O; and between 7.7% and 29% for CO2. The contribution of CH4, N2O, and CO2 to the system obtained in this study is within the range of values reported in the literature and is comparable with the results of other studies.

3.3. Results of the Sensitivity Analysis

Under the Provincial GHG inventory preparation guidelines accounting methodology (Table 6), the total annual GHG emissions from this dairy farm were 10,983.8 t CO2-eq, with an average annual emission of 5.0 t CO2-eq per lactating cow and a milk-production footprint of 1.0 kg CO2-eq/kg FPCM. Under the accounting method of the provincial GHG inventory preparation guidelines, the GHG emissions from typical dairy farms in northeast China were dominated by direct emissions, with annual direct and indirect emissions of 6365.3 t CO2-eq and 5196.6 t CO2-eq, respectively, which were equivalent to annual average direct and indirect emissions of 2.9 t and 2.4 t CO2-eq per lactating cow, respectively. Among them, all 5135.0 t CO2-eq emitted from the intestinal fermentation of dairy cows were direct emissions. In total, 777 t CO2-eq of manure management carbon emissions were all direct emissions. The direct emission equivalent of manure returning to the field was 453.3 t CO2-eq, accounting for 99.6% of the total emission equivalent in this segment. All the 5194.9 t CO2-eq emissions from cattle farm energy consumption were indirect.
The systematic annual GHG emissions around milk production from this large-scale dairy farm under the Dairy GEM accounting method were 8483.7 t CO2-eq, with an average of 3.6 t CO2-eq per lactating cow per year and a milk production footprint of 0.79 kg CO2-eq/kg FPCM (Table 7). Under the Dairy GEM accounting method, the greenhouse gas emissions of typical dairy farms in northeast China are mainly direct, and the annual direct and indirect emissions were 6598.2 t and 1885.8 t CO2-eq, respectively, which was equivalent to the annual direct and indirect emissions per cow were 3.0 t and 1.7 t CO2-eq, respectively. Among them, all the 365.3 t CO2-eq emitted by enteric fermentation in cows was directly emitted. In total, 99.9% of manure management carbon emissions were direct emissions (6231 t CO2-eq). The direct emission equivalent of manure returning to the field was 1.9 t CO2-eq, accounting for 90.5% of the total emission equivalent in this segment. The 141.2 and 1742.2 t CO2-eq emissions from feed production and processing and dairy farm energy consumption are indirect.
In accounting for GHG emissions from dairy farms, the three methods (IPCC Guidelines, Provincial Guidelines for the Preparation of Greenhouse Gas Inventories, and the Dairy GEM model) showed significant differences in the results of the assessment of enteric fermentation, manure management, and the energy consumption aspects of dairy farms (Figure 4). In the enteric fermentation segment, the CH4 emissions from the Dairy GEM showed a large difference in results compared to the other two methods, resulting in the lowest contribution. This difference was mainly attributed to the model developed by Mills et al. [22] used in Dairy GEM, which had built-in parameters and emission factors based mainly on data from Europe and the United States, which may not fully match the actual situation in Chinese dairy farms. The Dairy GEM had the highest contribution of CH4 emissions in the manure management segment, and the CH4 emissions from the Dairy GEM were mainly from the manure management segment because the Dairy GEM was process-based, developed an empirical equation for CH4 emissions related to ambient temperatures in the barn, and simulated methane emissions from the various manure treatment states. At the same time, the IPCC Guidelines provided a larger CH4 emission factor in this area than the provincial GHG inventory guidelines, which led to the difference in results from the Dairy GEM and the provincial GHG inventory guidelines. In the energy-consumption segment of dairy farms, the provincial GHG inventory compilation guideline had the highest contribution to emissions, mainly because it provided larger emission factors and covered fewer segments compared to the other two methods. To account for the carbon footprint more accurately, it was necessary to strengthen the acquisition of basic data based on the actual production situation of dairy farms in China.

3.4. Comparison of Carbon Footprints of Two Production Systems

3.4.1. Comparison of the Carbon Footprints of Stockbreeding and Non-Stockbreeding Systems

The feedstock-integrated dairy-production system in this study was essentially the same as the conventional production system in terms of enteric fermentation, manure management, and dairy farm energy consumption, but differed in terms of the carbon costs of fertilizer application and feeding and the associated-transport energy consumption. In this study, 100% of the maize silage from the farm’s supporting land was used as dairy farm feed, effectively reducing GHG emissions from feed transport by 31.7%. Cow manure was used as an organic fertilizer to provide nutrients for maize silage cultivation while reducing indirect carbon emissions (67.8%) from the increased use of chemical fertilizers.
Under the production conditions of the dairy farm in this study, if the maize silage needs to be purchased externally, then according to the mathematical model of energy consumption of rural transport machinery developed by Lineng Chen et al. [13], it is assumed that the average single transport distance of an agricultural diesel vehicle is 30 km, with a load capacity of 5 t, and the amount of fuel consumed is 15 L. That is, if all the 12,000 t maize silage consumed by the cattle farm annually is purchased externally, carbon emissions of 187.2 t CO2-eq will be generated.
At the same time, if the farmland fertilizer needs to be purchased in equal nitrogen amounts, based on the national standard GB/T 10205-2009 [23] for organic fertilizer with a total nitrogen content of 1.88% and compound fertilizer with a total nitrogen content of 13%, it is calculated that it needs to be purchased in 5784.6 t of fertilizer. Based on the emission coefficients of IPCC 2006, the emissions from fertilizer production were 387.6 t CO2-eq, and the emissions from transport were 89.8 t CO2-eq; the direct emissions from fertilizer application were calculated to be 614.5 t CO2-eq, and the indirect emissions from volatilization to be 307.3 t CO2-eq. The comprehensive analysis showed that compared with the non-stockbreeding system, the stockbreeding system could reduce the amount of 1586.4 t CO2-eq of carbon emissions compared with the non-stockbreeding system. In summary, the footprint of the stockbreeding system was 1.18 kg CO2-eq/kg FPCM, while the footprint of the non-stockbreeding system was 1.39 kg CO2-eq/kg FPCM, showing a 10.6% reduction in carbon footprint. This result demonstrates the emission-reduction advantages of the stockbreeding model for a typical dairy-production situation in the northeast (Table 8).

3.4.2. Comparison of Carbon Footprints of Stockbreeding and Non-Stockbreeding Systems in China and Abroad

The results of this study were consistent with the comparative results of the national studies. For example, Li et al. [24] quantified the net GHG emissions of a crop–pig separation system and the integrated system in the North China Plain. The net GHG emissions of the integrated crop–pig system and the separate system for 215 pigs were 24,917.95 kg CO2-eq/ha/year and 27,732.70 kg CO2-eq/ha/year, respectively. The net GHG emissions of the integrated system were reduced by 10.15% compared to the separate system. Huang et al. [1] evaluated the environmental and economic benefits of the dairy farming system and the “wheat-silage maize-dairy farming” system, and the results showed that the environmental impacts of producing 1 kg of FPCM on GWP were 1.37 kg of GWP and 1.5 kg of CO2-eq/ha/yr for the non-stockbreeding system. The environmental impact of producing 1 kg of FPCM on GWP was 1.37 kg CO2-eq in the non-stockbreeding system and 1.17 kg CO2-eq in the stockbreeding system, which was a 14% decrease [1]. Xiaowei Chen [25] compared five system scenarios and their corresponding carbon footprint assessment frameworks for the plantation cycle industry chain, and the results showed that the carbon footprint per unit of the energy output of the stockbreeding system was 0.51 kg CO2-eq-MJ−1, which was 11.77% lower than that of the non-stockbreeding system (0.58 kg CO2-eq-MJ−1).
After the literature review, it was found that there are relatively few relevant studies on the carbon footprint of stockbreeding systems abroad. Marcela P. Costa [26] compared stockbreeding systems and conventional systems in the Cerredo region of Brazil using a lifecycle assessment, and the stockbreeding systems reduced the climate change potential by 55% (2389 t CO2-eq) compared to the conventional systems. Eduardo Barretto de Figueiredo [27] estimated the greenhouse gas (GHG) balance and the carbon footprint of beef cattle under three different production scenarios for Brachiaria ranch in Brazil. The carbon footprint of beef cattle in conventional system was 18.5 kg CO2-eq/kg LW. In contrast, beef cattle in a crop–livestock–forest-integrated system was 12.6 kg CO2-eq/kg LW, suggesting that introducing a conventional system into the combined system could reduce its associated greenhouse gas emissions. Le Thanh Hai [28] calculated the annual GHG emissions from a small-scale cattle farm in the Mekong Delta with 30 cows to be 39,065.31 kg CO2-eq, suggesting that the adoption of a crop–livestock–forest-integrated system can achieve the goal of zero emissions while increasing the income of farmers by 41.55%. Compared with the non-stockbreeding system, the stockbreeding system achieves resource recycling and ecological balance by integrating crop production and animal breeding, which not only helps to improve the overall efficiency of agricultural production but also reduces the negative impacts on the environment and the climate and is one of the effective ways to achieve sustainable agricultural development.

3.5. Net-Zero Pathway for a Typical Cattle Farm in the Northeast China

Combined with the above carbon footprint results of a typical dairy farm in northeast China, it can be seen that the direct emissions of this dairy farm mainly originate from manure management and enteric fermentation. The key links to reducing direct carbon emissions upstream and downstream of the manure management segment were feeding, liquid manure storage, and solid-state treatment; the key link to reducing indirect carbon emissions was to reduce the energy consumption of the dairy farm. Carbon emission reduction from enteric fermentation relied mainly on the aspects of feed formulation and stock selection. Dairy herd selection is currently a comprehensive consideration, and it is difficult to make essential changes shortly. As animal manure is separated and treated on large-scale farms at present, storage and treatment of liquid and solid waste need to be considered on a case-by-case basis. After solid–liquid separation of manure was achieved on this cattle farm, the liquid was stored in an open oxidation pond with no cover or tail-gas-recycling device. It is generally recognized that methane production is extremely low at ambient conditions below 4 °C [29], so the main gas production period for this part of the cattle farm can be during the summer months. The oxidation ponds in the cattle farm were large and did not have the conditions for simple mulching with natural materials such as straw; the region in which it is located has a long period of low temperatures, so appropriate emission reductions were only required during the summer months. Considering the cost and applicability of each measure, it is recommended that they regularly add appropriate amounts of strong acidic oxidants or microbial inhibitors to the oxidation ponds in summer to reduce a large amount of methane emissions. The separated solid manure is composted in the composting plant under natural ventilation. About 20% of the composted product was sent off-site as vermicompost and about 80% of the composted product was recycled as cattle bedding. The main carbon emission from the composting process was nitrous oxide, and the main gaseous pollutant emission was ammonia. One of the more appropriate ways to reduce composting emissions is to add appropriate amounts of urease inhibitors and other substances to prevent hydrolysis and oxidation of urea in the substrate, which can effectively reduce both ammonia and nitrous oxide and can reduce bedding-related nitrous oxide emissions during the process of using the composted products as bedding. Another way is to use film composting to speed up the composting rate and reduce gas emissions during the composting process.
Based on the above analysis, the recommended technologies for this dairy farm are increased cleaning frequency, acidification of the liquid surface of the oxidation pond, mulching, anaerobic digestion, and forced-air composting. Taking into account the actual conditions of the northeast region where the dairy farm is located, where winters are cold and long, it is recommended to choose the technologies of increasing the frequency of house cleaning, acidification of the liquid surface of the oxidation ponds in summer, and mulching when the budget is small; and it is recommended to choose the technology of forced-air composting instead of anaerobic digestion when the budget is sufficient.
Calculation of emissions under the four scenarios in Section 2.5 based on the IPCC Guidelines methodology (Table 9):
Compared with the baseline scenario, scenarios 1 to 4 reduce CO2 emissions by 9%, 20%, 42%, and 61%, respectively (Table 9). To further reduce emissions, the only way is to further improve from the perspective of precision fertilizer application, reduce direct and indirect emissions related to fertilizer application, and reduce indirect emissions related to fertilizer transportation. Given the fertile black soil, the corn yield per acre is projected at 600 kg, while the soybean yield is estimated at 150 kg. In the farming system, 35% of the nutrient needs are met by fertilizer supply, and organic fertilizer is utilized at a rate of 25%. The annual nitrogen fertilizer requirement for corn and soybeans stands at 120 t and 15 t, respectively. In the current set up, where all 250 acres are dedicated to corn, the organic fertilizer supplied aligns with the corn’s nitrogen needs. However, in the current 50% corn and 50% soybean rotation scenario every two years, an excess of 55 t nitrogen fertilizer is applied. This surplus nitrogen can be utilized on an additional 250 acres for a 50% corn and 50% soybean rotation. Such utilization not only decreases carbon emissions at the cattle farm by 170 t but also brings about reductions in nitrous oxide emissions and fertilizer substitution effects on other lands (approximately 2.1 t of carbon per ton of nitrogen). These factors lead to a direct emission reduction of approximately 20% and a substitution of nitrogen fertilizer production emissions, amounting to about 240 t CO2-eq. Consequently, with precise fertilization techniques, there is a potential to reduce carbon emissions by 500 t in the optimized scenario.

4. Conclusions

This paper established the carbon-emission-accounting model of the whole lifecycle and each production link of the combined dairy farm and carried out a case study. Given the actual production of the whole lifecycle of the case study combined with dairy farms, the study proposed carbon-emission-reduction measures, and the following conclusions were obtained:
(1)
In the milk-production system, the emission equivalent of the enteric fermentation of dairy cows was 5135.1 t CO2-eq, which accounted for 38.2% of the total emissions of the system and accounted for the largest share of the total emissions; the emission equivalent of the manure management was 3947.4 t CO2-eq, which accounted for 29.4% of the total emissions of the system; and the emission equivalent of the dairy farm’s energy consumption was 2989.5 t CO2-eq, which accounted for 22.3%.
(2)
In the milk-production system, the CH4 emission equivalent was 8074.8 t CO2-eq, accounting for 60.1% of the total system emission, which was the largest GHG contribution in the system. In total, 1785.8 t CO2-eq of N2O emission equivalent accounted for 13.3% of the total system emission, and the indirect emission of CO2 was 3568.9 t CO2-eq, which accounted for 26.6% of the total system emission.
(3)
Assuming that the silage maize in this study’s seeding system is a purchased feed, this would increase emissions from transporting silage maize by 187.2 t CO2-eq. Assuming that the organic fertilizer in this study’s seeding system is a purchased fertilizer with the same amount of nitrogen, this would increase emissions from fertilizer production and transport by about 400 t CO2-eq. On the dairy farms in the study, the seeding model reduced carbon emissions from the production and transport of fertilizer at least once a year for the cattle farm and reduced carbon emissions associated with feed production and transport by at least around 1000 t.
(4)
Compared with the baseline scenario, emission reduction scenarios 1 to 4 reduced carbon dioxide emissions by 9%, 20%, 42%, and 61%, respectively. However, with the current technology, the maximum emission reduction scenario is still unable to achieve the “net-zero” target, and there are still 4677 t carbon emissions directly and indirectly per year. Due to the cold climate in the northeast region, the anaerobic digestion technology, which has the characteristics of carbon emission reduction and energy offset, is difficult to operate efficiently, and its carbon-offsetting capacity is limited. Improvements in fertilizer application would still require the farm to emit 4000 t of carbon dioxide per year. To achieve the “net zero” goal, the farm needs to increase the offsetting role of its clean energy alternatives to achieve the goal of offsetting 7000 t of carbon per year.
Suitable carbon footprint methods are important for identifying key sources of greenhouse gas emissions from milk production. The results of this study may provide dairy farmers with more environmentally efficient options to reduce greenhouse gas emissions from livestock while at the same time achieving the international goal of net reduction in agriculture. This study mainly analyzes silage maize planting and cow rearing in dairy farms. Although this mode is the most widely used and typical mode of combining seeding and rearing in dairy farms in China, in practice, individual dairy farms have adopted such modes as “vegetable + cow”, “forest fruit + cow”, etc. These modes have not been analyzed due to limited research efforts. To increase the richness of the study, future research needs to be expanded in these content areas.

Author Contributions

Conceptualization, S.L. and Z.M.; methodology, S.L. and Y.W.; validation, Y.W.; investigation, S.L. and Z.M.; writing—original draft preparation, Y.W.; writing—review and editing, S.L., Q.X. and Z.M.; visualization, Y.W.; supervision, S.L., Q.X. and Z.M. All authors have read and agreed to the published version of the manuscript.

Funding

This research received no external funding.

Institutional Review Board Statement

Not applicable.

Data Availability Statement

The data presented in this study are available within the article.

Acknowledgments

Sincere thanks to Suihua Yuda Dairy Company Limited for their support and assistance in the survey and data collection for this study.

Conflicts of Interest

The authors declare no conflicts of interest.

References

  1. Huang, X.L.; Shi, B.Y.; Wang, S.; Yin, C.B.; Fang, L.N. Mitigating environmental impacts of milk production via integrated maize silage planting and dairy cow breeding system: A case study in China. J. Clean. Prod. 2021, 309, 127343. [Google Scholar] [CrossRef]
  2. Food and Agriculture Organization of the United Nations (FAO). FAO Statistical Databases. 2019. Available online: https://www.fao.org/faostat/zh/#home (accessed on 1 July 2023).
  3. Herrero, M.; Henderson, B.; Havlik, P.; Thornton, P.K.; Conant, R.T.; Smith, P.; Wirsenius, S.; Hristov, A.N.; Gerber, P.; Gill, M.; et al. Greenhouse gas mitigation potentials in the livestock sector. Nat. Clim. Chang. 2016, 6, 452–461. [Google Scholar] [CrossRef]
  4. Basset-Mens, C.; Ledgard, S.; Boyes, M. Eco-efficiency of intensification scenarios for milk production in New Zealand. Ecol. Econ. 2009, 68, 1615–1625. [Google Scholar] [CrossRef]
  5. Fan, X.; Chang, J.; Ren, Y.; Wu, X.; Du, Y.Y.; Xu, R.H.; Liu, D.; Chang, S.X.; Meyerson, L.A.; Peng, C.H.; et al. Recoupling Industrial Dairy Feedlots and Industrial Farmlands Mitigates the Environmental Impacts of Milk Production in China. Environ. Sci. Technol. 2018, 52, 3917–3925. [Google Scholar] [CrossRef] [PubMed]
  6. Guerci, M.; Knudsen, M.T.; Bava, L.; Zucali, M.; Schönbach, P.; Kristensen, T. Parameters affecting the environmental impact of a range of dairy farming systems in Denmark, Germany and Italy. J. Clean. Prod. 2013, 54, 133–141. [Google Scholar] [CrossRef]
  7. Zheng, Y.H.; Wei, J.G.; Li, J.; Feng, S.F.; Li, Z.F.; Jiang, G.M.; Lucas, M.; Wu, G.L.; Ning, T.Y. Anaerobic fermentation technology increases biomass energy use efficiency in crop residue utilization and biogas production. Renew. Sustain. Energy Rev. 2012, 16, 4588–4596. [Google Scholar] [CrossRef]
  8. Eggelston, S.; Buendia, L.; Miwa, K.; Ngara, T.; Tanabe, K. (Eds.) 2006 IPCC Guidelines for National Greenhouse Gas Inventories; Institute for Global Environmental Strategies (IGES): Kanagawa, Japan, 2006. [Google Scholar]
  9. van Boxmeer, E.; Modernel, P.; Viets, T. Environmental and economic performance of Dutch dairy farms on peat soil. Agric. Syst. 2021, 193, 103243. [Google Scholar] [CrossRef]
  10. Cortés, A.; Feijoo, G.; Fernández, M.; Moreira, M.T. Pursuing the route to eco-efficiency in dairy production: The case of Galician area. J. Clean. Prod. 2021, 285, 124861. [Google Scholar] [CrossRef]
  11. Ledgard, S.F.; Falconer, S.J.; Abercrombie, R.; Philip, G.; Hill, J.P. Temporal, spatial, and management variability in the carbon footprint of New Zealand milk. J. Dairy Sci. 2020, 103, 1031–1046. [Google Scholar] [CrossRef]
  12. Styles, D.; Gonzalez-Mejia, A.; Moorby, J.; Foskolos, A.; Gibbons, J. Climate mitigation by dairy intensification depends on intensive use of spared grassland. Glob. Chang. Biol. 2018, 24, 681–693. [Google Scholar] [CrossRef]
  13. Chen, L.; Ling, H.; Xu, Z.; Wang, F. Research on the math of the combustion oil consumption of the farm transport machineries. J. Zhejiang Univ. 2003, 29, 185–187. [Google Scholar]
  14. Qu, S.; Yang, Y.T.; Wang, Z.H.; Zou, J.P.; Xu, M. Great Divergence Exists in Chinese Provincial Trade-Related CO2 Emission Accounts. Environ. Sci. Technol. 2020, 54, 8527–8538. [Google Scholar] [CrossRef] [PubMed]
  15. FAO. Greenhouse Gas Emissions from the Dairy Sector. Available online: https://milk.procon.org/wp-content/uploads/sites/44/ghg-emissions-from-dairy-sector-fao-2010.pdf (accessed on 1 July 2023).
  16. International Dairy Federation. A Common Carbon Footprint approach for the Dairy Sector—The lDF Guide to Standard Life Cycle Assessment Methodology. Available online: https://www.fil-idf.org/wp-content/uploads/2016/09/Bulletin479-2015_A-common-carbon-footprint-approach-for-the-dairy-sector.CAT.pdf (accessed on 1 July 2023).
  17. Huang, W.; Dong, H.; Zhu, Z.; Liu, C.; Tao, X.; Wang, Y. Research Progress and Analysis of Carbon Footprint of Livestock Products. Sci. Agric. Sin. 2015, 48, 93–111. [Google Scholar]
  18. Wang, X.; Liang, D.; Wang, X.; Peng, S.; Zheng, J. Estimation of greenhouse gas emissions from dairy farming systems based on LCA. Trans. Chin. Soc. Agric. Eng. 2012, 28, 179–184. [Google Scholar]
  19. Gollnow, S.; Lundie, S.; Moore, A.D.; McLaren, J.; van Buuren, N.; Stahle, P.; Christie, K.; Thylmann, D.; Rehl, T. Carbon footprint of milk production from dairy cows in Australia. Int. Dairy J. 2014, 37, 31–38. [Google Scholar] [CrossRef]
  20. Flysjö, A.; Henriksson, M.; Cederberg, C.; Ledgard, S.; Englund, J.E. The impact of various parameters on the carbon footprint of milk production in New Zealand and Sweden. Agric. Syst. 2011, 104, 459–469. [Google Scholar] [CrossRef]
  21. Mech, A.; Devi, G.L.; Sivaram, M.; Sirohi, S.; Dhali, A.; Kolte, A.P.; Malik, P.K.; Veeranna, R.K.; Niketha, L.; Bhatta, R. Assessment of carbon footprint of milk production and identification of its major determinants in smallholder dairy farms in Karnataka, India. J. Dairy Sci. 2023, 106, 8847–8860. [Google Scholar] [CrossRef]
  22. Mills, J.A.N.; Kerbreab, E.; Yates, C.M.; Crompton, L.A.; Cammell, S.B.; Dhanoa, M.S.; Agnew, R.E.; France, J. Alternative approaches to predicting methane emissions from dairy cows. J. Anim. Sci. 2003, 81, 3141–3150. [Google Scholar] [CrossRef]
  23. GB 10205-2009; Monoammonium Phosphate and Diammonium Phosphate. General Administration of Quality Supervision, Inspection and Quarantine, National Administration of Standardization: Beijing, China, 2009.
  24. Li, Z.J.; Sui, P.; Wang, X.L.; Yang, X.L.; Long, P.; Cui, J.X.; Yan, L.L.; Chen, Y.Q. Comparison of net GHG emissions between separated system and crop-swine integrated system in the North China Plain. J. Clean. Prod. 2017, 149, 653–664. [Google Scholar] [CrossRef]
  25. Chen, X.; Wang, X. Accounting Framework of Carbon Footprint on Integrated Cropping- Breeding Farming System: A Case on Maize-Cow-Recycling Manure Model. Sci. Agric. Sin. 2023, 56, 314–332. [Google Scholar]
  26. Costa, M.P.; Schoeneboom, J.C.; Oliveira, S.A.; Viñas, R.S.; de Medeiros, G.A. A socio-eco-efficiency analysis of integrated and non-integrated crop-livestock-forestry systems in the Brazilian Cerrado based on LCA. J. Clean. Prod. 2018, 171, 1460–1471. [Google Scholar] [CrossRef]
  27. de Figueiredo, E.B.; Jayasundara, S.; Bordonal, R.D.; Berchielli, T.T.; Reis, R.A.; Wagner-Riddle, C.; La Scala, N. Greenhouse gas balance and carbon footprint of beef cattle in three contrasting pasture-management systems in Brazil. J. Clean. Prod. 2017, 142, 420–431. [Google Scholar] [CrossRef]
  28. Thanh Hai, L.; Tran, Q.B.; Tra, V.T.; Nguyen, T.P.T.; Le, T.N.; Schnitzer, H.; Braunegg, G.; Le, S.; Hoang, C.T.; Nguyen, X.C.; et al. Integrated farming system producing zero emissions and sustainable livelihood for small-scale cattle farms: Case study in the Mekong Delta, Vietnam. Environ. Pollut. 2020, 265, 114853. [Google Scholar] [CrossRef] [PubMed]
  29. Dunfield, P.; knowles, R.; Dumont, R.; Moore, T.R. Methane production and consumption in temperate and subarctic peat soils: Response to temperature and pH. Soil Biol. Biochem. 1993, 25, 321–326. [Google Scholar] [CrossRef]
Figure 1. Carbon-footprint-accounting boundary for crop-livestock dairy farm.
Agriculture 14 01696 g001
Figure 2. Contributions to the system from different studies on different segments [17,18,19,20].
Agriculture 14 01696 g002
Figure 3. Contributions of different greenhouse gasses to the system in different studies [17,18,19,20,21].
Agriculture 14 01696 g003
Figure 4. Three accounting methods on the contribution of different links to the system.
Agriculture 14 01696 g004
Table 1. Greenhouse gas emissions by segment.
Production StageEmission SourceDirect EmissionsIndirect Emissions
feed productionorganic fertilizer applicationN2ON2O
fertilizer
agricultural film CO2
pesticides CO2
fossil fuels CO2
livestock and poultry farmingenteric fermentation (lactating cows, breeding cows, calves, dry cows)CH4
purchased feed CO2
manure management and integrated useliquid manureCH4, N2ON2O
solid manure compostingCH4, N2O N2O
solid manure as beddingN2O
farm managementuse of agricultural machinery (diesel) CO2
energy use (diesel, petrol, electricity, coal) CO2
Table 2. Herd composition and parameters.
ProjectsUnitLactating CowDry CowYoung BullBreeding CattleCalf
annual stockhead1029118431253371
daily intakekg DM25.515.513.38.55
percentage of crude protein in the diet%16.314.613.7615.8520
daily milk production per cowkg/head/day390000
Note: DM represents dry matter.
Table 3. Data relating to the main products of dairy farms.
ProjectsUnitValue
maize feed consumptiont2100
maize silage consumptiont12,000
soya meal consumptiont520
ProductsUnitValue
annual raw milk productiont13,000
protein content in raw milk from dairy farms%3.35
fat content in raw milk from dairy farms%4.45
Table 4. Emission-reduction scenarios.
Manure ManagementEnergy SubstitutionRuminant Emissions Reduction
SewersSolid Waste
Scenario 1minimum costpharmacist
Scenario 2improved manure management onlypharmacistmulch compost
Scenario 3new energy scenariospharmacistmulch compostsolar energy substitution
Scenario 4maximum emission-reduction scenarioslaminating, recovering natural gasmulch compostsolar energy substitutionfeed-side improvements
Table 5. GHG Emissions from system segments (t CO2-eq).
Emission SectorEmission SourceDirect EmissionsIndirect EmissionsEmission Equivalent
(t CO2-eq)
enteric fermentation
in cows
enteric fermentation (CH4)5135.105135.1
manure managementmanure management (CH4)2939.702939.7
manure management (N2O)698.8308.91007.7
manure field consumptionmanure field application (N2O)363.073.8436.8
feed production and processingnitrogen fertilizer field application (N2O)293.6047.7341.3
fertilizer production (CO2)063.563.5
pesticide production (CO2)037.337.3
machine operation (CO2)075.775.7
feed transport (CO2)0402.9402.9
dairy farm energy consumption (diesel/electricity)energy consumption in dairy farm (CO2)02989.52989.5
total system emissions (unallocated) 9430.23999.313,429.5
total emissions from milk production
(after allocation)
8958.73799.312,758.0
Table 6. Greenhouse gas emissions from dairy farms based on the guidelines for the preparation of provincial GHG inventories in China.
Emission SegmentEmission SourceDirect EmissionIndirect EmissionsEmission Equivalent
(t CO2-eq)
enteric fermentation
in cows
enteric fermentation (CH4)5135.005135.0
manure managementmanure management (CH4)137.50137.5
manure management (N2O)639.50639.5
manure field consumptionmanure field application (N2O)453.31.7455
dairy farm energy consumption
(diesel/electricity)
dairy farm energy consumption (CO2)05194.95194.9
total system emissions
(unallocated)
6365.35196.611,561.9
total emissions from milk production
(after allocation)
6047.04936.810,983.8
Table 7. Greenhouse gas emissions from system components under the Dairy GEM accounting methodology.
Emission SegmentEmission SourceDirect EmissionIndirect EmissionsEmission Equivalent
(t CO2-eq)
enteric fermentation in cowsenteric fermentation (CH4)365.30365.3
manure managementmanure management (CH4)6181.006181.0
manure management (N2O)50.01.951.9
manure field consumptionmanure field application (N2O)1.90.22.1
feed production and processingpesticide production (CO2)066.066.0
machinery operations (CO2)075.275.2
dairy farm energy consumption
(diesel/electricity)
dairy farm energy consumption (CO2)01742.21742.2
total system emissions
(unallocated)
6598.21885.58483.7
total emissions from milk production (after allocation) 6268.31791.28059.5
Table 8. Comparison of carbon emissions of the two farming systems (t CO2-eq).
ScenarioFeedingEnteric FermentationManure ManagementFertilization of FarmlandTotal Emissions
Stockbreeding system
(this study)
920.75135.13947.4436.813,429.5
Non-stockbreeding system1585.35135.13947.41358.615,015.9
Table 9. Carbon dioxide equivalent emissions under different scenarios (t CO2-eq).
Emission SegmentEmission SourceBaseline ScenarioScenario 1Scenario 2Scenario 3Scenario 4
enteric fermentation in cowsenteric fermentation (CH4)5135.15135.15135.15135.13081.1
manure managementmanure management (CH4)2939.72204.81102.41102.40.0
direct emissions of manure management (N2O)698.8524.1262.1262.1698.8
indirect emissions of manure management (N2O)308.9231.7115.8115.8308.9
manure field consumptiondirect emissions from field application of manure (N2O)363181.5181.5181.5181.5
indirect emissions from field application of manure (N2O)73.836.936.936.936.9
feed production and processingdirect emissions from field application of nitrogen fertilizers (N2O)293.6293.6293.6293.6293.6
indirect emissions from field application of nitrogen fertilizers (N2O)47.747.747.747.747.7
fertilizer production (CO2)63.563.563.563.563.5
pesticide production (CO2)37.337.337.337.337.3
machine operation (CO2)75.775.775.775.775.7
transport of feed and fertilizer (CO2)402.9402.9402.9402.9402.9
dairy farm energy consumption
(diesel/electricity)
energy consumption on dairy farms (CO2)2989.52989.52989.50.00.0
total system emissions 13,429.512,224.310,7447754.55227.9
Disclaimer/Publisher’s Note: The statements, opinions and data contained in all publications are solely those of the individual author(s) and contributor(s) and not of MDPI and/or the editor(s). MDPI and/or the editor(s) disclaim responsibility for any injury to people or property resulting from any ideas, methods, instructions or products referred to in the content.

