Article

Estimation of Dry Matter Yield in Mediterranean Pastures: Comparative Study between Rising Plate Meter and Grassmaster II Probe

1
MED—Mediterranean Institute for Agriculture, Environment and Development and CHANGE—Global Change and Sustainability Institute, University of Évora, Mitra, Ap. 94, 7006-554 Évora, Portugal
2
Departamento de Expresión Gráfica, Escuela de Ingenierías Industriales, Universidad de Extremadura, Avenida de Elvas s/n, 06006 Badajoz, Spain
*
Author to whom correspondence should be addressed.
Agriculture 2024, 14(10), 1737; https://doi.org/10.3390/agriculture14101737
Submission received: 5 September 2024 / Revised: 27 September 2024 / Accepted: 30 September 2024 / Published: 2 October 2024
(This article belongs to the Special Issue Innovations in Precision Farming for Sustainable Agriculture)

Abstract

:
This study evaluates two expedient electronic sensors, a rising plate meter (RPM) and a “Grassmaster II” capacitance probe (GMII), to estimate pasture dry matter (DM, in kg ha−1). The sampling process consisted of sensor measurements, followed by pasture collection and a laboratory reference analysis. In this comparative study, carried out throughout the 2023/2024 pasture growing season, a total of 288 pasture samples were collected in two phases (calibration and validation). The calibration phase (n = 144) consisted of measurements on three dates (6 December 2023, 29 February and 10 May 2024) in 48 georeferenced sampling areas of the experimental field “Eco-SPAA” (“MG” field), located at Mitra farm (Évora, Portugal). This pasture is a permanent mixture of various botanical species (grasses, legumes, and others) grazed by sheep, and is representative of biodiverse dryland pastures. The validation phase (n = 144) was carried out between December 2023 and April 2024 in 18 field tests (each with eight pasture samples), in three types of representative pastures: the same mixture for grazing (“MG” field), a commercial and annual mixture for cutting (mowing) and conservation (“MM” field), and legumes for grazing (“LG” field). The best estimation model for DM was obtained based on measurements carried out in February in the case of the GMII probe (R2 = 0.61) and December 2023 and February 2024 in the case of RPM (R2 = 0.76). The estimation decreased very significantly for both sensors based on measurements carried out in May (spring). The validation phase showed greater accuracy (less RMSE) in “MG” field tests (RMSE of 735.4 kg ha−1 with GMII and 512.3 kg ha−1 with the RPM). The results open perspectives for other works that would allow the testing, calibration, and validation of these electronic sensors in a wider range of pasture production conditions, in order to improve their accuracy as decision-making support tools in pasture management.

1. Introduction

Grazed pasturelands play multiple roles in agroecosystems [1]. In ruminant-based extensive livestock systems, pastures are one of the main components [2] and the main feeding source given that they are the most economical resource [3]. Furthermore, they contribute to the sustainability of animal production, end-product quality, animal welfare, and food security [4].
Accurate information about the available standing biomass on pastures is critical for adequate grazing management [1]. Pasture yield (DM, in kg ha−1) is a key parameter in the manager’s decision-making process, providing critical information for adjusting systems and establishing pasture management [2,3], particularly when calculating stocking rates and supplementation needs. A study carried out in New Zealand found that regular grass measurements can improve farm profits by up to 15% through increased feeding consistency, reduced feed imports, and improved grassland management [5].
The estimation of pasture DM by direct methods requires cutting and processing in the laboratory (drying and weighing), which are very laborious and time-consuming and, consequently, costly, and thus not a practical option for farmers and not acceptable at a high sampling density on a commercial scale [1,6]. This measurement method is a destructive technique typically used as a reference for modelling pasture productivity by non-destructive methods [7].
The need to evaluate pasture DM yield arises because livestock farmers are aware of the value of this information [2]. In general, experienced farmers believe that through a simple visual assessment (observation on the ground, sometimes complemented by measuring the height with a graduated ruler), it can provide an approximate idea of the pasture availability. According to Murphy et al. [7], visual estimation, being the fastest and cheapest, is the most fundamental non-destructive grass measurement method. However, it requires ample experience and is subjective (varies from person to person) and, so, is not accurate enough [8]. Therefore, the evaluation of indirect methods, based on technologies with potential for fast and efficient monitoring of pasture yield variability, is fundamental for ensuring the economic sustainability and mitigation of the environmental impact in a strategic sector such as pasture-based livestock production [7]. On more advanced livestock farms, managers are now waking up to electronic tools that allow relatively quick measurements and, mainly, the automatic storage of the collected information (on the sensor itself or on a cell phone), often combined with georeferencing systems (Global Navigation Satellite Systems, GNSS receivers) and, therefore, with the possibility of being displayed in map form (spatialization of the data) [1,9]. With the implementation of the Precision Agriculture (PA) concept, especially in the past decade, the emerging field of technologies and digitalization of farm processes has enabled the development of new tools and methods, providing new opportunities to efficiently collect and easily process large amounts of data [9], allowing farmers to make prompt and informed pasture management decisions [8].
There are studies evaluating technologies to estimate pasture DM, especially in New Zealand and Australia [10,11,12] or in Ireland [7,13], both with proximal sensors (PSs), and the combination of PS with remote sensing (RS) to improve the accuracy of DM estimates. These studies frequently rely on the use of RS hyperspectral and multispectral optical sensors, including satellite-mounted [14] or drone-mounted ones [15]. These sensors obtain vegetation indices by calculating the ratio of different spectra of light [6]. NDVI (Normalized Difference Vegetation Index) is one of the most common indices used to estimate the quantity of vegetation based on the ratio of red and NIR light wavelengths that are absorbed by pasture photosynthesis [6,7,12]. These advancements based on RS can offer moderate-to-high-resolution pasture mapping, and high accuracies of biomass prediction, but have some limitations. While NDVI shows a correlation with biomass, it has been reported that saturation occurs as the biomass increases [6]. On the other hand, the frequent occurrence of clouds [12] during the vegetative period of dryland pastures in the Mediterranean region (autumn, winter, and spring) and the predominance of agro-silvo-pastoral systems, where pastures develop under tree canopies (cork oaks and holm oaks in particular in the Alentejo region, south of Portugal), reinforce the interest in proximal sensors, which overcome the difficulties inherent in the use of RS approaches [16]. Proximal sensors also have the advantage of providing detailed data collection, including the identification of botanical species, which is very important for assessing the biodiversity and pasture quality. Therefore, the continual improvement in proximal sensors is just as important as the development of remote methods [12].
There is a range of technologies that have been used for ground-based measurement of pasture biomass, which include optical spectral measurements (for example, “GreenSeeker” or “OptRx”), capacitance probes (electrical signal), or ultrasonic sensors [6]. Serrano et al. [17,18,19,20], for example, published several works evaluating the Grassmaster II capacitance probe in pastures in Portugal. These showed the need to adapt the generic equation proposed by the manufacturer (Equation (1)) to the specific conditions of each pasture. They reported that the accuracy of capacitance readings can be affected by moisture (soil and pasture moisture) due to rain or dew [6] and highlight the need to use dynamic calibration models, adjustable to the variability between locations (type of pasture and seasonality of the vegetative state; pasture moisture content, PMC; crude protein, CP; or fiber content), throughout the year, and adjustment to the pasture conditions in which they are used [3]. These studies also compare the capacitance probe with the optical sensor “OptRx” under the same field conditions [19].
DM = 0.72 × CMR 2200
where DM is the dry matter yield (in kg ha−1) and CMR is the corrected measurement reading by the Grassmaster II capacitance probe.
Regardless of the method used, the estimation of dry matter availability must be quick and reliable, since intensive grazing management needs immediate information for quick decision-making [3]. Pasture biomass is often estimated from measured pasture height or compressed height. There are currently a range of techniques for this purpose, among them LIDAR technology (“LIght Detection And Ranging”, by laser), ultrasonic sensors [6], or the rising plate meter (RPM). The RPM is the most commonly used tool for pasture monitoring on farms in several countries, like Chile and New Zealand [3], Australia [9,12], or Ireland [7]. The RPM records a combined measure of pasture height and density, referred to as pasture compressed height (HRPM), using a weighted disk attached to a scaled staff that is dropped onto the pasture [7] and, based on this, estimates the DM [4]. Bluetooth-enabled plate meters, which streamline and automate aspects of data collection to generate pasture budgets, are currently commercially available and can be used in association with internet-based grassland management decision support tools (DSTs) [4]. Nevertheless, the use of these methods (Grassmaster, RPM, or others) requires a previous calibration for the conditions under which they will be used, given that the standard equations of these instruments were obtained in countries where this technology was developed, under specific conditions, which makes the prediction of DM in other locations inaccurate [3]. Therefore, in the case of RPM, the manufacturer proposes a generic (annual) equation (Equation (2)), adjustable to the evolution of the vegetative cycle (seasonal variation) on a monthly basis [9].
DM = H RPM × 140 + 500
where DM is the dry matter yield (in kg ha−1) and HRPM is the compressed height (in cm) measured by the RPM.
The evaluation of technologies with potential for monitoring pasture productivity and its spatial variability can be fundamental for more informed decisions, with the aim of ensuring the economic sustainability and the mitigation of the environmental impact of pasture-based livestock production systems. In Portugal, precision technologies have had relatively modest impact on extensive ruminant production systems. Therefore, this study evaluates the accuracy of two commercial electronic sensors to estimate pasture DM in biodiverse dryland pastures, an RPM and a capacitance probe.

2. Materials and Methods

2.1. Experimental Fields and Chronology of Tests

This study, carried out throughout the 2023/2024 pasture growing season, involved the collection of 288 pasture samples in two phases: calibration and validation (Figure 1).
The calibration phase (n = 144) consisted of measurements on three dates (6 December 2023, 29 February and 10 May 2024) in 48 georeferenced sampling areas of the experimental field “Eco-SPAA” (field “MG” in Figure 2), located at Mitra farm (Évora, Portugal; 38°53.10 N; 8°01.10 W). The sampling scheme of this study was identical to that of a previous study, consisting of 48 georeferenced sampling points (12 in each of the four grazing parks), defined by a botanical expert according to the floristic composition of the pasture in the previous growing season.
This pasture is a permanent mixture of botanical species (grasses, legumes, and others) grazed by sheep, representative of biodiverse dryland pastures of the southern region of Portugal. The validation phase (n = 144) was carried out between December 2023 and April 2024 through eighteen field tests in four fields with different pastures types (Figure 2): six field tests were conducted in the “Eco-SPAA”, the same field (MG) used in the calibration phase (MG); six field tests were conducted in a field of legumes for cattle grazing (LG); and six field tests were conducted in two fields sown with a commercial and annual mix of botanical species for cutting and conservation (MM, mixture for mowing). In each of these field tests (validation phase), 8 pasture samples were collected. A total of 288 pasture samples were used in this comparative study. Figure 3 shows, in detail, the “MG” experimental field, with the location of the 48 sampling points for the calibration phases (I, II, and III) and the 6 sampling areas of field tests of the validation phase, with the indication of the predominant botanical species.
The number of samples for the calibration phase (144 = 3 × 48) was determined based on the number of pasture monitoring and collection events. These were chosen according to the evolution of the pasture in each season of the vegetative growth cycle (in this case, 3: autumn, winter, and spring). In the validation phase, the aim was to have the same number of samples as the calibration phase (144) and with an equal representation of the 3 types of pasture under consideration (mixture for grazing, mixture for cut and conservation, and legume for grazing): 3 types of pasture × 8 sampling areas × 6 sampling events = 144.
Figure 4 shows the predominant pasture species in each experimental field. The field “MG” is a pluriannual biodiverse pasture (mixture of species, legumes, grasses, and others, predominantly Erodium mochatum, Diplotaxis catholica, Trifolium repens, and spontaneous grasses) grazed by sheep. This field integrates a research project of the evaluation of the effect on a pasture of soil pH correction and different grazing systems. The field was subdivided into four plots: P1 and P2 were subjected to several applications of dolomitic limestone between 2016 and 2023; P1 and P4 were submitted to continuous grazing and P2 and P3 were submitted to deferred grazing. “MM” was sown with commercial mixtures of annual botanical species, not grazed (mowing and conservation), predominantly Lolium multiflorum and Trifolium spp. The field “LG” is an exclusively legume pasture (predominantly white clover—Trifolium repens), which is grazed annually by cattle.
Considering the relationship between the productivity of dryland pastures and the variation in temperature and rainfall throughout the growing season, Figure 5 shows the thermo-pluviometric diagram (monthly mean temperature and rainfall) of the meteorologic station of Évora (about 10 km from the Mitra farm) between July 2023 and June 2024.

2.2. Equipment

In this work, the following equipment was used:
-
An electronic graduated ruler to measure pasture height (Figure 6a);
-
A Grassmaster II electronic capacitance probe (Novel Ways Electronic, Hamilton, New Zealand; Figure 6b) to measure pasture corrected meter reading (CMR) (https://www.novel.co.nz; accessed on 24 August 2024);
-
A “bluetooth-enabled Jenquip EC20 electronic platemeter”, RPM (Jenquip, 21 Darragh Road, Feilding, New Zealand; Figure 6c), to measure pasture compressed height (HRPM) (https://www.jenquip.nz; accessed on 24 August 2024);
-
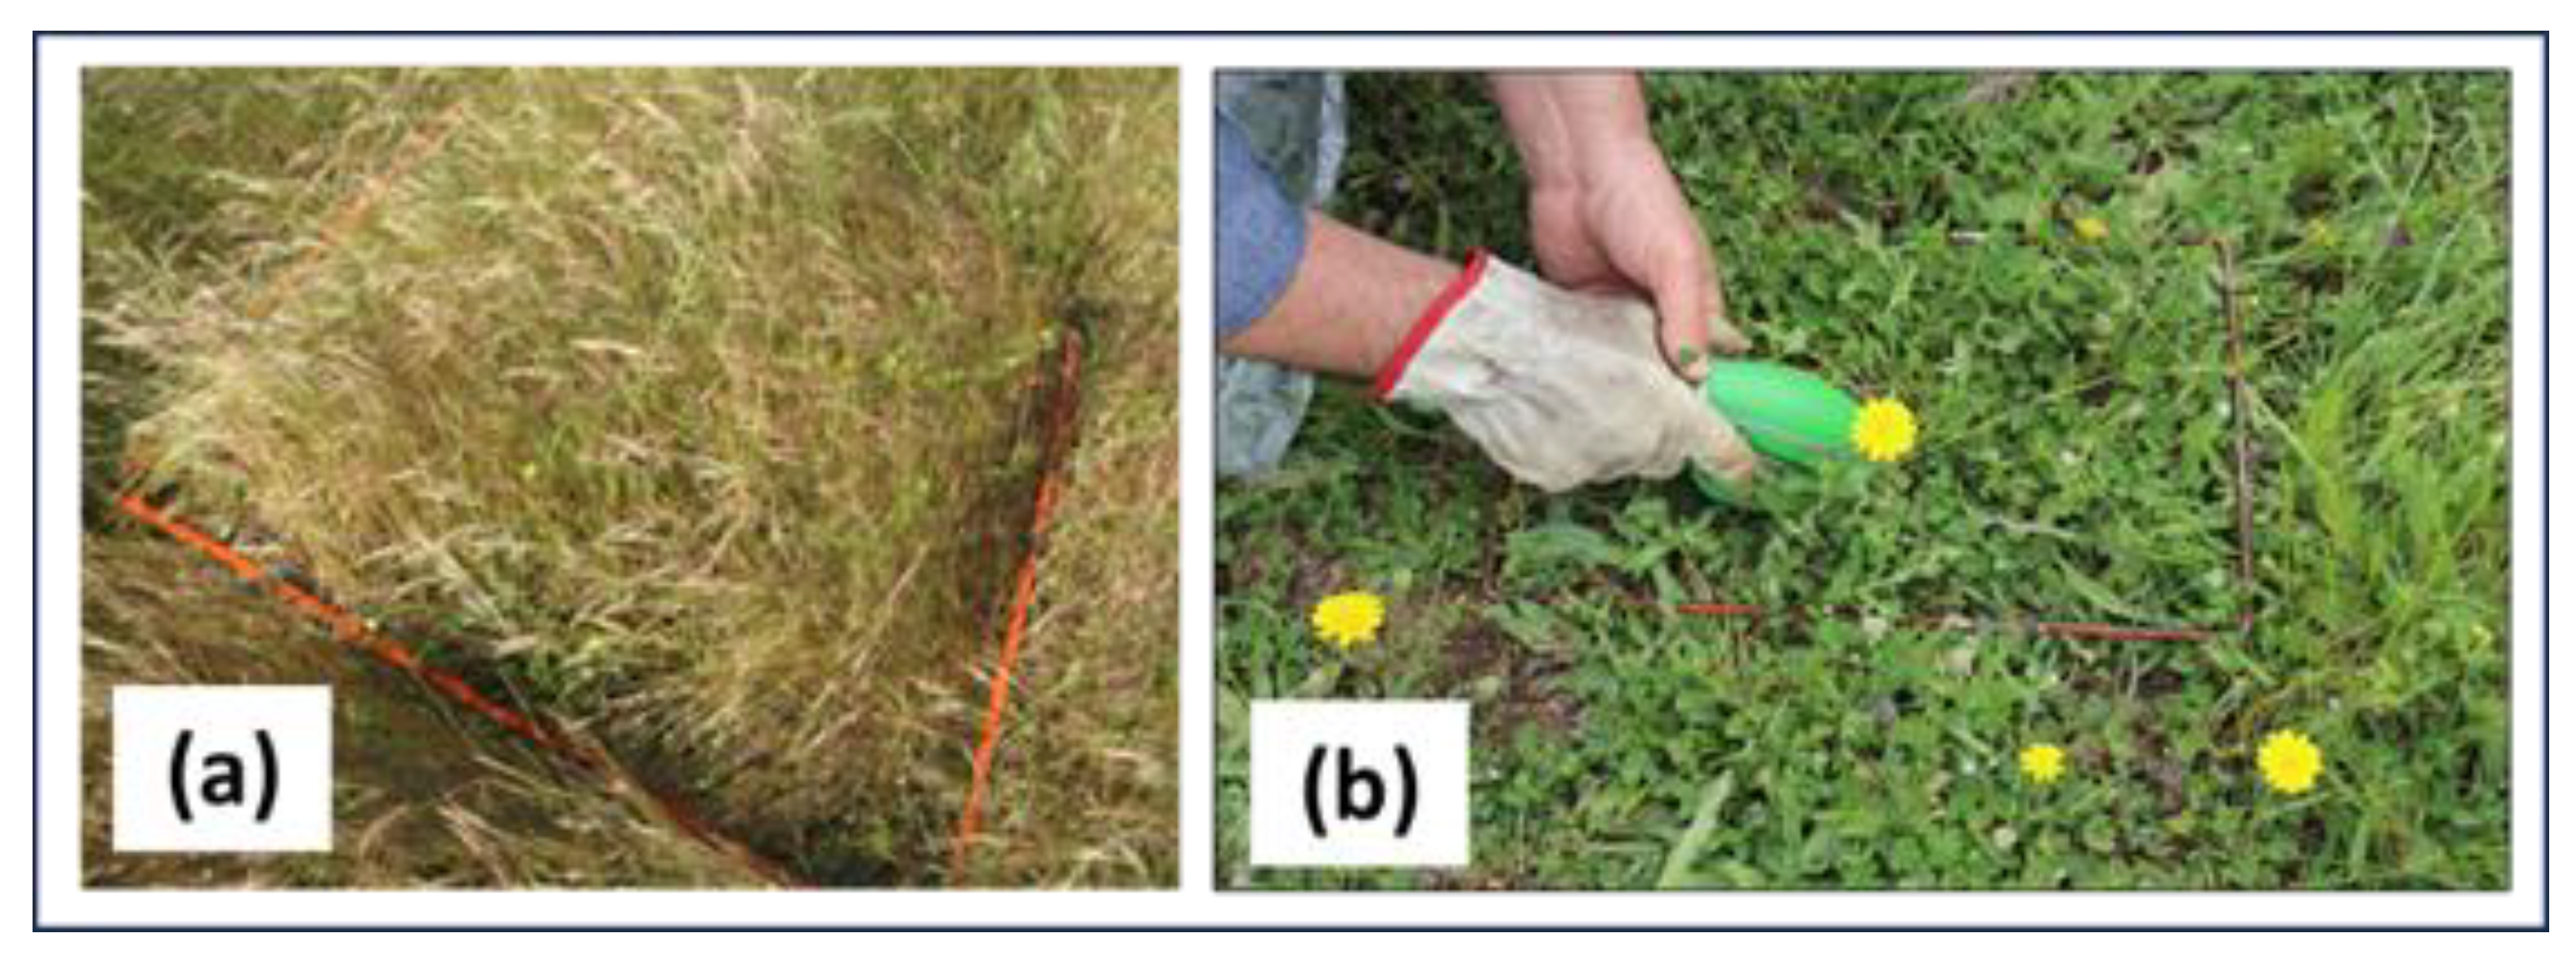
Frames of 0.25 m2 (quadrats of 0.50 m by 0.50 m) to mark pasture sample areas (Figure 7a);
-
Portable electric grass shears (Figure 7b) and plastic bags for storing the pasture samples.
Figure 6. Equipment used in this experimental work: (a) electronic graduated ruler; (b) Grassmaster II probe; and (c) rising plate meter.
Agriculture 14 01737 g006
Figure 7. Pasture cutting in the field: (a) quadrats; (b) grass shears.
Agriculture 14 01737 g007

2.3. Field Measurements, Pasture Sample Collection, and Analyses

The sampling process consisted of sensor measurements, followed by pasture collection and a laboratory reference analysis to determine green matter (GM), DM (both in kg ha−1), and PMC (in %).
The measurements in the 48 sampling areas of the field “Eco-SPAA” (calibration phase) were made according to the following procedure: (i) in each of these areas (of 3 m × 3 m), three metal rings were placed (0.5 m × 0.5 m, corresponding to a sampling sub-area of 3 × 0.25 m2); these sub-areas were selected by a senior researcher and expert in grasslands, to ensure representativeness of the spatial variability of each sampling area; (ii) in each of these sampling sub-areas, 3 measurements were taken of the height of the pasture (H, measured with an electronic graduated ruler), of the capacitance (CMR, measured with the Grassmaster II), and of the compressed height of the pasture (HRPM, measured with the RPM); (iii) after completing sensor measurements, 3 pasture samples were taken from each sampling area and collected in a plastic bag, properly labeled with the respective identification code. These composite pasture samples were transported to a laboratory where, using standard methods (weighing, dehydration in an oven, and weighing again) [21], productivity (GM and DM in kg ha−1) and PMC (in %) were determined.
The measurements taken in the other 18 sampling tests (validation phase), in areas of approximately 10 m × 10 m, were similar to the calibration phase, with the only difference being that 8 sub-sampling areas of 0.25 m2 (0.5 m × 0.5 m) were considered.

2.4. Data Analysis

The data obtained in each field test were organized in Microsoft Excel (Microsoft 365 version, Microsoft Corporation, Redmond, WA, USA) spreadsheets to calculate descriptive statistics parameters (mean, standard deviation, and range).
A regression analysis was used to evaluate the relationship between variables: H and DM, HRPM and DM, CMR and DM, H and HRPM. The coefficient of determination (R2) was used to evaluate the accuracy of the correlation models.
The best models obtained in the calibration phase were then validated by the results obtained in the 18 complementary tests. The root mean square error (RMSE, in kg ha−1) between the DM measured and the DM estimated in each of the validation tests was calculated.
The georeferenced information collected from the “Eco-SPAA” field on the three dates (I, II, and III) was processed using the ARCGIS v. 10.5 GIS software. A geostatistical analysis (ordinary kriging considering stationarity within the local neighborhood) with the Geo-statistical Analyst extension was used to obtain the respective maps representing spatial variability of pasture DM throughout the experimental field.

3. Results

3.1. Pasture Spatial and Temporal Variability

The database of this work is summarized in Table 1 (calibration phase) and Table 2 (validation phase).
The spatial variability of the various pasture parameters measured by sensors (H, HRPM, and CMR) or obtained in the laboratory analysis (GM, DM, and PMC) is reflected in the high CV, especially GM, DM, H, HRPM, and CMR (of the order of 40–50%). On the other hand, temporal variability (between measurement dates) is also very significant, with average productivity (DM) increasing in calibration tests from 571 kg ha−1 in December to 1834 kg ha−1 in February and 2353 kg ha−1 in May, while PMC shows a reverse trend (89.0%, 84.6%, and 69.9%, respectively, in December, February, and May). Pasture height (H) shows an evolution similar to DM (mean of 105.3 mm in December, 163.5 mm in February, and 249.6 mm in May).
The evolution of pasture productivity (and quality) throughout the vegetative cycle is determined by meteorological conditions (especially temperature and precipitation) and conditioned by grazing management (continuous, deferred, and stocking rate, among other aspects). Figure 5 shows a relatively balanced distribution of precipitation in autumn and winter, which guaranteed conditions for high pasture productivity.

3.2. Relationship between Variables: Calibration Phase

The expected relationship between pasture height (H, measured with an electronic stud) and pasture compressed height (HRPM, measured with the RPM) was assessed. Figure 8 shows that this relationship was significant on all three calibration dates (R2 between 0.59 and 0.71). The H/HRPM ratio tends to increase towards the end of the growing season (spring).
The estimation of pasture productivity (DM) from height (H; Figure 9), compressed height (HRPM; Figure 10), or CMR (Figure 11) was also significant on all monitoring dates, with a tendency for R2 to drop sharply in the final phase of the growing season (spring).
The results also showed greater accuracy in the estimation based on compressed height (HRPM) than based on the height measured by the electronic stud (H) or the CMR measured by the Grassmaster II capacitance probe. This improvement was consistent across all assessment dates. The estimation model based on all monitoring dates (n = 144; Figure 9d, Figure 10d, and Figure 11d) showed a drop in R2 compared to the best estimation model (December for H, and February for HRPM and CMR), which justifies the proposed approach of establishing calibration models for each season (in this case, autumn, winter, and spring). However, analyzing the estimation models based on the two best dates (autumn and winter) shows that a slight improvement is still possible in the case of the RPM (n = 96; R2 = 0.76; Figure 12). In the case of Grassmaster II, the best model is based on field tests carried out in February 2024 (n = 48; R2 = 0.61).

3.3. Relationship between Variables: Validation Phase

In order to ensure that the pastures used in this phase (validation) took into account the variability of the typical pastures in the region, a third of the tests (six) were carried out on the same field used in the calibration phase (MG—mixture for grazing), a third of the tests (six) were carried out in two fields of a grassland mixture for cut and conservation (MM—mixture for mowing), and the remaining six tests were carried out in a field of legumes grazed by cattle (LG). The mean values of sensor measurements and pasture parameters in each of these eighteen tests (Table 2) show a pattern similar to that obtained in the calibration phase (Figure 13). These results confirm the significant relationship between H and HRPM (Figure 13a; R2 = 0.80), and between DM and H, and HRPM and CMR (Figure 13b, Figure 13c, and Figure 13d; R2 = 0.61, 0.76, and 0.57, respectively). The polynomial relationship between DM and H, and HRPM and CMR, indicates the difficulty these sensors may have to estimate high pasture yields.
The validation of the Grassmaster II probe and RPM sensor was evaluated comparing the best model obtained in the calibration phase of each of these two tools with the mean values of 18 validation tests (Figure 14). The RMSE for each set of six tests carried out in each pasture type (MG, MM, and LG) was used as an evaluation parameter. The greater accuracy (less RMSE) was obtained in MG field tests (the same field of the calibration phase; RMSE of 735.4 kg ha−1 with GMII and 512.3 kg ha−1 with the RPM), followed by MM field tests (833.4 kg ha−1 with the GMII and 867.6 kg ha−1 with the RPM), and higher RMSE values (lower accuracy) were obtained in LG field tests (1199.6 kg ha−1 with the GMII and 1684.3 kg ha−1 with the RPM).

4. Discussion

4.1. Pasture Spatial and Temporal Variability

The application of new technologies to grassland farming is a complex challenge, especially due to the greater diversity within grassland, in terms of the soil and pasture spatial variation, and the highly temporal dynamics of grass species [22]. Each botanical species, with specific characteristics (morphology, prostrate or erect size, moisture content, proportion of stems and leaves, proportion of protein and fiber, etc.), is measured differently by each sensor, depending on its operating principle (eminently mechanical, as in the case of the RPM; electrical, as in the case of the Grassmaster; optical; or other) and variably over time. For this reason, the diversity of Mediterranean pastures, with varying proportions over time, is a challenge for the performance of each sensor.
A considerable source of error of estimation is due to the large variation (high CV) of measurements within pasture fields, resulting from the interaction between technological tools and the heterogeneity of the vertical profile of the sward [7]. Factors reported to affect this interaction include grass species, season, and grazing intensity [7,23,24]. In the field where the measurements were taken to calibrate the sensors (“Eco-SPAA”), in addition to the heterogeneity typical of these biodiverse dryland pastures, demonstrated by the presence of more than a hundred dozen botanical species in relatively small areas (4 ha), there are other sources of spatial variability associated both with the logistic management of the field itself (it includes four sub-plots, each with approximately 1 ha, of which only two were subject to dolomitic limestone application) and with different sheep grazing intensity and management (a continuous grazing system was used with 1 LU ha−1 in two sub-plots, and a deferred grazing system with 2 LU ha−1 in the other two sub-plots). Any of these factors has a decisive effect on the spatial variability of the height of the pasture and its productivity, quality, and floristic composition (in terms of both species and morphology) [7,25].
The obvious consequence of this spatial variability is the need for a large number of samples to account for sward spatial variation within grazed pastures. Murphy et al. [7] suggest that, in order to avoid operator bias, sample locations should be randomly selected and spatially balanced throughout a pasture. For the purpose of this work, the sampling scheme was defined in a previous study with the georeferencing of 48 sampling points (12 in each of the four grazing parks). These points were maintained on all pasture sampling dates of the calibration phase (autumn, winter, and spring). In order to further eliminate operation bias, which is a significant source of measurement error [24], the team of the field sampling process (measuring with the sensors and taking pasture samples) was also maintained throughout the experimental period.
In operational terms, the sensors evaluated in this study (RPM and Grassmaster) have similar field requirements to the conventional measurement of height with a graduated ruler. However, unlike the latter, these electronic sensors do not require manual recording of the measurements, as they are equipped with computerized devices for storing the records, which allows them to be made more quickly. Any of the three measurement systems (height with a ruler, compressed height with the RPM, or electrical disturbance measured by the Grassmaster probe) benefit from establishing a test protocol that allows the best possible representation of the pasture area under evaluation. According to Murphy et al. [7], the implementation of robust sampling protocols in conjunction with GNSS technology enables the use of geostatistical procedures, which can be used to develop pasture parameter maps for spatial analyses and PA applications. Gargiulo et al. [9] reinforced the interest in integrating pasture measurement sensors with GNSS receivers and mapping tools, providing new opportunities for efficiently collecting and easily processing large amounts of data.
The spatial variability of the various pasture parameters evaluated in this study (measured by sensors or obtained in laboratory analysis) is reflected in the high CV (around 30 to 50%), which is also referred to in various works involving dryland pastures [25,26]. Murphy et al. [23], in pastures in Ireland, found biomass CV to be between 15 and 50%. According to the same authors, this heterogeneity increases the difficulty of estimating the true average pasture DM yield and is typically higher within grazed swards as a result of selective grazing, dung pats, and seasonal changes in sward morphology. Murphy et al. [24] present an overview of the most recent research pertaining to the development of precision grass measurement technologies, and indicate that the values of mean sward heterogeneity in terms of pre-grazing grass quantity in temperate grasslands vary between 25 and 46%.
The temporal variability (between measurement dates) is also very significant in our study. In dryland pastures, the evolution of productivity throughout the vegetative cycle (temporal dynamic) is determined by meteorological conditions and is conditioned by grazing management [27]. In the agricultural year under study (2023/2024), rainfall occurred evenly during the months of autumn and winter (approximately 300 mm of accumulated rainfall in autumn—between September and December, and also in winter—between December and March), which ensured both the first peak in production in late autumn and maximum accumulated production in spring, phases recognized as determining the productive potential of the pasture [27]. In our study, pasture measurements were taken between these two phases (between December and May) to ensure the representativity of the determinant phases of the pasture vegetative cycle.

4.2. Relationship between Variables

Pasture biomass is often reasonably correlated with measured pasture height or compressed height [6,8,12]. In this study, the relationship between pasture height (H, measured with an electronic graduated ruler) and pasture compressed height measured with the RPM (HRPM) was significant on all three calibration dates (R2 between 0.59 and 0.71) and the H/HRPM ratio tends to increase towards the end of the growing season (spring). This behavior may reflect on the one hand, the morphological changes that occur in the plants [23], and on the other, the increase in senescent material [28].
One aspect that this study highlights is the confirmation of the significant effect of the pasture’s temporal dynamics on the correlation between indirect measurements (carried out by proximal sensors) and direct measurements of pasture DM, which requires adapting the calibration equations to the specific conditions of each pasture and season and is mentioned in various published works related to the calibration of these technological tools (Grassmaster and RPM) [7,9,17,18,19,20,29]. Our study showed a tendency for R2 to drop sharply at the final phase of the growing season (spring), which should also reflect the aforementioned temporal dynamics of the evolution of pasture characteristics, well documented in the literature: the morphological changes that occur in the transitions from the vegetative to the reproductive stages of the growth cycle, which make the plants more heterogeneous (in terms of height and density) and more fibrous [23,24] and the increasing abundance and proportion of senescent material in the second half of the growing season [28].
Our study also showed greater accuracy in the estimation based on compressed height (HRPM; R2 = 0.76 for the best model based on the simultaneous measurements of December and February) than based on the height measured by the electronic graduated ruler (H; R2 = 0.67 for the best model) or based on the CMR measured by the Grassmaster II capacitance probe (R2 = 0.61 for the best model). This improvement was consistent across all assessment dates.
These types of technological tools have been available for a long time [8] and our results are in line with similar studies, for example, carried out by Murphy et al. [30] or Sanderson et al. [31], which compared the sward stick or a pasture ruler, a capacitance probe, and an RPM in pastures located in the USA. Murphy et al. [30] obtained correlation coefficients (r) of, respectively, 0.70, 0.65, and 0.72 for pre-grazing and much lower values for post-grazing, which confirms the importance of grazing as a factor of variability and uncertainty in the forecast. Also, Sanderson et al. [31] recorded higher levels of error in the Grassmaster (33%) and lower levels in the RPM (26%), with the pasture ruler performing in the middle. Nevertheless, according to the same authors, these results indicate a level of precision adequate for making day-to-day management decisions in farms.
In Portugal, we are not aware of farmers using technologies to support pasture monitoring in extensive animal production systems, so empiricism and experience are the basis for decision-making, occasionally complemented by measurements of pasture height with a graduated ruler. With regard to this relatively basic level of technological incorporation, the sensors evaluated in this study (RPM and Grassmaster) represent a stage of further development since they do not require manual recording of the measurements, as they are equipped with computerized devices for storing the records, which allows the sampling to be made more quickly. The integration of these sensors with GNSS and mapping tools provides new opportunities to efficiently collect and easily process large amounts of data to fill this knowledge gap [9].
With reference to the relatively recent review of Murphy et al. [24], about precision technologies for optimizing pasture management, it can be seen that the evaluation of technologies for proximal monitoring of pasture productivity has been more intensive in countries with a strong vocation for animal production, such as Australia, New Zealand, and the USA, and in Europe, Ireland, but there is no mention of any work carried out in the Iberian Peninsula. Regarding the RPM, we are not actually aware that this equipment has even been tested on dryland pastures in the Mediterranean region, in a similar context (pasture characteristics and climatic conditions). There are therefore no data available to put the results of this study into perspective. However, relatively exhaustive and long-term field tests were carried out by Serrano et al. [17,18,19,20] to calibrate and validate the Grassmaster II probe, presenting calibration equations for estimating DM yield in typical pastures of the southern region of Portugal (grasses, legumes, mixture, and volunteer annual species) and at different phenological stages. Of these, the exploratory work [17], carried out with a small number of samples, revealed very promising results, albeit with a wide range of determination coefficients (between 0.90 for grasses, 0.87 for the mixture of botanical species, and 0.48 for legumes). The following development, with a broader database [18], revealed the importance of estimating the productivity as a function of PMC, showing greater accuracy of this tool for PMC > 80% (R2 = 0.51, RMSE = 353.7 kg ha−1). Finally, a long-term study (2007–2019) [20], with more than 1600 pasture samples collected in 11 fields, showed significant correlations between DM and CMR, especially in the early stages of the pasture growth cycle. The analysis of the data grouped by classes of PMC shows higher correlation coefficients for PMC > 80% (r = 0.75; RMSE = 763 kg ha−1), with a clear tendency for the accuracy to decrease when the pasture vegetative cycle advances and, consequently, the PMC decreases, which corroborates the results obtained with both sensors in our comparative study. This set of results led the authors to point out the potential of Grassmaster II as an in situ technique for assessing pasture mass to improve feed planning under Mediterranean conditions. In regards to the RPM, most of the studies that develop calibration equations for this type of technology report an R2 above 0.7, indicating that regardless of the forage species, it is a suitable technology for field use [3].
In our study, the validation phase showed greater accuracy (less RMSE) in MG field tests (the same field used in the calibration phase; RMSE of 735.4 kg ha−1 with GMII and 512.3 kg ha−1 with the RPM), followed by MM field tests (833.4 kg ha−1 with the GMII and 867.6 kg ha−1 with the RPM). The lowest accuracy, and highest RMSE, was obtained in LG field tests (1199.6 kg ha−1 with the GMII and 1684.3 kg ha−1 with the RPM).
Other studies, carried out with RPM in different countries and pasture types, have shown a wide range of RMSE, which encompass the results of the validation phase of our study, fitting in the following: 518 kg DM ha−1 [8]; 522 kg DM ha−1 [32]; 441 and 552 kg DM ha−1 [24]; 240 to 830 kg ha−1 [31]; 904 kg ha−1 [12]. The main reason for poor regression relationships between direct and indirect measurements, independently of sensor type, includes the heterogeneity of species composition [24]. Additionally, in the case of the capacitance meter (Grassmaster II), the literature mentions the limitation of the principle of operation and sensitivity of the probe (sensing area of 100 mm diameter by 400 mm tall); thus, herbage taller than 400 mm would not be sensed and measured [24]. This sensor is also very sensitive to external humidity in the pasture (for example, dew), requiring frequent recalibrations, and to soil humidity, which can trigger very high measurements (outliers) that negatively affect the quality of the relationships between the variables under study (CMR and DM) [19]. Similarly, in the case of RPM, the physical range of the disk attached to the scaled staff (250 mm) prevents measurements of pasture HRPM greater than this value. In any case, the physical limits to measurement presented by both sensors only become an issue in the later stages of the pasture growing season. In our study, the biggest errors (RMSE) were found in the field of legumes (‘LG’ field) and in the field of mixture for cutting (‘MM’ field), which have very different characteristics to the pasture where the calibration phase was carried out (‘MG’). Legumes are prostrate, with intertwined stems, which interferes with sensor measurements and makes it difficult to accurately delimit sampling areas. The mixture for cutting (Figure 15), on the other hand, which is not grazed, reaches very significant heights (approximately 0.5 m or more), which poses obvious problems for any of the technological tools under study.
The principal difference between calibration equations for the estimation of pasture DM is reliable when linked to the type and structure of the grasslands [3], fundamentally, the botanical composition and state (height, species, homogeneity, and herbal proportion) [8]. According to Cárdenas et al. [3], the slope of the linear calibration equation in highly fibrous grasslands (such as Stipagrostis amabilis) can be twice as high as others (such as Lolium perenne).
These considerations justify further studies to calibrate and validate the sensors in fields with similar characteristics (in terms of predominant botanical species), where more accurate models are expected. In addition to the interest in calibration/validation studies of these sensors in the diverse range of heterogeneous pastures characteristic of the region, this opens prospects for studies that leverage these proximal technologies by associating them with RS, allowing farmers to monitor large areas with little to no labor input. For example, Gargiulo et al. [9] report a clear improvement in the accuracy of the estimation of biomass using the NDVI from satellite images calibrated with an RPM (R2 of 0.61 to 0.72; RMSE of 566–1307 kg DM ha−1 to 255 kg DM ha−1). Previous studies have also explored the complementarity between various sensors to predict pasture productivity or even pasture quality [33]. These studies include complementarity between proximal sensors (PS); between PS and satellite images (RS); between different spectral configurations of Sentinel-2; and between different RS sources [34]. All these options help to improve the accuracy of pasture productivity estimates, which contribute to maximizing the utilization of fresh grass for animal feed throughout the growing season and consequently to reduction in whole-farm inputs, emissions, and costs, providing an efficient and sustainable approach for grass-based livestock systems [7].

4.3. Sensor Errors: Practical Applications in Future Studies

Since this study is more focused on the use of equipment than proposing new measures, the issue of sensor error deserves some considerations that can help future researchers to better control these variables in practical applications (Figure 16).
Farmers reported a lack of confidence in the accuracy and regarded measurement time and effort as major barriers to the adoption of sensors for pasture management [23,24]. The main reason for poor regression relationships between direct and indirect measurements of DM, independently of sensor type, is linked to the type and structure of the grasslands [3,22], including the heterogeneity of the composition of the botanical species [24] and their state (height, species, homogeneity, and herbal proportion) [8].
In future sensor calibration/validation work, it will be important to validate with pasture samples similar to those used in the calibration. In our study, the best results (highest R2 and lowest RMSE) were obtained when validating in the same experimental field and the biggest errors (RMSE) were found in the field of legumes and in the field of the mixture for cutting, which have very different characteristics than the pasture where the calibration phase was carried out. Legumes are prostrate, with intertwined stems, which interferes with sensor measurements and makes it difficult to accurately delimit sampling areas. In future work, sampling legume plants should be based on larger sampling areas: instead of the 0.5 m × 0.5 m frames that were used in this work (also suggested by Murphy et al. [7]); it is recommend to use, for example, 1 m × 1 m frames, to reduce the error when delimiting and taking samples. To maximize accuracy, we suggest increasing the density of pasture sampling. In our case, there was 48 ha−1, which corresponds to approximately 150 readings ha−1 with each sensor. Gargiulo et al. [9] concluded that the error did not decrease when the sampling density was greater than 150 readings. The increase in the number of readings carried out with each sensor in each sampling area can be seen to reduce the high CV (40–50%) found in our study [23]. However, both these options (larger sampling area or larger number of samples) require more time to cut and process the grassland samples. There is a trade-off between the benefit of increasing accuracy and time and cost. Reducing measurement time and effort is vital, not only in saving labor costs for farmers, but also to encourage more farmers to measure grass on a regular basis [24]. In future works, it is recommended to evaluate the real gain in accuracy that this option provides.
The mixture for cutting is essentially a grassland that is not grazed, and thus achieves very significant heights (approximately 0.5 m or more), particularly in the later stages of the pasture growing season, which poses obvious problems for any of the technological tools under study, based on the operating principle of each of these sensors (as described above) [24]. The technological challenge remains open for this pasture/grassland type. These studies and DM estimation models should seek specific calibration responses for each type and stage of pasture development, to reduce the effect of pasture heterogeneity [7].
Another aspect of pasture heterogeneity with impact on the proportion of the variation in the dependent variable that is predictable from the independent variable is reflected in the sharp drop in R2 at the final phase of the growing season (spring), which should also reflect the temporal dynamics of the evolution of pasture characteristics. This aspect is well documented in the literature: morphological changes that occur in the transitions from the vegetative to the reproductive stages of the growth cycle, which make the plants more heterogeneous (in terms of height and density) and more fibrous [23,24], and the increasing abundance and proportion of senescent material in the second half of the growing season [28]. This is another determining factor in the sensors’ reading error and the consequent correlation model for estimating pasture DM yield [22]. In practice, the use of these technological tools (Grassmaster and RPM) is limited to the initial (autumn) and intermediate (winter) phases of the pasture’s vegetative cycle. However, spring is also an important phase, since the favorable combination of temperature and rainfall provides the highest peak of productivity [27], so estimating DM during this period can be very useful in managing grazing (stocking density, rotating animals between plots), supplementing animal feed, or even the farmers’ decision to cut and conserve forage in years of high productivity [16]. Here too, the technological challenge remains open for taking advantage of the synergy between sensors (between PS or between PS and RS) to find a more reliable response for farmers [9].
In addition to the heterogeneity characteristic of Mediterranean dryland pastures, a significant source of measurement error is inconsistent operator use, which is defined in terms of replicability or operator bias, which can be minimized by adhering to a robustly designed sampling protocol [24]. The future calibration and validation work of these technologies should maintain a consistent sampling protocol (sample areas randomly selected and spatially balanced) as well as a single measurement operator [23], aspects fulfilled in our study. The sampling areas were consistently maintained on all pasture sampling dates of the calibration phase (autumn, winter, and spring). To further eliminate operation bias, which is a significant source of measurement error [24], the team carrying out the field sampling process (measuring with the sensors and taking pasture samples) was also maintained throughout the experimental period.
The expansion of the PA concept and the consequent technological development require georeferencing the sampling areas. It is fundamental that future studies and applications of these proximal sensors are associated with GNSS receivers, enabling georeferencing and mapping pasture DM yield. This spatial representation of the variability pattern is the basis for farmers’ decision-making and management [23]. Figure 17 exemplifies the application of this development to the data obtained in this study in February of 2024: DM measured (obtained from reference laboratory determinations) or estimated (from Grassmaster or RPM measurements). These maps reflect the relationship between the parameters identified by the respective coefficients of determination. The maps also show that the variability patterns are more accurately captured by RPM than by the Grassmaster II probe.
In addition to these recommendations, common to both sensors, there are also some indications specific to each of these sensors. For example, in the case of RPM, the operational principle restricts its use to very tall pastures (forage) with a compressed height of more than 250 mm, while in the case of Grassmaster II, its measurement sensitivity (electric field) does not exceed 400 mm in height. Additionally, in the case of Grassmaster II, the external humidity (in pasture or soil), typical of rainy, frosty, or dewy days, produces anomalous measurements (outliers) and requires the constant calibration of the sensor, which negatively affect the quality of the relationships between the variables under study [19].
This exploratory study did not consider the impact of meteorological or environmental parameters (such as precipitation, daily air temperature, global radiation, potential evaporation, soil moisture, available soil nitrogen, or others) on the prediction of DM pasture growth rates. According to Murphy et al. [23], the use of these parameters should contribute to more accurate models and a better representation of the DM seasonal variation resulting from the transitions between the morphological pasture growth stages. This can be further explored in future studies with these sensors, with more complete databases covering several years.

4.4. Limitations and Perspectives of This Study

The results of this exploratory study in the Mediterranean region, with dryland pastures characteristic of the Montado (in Portugal; ‘Dehesa’ in Spain), provide good prospects for the RPM as an expedient sensor for estimating pasture DM. However, the results are less favorable in the case of the Grassmaster probe, not only because of its lower accuracy, but especially because it is not possible to make accurate measurements on rainy days, or even on days with dew or frost, which often occur during the pasture growing season.
The main limitation of this study is that it only covered one pasture vegetative cycle. It is now important to extend this study and collect long-term data, including more pastures, with different characteristics and over various pasture growing seasons, to better capture the seasonal effects [23], an aspect emphasized by the manufacturers of each of the sensors, which provide different coefficients for the generic regression equation to be used throughout the pasture vegetative cycle. Several studies have shown the significant temporal (inter-annual) variability of rainfed pasture productivity in the Mediterranean region [19,27]. This approach will also make it possible to assess the temporal stability of the sensors’ performance.
The continuation of this work in the coming years, with the creation of a large-scale sensing dataset, will allow further developments in terms of DM estimation models. This phase will also be an opportunity to consider a more complete and advanced statistical approach, based on artificial intelligence, machine multi-task learning techniques, or neural networks, such as the applications of rolling recalibration methods where the model updates itself as new data are obtained. This could be particularly useful for optimizing DM predictive models. These adaptive models can continuously refine the calibration based on incoming data, reducing the lag between observed changes in conditions and adjustments in sensor calibration [35].
Evaluating sensors and other technologies, publishing the results obtained in calibration tests under similar conditions and extending them to farmers through field demonstrations (the next phase) will make it possible to show the potential of these technologies. It is hoped that raising farmers’ awareness of the advantages of implementing PA will lead to their growing participation, with an overall impact on improving pasture-based livestock production systems.
We believe that in the near future, these technologies (proximal sensors, PSs) could become part of the PA framework, providing a high-resolution (spatial resolution) level of crop monitoring that will complement and validate other remote sensing technologies (satellites), which monitor at regular time intervals (temporal resolution) but with lower spatial resolution. In the particular case of pastures in the Mediterranean Montado ecosystem (Dehesa in Spain), these PSs allow access to areas under the tree canopy and are not interfered with by clouds. This PA framework could also integrate unmanned aerial vehicles (UAVs), especially with the participation of small service providers. The availability of these georeferenced databases obtained using different types of technology, and their processing in geographic information systems, combined with agronomic knowledge, will make it possible to improve decision-making in pasture and grazing management and establish PA cycles.

5. Conclusions

In Portugal, precision technologies have had relatively modest impact on extensive ruminant production systems, when compared with other agricultural sectors such as arable crops. The evaluation of technologies with potential for monitoring pasture productivity and its spatial variability is a fundamental element for more informed decisions, ensuring the economic sustainability and the mitigation of the environmental impact of pasture-based livestock production. This study evaluates two sensors to estimate DM in dryland pastures: an RPM and a capacitance probe (“Grassmaster II”). The best estimation model was obtained by RPM (R2 = 0.76; RMSE = 512.3 kg ha−1, based on measurements carried out in December 2023 and February 2024). For “Grassmaster II”, the accuracy was lower (R2 = 0.61; RMSE of 735.4 kg ha−1), based on measurements carried out in February 2024. For both sensors, accuracy drops dramatically in the final phase of the pasture’s vegetative cycle (May). Therefore, since the season influences the relationship between sensor measurements (compressed height in the case of RPM and CMR in the case of “Grassmaster II”) and pasture DM yield, these sensors should be recalibrated in more detailed long-term studies that account for a wider range of pasture production conditions (pasture characteristics) and in each season to achieve optimal accuracy. Simultaneously, a cost–benefit analysis is required to determine the true value of the implementation of these new technologies at the farm level.

Author Contributions

Conceptualization, J.S.; methodology, J.S., J.F., S.S. and F.J.M.; validation, J.S. and S.S.; formal analysis, J.S., J.F. and F.J.M.; investigation, J.S., J.F., S.S. and F.J.M.; resources, J.S.; writing—original draft preparation, J.S.; writing—review and editing, J.S., S.S. and F.J.M.; supervision, J.S.; project administration, J.S.; funding acquisition, J.S. All authors have read and agreed to the published version of the manuscript.

Funding

This work was funded by National Funds through FCT (Foundation for Science and Technology) under the Project UIDB/05183/2020. This work was also supported by the project “SUMO—Sustentabilidade do Montado” (Ref. PRR-C05-i03-I000066-LA 6.2).

Institutional Review Board Statement

Not applicable.

Data Availability Statement

Data are contained within the article.

Conflicts of Interest

The authors declare no conflicts of interest.

References

  1. Nickmilder, C.; Tedde, A.; Dufrasne, I.; Lessire, F.; Tychon, B.; Curnel, Y.; Bindelle, J.; Soyeurt, H. Development of machine learning models to predict compressed sward height in Walloon pastures based on Sentinel-1, Sentinel-2 and meteorological data using multiple data transformations. Remote Sens. 2021, 13, 408. [Google Scholar] [CrossRef]
  2. Mas-Portocarrero, W.; Cuzco-Mas, E.; Mathios-Flores, M.A.; Angulo-Villacorta, C.D. Evaluation of two methods for estimating dry matter availability in mixed pastures in the Amazon region Peru. Pastos Y Forrajes 2022, 45, 1–8. [Google Scholar]
  3. Cárdenas, J.; Balocchi, O.; Calvache, I. Calibration of the rising plate meter for mixed pastures of Ryegrass (Lolium perenne L.) and Kikuyo (Cenchrus clandestinus). Chilean J. Agric. Anim. Sci. 2020, 36, 216–223. [Google Scholar] [CrossRef]
  4. Palma-Molina, P.; Hennessy, T.; Dillon, E.; Onakuse, S.; Moran, B.; Shalloo, L. Evaluating the effects of grass management technologies on the physical, environmental, and financial performance of Irish pasture-based dairy farms. J. Dairy Sci. 2023, 106, 6249–6262. [Google Scholar] [CrossRef] [PubMed]
  5. Beukes, P.C.; McCarthy, S.; Wims, C.M.; Gregorini, P.; Romera, A.J. Regular estimates of herbage mass can improve profitability of pasture-based dairy systems. Anim. Prod. Sci. 2019, 59, 359–367. [Google Scholar] [CrossRef]
  6. Legg, M.; Bradley, S. Ultrasonic arrays for remote sensing of pasture biomass. Remote Sens. 2020, 12, 111. [Google Scholar] [CrossRef]
  7. Murphy, D.J.; Shine, P.; O’Brien, B.; O’Donovan, M.; Murphy, M.D. Utilising grassland management and climate data for more accurate prediction of herbage mass using the rising plate meter. Prec. Agric. 2021, 22, 1189–1216. [Google Scholar] [CrossRef]
  8. Chapa, J.M.; Pichlbauer, B.; Bobal, M.; Guse, C.; Drillich, M.; Iwersen, M. Field evaluation of a rising plate meter to estimate herbage mass in Austrian pastures. Sensors 2023, 23, 7477. [Google Scholar] [CrossRef]
  9. Gargiulo, J.; Clark, C.; Lyons, N.; Veyrac, G.; Beale, P.; Garcia, S. Spatial and temporal pasture biomass estimation integrating electronic plate meter, Planet CubeSats and Sentinel-2 satellite data. Remote Sens. 2020, 12, 3222. [Google Scholar] [CrossRef]
  10. Pullanagari, R.R.; Yule, I.J.; Tuohy, M.P.; Hedley, M.J.; Dynes, R.A.; King, W.M. Proximal sensing of the seasonal variability of pasture nutritive value using multispectral radiometry. Grass Forage Sci. 2012, 68, 110–119. [Google Scholar] [CrossRef]
  11. Hutchinson, K.; Scobie, D.; Beautrais, J.; Mackay, A.; Rennie, G.; Moss, R.; Dynes, R. A protocol for sampling pastures in hill country. J. N. Z. Grassl. 2016, 78, 203–210. [Google Scholar] [CrossRef]
  12. Lawson, A.R.; Giri, K.; Thomson, A.L.; Karunaratne, S.B.; Smith, K.F.; Jacobs, J.L.; Morse-McNabb, E.M. Multi-site calibration and validation of a wide-angle ultrasonic sensor and precise GPS to estimate pasture mass at the paddock scale. Comput. Electron. Agric. 2022, 195, 106786. [Google Scholar] [CrossRef]
  13. O’ Donovan, M.; Dillon, P.; Rath, M.; Stakelum, G. A comparison of four methods of herbage mass estimation. Ir. J. Agric. Food Res. 2002, 41, 17–27. [Google Scholar]
  14. Punalekar, S.M.; Thomson, A.; Verhoef, A.; Humphries, D.J.; Reynolds, C.K. Assessing suitability of Sentinel-2 bands for monitoring of nutrient concentration of pastures with a range of species compositions. Agronomy 2021, 11, 1661. [Google Scholar] [CrossRef]
  15. Karunaratne, S.; Thomson, A.; Morse-McNabb, E.; Wijesingha, J.; Stayches, D.; Copland, A.; Jacobs, J. The Fusion of spectral and structural datasets derived from an airborne multispectral sensor for estimation of pasture dry matter yield at paddock scale with time. Remote Sens. 2020, 12, 2017. [Google Scholar] [CrossRef]
  16. Serrano, J.; Shahidian, S.; da Silva, J.M. Monitoring seasonal pasture quality degradation in the Mediterranean montado ecosystem: Proximal versus remote sensing. Water 2018, 10, 1422. [Google Scholar] [CrossRef]
  17. Serrano, J.M.; Peça, J.O.; da Silva, J.M. Calibration of a capacitance probe for measurement and mapping of dry matter yield in Mediterranean pastures. Precis. Agric. 2011, 12, 860–875. [Google Scholar] [CrossRef]
  18. Serrano, J.; Shahidian, S.; Marques da Silva, J. Calibration of GrassMaster II to estimate green and dry matter yield in Mediterranean pastures: Effect of pasture moisture content. Crop. Pasture Sci. 2016, 67, 780–791. [Google Scholar] [CrossRef]
  19. Serrano, J.; Shahidian, S.; Marques da Silva, J. Monitoring pasture variability: Optical OptRx® crop sensor versus Grassmaster II capacitance probe. Environ. Monit. Assess. 2016, 188, 117. [Google Scholar] [CrossRef]
  20. Serrano, J.; Shahidian, S.; Moral, F.; Carvajal-Ramirez, F.; da Silva, J.M. Estimation of productivity in dryland Mediterranean pastures: Long-term field tests to calibration and validation of the Grassmaster II probe. AgriEngineering 2020, 2, 15. [Google Scholar] [CrossRef]
  21. AOAC. AOAC Official Methods of Analysis of AOAC International, 18th ed.; AOAC International: Arlington, VA, USA, 2005. [Google Scholar]
  22. Schellberg, J.; Hill, M.J.; Gerhards, R.; Rothmund, M.; Braun, M. Precision agriculture on grassland: Applications, perspectives and constraints. Eur. J. Agron. 2008, 29, 59–71. [Google Scholar] [CrossRef]
  23. Murphy, D.J.; O’ Brien, B.; Hennessy, D.; Hurley, M.; Murphy, M.D. Evaluation of the precision of the rising plate meter for measuring compressed sward height on heterogeneous grassland swards. Precis. Agric. 2021, 22, 922–946. [Google Scholar] [CrossRef]
  24. Murphy, D.J.; Murphy, M.D.; O’Brien, B.; O’Donovan, M. A review of precision technologies for optimising pasture measurement on Irish grassland. Agriculture 2021, 11, 600. [Google Scholar] [CrossRef]
  25. Huyghe, C.; De Vliegher, A.; van Gils, B.; Peeters, A. (Eds.) Grasslands and Herbivore Production in Europe and Effects of Common Policies; Quae: Versailles, France, 2014; pp. 54–56. [Google Scholar]
  26. Fernández-Habas, J.; Moreno, A.M.G.; Hidalgo-Fernández, M.A.T.; Leal-Murillo, J.R.; Oar, B.A.; Gámez-Giráldez, P.J.; González Dugo, M.P.; Fernández-Rebollo, P. Investigating the potential of Sentinel-2 configuration to predict the quality of Mediterranean permanent grasslands in open woodlands. Sci. Total Environ. 2021, 791, 148101. [Google Scholar] [CrossRef]
  27. Efe Serrano, J. Pastures in Alentejo: Technical Basis for Characterization, Grazing and Improvement; Universidade de Évora—ICAM, Ed.; Gráfica Eborense: Évora, Portugal, 2006; pp. 165–178. (In Portuguese) [Google Scholar]
  28. Moeckel, T.; Safari, H.; Reddersen, B.; Fricke, T.; Wachendorf, M. Fusion of ultrasonic and spectral sensor data for improving the estimation of biomass in grasslands with heterogeneous sward structure. Remote Sens. 2017, 9, 98. [Google Scholar] [CrossRef]
  29. Murphy, D.J.; O’ Brien, B.; Murphy, M.D. Development of a grass measurement optimisation tool to efficiently measure herbage mass on grazed pastures. Comput. Electron. Agric. 2020, 178, 105799. [Google Scholar] [CrossRef]
  30. Murphy, W.M.; Silman, J.P.; Mena Barreto, A.D. A comparison of quadrat, capacitance meter, HFRO sward stick, and rising plate meter for estimating herbage mass in a smooth-stalked meadowgrass-dominant white clover sward. Grass Forage Sci. 1995, 50, 452–455. [Google Scholar] [CrossRef]
  31. Sanderson, M.A.; Rotz, C.A.; Fultz, S.W.; Rayburn, E.B. Estimating forage ass with a commercial capacitance meter, rising plate meter, and pasture ruler. Agron. J. 2001, 93, 1281–1286. [Google Scholar] [CrossRef]
  32. Alckmin, T.G.; Kooistra, L.; Rawnsley, R.; Lucieer, A. Comparing methods to estimate perennial ryegrass biomass: Canopy height and spectral vegetation indices. Precis. Agric. 2021, 22, 205–225. [Google Scholar] [CrossRef]
  33. Schaefer, M.T.; Lamb, D.W. A combination of plant NDVI and Lidar measurements improve the estimation of pasture biomass in Tall Fescue (Festuca arundinacea Var. Fletcher). Remote Sens. 2016, 8, 109. [Google Scholar] [CrossRef]
  34. Serrano, J.; Shahidian, S.; Paixão, L.; Marques da Silva, J.; Paniágua, L.L. Pasture quality assessment through NDVI obtained by Remote Sensing: A validation study in the Mediterranean silvo-pastoral ecosystem. Agriculture 2024, 14, 1350. [Google Scholar] [CrossRef]
  35. Ni, W.; Wang, T.; Wu, Y.; Liu, X.; Li, Z.; Yang, R.; Zhang, K.; Yang, J.; Zeng, M.; Hu, N.; et al. Multi-task deep learning model for quantitative volatile organic compounds analysis by feature fusion of electronic nose sensing. Sens. Actuators B Chem. 2024, 417, 136206. [Google Scholar] [CrossRef]
Figure 1. A schematic diagram illustrating the chronological sequence of field tests carried out in this study.
Agriculture 14 01737 g001
Figure 2. Location of experimental fields in Mitra farm and indication of number of field test codes.
Agriculture 14 01737 g002
Figure 3. Detail of “Eco-SPAA” field in Mitra farm with location of 48 sampling areas of calibration phase and 6 sampling areas of validation phase and indication of predominant botanical species.
Agriculture 14 01737 g003
Figure 4. Predominant pasture species of the experimental fields: “MG” (mixture of species for sheep grazing); “MM” (mixture of species for mowing and conservation); and “LG” (legumes for cattle grazing).
Agriculture 14 01737 g004
Figure 5. Monthly mean temperature and rainfall of meteorologic station of Évora, between July 2023 and June 2024.
Agriculture 14 01737 g005
Figure 8. Relationship between pasture height (H) and pasture compressed height (HRPM) in calibration field tests: in December (a), in February (b), in May (c), and on all dates (d).
Agriculture 14 01737 g008
Figure 9. Relationship between pasture height (H) and dry matter (DM) in calibration field tests: in December (a), in February (b), in May (c), and on all dates (d).
Agriculture 14 01737 g009
Figure 10. Relationship between pasture compressed height (HRPM) and dry matter (DM) in calibration field tests: in December (a), in February (b), in May (c), and on all dates (d).
Agriculture 14 01737 g010
Figure 11. Relationship between corrected meter reading (CMR) and pasture dry matter (DM) in calibration field tests: in December (a), in February (b), in May (c), and on all dates (d).
Agriculture 14 01737 g011aAgriculture 14 01737 g011b
Figure 12. Better model to estimate pasture dry matter (DM) based on pasture compressed height (HRPM) measured in calibration field tests of December and February (n = 96).
Agriculture 14 01737 g012
Figure 13. Validation field tests: (a) relationship between pasture height (H) and pasture compressed height (HRPM); relationship between pasture dry matter (DM) and height (H), and pasture compressed height (HRPM) and corrected meter reading (CMR), (b), (c), and (d), respectively.
Agriculture 14 01737 g013
Figure 14. Validation field tests for Grassmaster II probe (a) and for rising plate meter (RPM; b); indication of respective RMSE.
Agriculture 14 01737 g014
Figure 15. Measurements with the rising plate meter (RPM) in the field of the grassland mixture for cutting in the validation phase.
Agriculture 14 01737 g015
Figure 16. Sources of sensor error. Practical recommendations for future studies.
Agriculture 14 01737 g016
Figure 17. Maps of pasture productivity (DM) measured (obtained from reference laboratory determinations) and estimated, based on Grassmaster II probe and RPM readings in February 2024.
Agriculture 14 01737 g017
Table 1. Pasture and sensor measurements: database of calibration phase.
Test Code (n)Pasture
Parameter
GM
(kg ha−1)
DM
(kg ha−1)
PMC
(%)
H
(mm)
CMRHRPM
(mm)
I (48)Mean ± SD
(Range)
6254 ± 4274
(1423–21,090)
571 ± 257
(237–1703)
89.0 ± 3.3
(79.7–93.4)
105.3 ± 71.2
(14–400)
5050 ± 1444
(3219–9442)
53.1 ± 35.4
(14–232)
II (48)Mean ± SD
(Range)
13,256 ± 70,548
(3867–27,917)
1834 ± 745
(580–3460)
84.6 ± 3.2
(75.2–90.5)
163.5 ± 83.5
(30–420)
5762 ± 1479
(3214–10,540)
103.6 ± 55.3
(22–244)
III (48)Mean ± SD
(Range)
8245 ± 4759
(2580–25,037)
2353 ± 1108
(933–5400)
69.9 ± 6.9
(51.9–80.2)
249.6 ± 140.9
(60–660)
5366 ± 2005
(3196–18,531)
77.8 ± 42.2
(22–240)
n—Number of pasture samples; SD—Standard deviation; GM—Green matter; DM—Dry matter; PMC—Pasture moisture content; H—Height; CMR—Corrected measure reading, measured by Grassmaster II; HRPM—Compressed height, measured by rising plate meter (RPM).
Table 2. Pasture and sensor measurements: database of validation phase.
Test Code (n)Pasture
Parameter
GM
(kg ha−1)
DM
(kg ha−1)
PMC
(%)
H
(mm)
CMRHRPM
(mm)
1 (8)Mean ± SD
(Range)
13,003 ± 6821
(4590–25,890)
1346 ± 470
(730–2160)
88.7 ± 2.4
(84.1–91.7)
172.5 ± 71.3
(80–260)
5891 ± 1229
(3621–8956)
67.4 ± 24.9
(29–128)
2 (8)Mean ± SD
(Range)
15,426 ± 8360
(6050–26,210)
2260 ± 940
(1040–3470)
84.1 ± 3.4
(78.9–88.2)
341.4 ± 104.6
(230–500)
7136 ± 1164
(4664–10,483)
128.2 ± 53.1
(63–247)
3 (8)Mean ± SD
(Range)
18,084 ± 10,294
(6220–33,580)
1684 ± 767
(720–2690)
90.0 ± 1.3
(88.4–92.0)
182.5 ± 44.6
(110–250)
6242 ± 1293
(4371–9153)
92.0 ± 17.6
(55–134)
4 (8)Mean ± SD
(Range)
8373 ± 3163
(4850–12,890)
1456 ± 371
(960–1970)
81.8 ± 2.8
(76.5–85.0)
222.5 ± 91.0
(100 –326)
7526 ± 2412
(4285–11,076)
92.0 ± 34.7
(24–152)
5 (8)Mean ± SD
(Range)
18,749 ± 9233
(8040–31,710)
2301 ± 970
(1200–3670)
87.2 ± 1.3
(85.1–88.6)
253.8 ± 96.6
(100–380)
7997 ± 1860
(5267–12,947)
120.4 ± 46.4
(57–209)
6 (8)Mean ± SD
(Range)
12,281 ± 2385
(9250–15,830)
1763 ± 387
(1270–2510)
85.7 ± 0.9
(84.1–86.8)
186.3 ± 45.3
(130–260)
7050 ± 960
(5163–9542)
77.0 ± 9.6
(58–88)
7 (8)Mean ± SD
(Range)
15,269 ± 3606
(7750–18,700)
2195 ± 517
(1240–2840)
85.5 ± 1.6
(83.2–87.6)
256.3 ± 77.4
(130–380)
8122 ± 1263
(5479–11,078)
135.5 ± 38.1
(68–213)
8 (8)Mean ± SD
(Range)
20,443 ± 8564
(6720–33,930)
2534 ± 899
(1050–3600)
87.2 ± 1.5
(84.4–89.4)
238.8 ± 97.3
(150–400)
7630 ± 2568
(3981–16,901)
111.2 ± 55.7
(43–245)
9 (8)Mean ± SD
(Range)
24,520 ± 11,062
(10,410–42,600)
2771 ± 1302
(1350–5290)
88.5 ± 1.6
(87.0–91.0)
231.3 ± 95.8
(120 –400)
9794 ± 3033
(4610–15,794)
108.5 ± 33.7
(58–174)
10 (8)Mean ± SD
(Range)
52,130 ± 16,046
(24,734–72,240)
5288 ± 1677
(2603–7648)
90.1 ± 1.2
(88.9–92.2)
270.0 ± 49.0
(220–350)
8150 ± 1613
(5489–12,446)
171.1 ± 42.7
(92–245)
11 (8)Mean ± SD
(Range)
34,251 ± 14,754
(13,413–62,499)
4514 ± 1633
(1940–7119)
86.5 ± 1.3
(84.8–88.6)
461.3 ± 92.8
(340–580)
11,276 ± 2099
(6588–15,554)
232.2 ± 24.7
(151–246)
12 (8)Mean ± SD
(Range)
35,008 ± 15,151
(15,290–54,344)
3925 ± 1771
(1562–6340)
88.8 ± 1.2
(86.8–90.8)
501.3 ± 107.8
(370–640)
10,634 ± 2493
(6597–16,264)
208.7 ± 44.6
(127–246)
13 (8)Mean ± SD
(Range)
28,139 ± 8685
(21,890–49,170)
4090 ± 1017
(3140–6080)
85.1 ± 3.6
(76.7–87.6)
292.5 ± 76.3
(190–380)
8212 ± 2445
(4053–13,375)
153.3 ± 31.7
(90–206)
14 (8)Mean ± SD
(Range)
30,146 ± 13,458
(19,490–58,410)
4586 ± 1539
(3230–7470)
84.3 ± 1.6
(82.4–87.2)
388.8 ± 115.4
(250–600)
9568 ± 2850
(5265–19,104)
201.1 ± 45.4
(106–246)
15 (8)Mean ± SD
(Range)
28,390 ± 7950
(21,170–43,370)
5820 ± 1938
(4220–7850)
79.5 ± 2.8
(75.7–84.9)
573.8 ± 117.8
(380–740)
10,589 ± 2312
(6142–15,535)
249.0 ± 1.0
(226–250)
16 (8)Mean ± SD
(Range)
24,101 ± 6099
(15,990–30,410)
4186 ± 1055
(2790–6040)
82.5 ± 1.7
(80.1–85.9)
296.3 ± 38.1
(240–340)
8925 ± 893
(6185–10,057)
195.0 ± 10.2
(112–232)
17 (8)Mean ± SD
(Range)
27,746 ± 7712
(16,700–39,850)
4824 ± 1393
(3570–7310)
82.4 ± 2.7
(77.4–86.1)
440.0 ± 134.0
(300–630)
8662 ± 1918
(5122–13,196)
146.8 ± 62.4
(60–247)
18 (8)Mean ± SD
(Range)
27,746 ± 7712
(16,700–39,850)
4824 ± 1393
(3570–7310)
82.4 ± 2.7
(77.4–86.1)
440.0 ± 134.0
(300–630)
8662 ± 1918
(5122–13,196)
146.8 ± 62.4
(60–247)
n—Number of pasture samples; SD—Standard deviation; GM—Green matter; DM—Dry matter; PMC—Pasture moisture content; H—Height; CMR—Corrected measure reading, measured by Grassmaster II; HRPM—Compressed height, measured by rising plate meter (RPM).
Disclaimer/Publisher’s Note: The statements, opinions and data contained in all publications are solely those of the individual author(s) and contributor(s) and not of MDPI and/or the editor(s). MDPI and/or the editor(s) disclaim responsibility for any injury to people or property resulting from any ideas, methods, instructions or products referred to in the content.

