Article

The Spatiotemporal Differentiation Characteristics and Driving Forces of Carbon Emissions from Major Livestock Farming in the Shaanxi–Gansu–Ningxia Region

1
College of Economics and Management, Northwest A&F University, Yangling 712100, China
2
Center for Resource Economics and Environment Management, Northwest A&F University, Yangling 712100, China
*
Author to whom correspondence should be addressed.
Agriculture 2024, 14(10), 1748; https://doi.org/10.3390/agriculture14101748
Submission received: 25 August 2024 / Revised: 30 September 2024 / Accepted: 1 October 2024 / Published: 3 October 2024
(This article belongs to the Section Agricultural Economics, Policies and Rural Management)

Abstract

:
Given the background of ecological fragility in western China, the northward migration of the livestock industry, and the “carbon peak” in China, it is practically significant to discuss the evolution of carbon dioxide equivalent emission intensity (CEI) in major livestock (pigs, cattle and sheep) rearing in the Shaanxi–Gansu–Ningxia (SGN) region. This discussion aims to protect the ecology of western China, achieve sustainable and healthy development of the livestock industry, and realize the national goal of “double carbon”. In this study, we utilized statistical data from 2010 to 2021 for pigs, cattle, and sheep at the municipal level in the SGN region. We applied the methodology provided by the IPCC to comprehensively measure the carbon dioxide equivalent emissions (CEs), explore spatial and temporal trends, and analyze the driving forces behind spatial variations in the intensity with the assistance of GeoDetector. The following conclusions were drawn: Firstly, the total CEs generally exhibit fluctuating and increasing patterns. Moreover, the total CEs in different cities (states) within the region show obvious variations, with a tendency to shift toward the north. Secondly, the CEI demonstrates a clear downward trend. However, the CEI in different cities (states) exhibits increasing spatial heterogeneity. Furthermore, the western part of the region is evolving toward high-value areas, while the eastern part is evolving toward low-value areas. Lastly, the results of the GeoDetector indicate that the core driving factors are the pig, cattle, and sheep rearing structure; the urban population proportion; and the per capita gross national product. In summary, the total amount of CEs demonstrates a fluctuating increase, while the intensity shows a clear downward trend. Therefore, it is recommended to reduce CEs from livestock rearing in this region by optimizing the rearing structure of pigs, cattle, and sheep, promoting low-carbon consumption, and moderately importing livestock products.

1. Introduction

On 22 September 2020, at the 75th United Nations General Assembly, China declared its objective to attain carbon peaking by 2030 and achieve carbon neutrality by 2060. It is crucial to emphasize that CEs, particularly those from animal agriculture, constitute a significant contributor to global climate change, accounting for roughly 18% of total human-induced emissions [1]. China is a prominent player in the livestock industry, ranking among the top globally in terms of annual production [2]. With economic advancements and rising living standards, the demand for livestock products has surged significantly, fueling robust growth within the livestock industry. However, this growth has also resulted in some environmental problems. Over recent decades, human development has contributed to increasingly severe climate change and natural disasters. We need to increasingly recognize the importance of sustainable development and urgently find a balance between development and sustainability [3]. Since 2005, Comrade Xi Jinping has advocated for the concept of “green mountains are golden mountains”. The 2017 report of the 19th National Congress underscored the significance of fostering a harmonious relationship between humanity and nature. The report of the 20th National Congress pointed out that “China’s modernization is the modernization of harmonious coexistence between human beings and nature”. As a consequence, macro-level environmental policies have been enacted to tackle pollution, ecological degradation, and climate change. The northwestern region of China, with its arid climate, scarce precipitation, and fragile and sensitive ecological environment [4,5], poses challenges in achieving the “double carbon” goal strategy. In recent years, the livestock industry’s northward expansion [6] has bolstered CEs in the northern region. The impact of this on the development of the livestock industry and the ecological environment in the northern region has remained unexplored. Hence, investigating spatial–temporal CE characteristics from key livestock in the SGN region and their driving factors is crucial. This research aids “double-carbon” goals, advancing a low-carbon, high-quality livestock sector for harmonious human–nature coexistence.
Currently, extensive research exists on CEs from the animal husbandry industry by numerous scholars [7,8]. When measuring CEs from animal husbandry, some scholars have used methods such as IPCC [9,10] and I-O [11,12]. However, some scholars have also included the cultivation and processing of feed grains, as well as meat processing and transportation, in their measurement of CEs. The life cycle approach (LCA) has been employed to measure the CEs from the entire livestock industry chain [13,14,15]. Furthermore, other scholars have adopted the ecological footprint method to measure CEs [16]. Additionally, in terms of studying the driving forces behind CEs in the livestock industry, scholars have often used the LMDI model [17], the Tapio decoupling model [18], the IPAT model [19], and the STIRPAT model [20] to explore the mechanisms that influence CEs in this industry. Research in this area primarily centers on the equity of CEs in animal husbandry [21,22], trend prediction [23,24], green total factor productivity [25,26], spatial–temporal evolution [27,28], influencing factors [17,29], and the path to low-carbon advancement in animal husbandry [30]. Yao et al. employed LCA to quantify CEs in China’s animal husbandry across 31 provinces from 2000 to 2014, dissecting them into five key drivers via the LMDI approach, namely animal husbandry production efficiency, agricultural structural adjustment, improvement in the average agricultural productivity of agricultural labor, urbanization, and population growth, revealing their driving effects on animal husbandry CEs from a spatiotemporal perspective [31]. Zhang et al. examined the spatial variations and trends in CEs from China’s livestock sector from 1997 to 2017, leveraging the Theil index and nuclear density analysis [32]. Wu et al. utilized the IPCC coefficient method to assess CEs from China’s animal husbandry, including its 31 provinces (cities), spanning 2001–2020. They further analyzed temporal and spatial dynamics and evolution patterns using Moran’s I index, kernel density estimation, and spatial Markov chain [33].
By thoroughly reviewing the existing literature, we identified areas that still require research on CEs from China’s animal husbandry. Firstly, previous studies on CEs from animal husbandry have primarily relied on provincial statistical data. However, China has a large regional area, and the social, economic, and environmental conditions of each province are very different. Hence, intensified research in smaller geographies is imperative to tailor policies for optimal local development. Secondly, research on northwestern China remains scarce. The agricultural and animal husbandry production in this region is relatively backward, and the ecological environment is particularly vulnerable. Consequently, this study utilizes the IPCC coefficient method to measure CEs from pig, cattle, and sheep farming in 29 cities across the provinces of Shaanxi, Gansu, and Ningxia from 2010 to 2021. Through the application of the ArcGIS 10.8.2 spatial analysis tool, we reveal the spatiotemporal distribution patterns of these emissions, and we utilize GeoDetector to examine the underlying driving forces influencing the CEI. This study aims to provide valuable insights into the recent trends in CEs from pig, cattle, and sheep farming in the SGN region, thereby serving as a reference for CE reduction and sustainable livestock development.

2. Materials and Methods

2.1. Overview of the Study Area

The SGN region is situated in northwestern China, encompassing latitudes of 31°42′ to 42°57′ N and longitudes of 92°13′ to 111°15′ E (Figure 1). This region covers a total area of approximately 69.8 × 10⁴ km2. The topography of the SGN region is notably complex, as it primarily resides within the Loess Plateau, which is characterized by significant soil erosion and water loss. To the west, it adjoins the Qinghai–Tibet Plateau, while it borders the Inner Mongolia Plateau to the north and is flanked by the Qinling Mountains to the south. The geomorphology of the region exhibits considerable variation, transitioning gradually from mountainous woodlands in the south to grasslands and ultimately to deserts in the north. The climate is generally arid with little rainfall, mostly arid and semi-arid areas, with a fragile ecological environment and low land carrying capacity.

2.2. Data Source

Considering the years 2010–2021, data on the year-end stock of dairy cattle, non-dairy cattle, sheep, and pigs; the urban population ratio; the total rural population; and the output value of the animal husbandry industry were extracted. The total output value of agriculture, forestry, animal husbandry, and fishery, as well as the disposable income of urban and rural residents, the GDP of each city, and the GDP per capita of each city, were derived from the Shaanxi Statistical Yearbook, the Gansu Statistical Yearbook, and the Ningxia Statistical Yearbook, in addition to the municipal (state) statistical yearbooks from the recent years. Missing values were addressed using the method of mean value interpolation.

2.3. Research Methods

2.3.1. CEs and CEI Measurement Methods for Pig, Cattle, and Sheep Rearing

The IPCC coefficient method is a widely recognized approach for determining greenhouse gas emissions. It is endorsed in the IPCC guidelines for calculating greenhouse gas emissions and is applicable to relatively large-scale accounting levels, such as those of countries, provinces, and cities. This method computes greenhouse gas emissions by integrating information on the intensity of human activity (i.e., activity data, AD) with the emission coefficient derived from unit activity (i.e., emission factor, EF). This paper quantifies carbon equivalent emissions from gut fermentation and manure management in dairy cattle, non-dairy cattle, sheep, and pig farming, adhering to guidelines by China’s National Development and Reform Commission (2011), Shaanxi Development and Reform Commission (2019), and IPCC (2006) methodologies. The estimation of carbon equivalent emissions from the gastrointestinal fermentation and manure treatment in the aforementioned livestock species was performed using the following equations:
C T = C C H 4 + C N 2 O = Q i × α i × 25 + Q i × β i × 298
In Equation (1), CT is the carbon equivalent; CCH4 is the carbon equivalent of CH4 emitted from each type of livestock rearing; CN2O is the carbon equivalent of N2O emitted from each type of livestock rearing; Qi is the average annual rearing amount of the ith type of livestock; αi is the CH4 emission factor for the ith livestock type; βi is the N2O emission factor for the ith livestock type; and 25 and 298 are the conversion factors of CH4 and N2O to CO2 equivalents, respectively. The average annual rearing capacity of each type of livestock is expressed as the stock at the end of the year.
The CEI is the ratio of the carbon equivalent to its production value, using the following formula:
C I = C T P V
In Equation (2), CI is the carbon intensity; CT is the carbon equivalent; and PV is the production value of pigs, cattle, and sheep. Since the output values of pigs, cattle, and sheep are not listed separately in the statistical yearbook of each city, the output value of the livestock industry was used to replace the output values of pigs, cattle, and sheep.

2.3.2. Spatial Autocorrelation

Spatial autocorrelation was employed to analyze whether there was spatial dependence between the data, i.e., whether there were similar values in spatially adjacent regions. This is typically assessed using Moran’s index I (Morans’I). Morans’I ranges between −1 and 1 and is under a given significance level. If Morans’I is close to 0, it indicates that the spatial distribution of the data is random. If Morans’I is closer to −1, it suggests a stronger negative spatial autocorrelation. If Morans’I is closer to 1, it suggests a stronger positive spatial autocorrelation. In this paper, we borrowed the formula of Morans’I from Niu et al. [34].
I = i = 1 n j = 1 n W i j Y i Y ¯ Y j Y ¯ S 2 i = 1 n i = 1 n W i j
In Equation (3), I represents the Moran index; n denotes the number of study areas; Y i and Y j are the observed values of area i and area j, respectively; Y ¯ is the mean of the observed values; S2 is the variance of the observed values; and Wij is the spatial weighting matrix.

2.3.3. GeoDetector

GeoDetector is a statistical method proposed by Wang and Xu [35] to detect spatial variability and reveal the driving force. It includes factor detection, ecological detection, interaction detection, and risk detection. This method has been widely applied in various fields such as land use [36], regional economy [37], ecology [38], environment [39], and so on. In this study, we primarily focused on factor detection, ecological detection, and interaction detection within GeoDetector.
Factor detection is used to analyze the extent to which the driver explains the spatial heterogeneity of the dependent variable, which is expressed as follows:
q = 1 h = 1 L N h σ h 2 N σ 2 = 1 S S W S S T , S S W = h = 1 L N h σ h 2 , S S T = N σ 2
In Equation (4), q denotes the extent to which the spatial heterogeneity of the dependent variable Y is influenced by the driving factor X, and the value range is [0,1]; L refers to the stratification of the independent variable X or the dependent variable Y; Nh and N indicate the number of cells in stratum h and the entire region, respectively; σh2 and σ2 represent the variance of the independent variables in stratum h and the entire region, respectively; and SSW and SST denote the sum of the variances within the stratum and the total variance in the entire region, respectively.
Ecological probing is mainly employed to assess whether there exists a significant difference between the effects of any two drivers X on the spatial distribution of the dependent variable Y, a comparison quantified by the F statistic, which is expressed as follows:
F = N X 1 N X 2 1 S S W X 1 N X 2 N X 1 1 S S W X 2 , S S W X 1 = h = 1 L 1 N h σ h 2 , S S W X 2 = h = 1 L 2 N h σ h 2
In Equation (5), NX1 and NX2 denote the sample sizes of the two factors X1 and X2, respectively; SSWX1 and SSWX2 denote the sum of the intra-stratum variances of the strata formed by X1 and X2, respectively; and L1 and L2 denote the number of strata of factors X1 and X2, respectively. The null hypothesis H0 is SSWX1 = SSWX2. If H0 is rejected at a significant level of α, this indicates that there is a significant difference between the effects of the two factors X1 and X2 on the spatial distribution of attribute Y.
Interaction detection is used to assess the interaction between factors X, i.e., whether factors X1 and X2, when acting together, enhance or reduce explanatory power for the dependent variable Y, or whether the factors affect the dependent variable Y independently. The method of evaluation is to calculate the q values of two factors X1 and X2 on Y, namely q (X1) and q (X2), and calculate the q values of the interaction between the two factors, i.e., q (X1 ⋂ X2), and compare q (X1), q (X2), and q (X1 ⋂ X2), so as to determine the interaction (nonlinear weakening, one-factor nonlinear weakening, two-factor enhancement, independent and nonlinear enhancement).

3. Results

3.1. Spatial–Temporal Evolution of CEs from Pig, Cattle, and Sheep Rearing in the SGN Region

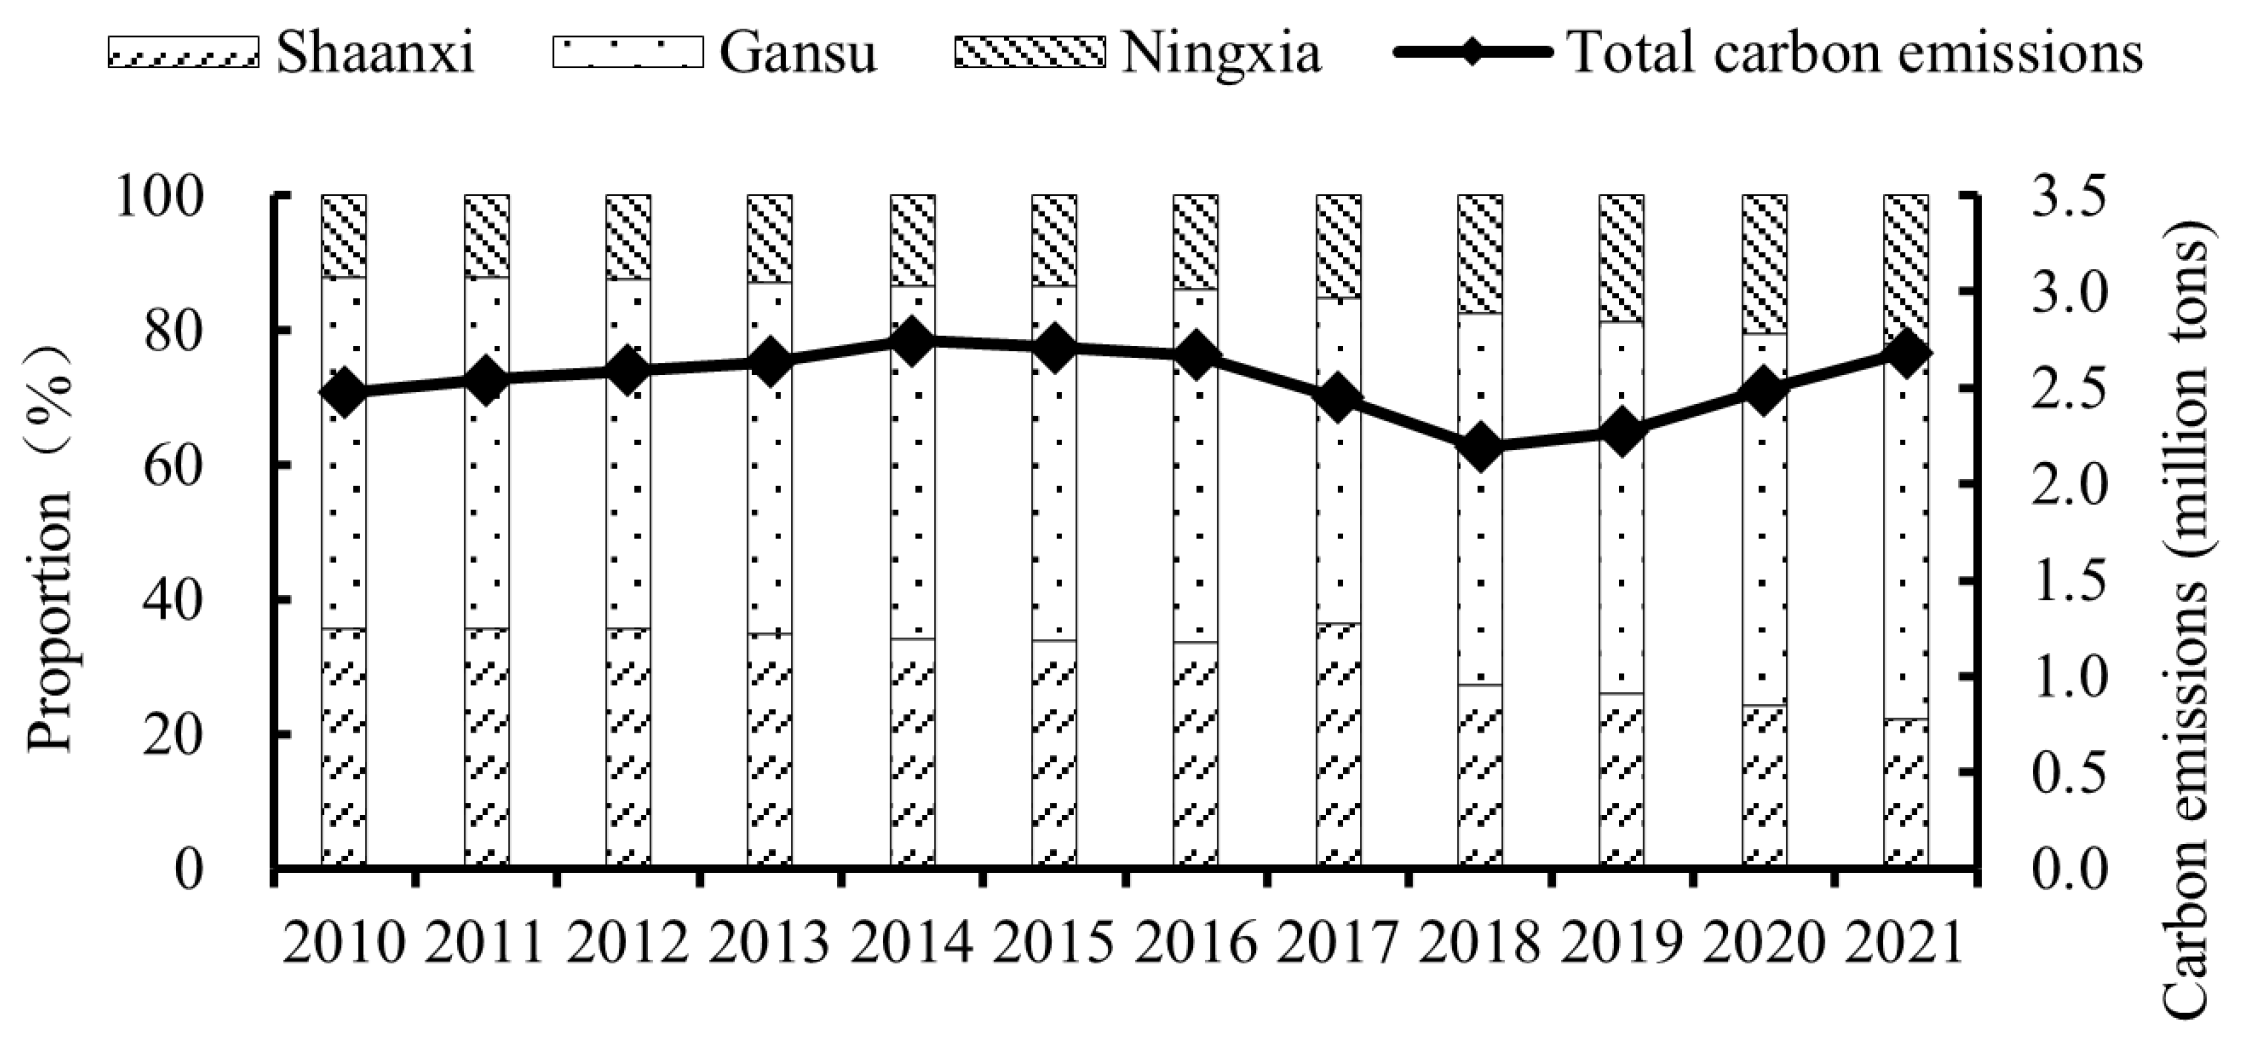
3.1.1. Temporal Evolution of CEs from Pig, Cattle, and Sheep Rearing in SGN Region

From the viewpoint of time, as can be seen in Figure 2, in general, the CEs from pig, cattle, and sheep rearing in the SGN region show a slow upward trend. The total CEs were 26.8085 million tons in 2021, which is a slight increase compared with 24.7483 million tons in 2010, with an annual growth rate of merely 0.7%. Specifically, it was found that the overall trend of total CEs can be divided into three stages: rising, then falling, and then rising. The first stage was from 2010 to 2014, showing a rapid upward trend, from 24.7483 million tons in 2010 to a maximum of 27.4414 million tons in 2014, or 10.88%, with an average annual growth rate of 2.62%; in the second stage spanning 2014–2018, the highest value was observed in 2014, followed by a rapid decline to 21.9125 million tons in 2018, down as much as 20.15%, an average annual decline of 5.47%. In the third stage from 2018 to 2021, from the lowest point in 2018 to 26.885 million tons in 2021, the growth rate was as high as 22.34%, and the average annual growth rate was as high as 6.95%. From the viewpoint of the CEs of each province, Shaanxi reached the highest point of 9.3609 million tons in 2014 and then declined year by year until 2018 and stabilized at 6 million tons in the following years. The proportion of the three provinces decreased from 35.62% in 2010 to 22.30% in 2021. The Gansu change trend was most similar to the change trend of the SGN region, with a peak of 14.4008 million tons in 2014 and a minimum of 11.8793 million tons in 2017. The proportion of CEs in Gansu after 2017 was more than 50%, and after 2018, it became more stable at around 55%. In Ningxia, both the total CEs and the proportion of CEs show a linear upward trend, with CEs increasing from 3,009,800 tons in 2010 to 5,896,000 tons, almost doubling, with an average annual growth of 6.3%, and the proportion of CEs also increasing from 12.16% in 2010 to 21.99% in 2021. From the viewpoint of CEs in each city, Gannan, Yulin, Wuwei, and Zhangye were in the top positions, and the ratio of these four cities was more than 30% of the total amount of CEs in the SGN region. The total CEs of Xi’an, Tongchuan, Baoji, Xianyang, Weinan, Hanzhong, Ankang, Shangluo, Yan’an, Tianshui, Pingliang, Longnan, and Gannan exhibited a distinct pattern characterized by an initial increase followed by a subsequent decline, with all cities reaching their peak values around 2014 before entering a phase of decrease. In contrast, the cities of Yulin, Lanzhou, Jiayuguan, Jinchang, Baiyin, Wuwei, Zhangye, Jiuquan, Qingyang, Dingxi, Linxia, Yinchuan, Shizuishan, Wuzhong, Guyuan, and Zhongwei displayed a fluctuating upward trend in their total CEs. This analysis reveals significant variations in the total CEs among different cities across various regions, indicating a decreasing trend regarding the total CEs in southern cities and increasing total CEs in northern cities. The disparity in regional emissions is increasingly pronounced.

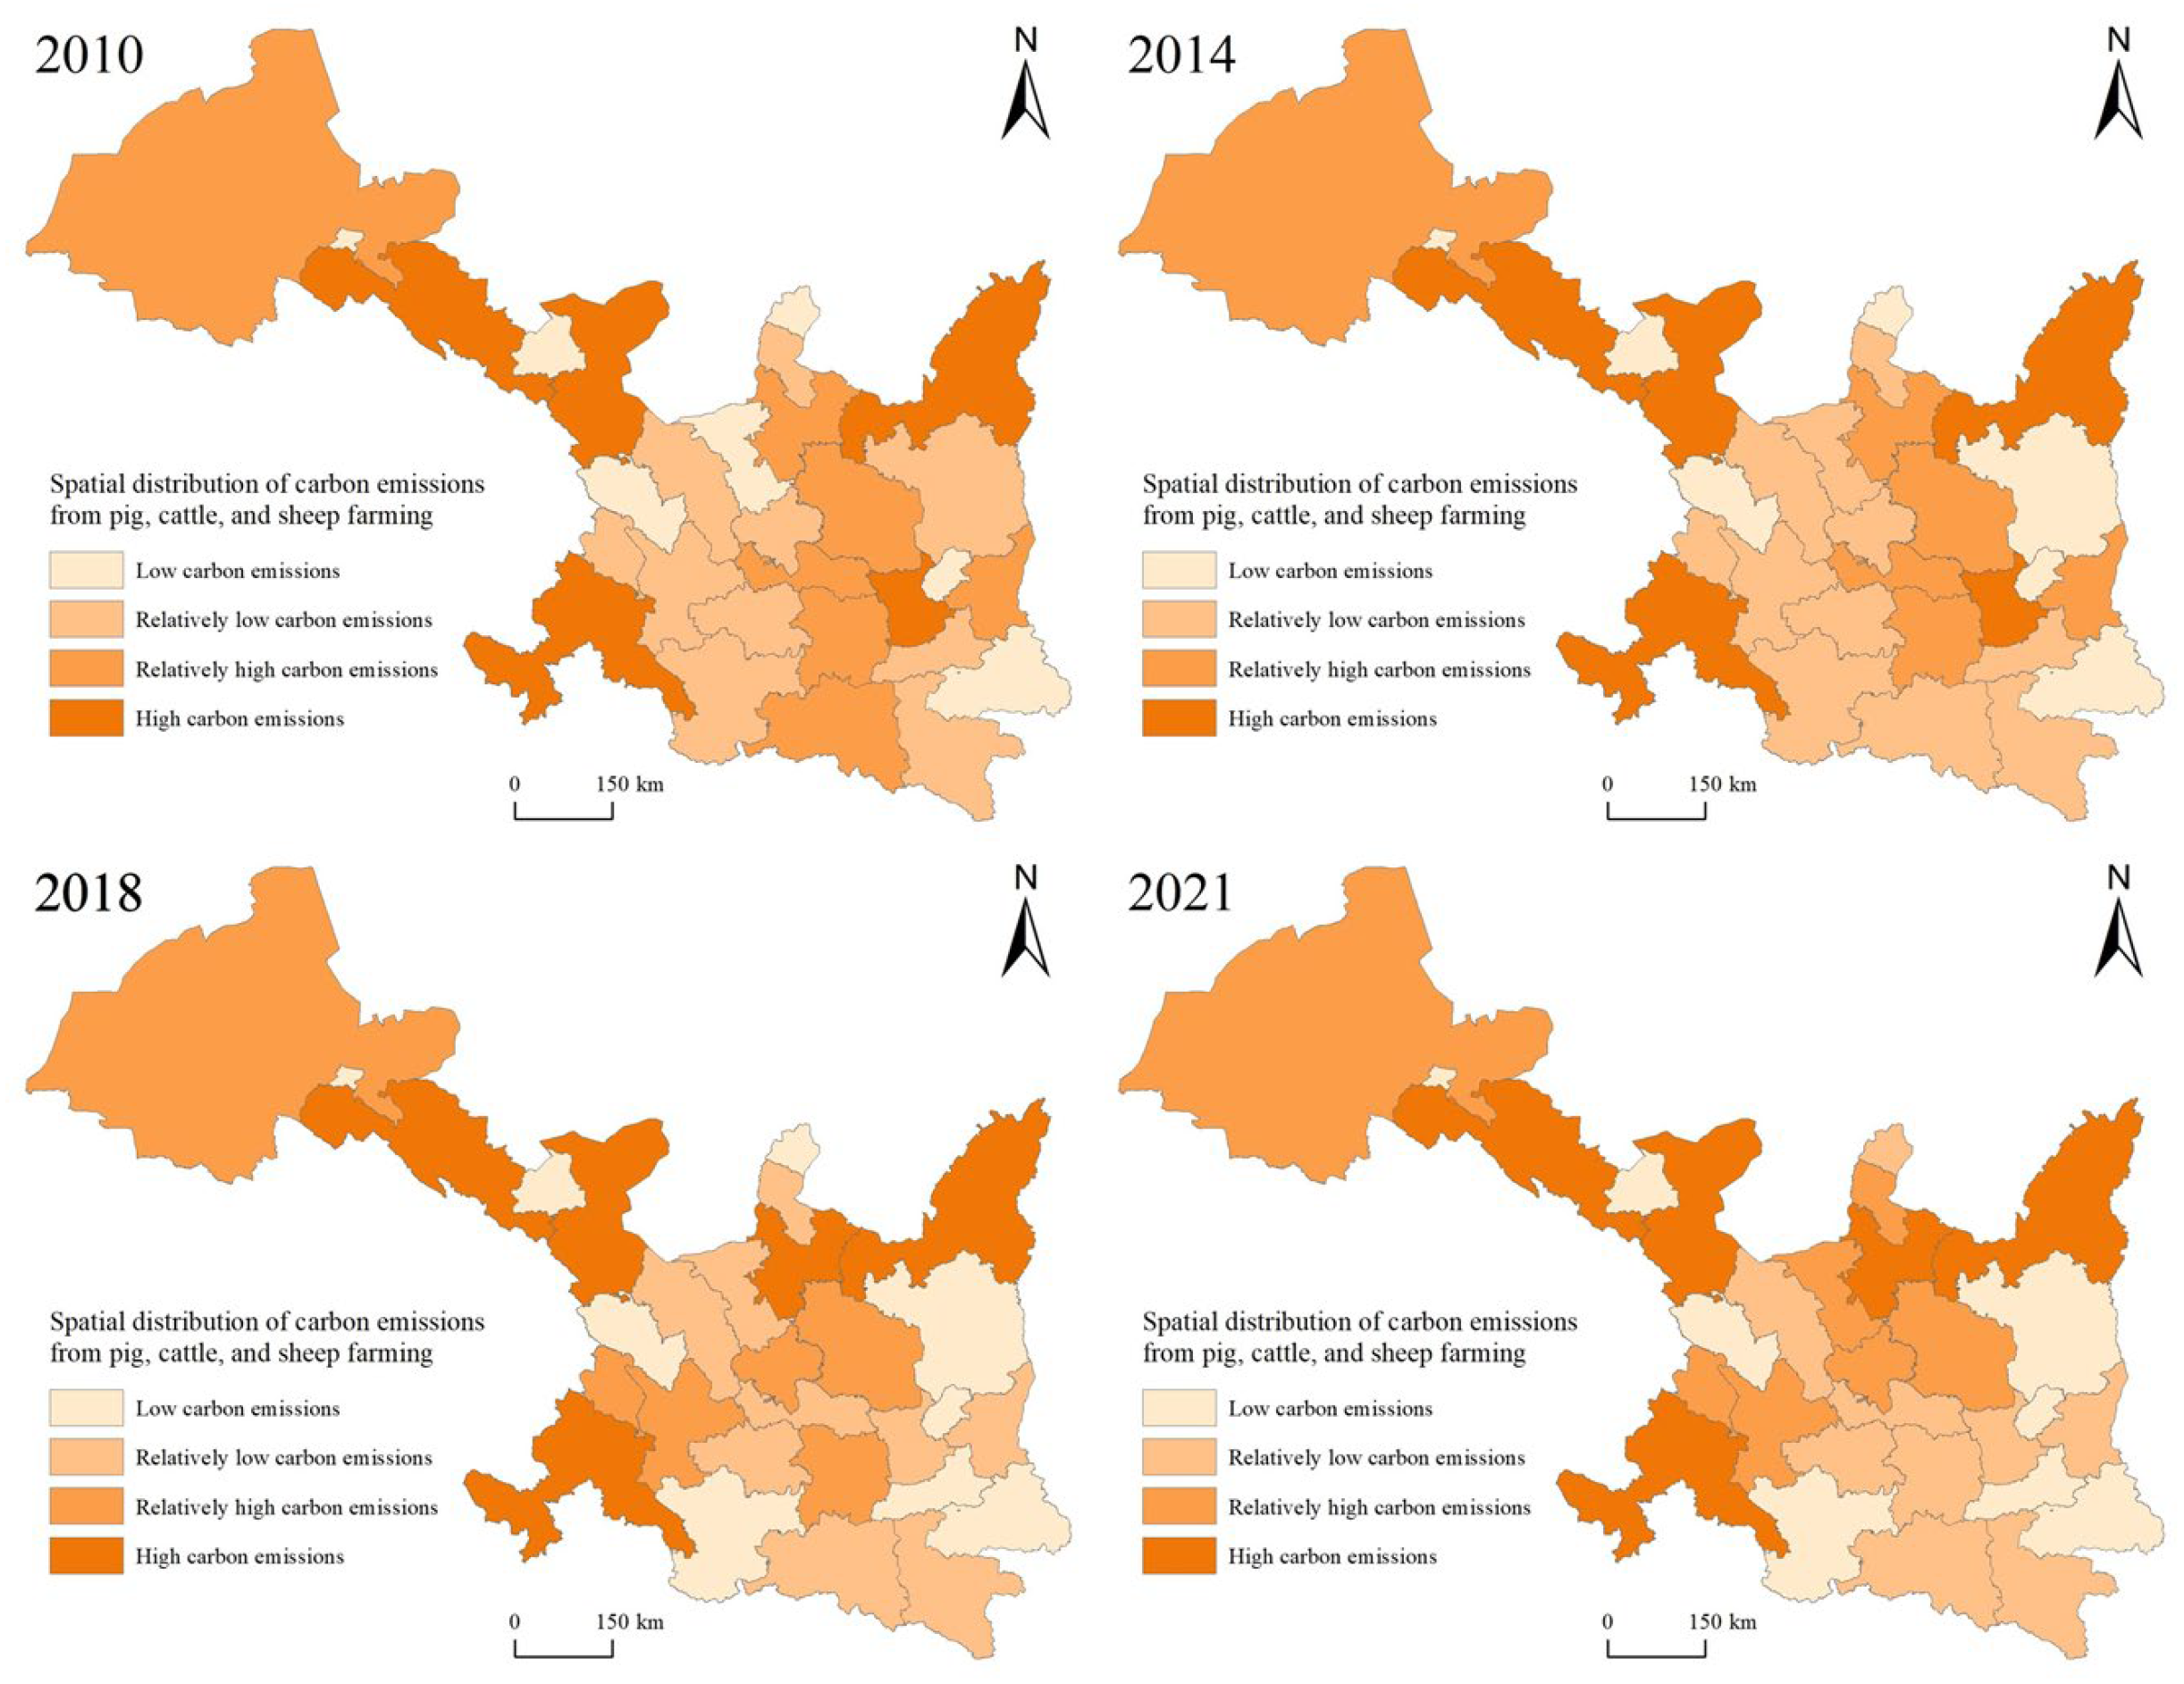
3.1.2. Trends in Spatial Evolution of CEs from Pig, Cattle, and Sheep Rearing in the SGN Region

From a spatial perspective, we selected and visualized the CEs from pig, cattle, and sheep rearing in 29 cities (states) within the SGN region for the years 2010, 2014, 2018, and 2021. The objective was to analyze the changes in the spatiotemporal distribution of CEs within this region. To ensure the standardization and comparability of CE data across different temporal scales, we adopted the methodology utilized by Yao et al. [31]. We categorized the CE values for each city (state) into four distinct categories: The cut-off points were 0.5 times, 1.0 times, and 1.5 times the average CEs. Based on these categories, each city (state) was further subdivided into four types of areas: low-CE area (<0.5 times), lower-CE area (0.5–1.0 times), higher-CE area (1.0–1.5 times), and high-CE area (>1.5 times). The results of this analysis are illustrated in Figure 3.
As illustrated in Figure 3, the spatial distribution of high- and low-CE zones remains generally stable, while the spatial distribution of higher- and lower-CE zones demonstrates a trend of dynamic evolution. This evolution is typically characterized by a triangular distribution of high values, a sporadic distribution of low values, and the concentration and contiguity of both higher and lower zones. Additionally, there is a tendency for these zones to shift toward the north. Yulin, Wuwei, Zhangye, and Gannan can be consistently classified as high-CE zones, while Tongchuan, Shangluo, Lanzhou, Jiayuguan, and Jinchang can be consistently classified as low-CE zones. Wuzhong will gradually evolve into a high-CE zone, and Xi’an, Yan’an, and Longnan will gradually evolve into low-CE zones. Collectively, Shaanxi is undergoing a transformation from a high-CE area to a low-CE area, whereas Ningxia as a whole is evolving from a low-CE area to a high-CE area.

3.2. Trends in the Spatial–Temporal Evolution of the CEI in the SGN Region

3.2.1. Temporal Evolution of the CEI in the SGN Region

From the perspective of time, it can be seen from Figure 4 that, in general, the CEI in the SGN region shows a significant downward trend, from 3.45 tons/CNY 10,000 in 2010 to 1.48 tons/CNY 10,000 in 2021. Specifically, the downward trend can be divided into three stages, with the first stage in 2010–2013 showing a rapid downward trend, the second stage in 2014–2017 showing a slow downward trend, and the third stage in 2018–2021 showing a rapid downward trend. The trend line of the CEI in Gansu and Ningxia always stays above the trend line of the CEI in the SGN region, which indicates that the CEI values of Gansu and Ningxia are always larger than that of the SGN region. From the perspective of the SGN region, the CEI in Gansu is much higher than that of Ningxia, Shaanxi, and the SGN region, almost twice as much as that of the region and four times as that of Shaanxi, but its decreasing trend is also more obvious, from 6.88 tons/CNY 10,000 in 2010 to 2.44 tons/CNY 10,000 in 2021, with a drop of up to 64.52% and an average annual drop of 8.99%. The CEI in Shaanxi is always below the regional CEI and is only half of the regional CEI, which shows that the development in Shaanxi is better, and its decline is also the largest, with a decline of as high as 66.77%, and an average annual decline of 9.53%. The CEI in Ningxia is slightly higher than that of the regional CEI, and the decline is the smallest, 42.67%, with an average annual decline of 4.93%. From the viewpoint of each city (state), as shown in Table 1, among the 29 cities (states) in the SGN region, there are 18 cities (states) in which the decrease in the CEI is larger than the decrease in the CEI of the whole SGN region.

3.2.2. Spatial Evolution Trend of the CEI in the SGN Region

From the spatial perspective, we selected and spatially visualized the CEI data in 29 cities (states) in the SGN region for the years 2010, 2014, 2018, and 2021 to analyze the process of changes in the spatial–temporal distribution of the CEI. To ensure the standardization and comparability of the CEI data in different cities (states) in different time scales, 0.5 times, 1.0 times, and 1.5 times the average value of the CEI in each city (state) were taken as the cut-off points. The CEI was divided into four regions: low-CEI region (<0.5 times), lower-CEI region (0.5–1.0 times), higher-CEI region (1.0–1.5 times) and high-CEI region (>1.5 times). The results are summarized in Figure 5.
As illustrated in Figure 5, the spatial distribution of low-CEI zones is basically stable, and the spatial distribution of lower-, higher-, and high-CEI zones shows a trend of dynamic evolution. Concisely, CEI distribution exhibits a west–high, east–low spatial pattern. Most of the eastern regions are always in the low-CEI zone, trending downward, whereas the western regions are all in the lower-CEI zone and above, with an upward trend. From 2010 to 2021, Xi’an, Baoji, Xianyang, Weinan, Hanzhong, Shangluo, and Yan’an were always in the low-CEI zone; Yulin and Yinchuan were always in the lower-CEI zone; Wuwei, Zhangye, and Jiuquan were always in the higher-CEI zone; and Linxia and Gannan were always in the high-CEI zone.

3.3. Spatial Autocorrelation Analysis Based on the Moran Index I

To confirm the spatial distribution of the CEI from pig, cattle, and sheep rearing in the SGN region, ArcGIS was used to analyze the spatial autocorrelation of the CEI in 29 cities, and the results are shown in Table 2. The results show that the I value of Moran’s index reflecting the carbon intensity of the SGN region increased from 0.280 in 2010 to 0.622 in 2021, and the Z value increased from 2.582 in 2010 to 4.528 in 2021, both of which passed the 1% significance level test, and both the I and Z values showed an increasing trend year by year, which confirmed that the distribution of the CEI of the cities showed significant positive spatial correlation, and the positive spatial correlation became stronger and stronger.

3.4. Analysis of the Driving Forces of the CEI in the SGN Region

3.4.1. Driving Force Indicators

Through the above analysis, it is evident that there is significant spatial variability in the distribution of the CEI in the SGN region. However, the factors influencing this spatial variability are not yet clear. Therefore, we employed GeoDetector to investigate the mechanism behind the CEI and identify the driving forces. Taking into account various factors and adhering to the scientific nature of the indicators, as well as the availability and comparability of data, we constructed a driving force indicator system by selecting indicators from population, industrial structure, and economic development (Table 3). Among them, population is the fundamental factor that affects the development of animal husbandry. Therefore, the urban population proportion (X1) and rural population number (X2) were selected as population indicators. The industrial structure exerts a notable impact on sectoral development. Hence, we chose the ratio of the gross output value of animal husbandry to the gross output value of agriculture, forestry, animal husbandry, and fishery as an indicator for the agricultural industry structure (X3). Furthermore, the ratio of CEs from cattle and sheep to the total CEs from cattle, sheep, and pigs was selected as the driving force for the industrial structure (X4). Lastly, the economic development level is pivotal to animal husbandry’s growth. To measure this, the gross national product (X5), the per capita gross national product (X6), the disposable income of urban residents (X7), and the disposable income of rural residents (X8) were chosen as driving forces for the economic aspect in this paper.

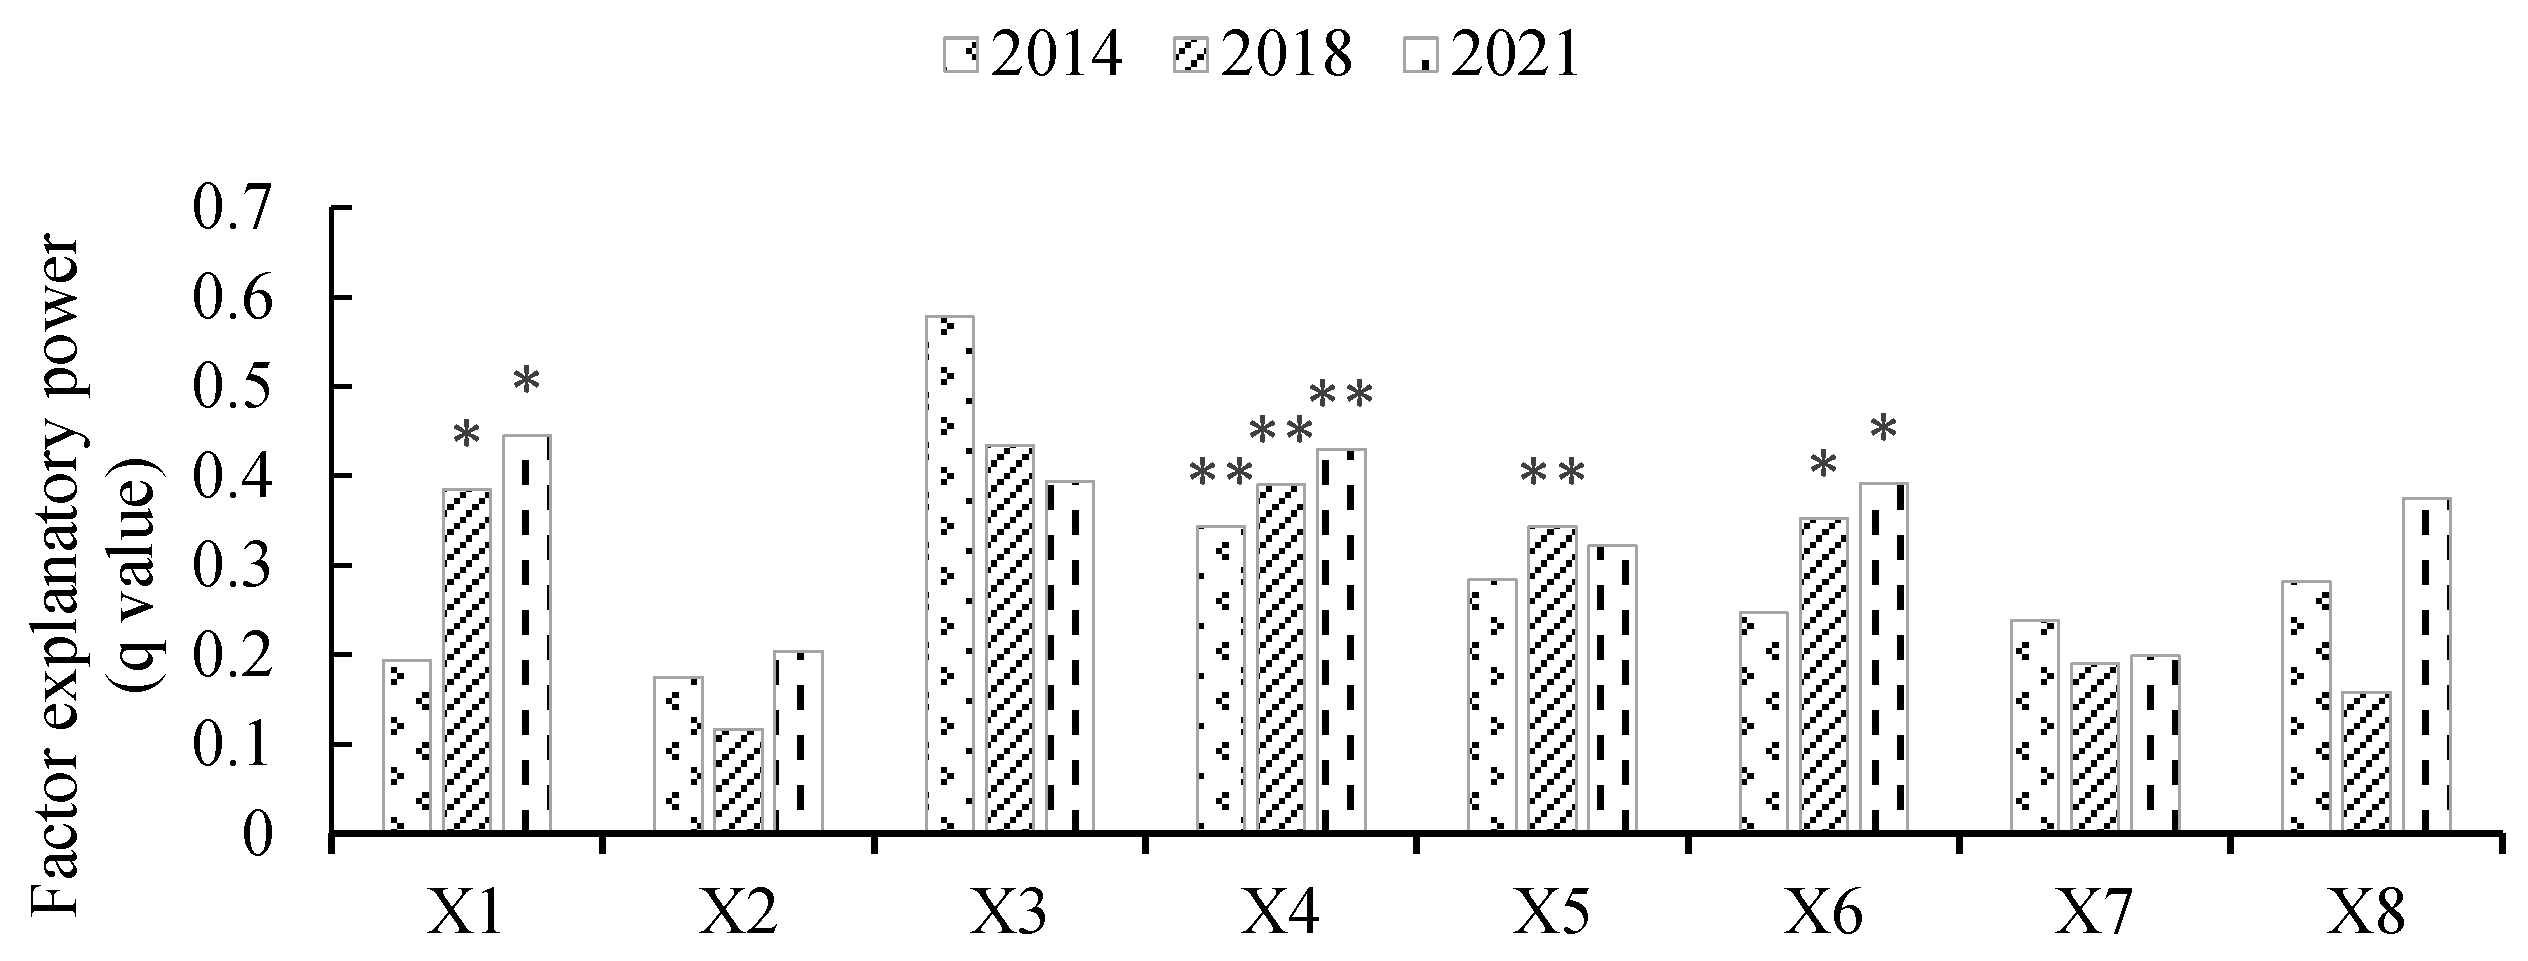
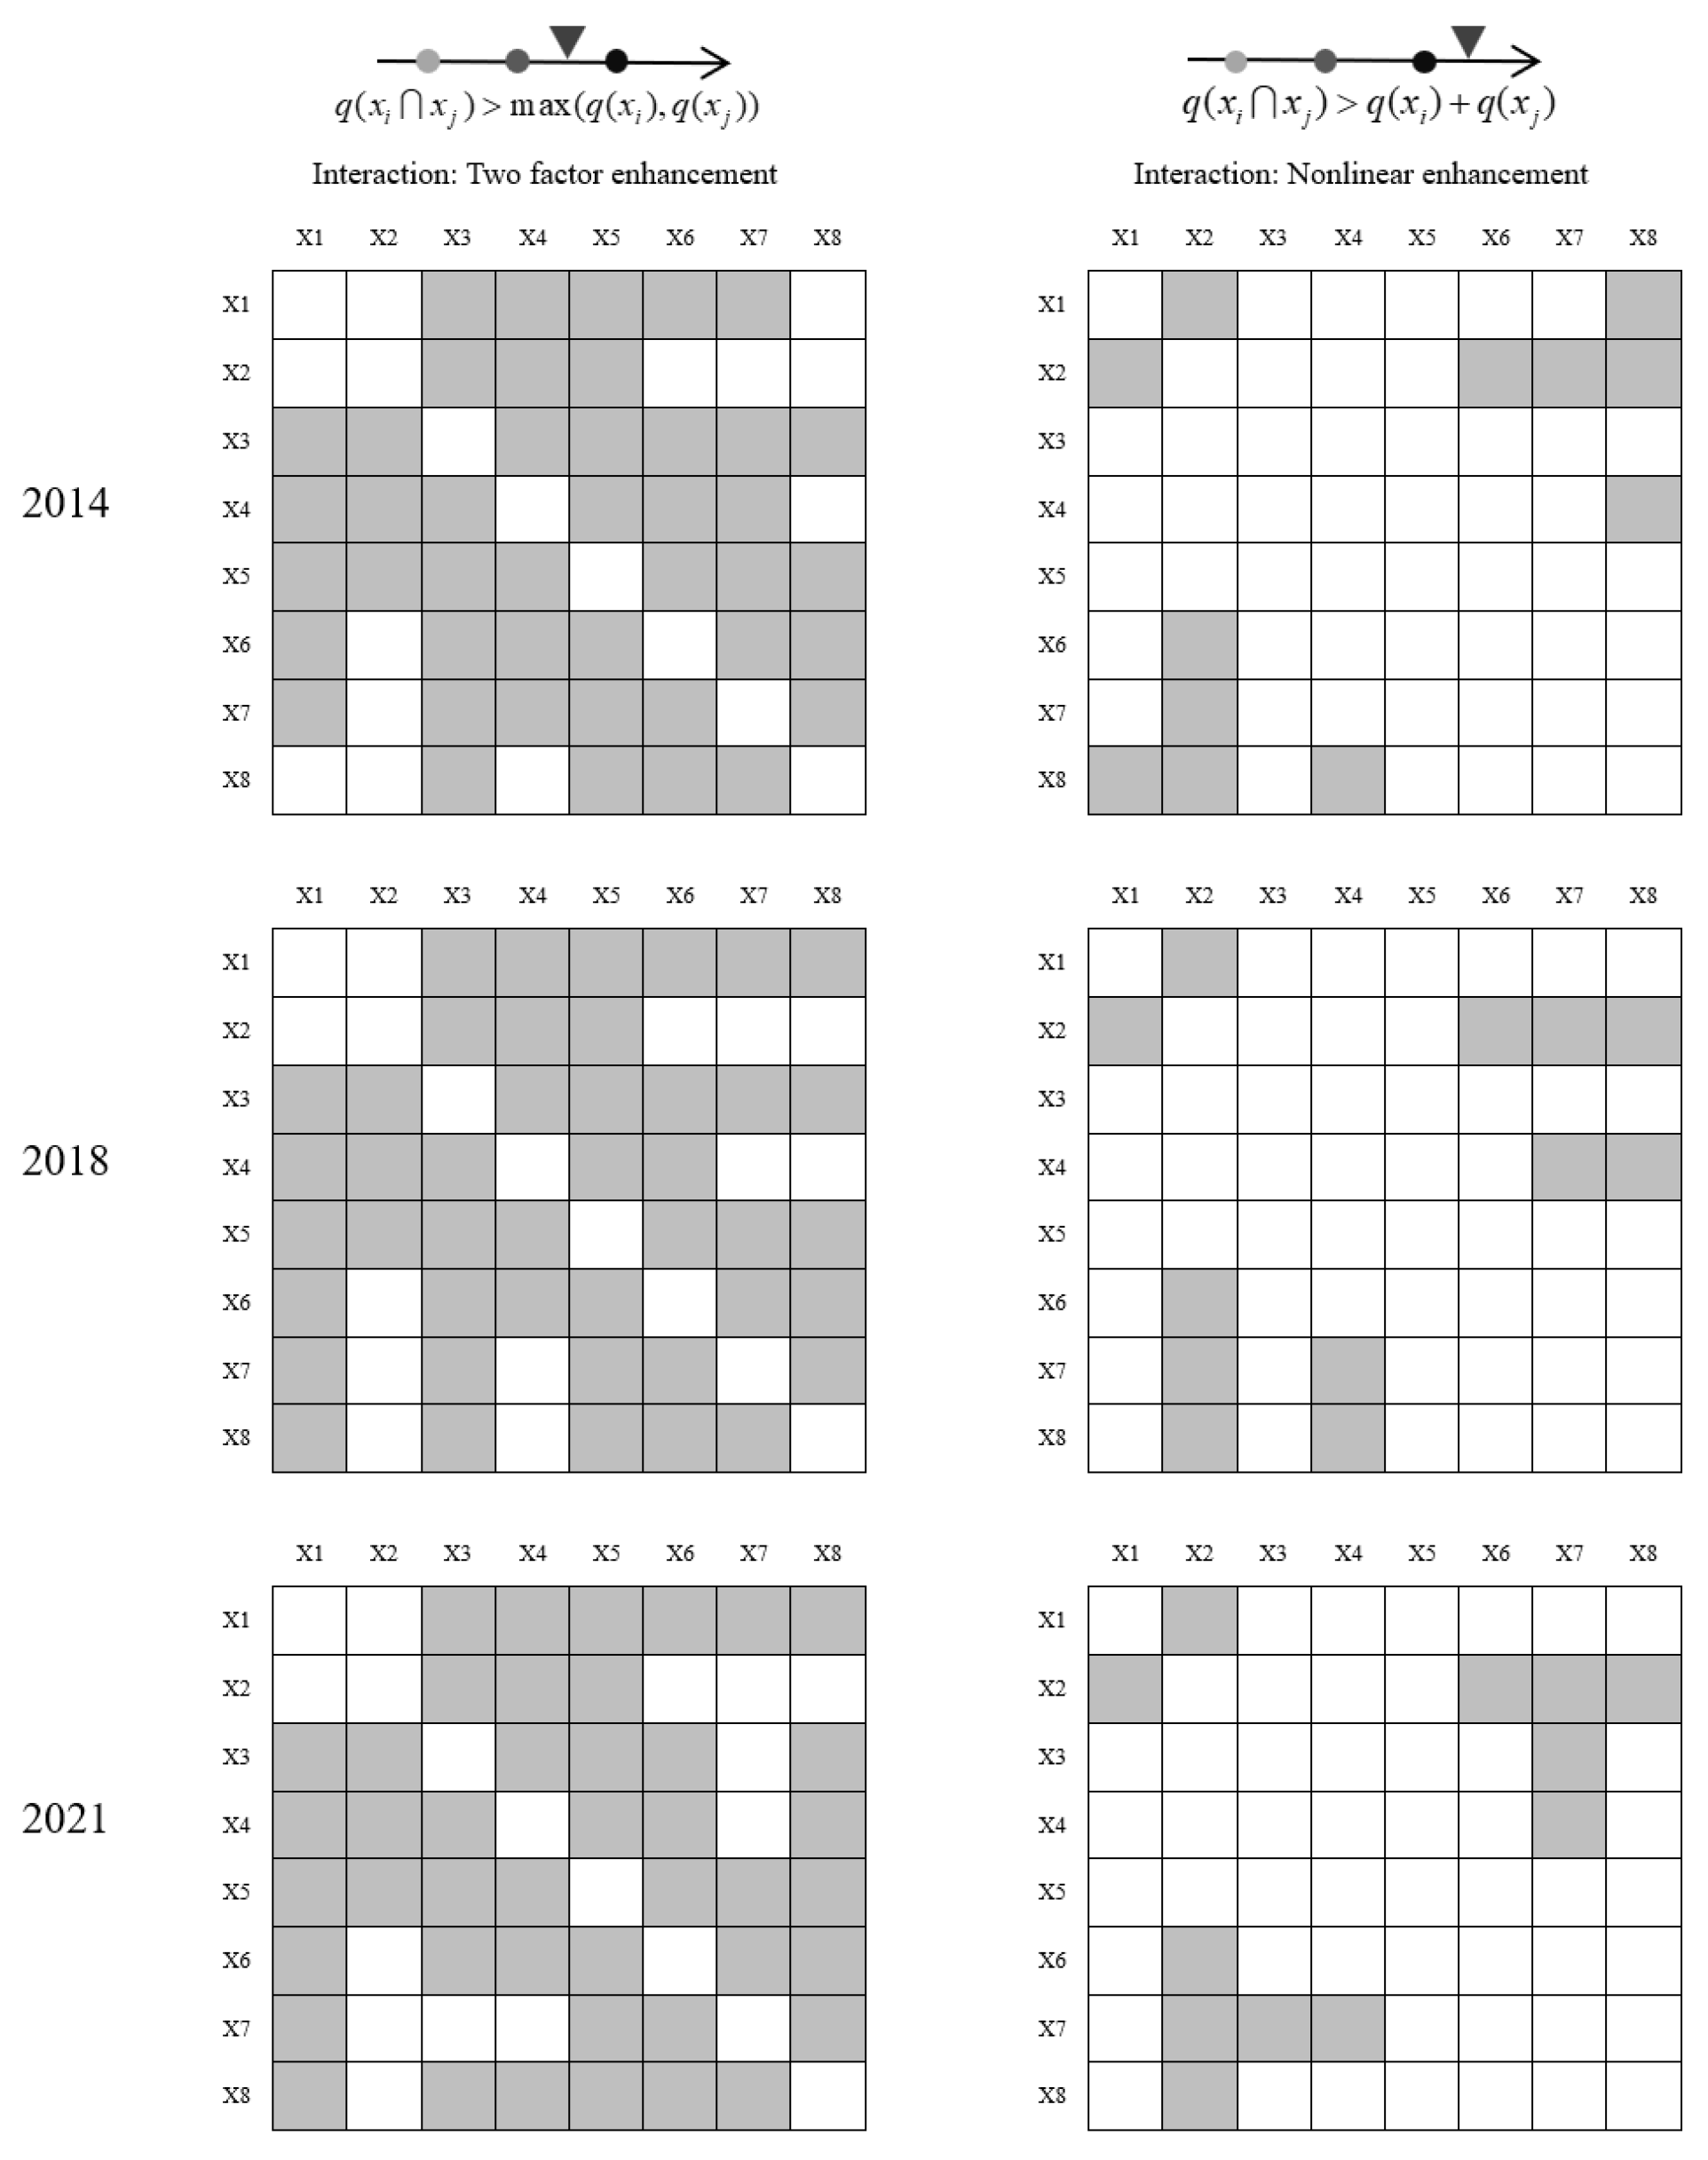
3.4.2. Analysis of the Results of the GeoDetector Measurements

Prior to conducting the GeoDetector analysis, it is essential to discretize each driver. In this study, the K-mean clustering method of SPSS 27 was utilized to categorize the drivers into five levels. The eight discretized drivers were then employed as detectors for GeoDetector analysis to assess their impact on the spatial heterogeneity of the CEI in the SGN region. The analysis of CEs from pig, cattle, and sheep rearing in the region revealed that the peak occurred in 2014, followed by a trough in 2018. This study, leveraging GeoDetector, investigated the trends in 2014, 2018, and 2021, offering a comprehensive comparison and analysis of the evolving roles of driving factors annually.
As shown in Figure 6, the effects of X1, X4, and X6 on the CEI in the SGN region in 2021 are significant. However, in terms of the magnitude of the q value, the effect of the spatial heterogeneity of each driver on the CEI is explained by the following factors: X1, X4, X3, X6, X8, X5, X2, and X7. Among these factors, X1, X4, and X6 were the core drivers. In 2018, the effects of X1, X4, X5 and X6 were significant. However, in terms of the size of the q value, the effect of each driving factor on the CEI was as follows: X3, X4, X1, X6, X5, X7, X8, and X2. In 2014, only X4 had a significant effect. However, in terms of the size of the q value, the effects of each driving factor on the CEI were X3, X4, X5, X8, X6, X7, X1, and X2.
Figure 6 depicts the explanatory power trend of the driving factors of CEI spatial heterogeneity. The explanatory power of X1, X4, and X6 gradually increased, and the explanatory power of these three factors should be emphasized in the course of reducing the CEI. Attention should also be given to the explanatory power of X2, X5, and X8 in relation to the spatial differentiation of the CEI. The explanatory power of X3 and X7 in relation to the spatial variability of the CEI decreased, so less attention can be given to these two factors.
As shown in Table 4, in 2014, there was a notable difference in the spatial distribution of the CEI between X3, X1, and X2. There was no notable difference in the spatial distribution of the CEI between the driving factors in 2021 and 2018.
The results of the interaction detection are presented in Figure 7. The explanatory power of the interactions among various driving factors primarily focuses on two key forms, namely two-factor enhancement and nonlinear enhancement, with the former being more prevalent. Thus, the spatial heterogeneity of the CEI in the SGN region stems from the combined influence of multiple driving factors.
In the interaction analysis of the driving factors for the year 2021, the explanatory power of the interaction between factors X2 and X7 with other driving factors was significantly greater than the sum of the individual contributions of these two factors, indicating a nonlinear enhancement effect. The combination of X2, X7, and other contributing factors resulted in a more pronounced impact on the CEI. Similarly, the analysis for 2018 revealed that the explanatory power of the interaction between factors X2 and X4 with other driving factors was also significantly larger than the sum of the individual factors, reflecting a nonlinear enhancement effect. Furthermore, the interaction results for 2014 indicated that the explanatory power of the interaction between factors X2 and X8 with other driving factors was substantially greater than the sum of the two individual factors, again demonstrating a nonlinear enhancement effect. When X2, X8, and other factors were combined together, they had a stronger effect on the CEI.

4. Discussion

4.1. Research on CEs and Carbon Intensity

According to the fourth national communication of China on climate change, the CEs from animal husbandry reach 377 million tons, accounting for 45.7% of the CEs from agricultural production. This represents an increase compared to the three previous communications, indicating the need for continued emphasis on reducing CEs from animal husbandry. In our study, we observed a gradual increase in CEs from pig, cattle, and sheep farming in the SGN region. The total CEs in this region we found to reach 26.8085 million tons in 2021, which is slightly higher than the 24.7483 million tons recorded in 2010, boasting a 0.7% annual growth rate. In national studies on CEs from animal husbandry, some studies have found that the total CEs show a slowly decreasing trend [10,40], and some studies have pointed out that the CEs from animal husbandry in the eastern and central regions of China show a decreasing trend, while the CEs from animal husbandry in the western region exhibit a rising trend [41]. This may stem from the 2017 central government’s No. 1 document advocating pig production stabilization, optimizing pig farming layouts in southern water networks, and redirecting capacity to eco-friendly zones and corn-producing hubs. Driven by environmental protection policies and comparative advantages, hog farming is increasing in the northern region. In terms of spatial changes, the livestock industry in the cities (states) within the SGN region also tends to move northward, with an increase in spatial correlation and distribution of high–high agglomeration and low–low agglomeration, as well as an increase in CEs from the livestock industry of all provinces at the national level [10]. In this study, the overall trend of the total CEs in the SGN region from 2010 to 2021 can be categorized into three phases, namely an increase, followed by a decrease, and then an increase, which is similar to the conclusion of Peng [42]. In terms of the CEI, relevant studies indicate that the national CEI shows an “M”-curve decline [43], whereas the findings of this study indicate an inverted “S”-curve decline. Although the shapes of the decreasing curves are different, they are all decreasing. The spatial intensity of CEs in the SGN region was high in the west and low in the east, with the high- and higher-CE zones shifting from the east to the west and gradually converging to the southwest, which is similar to that found in a previous study [44].
However, there are fewer studies on the CEI of animal husbandry. In this paper, the study on the driving forces of the CEI of animal husbandry reveals that the influence of urban population proportion; pig, cattle, and sheep rearing structure; and per capita gross national product on the CEI of animal husbandry in the SGN region has been increasing and occupy a dominant position. Relevant studies have found that urban population proportion has an inhibiting effect on the CEs from the livestock industry [45], and pig, cattle, and sheep rearing structure [41] and per capita gross national product [9] have a contributing effect on the CEs from the livestock industry. The effects of rural population, the gross national product, and the disposable income of rural residents on the CEI of animal husbandry in the SGN region show a “U”-shaped fluctuating upward trend, while the effects of agricultural industry structure and disposable income of urban residents on the CEI of animal husbandry gradually decline. Although these five driving factors were statistically insignificant or occasionally significant in one year, their importance should not be ignored.

4.2. Focus of Future Policy

First, the feeding structure should be optimized. Considering the CEs from animal husbandry, the CEs from gastrointestinal fermentation in livestock are dozens of times higher than that from non-gastrointestinal fermentation, so in the process of animal husbandry development, firstly, we should optimize the breeding structure of livestock and increase the number of livestock breeds with non-gastrointestinal fermentation. Secondly, we should increase the investment in science and technology to research and develop new livestock breeds subjected to low gastrointestinal fermentation with corresponding low-carbon feed and gas treatment technology. Through technological progress, true sustainable development can be achieved [46] so as to promote the green and low-carbon transformation of China’s animal husbandry.
Secondly, we advocate low-carbon consumption by urban and rural residents. As economic development and urbanization intensify, the per capita gross national product and the urban population proportion are rising rapidly, the consumption structure of livestock products of urban and rural residents is changing, with the proportion of the consumption of pig products decreasing and the proportion of the consumption of cattle and sheep products increasing, so the livestock industry develops in the direction of high CEs. Therefore, urban and rural residents should be guided to raise their awareness of green and low-carbon consumption and change their dietary concepts.
Thirdly, livestock such as pigs, cattle, and sheep should be imported moderately. China’s residents’ demand for livestock consumption is increasing, but compared with the developed countries in the West, China’s livestock industry is relatively backward in terms of the development level, and the CEI of the livestock production process is relatively high. Therefore, the government should timely macro-control the diversity of livestock supply and appropriately increase the importation of livestock products from countries with low CEI in order to satisfy the consumption demand of the domestic residents and thus reduce the CEs from the domestic animal husbandry industry.

4.3. Research Deficiencies and Prospects

From a municipal perspective, this study explored the spatial and temporal characteristics of CEs and their driving forces of major livestock rearing in the SGN region from 2010 to 2021. The conclusions obtained not only enrich research on CEs from the livestock industry but also provide a reference for the sustainable development policy of the livestock industry in the ecologically fragile regions in the West. Compared with previous studies, this study contributes to the field in the following two aspects: Firstly, the use of municipal statistics is more accurate than provincial statistics. It can better show the intra-regional differences and influence mechanisms. Secondly, the ecological environment in the western region is fragile, and the northward migration of animal husbandry will have a great impact on the place of migration. However, there are few related studies, so this paper supplements the related studies on the western region. There are still some shortcomings in this study, such as the limitation of statistical data. We only studied city areas; in the future, under the background of big data to improve the availability of data, more in-depth research can be performed from the perspective of the county. In addition, the CE coefficients used in this paper are average regional coefficients, but in reality, there are still differences in the coefficients among regions, so more in-depth research can be conducted on the CE coefficients in the future. Finally, this study only focuses on the SGN region, which is a small area with special circumstances. It is only of reference value to regions with similar circumstances to the SGN region, which limits the applicability of its conclusions to other regions or countries. In the future, we will use all of China’s city-level or county-level data to conduct research on CEs from animal husbandry and perform a more in-depth analysis of each city across the country, striving to find a balance between animal husbandry development and sustainability within the framework of sustainable development.

5. Conclusions

Based on the measurement of CEs from pig, cattle, and sheep rearing in the SGN region from 2010 to 2021, we analyzed the spatial and temporal evolution of CEs from pig, cattle, and sheep rearing. Additionally, we examined the driving force of the CEI in the years 2014, 2018, and 2021 through the lenses of population dynamics, industrial structure, and economic development, utilizing the GeoDetector method. The conclusions of the study are as follows:
(1) The total CEs from pig, cattle, and sheep rearing in the SGN region exhibit a pattern of increase, followed by a decrease, and then a subsequent increase, culminating in an overall upward fluctuation. Moreover, significant disparities in total CEs from livestock rearing are evident across different cities (states). The spatial distribution of high- and low-CE zones remains relatively stable; however, the distribution of these zones shows dynamic evolution, with a notable shift toward the northern regions.
(2) The CEI of animal husbandry in the SGN region indicates a clear downward trend. Nevertheless, the CEI of animal husbandry varies significantly among different cities (or states), exhibiting increasingly pronounced spatial heterogeneity. The spatial distribution of low-CEI zones remains largely stable. Collectively, the spatial distribution of CEI follows a pattern characterized by higher values in the western region and lower values in the eastern region. Most of the eastern region consistently falls under the low livestock CEI zones and exhibits a downward trend. Conversely, the western region encompasses zones of lower to moderate livestock CEI and exhibits an upward trend.
(3) The results from the GeoDetector indicate that the spatial heterogeneity of the CEI in pig, cattle, and sheep rearing in the SGN region is the outcome of multiple driving factors. Among these factors, the key ones include the pig, cattle, and sheep rearing structure; the urban population proportion; and the per capita gross national product. The impact of these three driving factors on the CEI has been increasing. Conversely, the influence of the agricultural industry structure and the disposable income of urban residents on the CEI has been decreasing. Moreover, the interaction between the rural population and the other driving factors has a significant influence on the CEI.

Author Contributions

Conceptualization, H.W.; methodology, H.W.; software, H.W. and T.S.; validation, H.W. and H.L.; formal analysis, H.W.; investigation, H.W. and T.S.; resources, H.W. and T.S.; data curation, H.W. and T.S.; writing—original draft preparation, H.W., T.S. and H.S.K.; writing—review and editing, H.W., T.S., L.D. and H.S.K.; visualization, H.W.; supervision, H.L.; project administration, H.L.; funding acquisition, H.L. All authors have read and agreed to the published version of the manuscript.

Funding

This work was funded by the Shaanxi Livestock and Poultry Breeding Double-Chain Fusion Key Project (Project number 2022GD-TSLD-46-0502).

Institutional Review Board Statement

Not applicable.

Data Availability Statement

The data presented in this study are available in this article.

Conflicts of Interest

The authors declare no conflicts of interest.

References

  1. Rosenzweig, C.; Mbow, C.; Barioni, L.G.; Benton, T.G.; Herrero, M.; Krishnapillai, M.; Liwenga, E.T.; Pradhan, P.; Rivera-Ferre, M.G.; Sapkota, T.; et al. Climate Change Responses Benefit from a Global Food System Approach. Nat. Food 2020, 1, 94–97. [Google Scholar] [CrossRef] [PubMed]
  2. Shi, Z.; Li, J.; Hu, X. From Large to Powerful: International Comparison, Challenges and Strategic Choices for China’s Livestock Industry. Agriculture 2023, 13, 1298. [Google Scholar] [CrossRef]
  3. Tomislav, K. The Concept of Sustainable Development: From Its Beginning to the Contemporary Issues. Zagreb Int. Rev. Econ. Bus. 2018, 21, 67–94. [Google Scholar] [CrossRef]
  4. Wei, W.; Li, Z.; Xie, B. Spatial distance-based integrated evaluation of environmentally sensitivity for ecological management in northwest China. Ecol. Indic. 2020, 118, 106753. [Google Scholar] [CrossRef]
  5. Wei, W.; Guo, Z.; Shi, P.; Zhou, L.; Wang, X.; Li, Z.; Pang, S.; Xie, B. Spatiotemporal Changes of Land Desertification Sensitivity in Northwest China from 2000 to 2017. J. Geogr. Sci. 2021, 31, 46–68. [Google Scholar] [CrossRef]
  6. Deng, J. “South to North Migration of Pigs” marks the beginning of the adjustment of pig farming layout. New Rural. Technol. 2018, 4–7. [Google Scholar]
  7. Coluccia, B.; Agnusdei, G.P.; de Leo, F.; Vecchio, Y.; La Fata, C.M.; Miglietta, P.P. Assessing the Carbon Footprint across the Supply Chain: Cow Milk vs Soy Drink. Sci. Total Environ. 2022, 806, 151200. [Google Scholar] [CrossRef]
  8. Laca, A.; Gómez, N.; Laca, A.; Díaz, M. Overview on GHG Emissions of Raw Milk Production and a Comparison of Milk and Cheese Carbon Footprints of Two Different Systems from Northern Spain. Environ. Sci. Pollut. Res. 2020, 27, 1650–1666. [Google Scholar] [CrossRef]
  9. Cheng, M.; Yao, W. Trend Prediction of Carbon Peak in China’s Animal Husbandry Based on the Empirical Analysis of 31 Provinces in China. Environ. Dev. Sustain. 2024, 26, 2017–2034. [Google Scholar] [CrossRef]
  10. Yan, J.; Zhang, Y. Quantitative Assessment, Spatial and Temporal Characteristics, and Dynamic Evolution of Carbon Emissions from Animal Husbandry in China: 2001–2020. Environ. Sci. Pollut. Res. 2023, 30, 116186–116201. [Google Scholar] [CrossRef]
  11. Henderson, B.; Godde, C.; Medina-Hidalgo, D.; van Wijk, M.; Silvestri, S.; Douxchamps, S.; Stephenson, E.; Power, B.; Rigolot, C.; Cacho, O.; et al. Closing System-Wide Yield Gaps to Increase Food Production and Mitigate GHGs among Mixed Crop–Livestock Smallholders in Sub-Saharan Africa. Agric. Syst. 2016, 143, 106–113. [Google Scholar] [CrossRef] [PubMed]
  12. Lesschen, J.P.; van den Berg, M.; Westhoek, H.J.; Witzke, H.P.; Oenema, O. Greenhouse Gas Emission Profiles of European Livestock Sectors. Anim. Feed. Sci. Technol. 2011, 166–167, 16–28. [Google Scholar] [CrossRef]
  13. Chirone, R.; Paulillo, A.; Salatino, P.; Salzano, A.; Cristofaro, B.; Cristiano, T.; Campanile, G.; Neglia, G. Life Cycle Assessment of Buffalo Milk: A Case Study of Three Farms in Southern Italy. J. Clean. Prod. 2022, 365, 132816. [Google Scholar] [CrossRef]
  14. Uddin, M.E.; Tricarico, J.M.; Kebreab, E. Impact of Nitrate and 3-Nitrooxypropanol on the Carbon Footprints of Milk from Cattle Produced in Confined-Feeding Systems across Regions in the United States: A Life Cycle Analysis. J. Dairy Sci. 2022, 105, 5074–5083. [Google Scholar] [CrossRef]
  15. Xu, J.; Wang, J.; Wang, T.; Li, C. Impact of Industrial Agglomeration on Carbon Emissions from Dairy Farming—Empirical Analysis Based on Life Cycle Assessmsent Method and Spatial Durbin Model. J. Clean. Prod. 2023, 406, 137081. [Google Scholar] [CrossRef]
  16. Li, M.; Liu, S.; Sun, Y.; Liu, Y. Agriculture and Animal Husbandry Increased Carbon Footprint on the Qinghai-Tibet Plateau during Past Three Decades. J. Clean. Prod. 2021, 278, 123963. [Google Scholar] [CrossRef]
  17. Fan, H.; Chen, K.; Ma, H.; He, J.; Li, H.; Yang, Z.; Wu, Q.; Zhang, C.; Zhang, S.; Huang, T.; et al. Carbon Footprints in Pork Production and Consumption in China from 2005 to 2020. J. Clean. Prod. 2023, 419, 138252. [Google Scholar] [CrossRef]
  18. Wei, Z.; Wei, K.; Liu, J.; Zhou, Y. The Relationship between Agricultural and Animal Husbandry Economic Development and Carbon Emissions in Henan Province, the Analysis of Factors Affecting Carbon Emissions, and Carbon Emissions Prediction. Mar. Pollut. Bull. 2023, 193, 115134. [Google Scholar] [CrossRef]
  19. Brizga, J.; Feng, K.; Hubacek, K. Drivers of CO Emissions in the Former Soviet Union: A Country Level IPAT Analysis from 1990 to 20102. Energy 2013, 59, 743–753. [Google Scholar] [CrossRef]
  20. Yu, S.; Zhang, Q.; Hao, J.L.; Ma, W.; Sun, Y.; Wang, X.; Song, Y. Development of an Extended STIRPAT Model to Assess the Driving Factors of Household Carbon Dioxide Emissions in China. J. Environ. Manag. 2023, 325, 116502. [Google Scholar] [CrossRef]
  21. Kou, J.; Ma, W.; Li, C.; Yang, H.; Xue, B.; Gou, X. The Equity of Carbon Emissions in International Trade from the Perspective of Value Added. Geogr. J. 2023, 159, e12572. [Google Scholar] [CrossRef]
  22. Wang, Y.; Zhao, H.; Duan, F.; Wang, Y. Initial Provincial Allocation and Equity Evaluation of China’s Carbon Emission Rights—Based on the Improved TOPSIS Method. Sustainability 2018, 10, 982. [Google Scholar] [CrossRef]
  23. Zhou, C.; Chen, X. Forecasting China’s Energy Consumption and Carbon Emission Based on Multiple Decomposition Strategy. Energy Strateg. Rev. 2023, 49, 101160. [Google Scholar] [CrossRef]
  24. Zhou, W.; Zeng, B.; Wang, J.; Luo, X.; Liu, X. Forecasting Chinese Carbon Emissions Using a Novel Grey Rolling Prediction Model. Chaos Solitons Fractals 2021, 147, 110968. [Google Scholar] [CrossRef]
  25. Hua, J.; Zhu, D.; Jia, Y. Research on the Policy Effect and Mechanism of Carbon Emission Trading on the Total Factor Productivity of Agricultural Enterprises. Int. J. Environ. Res. Public Health 2022, 19, 7581. [Google Scholar] [CrossRef]
  26. Xu, X.; Huang, X.; Huang, J.; Gao, X.; Chen, L. Spatial-Temporal Characteristics of Agriculture Green Total Factor Productivity in China, 1998-2016: Based on More Sophisticated Calculations of Carbon Emissions. Int. J. Environ. Res. Public Health 2019, 16, 3932. [Google Scholar] [CrossRef]
  27. Zheng, C.; Yang, W.; Jiang, X.; Lian, J.; Hu, D.; Yan, X.; Yan, L. A novel integrated urban flood risk assessment approach coupling GeoDetector-dematel and clustering method. J. Environ. Manag. 2024, 354, 120308. [Google Scholar] [CrossRef]
  28. Cui, Y.; Khan, S.U.; Deng, Y.; Zhao, M. Regional Difference Decomposition and Its Spatiotemporal Dynamic Evolution of Chinese Agricultural Carbon Emission: Considering Carbon Sink Effect. Environ. Sci. Pollut. Res. 2021, 28, 38909–38928. [Google Scholar] [CrossRef]
  29. Du, R.; He, T.; Khan, A.; Zhao, M. Carbon Emissions Changes of Animal Husbandry in China: Trends, Attributions, and Solutions: A Spatial Shift-Share Analysis. Sci. Total Environ. 2024, 929, 172490. [Google Scholar] [CrossRef]
  30. Xiong, C.; Su, W.; Li, H.; Guo, Z. Influencing Mechanism of Non-CO2 Greenhouse Gas Emissions and Mitigation Strategies of Livestock Sector in Developed Regions of Eastern China: A Case Study of Jiangsu Province. Environ. Sci. Pollut. Res. 2022, 29, 39937–39947. [Google Scholar] [CrossRef]
  31. Yao, C.; Qian, S.; Li, Z.; Liang, L. Measurement and spatiotemporal evolution mechanism of carbon emissions from inter provincial animal husbandry in China. Resour. Sci. 2017, 39, 698–712. [Google Scholar]
  32. Zhang, J.; Wang, H. Analysis of regional differences, dynamic evolution and convergence of carbon emissions in China’s livestock industry—Based on livestock industry data from 31 provinces (cities) in China, 1997–2017. Jianghan Trib. 2020, 41–48. [Google Scholar]
  33. Wu, Q.; Zhang, Y.; Zhang, M. Quantitative assessment, temporal and spatial characteristics and dynamic evolution of China’s animal husbandry carbon emissions: 2001–2020. J. Arid. Land. Resour. Environ. 2022, 36, 65–71. [Google Scholar] [CrossRef]
  34. Niu, W.; Shen, S.; Zhang, B. The spatial pattern and influencing factors of coupling coordination in five dimensions of rural revitalization in China. Chin. J. Agric. Resour. Reg. Plan. 2021, 42, 218–231. [Google Scholar]
  35. Wang, J.; Xu, C. Geodetectors: Principles and Prospects. Acta Geogr. Sin. 2017, 72, 116–134. [Google Scholar]
  36. Ju, H.; Zhang, Z.; Zuo, L.; Wang, J.; Zhang, S.; Wang, X.; Zhao, X. Driving Forces and Their Interactions of Built-up Land Expansion Based on the Geographical Detector—A Case Study of Beijing, China. Int. J. Geogr. Inf. Sci. 2016, 30, 2188–2207. [Google Scholar] [CrossRef]
  37. Tan, J.; Zhang, P.; Lo, K.; Li, J.; Liu, S. The Urban Transition Performance of Resource-Based Cities in Northeast China. Sustainability 2016, 8, 1022. [Google Scholar] [CrossRef]
  38. Zhang, N.; Jing, Y.-C.; Liu, C.-Y.; Li, Y.; Shen, J. A Cellular Automaton Model for Grasshopper Population Dynamics in Inner Mongolia Steppe Habitats. Ecol. Model. 2016, 329, 5–17. [Google Scholar] [CrossRef]
  39. Liang, P.; Yang, X. Landscape Spatial Patterns in the Maowusu (Mu Us) Sandy Land, Northern China and Their Impact Factors. Catena 2016, 145, 321–333. [Google Scholar] [CrossRef]
  40. Dai, X.; Wu, X.; Chen, Y.; He, Y.; Wang, F.; Liu, Y. Real Drivers and Spatial Characteristics of CO2 Emissions from Animal Husbandry: A Regional Empirical Study of China. Agriculture 2022, 12, 510. [Google Scholar] [CrossRef]
  41. Hao, D.; Wang, R.; Gao, C.; Song, X.; Liu, W.; Hu, G. Spatial-Temporal Characteristics and Influence Factors of Carbon Emission from Livestock Industry in China. Int. J. Environ. Res. Public Health 2022, 19, 14837. [Google Scholar] [CrossRef] [PubMed]
  42. Peng, C.; Wang, X.; Xiong, X.; Wang, Y. Assessing Carbon Emissions from Animal Husbandry in China: Trends, Regional Variations and Mitigation Strategies. Sustainability 2024, 16, 2283. [Google Scholar] [CrossRef]
  43. Hao, G.; Zhu, H.; Cui, Y. Measurement and Influencing Factors of Carbon Emissions of China’s Livestock Husbandry in the Post-COVID-19 Era-Based on the Supply-Side Perspective. Sustainability 2023, 15, 913. [Google Scholar] [CrossRef]
  44. Guo, H.; Li, S.; Pan, C.; Xu, S.; Lei, Q. Analysis of Spatial and Temporal Characteristics of Carbon Emission Efficiency of Pig Farming and the Influencing Factors in China. Front. Public Health 2023, 11, 1073902. [Google Scholar] [CrossRef] [PubMed]
  45. Yu, Y.; Li, Q.; Bao, Y.; Fu, E.; Chen, Y.; Ni, T. Research on the Measurement and Influencing Factors of Carbon Emissions in the Swine Industry from the Perspective of the Industry Chain. Sustainability 2024, 16, 2199. [Google Scholar] [CrossRef]
  46. Manioudis, M.; Meramveliotakis, G. Broad Strokes towards a Grand Theory in the Analysis of Sustainable Development: A Return to the Classical Political Economy. New Polit. Econ. 2022, 27, 866–878. [Google Scholar] [CrossRef]
Figure 1. Study area map.
Agriculture 14 01748 g001
Figure 2. Evolution trend of CEs from 2010 to 2021.
Agriculture 14 01748 g002
Figure 3. The distribution and changes in CEs.
Agriculture 14 01748 g003
Figure 4. Evolution trend of the CEI in the SGN region from 2010 to 2021.
Agriculture 14 01748 g004
Figure 5. Distribution and Changes in the CEI in the SGN region.
Agriculture 14 01748 g005
Figure 6. The evolution trend of the explanatory power of each driving factor. Note: **, and * denote significant at 5%, and 10% levels, respectively.
Agriculture 14 01748 g006
Figure 7. Driver interaction detection results. Note: gray represents a promoting relationship between two corresponding factors.
Agriculture 14 01748 g007
Table 1. The decrease in the CEI in various cities from 2010 to 2021.
City (State)Drop %RankingCity (State)Drop %RankingCity (State)Drop %Ranking
Tongchuan87.381Yulin68.0611Wuzhong48.1721
Xi’an81.482Jiuquan67.2612Yinchuang47.9922
Pingliang78.893Shangluo66.4713Lanzhou47.3123
Xianyang76.174Yan’an65.6414Shizuishan41.4424
Weinan74.285Wuwei65.5615Tianshui37.9725
Qingyang72.276Hanzhong62.2816Guyuan34.5726
Gannan70.927Linxia61.4717Jiayuguan33.4327
Ankang70.298Longnan59.8818Zhongwei24.6428
Jinchang69.209Baoji56.6319Dingxi22.1029
Zhangye68.3110Baiyin50.1520
Table 2. Spatial autocorrelation.
YearMorans’IE (I)Sd (I)ZP
20100.280−0.0360.0152.5820.010
20110.310−0.0360.0172.6700.008
20120.299−0.0360.0172.6060.009
20130.343−0.0360.0182.8000.005
20140.342−0.0360.0192.7480.006
20150.368−0.0360.0192.9070.004
20160.354−0.0360.0192.8130.004
20170.391−0.0360.0193.0550.002
20180.558−0.0360.0204.1850.000
20190.523−0.0360.0194.0440.000
20200.559−0.0360.0204.2450.000
20210.622−0.0360.0214.5280.000
Table 3. Driving force indicator system.
TypeProbe FactorMetric FactorsUnit
PopulationX1Urban population proportion%
X2Rural population numberTen thousand people
Industrial structureX3Agricultural industry structure%
X4Pig, cattle, and sheep rearing structure%
Economic developmentX5Gross national productA hundred million yuan
X6Per capita gross national productCNY
X7Disposable income of urban residentsCNY
X8Disposable income of rural residentsCNY
Table 4. Ecological detection results.
X1X2X3X4X5X6X7X8
2014X1
X2N
X3YY
X4NNN
X5NNNN
X6NNNNN
X7NNNNNN
X8NNNNNNN
2018X1
X2N
X3NN
X4NNN
X5NNNN
X6NNNNN
X7NNNNNN
X8NNNNNNN
2021X1
X2N
X3NN
X4NNN
X5NNNN
X6NNNNN
X7NNNNNN
X8NNNNNNN
Disclaimer/Publisher’s Note: The statements, opinions and data contained in all publications are solely those of the individual author(s) and contributor(s) and not of MDPI and/or the editor(s). MDPI and/or the editor(s) disclaim responsibility for any injury to people or property resulting from any ideas, methods, instructions or products referred to in the content.

