
Design and Testing of Electric Drive System for Maize Precision Seeder


Abstract
1. Introduction
2. Materials and Methods
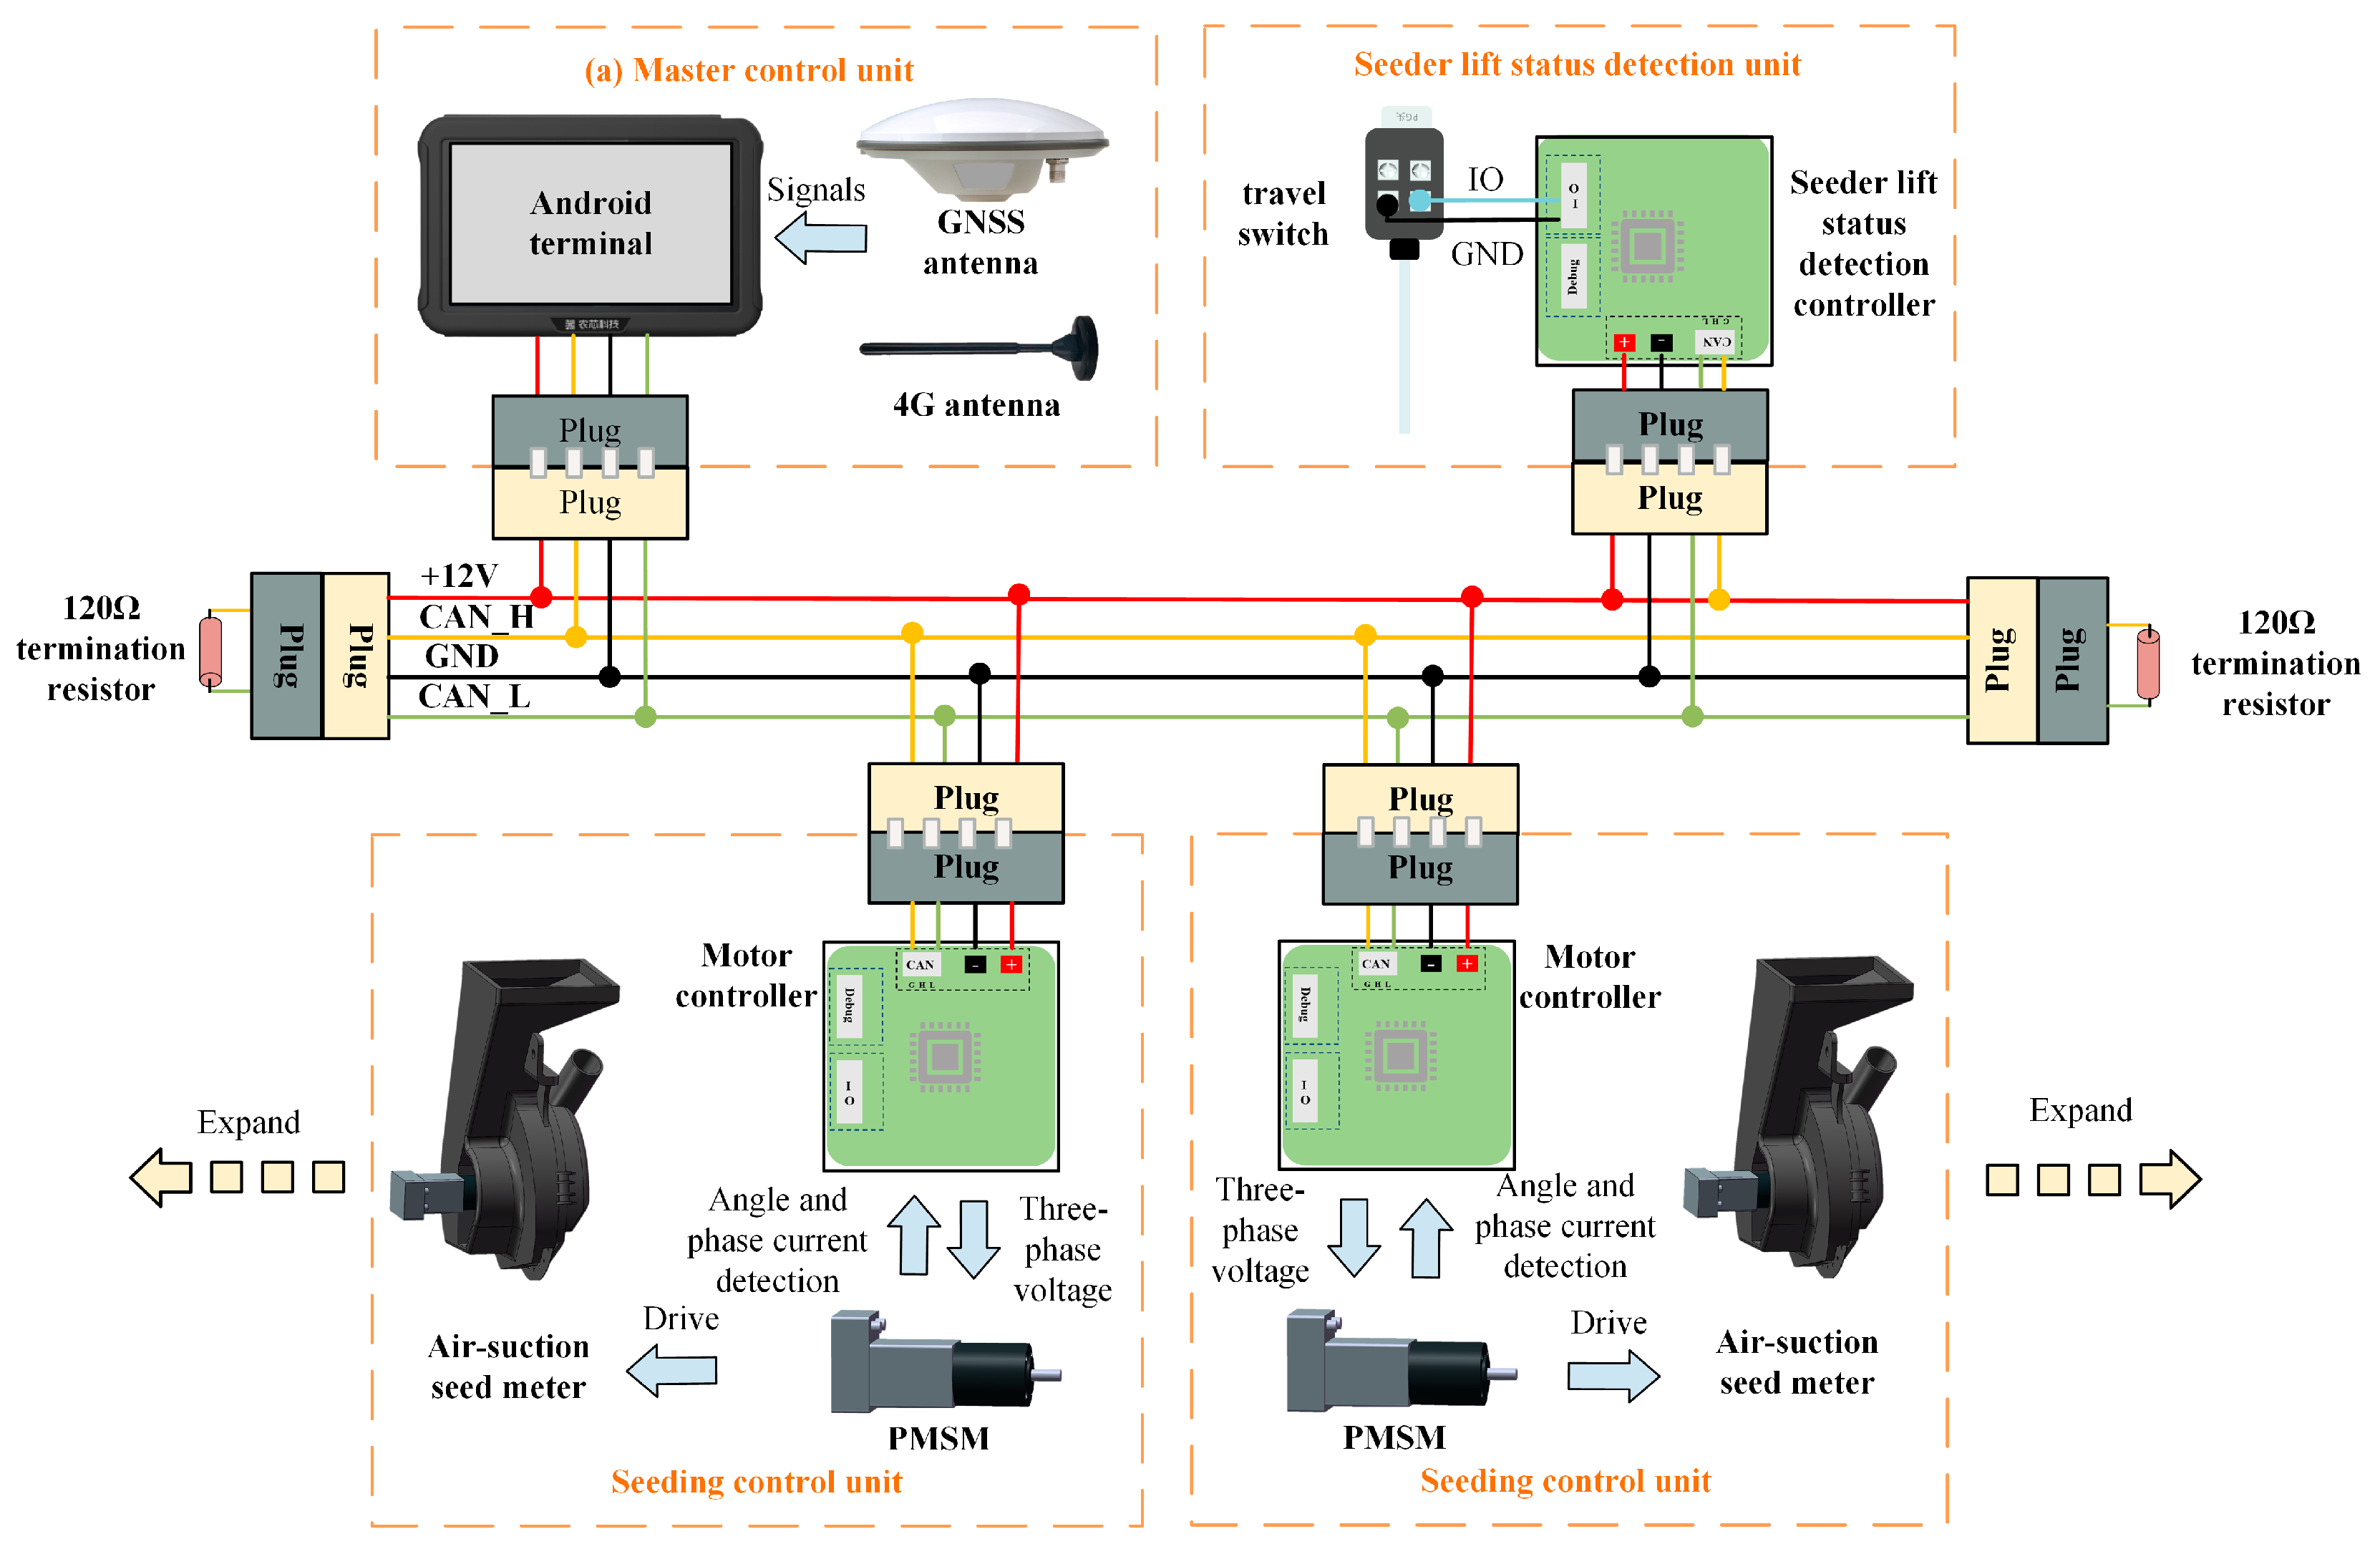
2.1. System Components
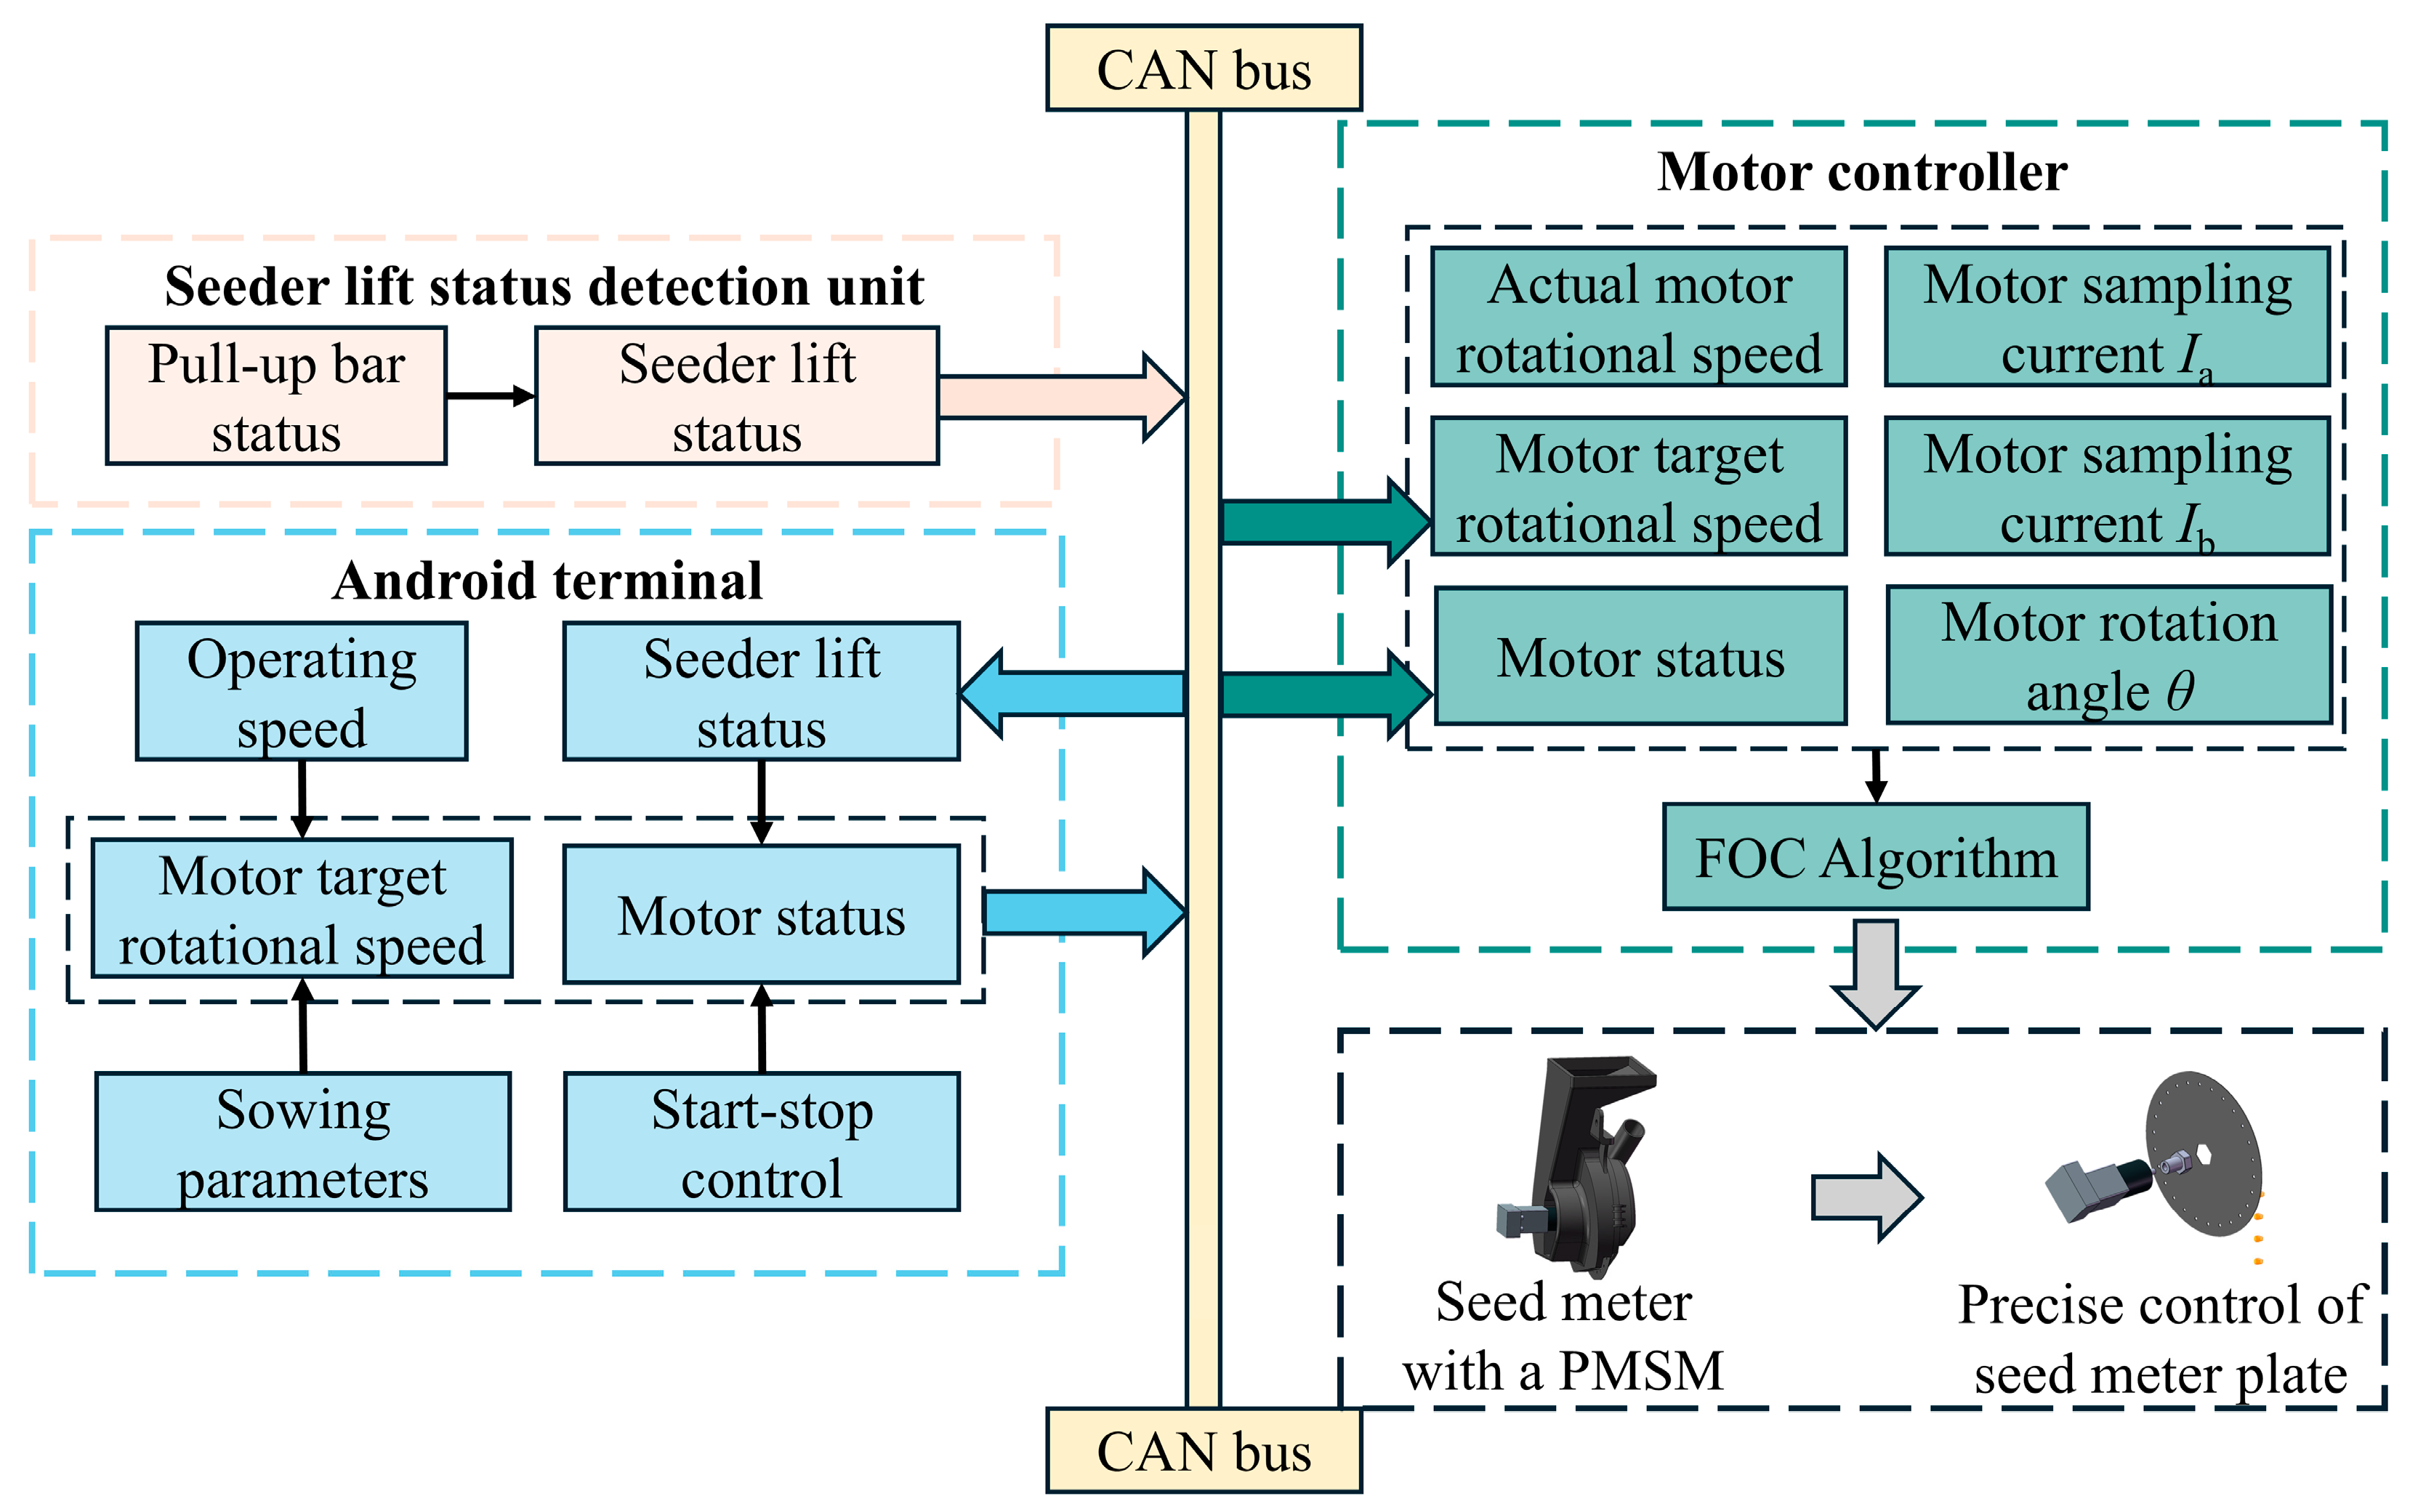
2.2. Working Principle
2.3. Design of Communication Protocol
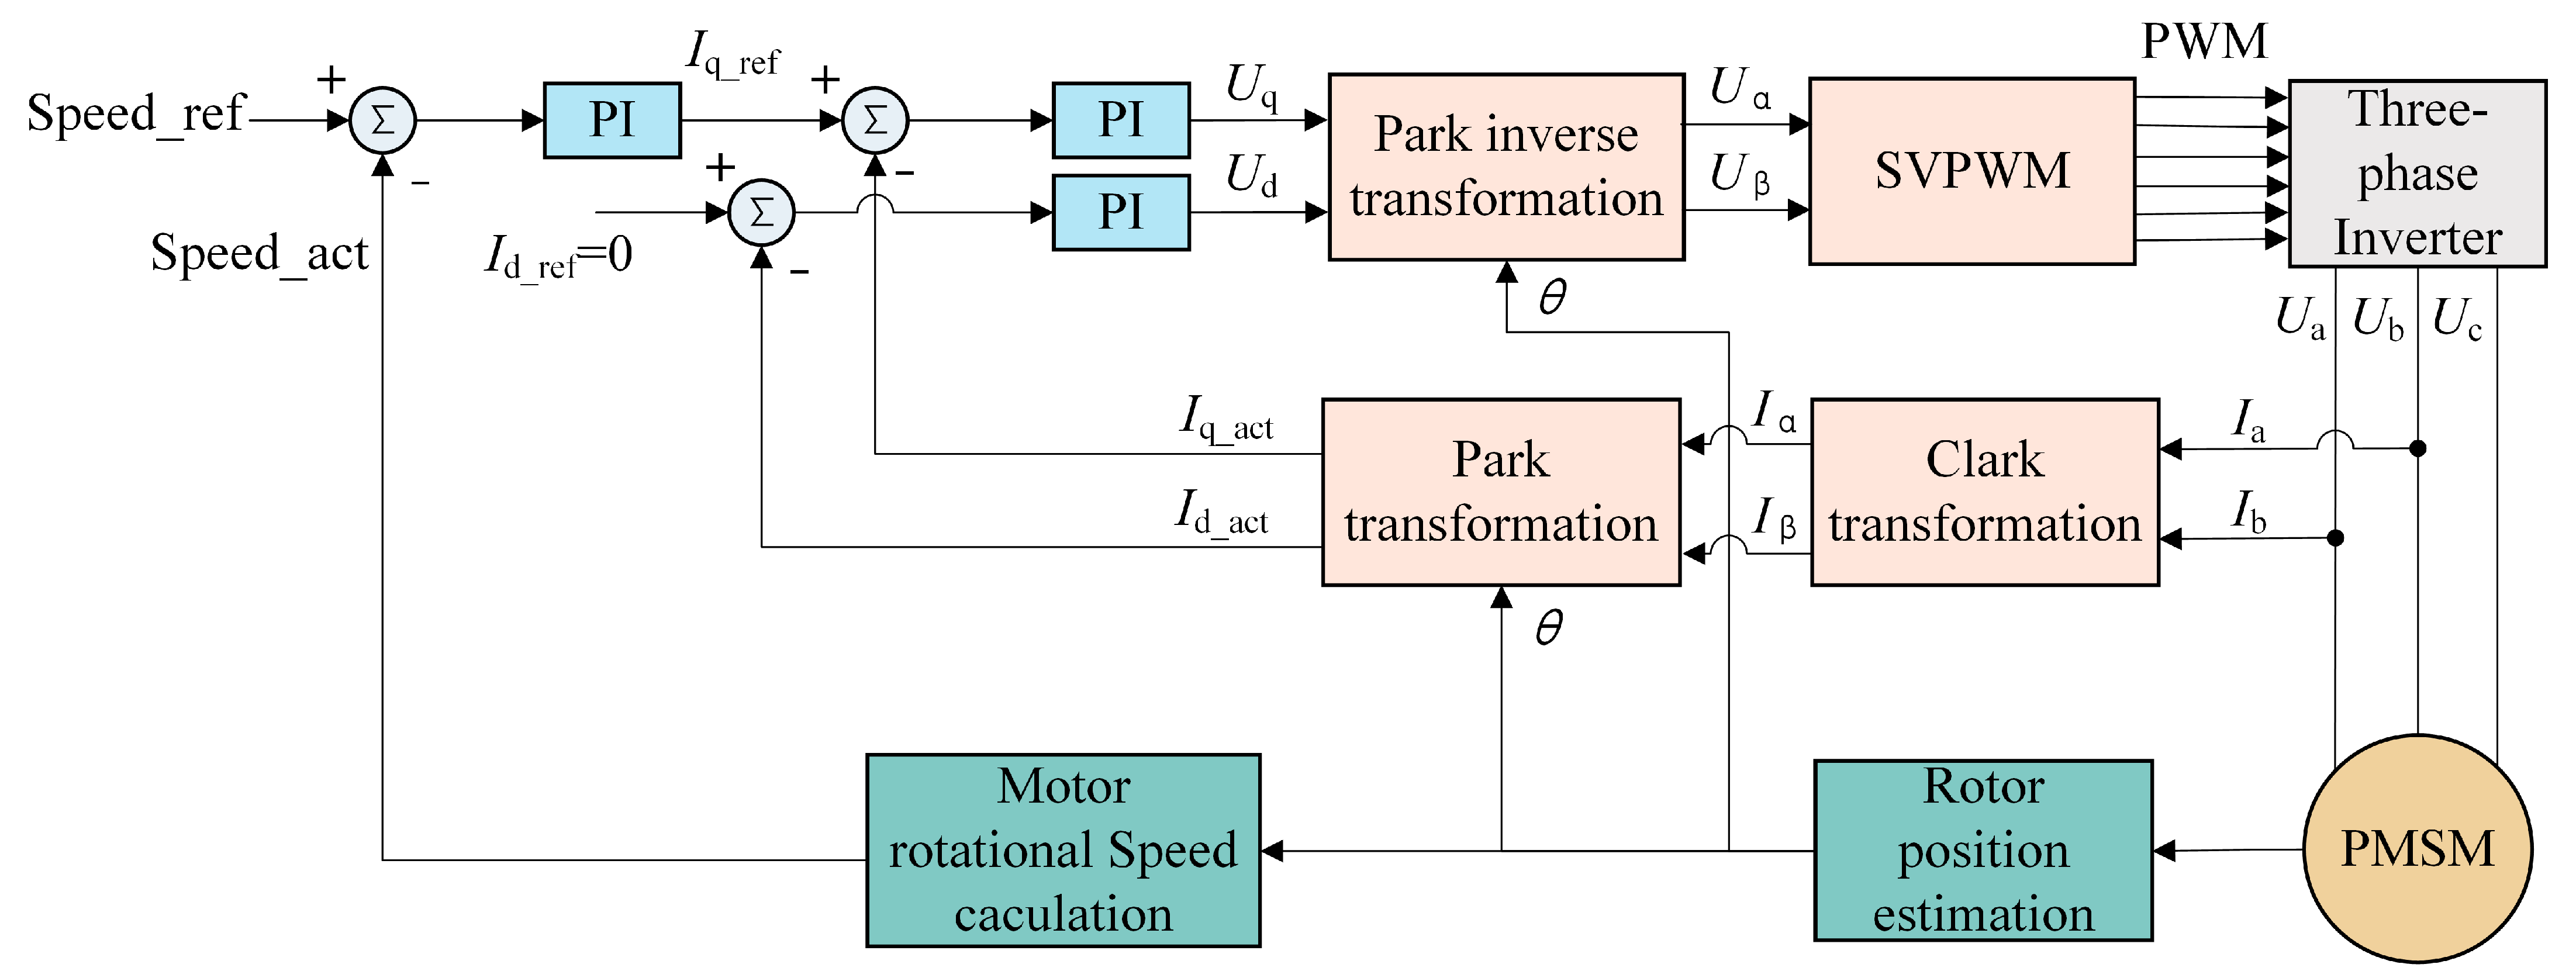
2.4. Field-Orientated Control Algorithm
2.4.1. Coordinate Transformation
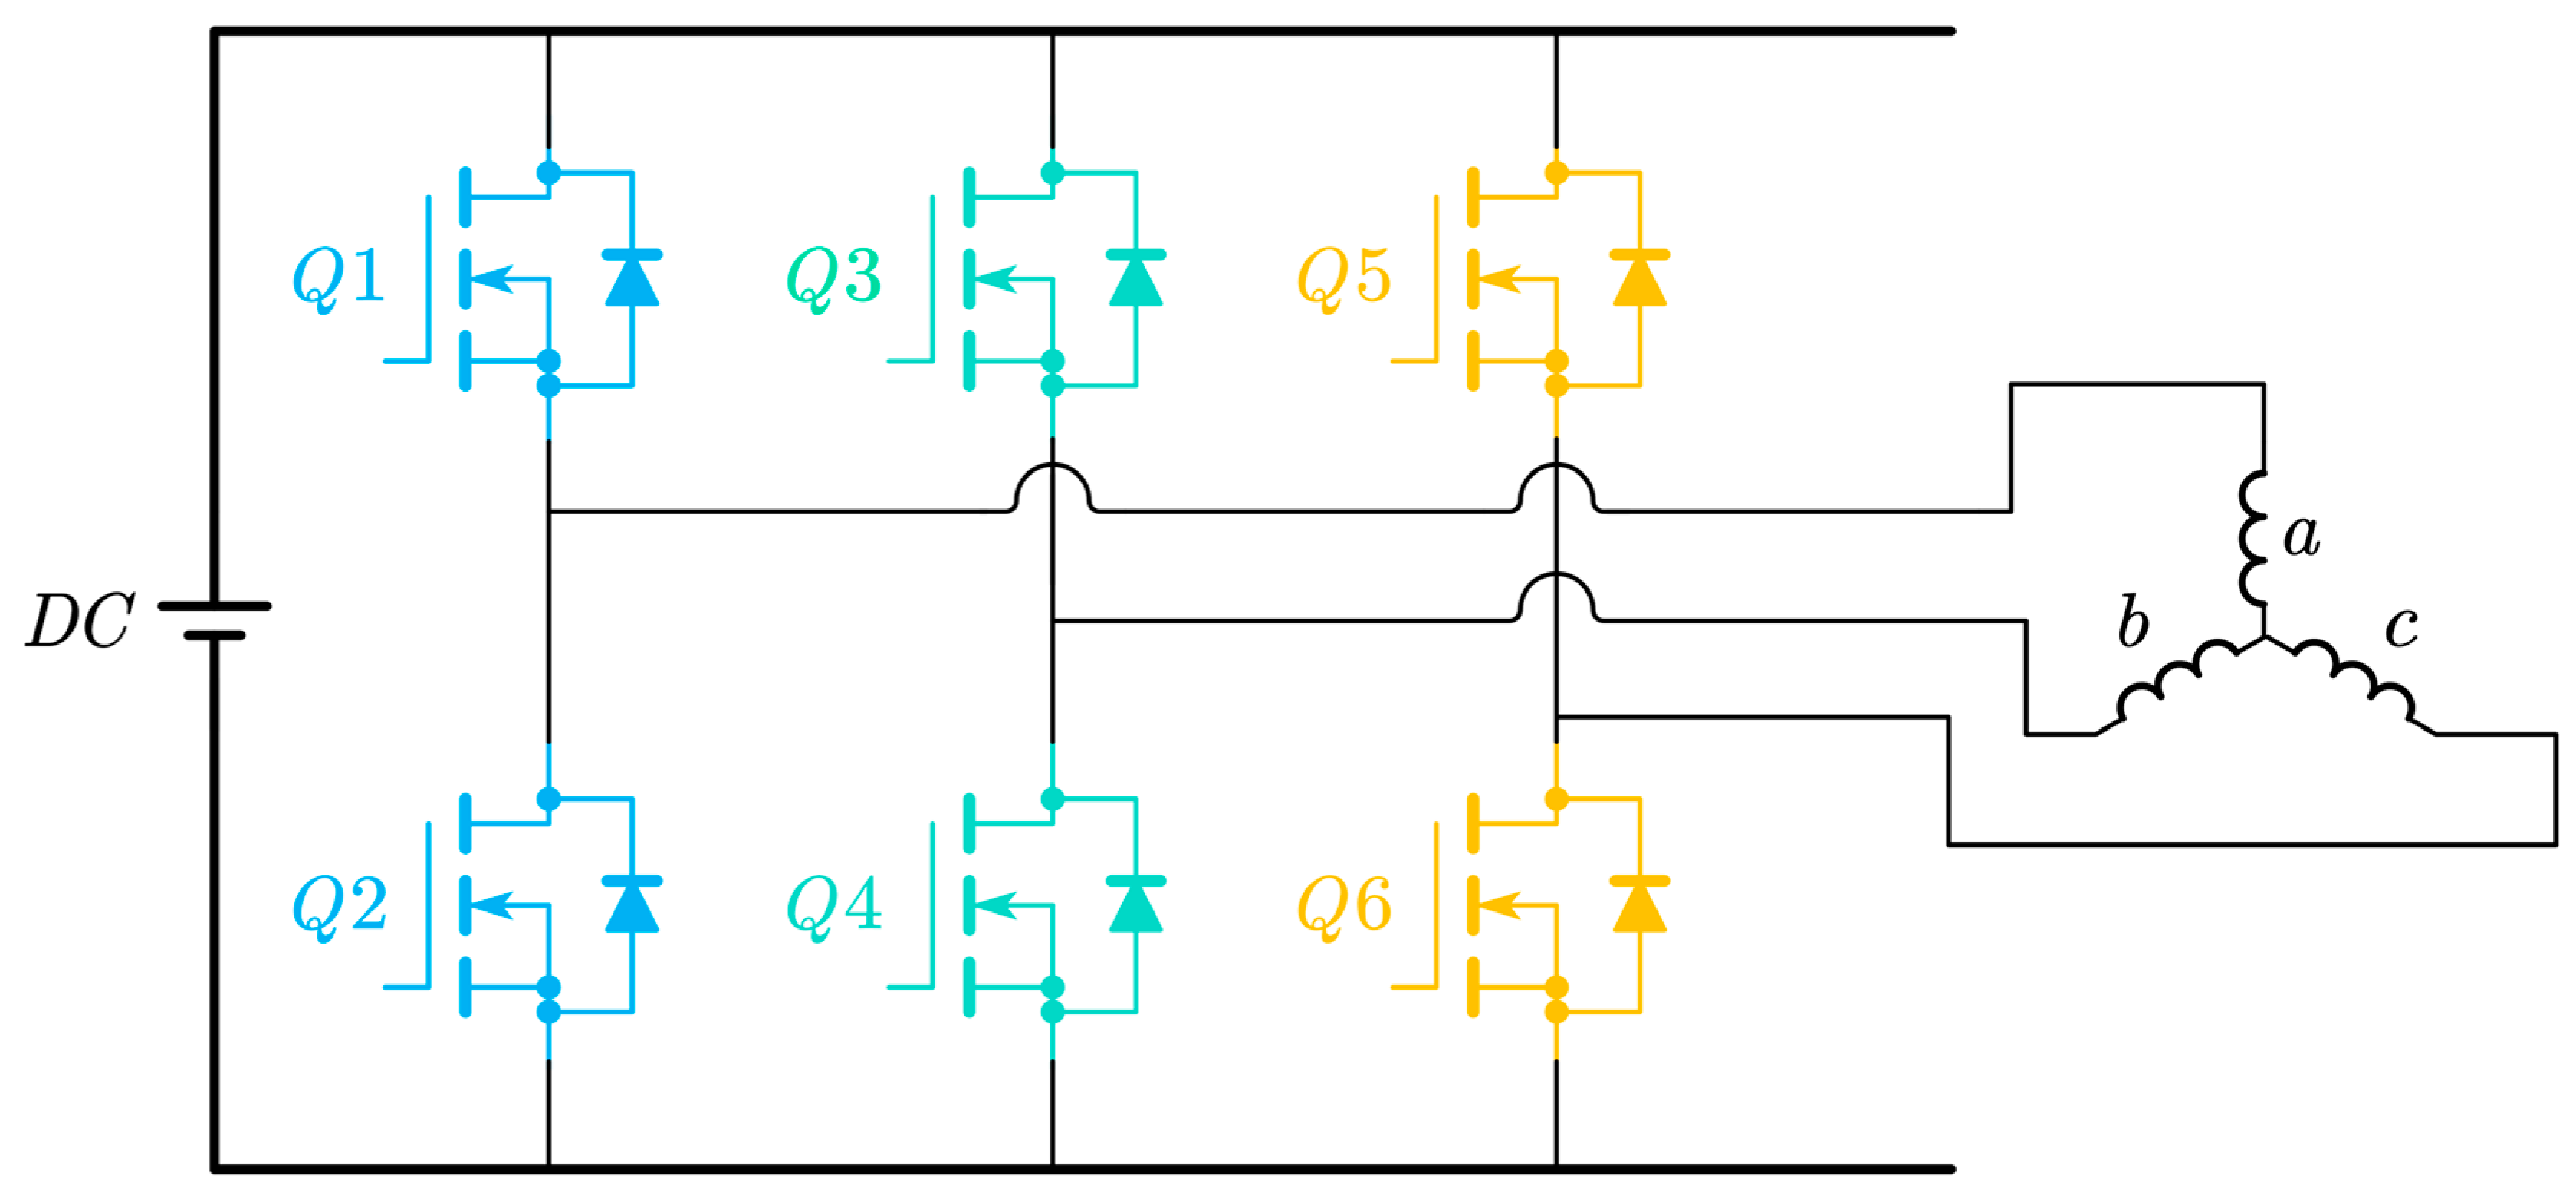
2.4.2. Space Voltage Vector Pulse Width Modulation
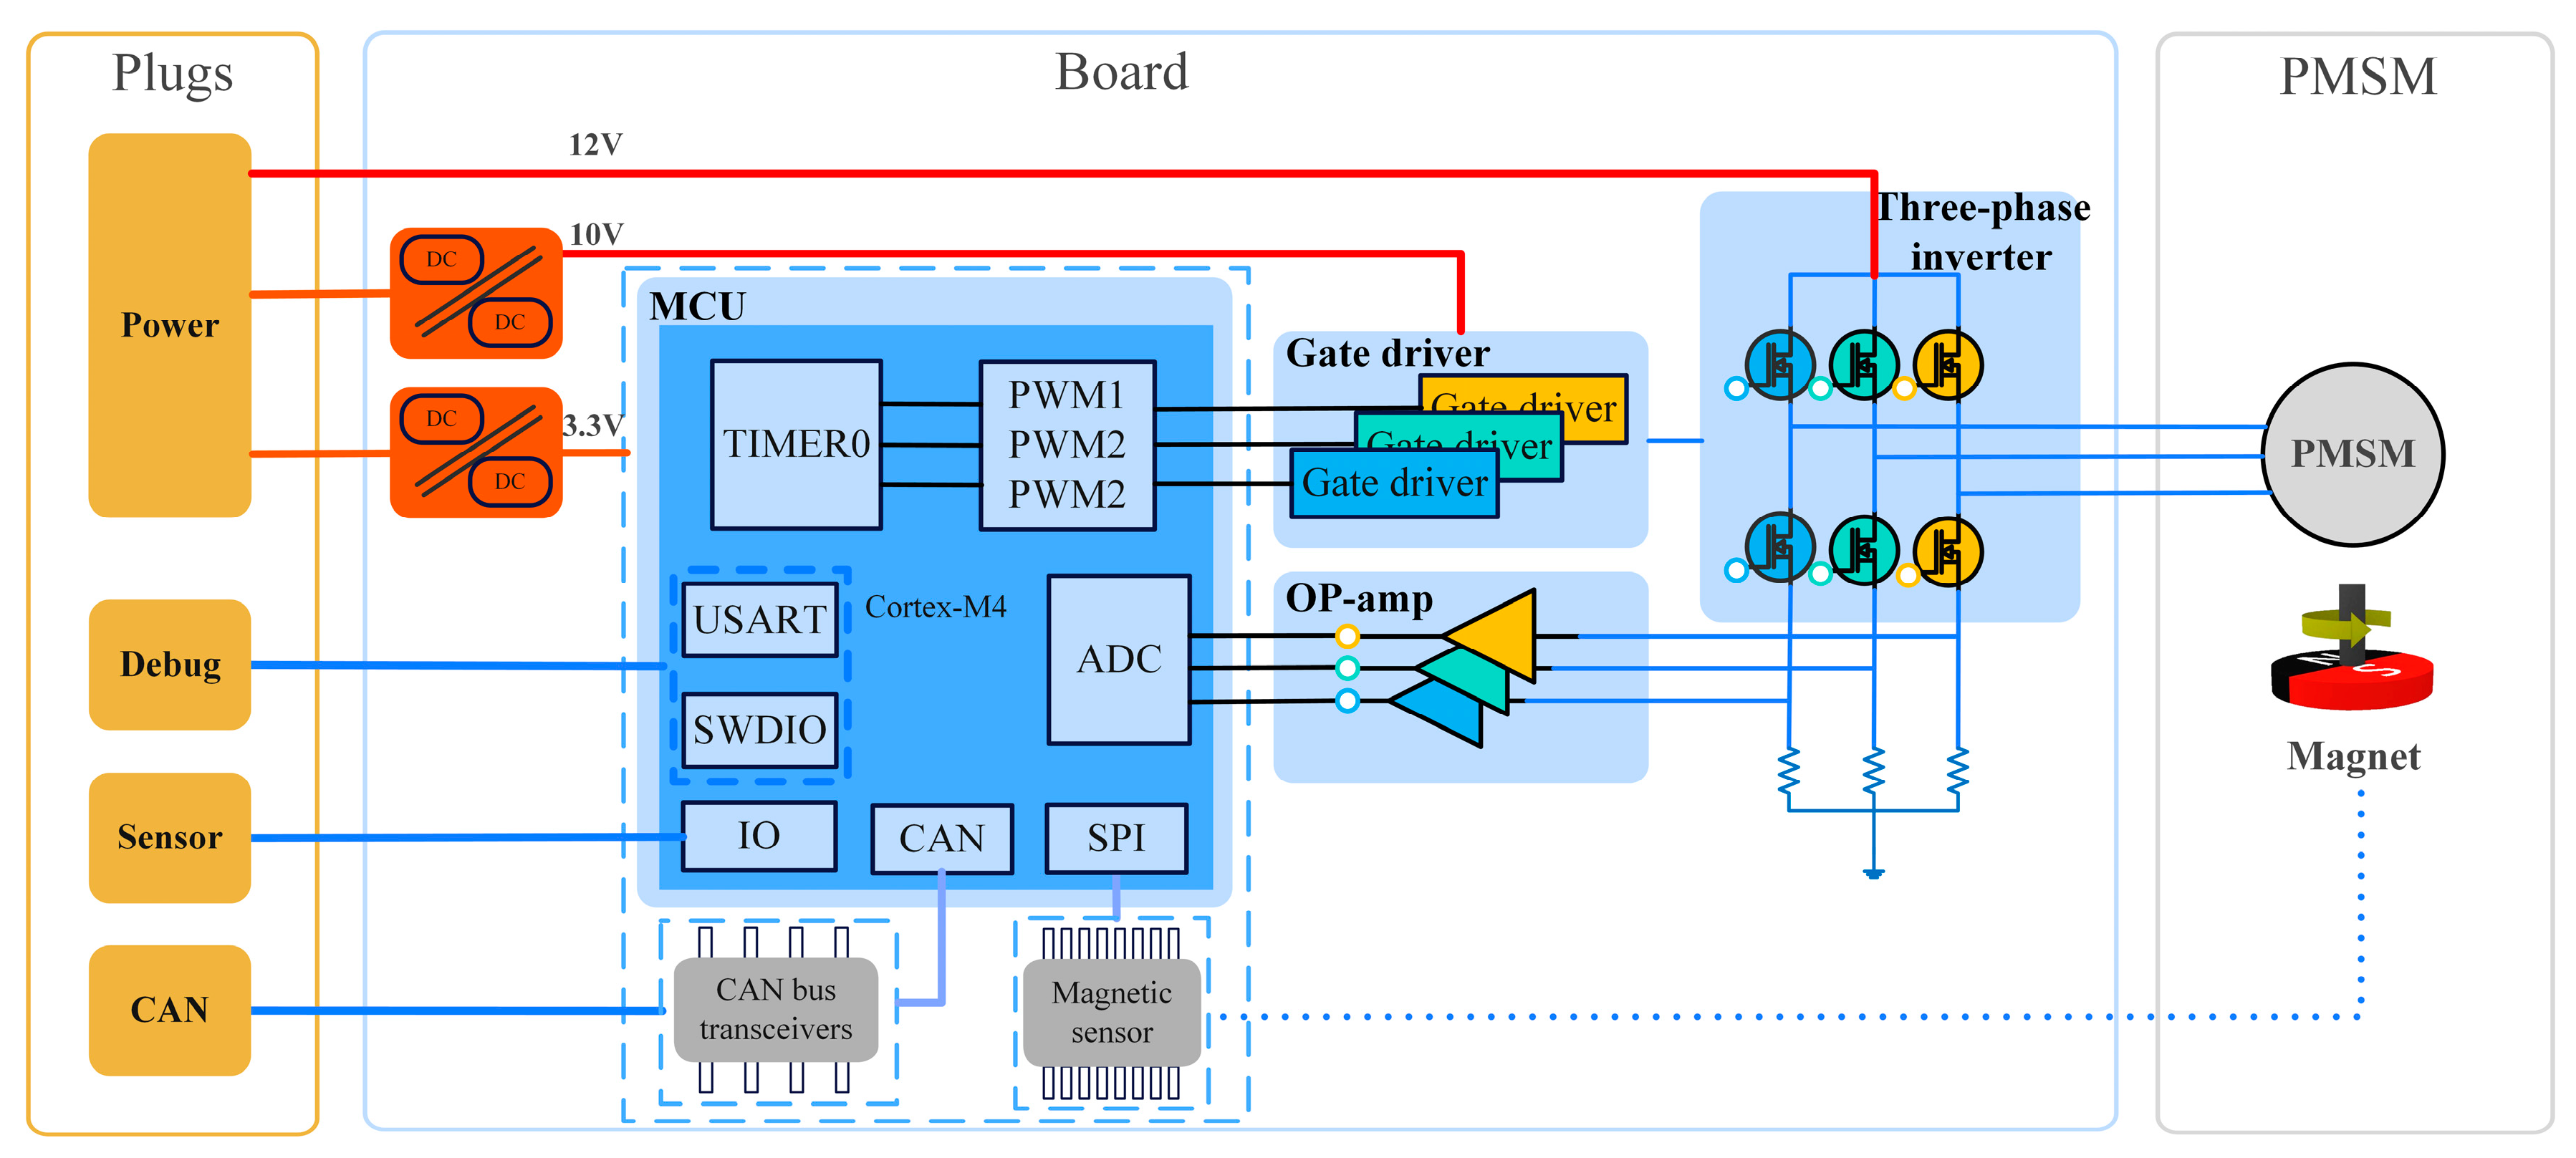
2.5. Design of Motor Controller
3. Tests
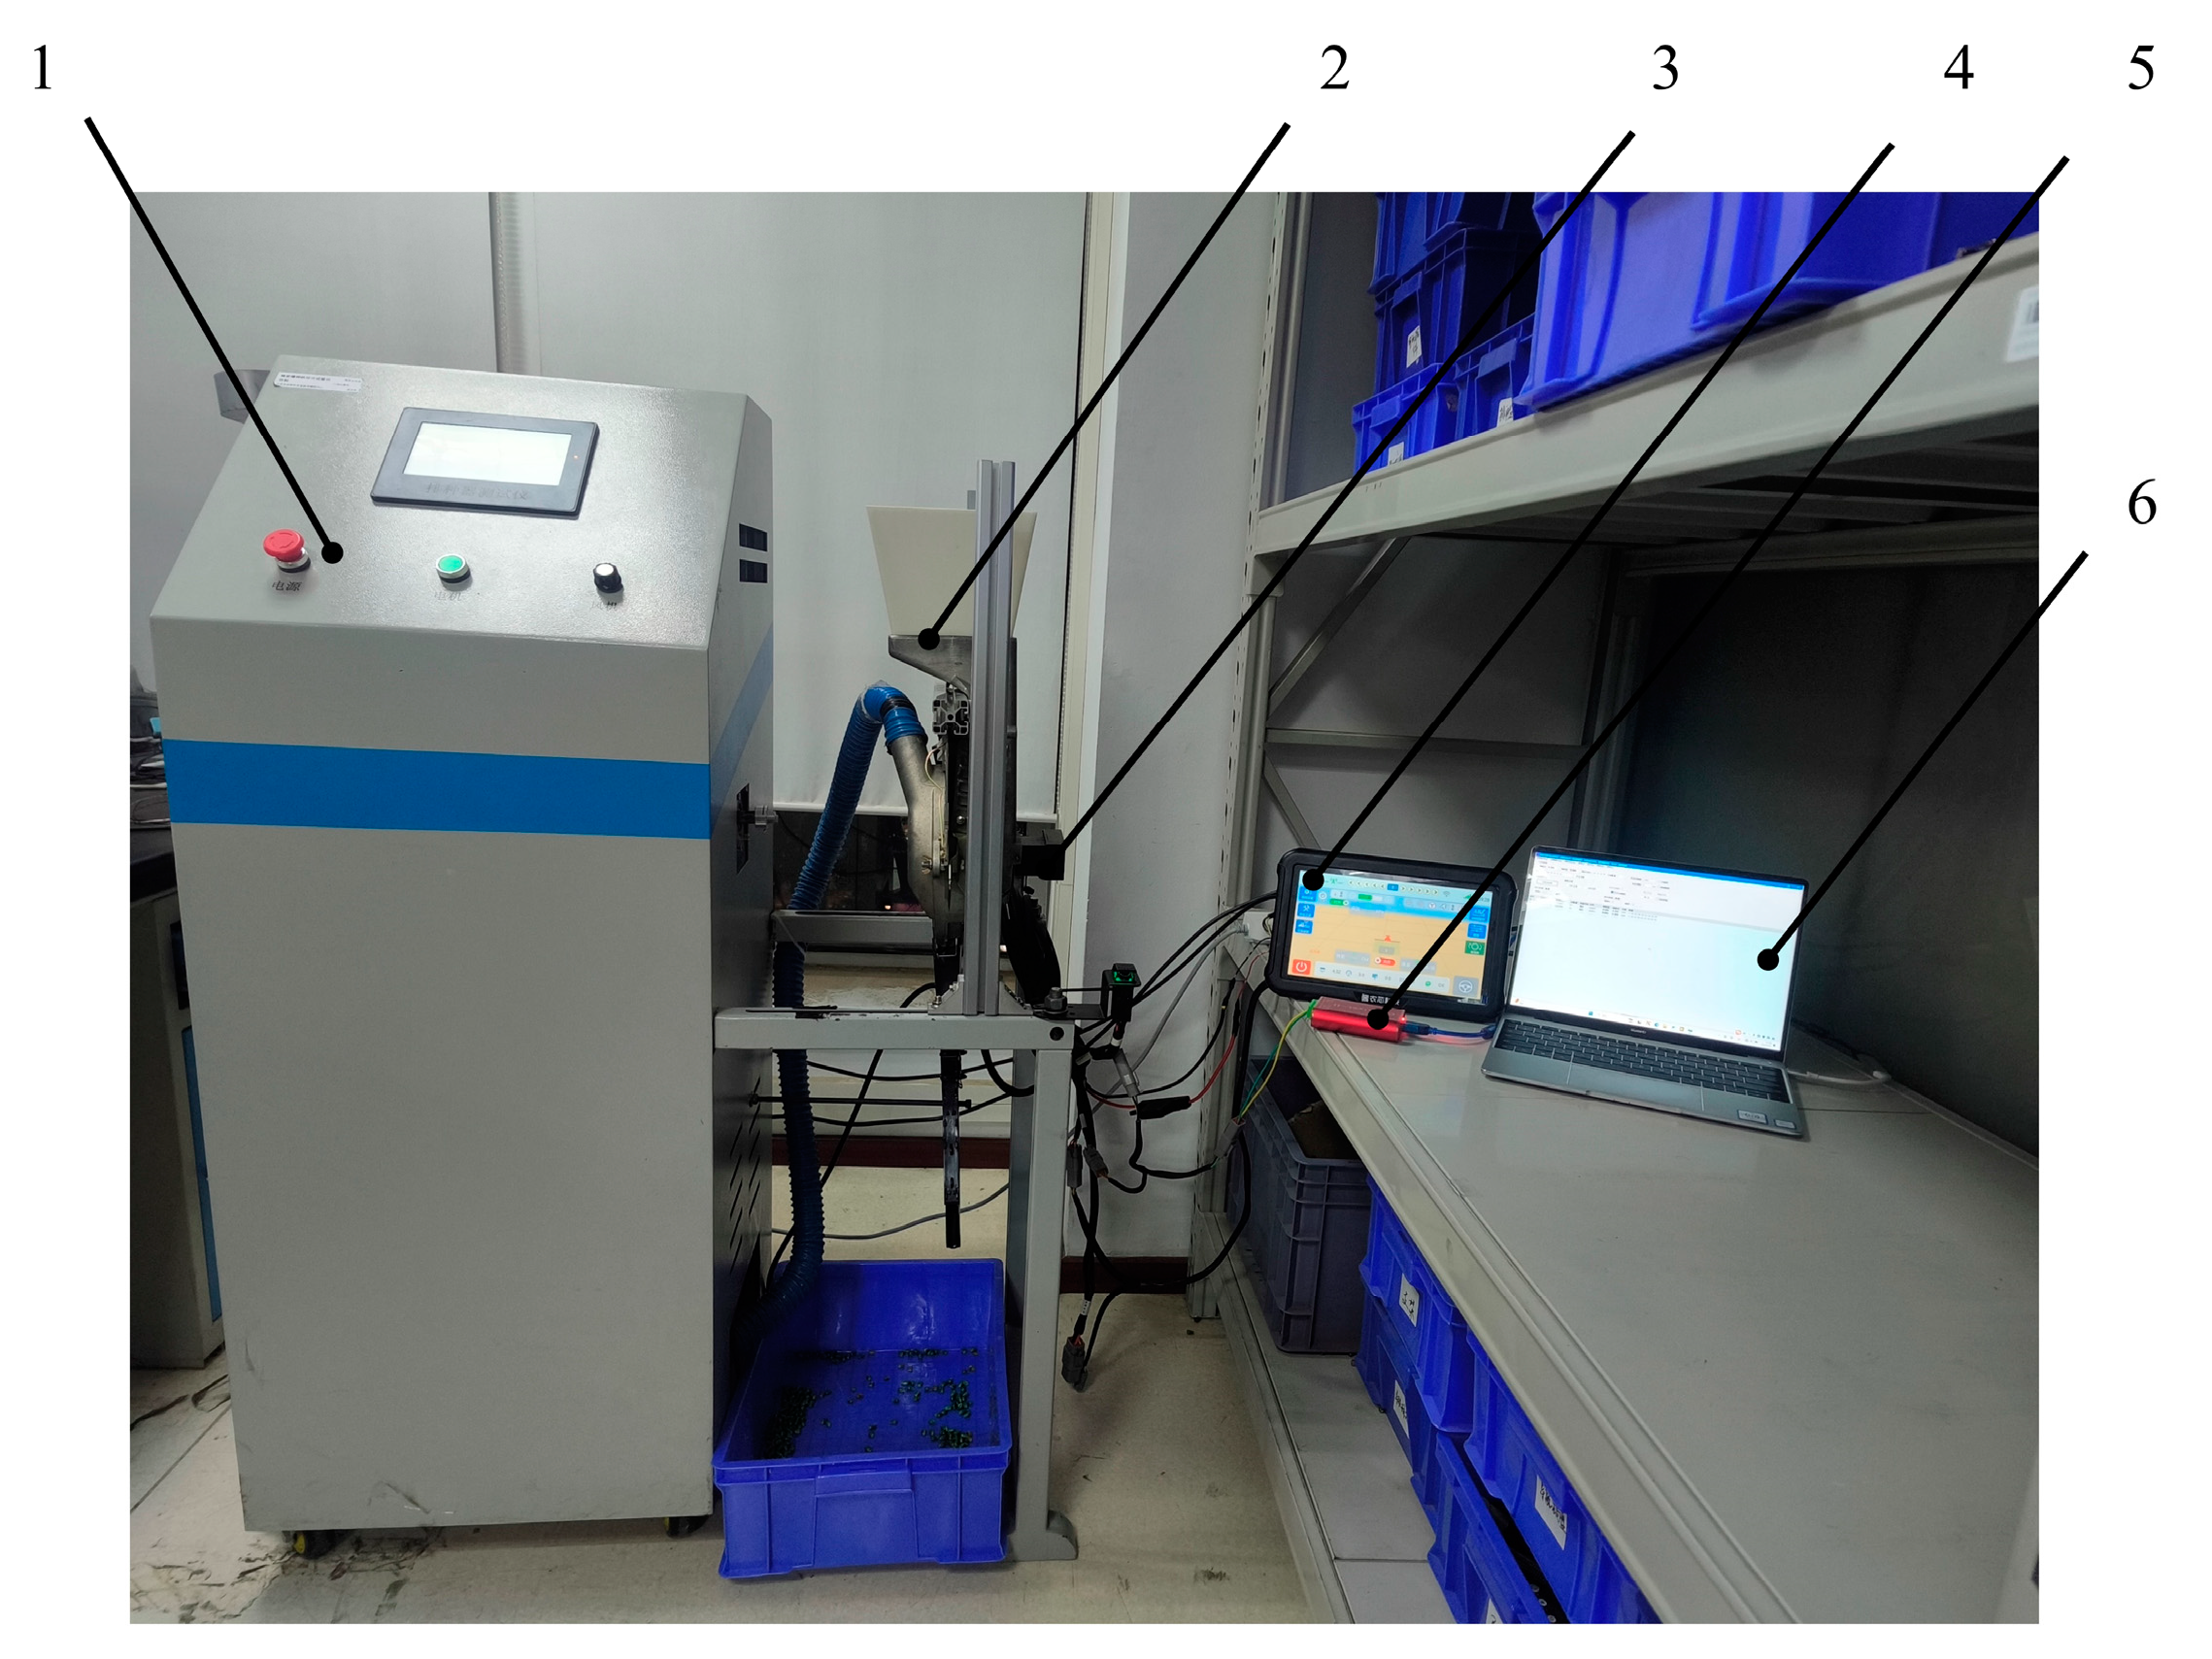
3.1. Bench Tests
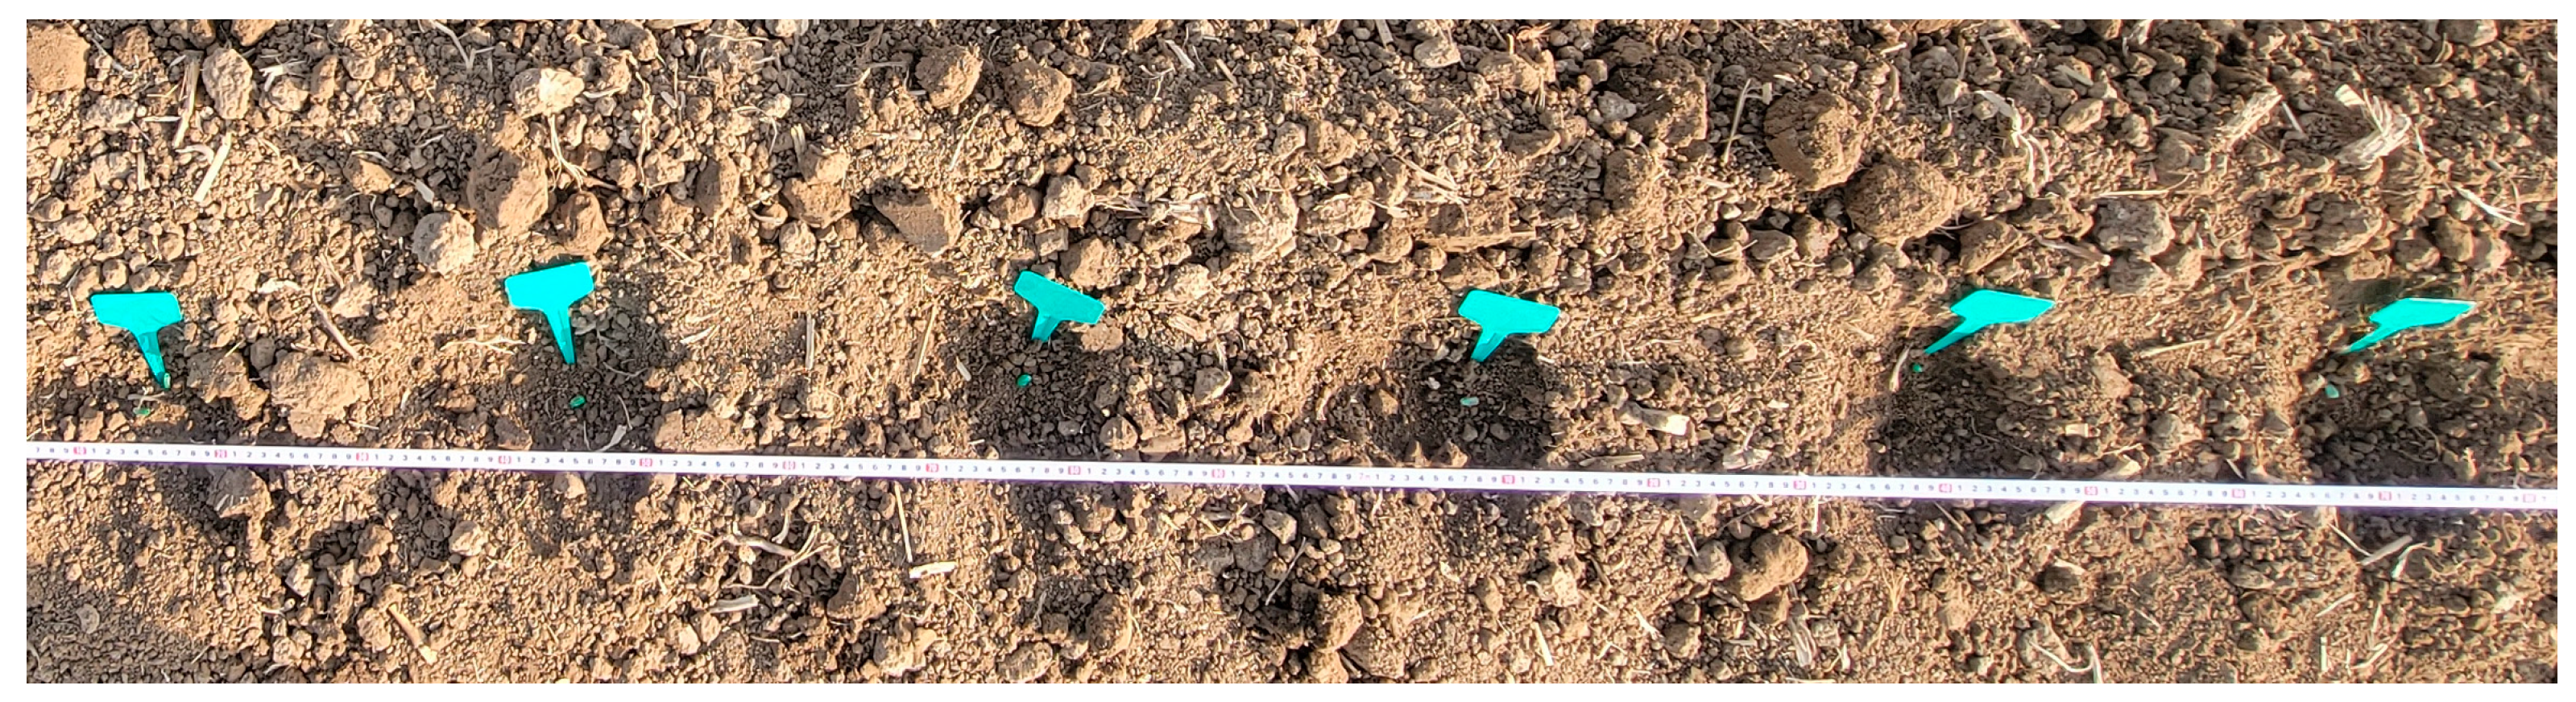
3.2. Field Tests
3.3. Evaluation Index
4. Analysis and Discussion of Results
4.1. Analysis and Discussion of Bench Tests
4.1.1. Seeding Quality of Bench Tests
4.1.2. Analysis of Variance
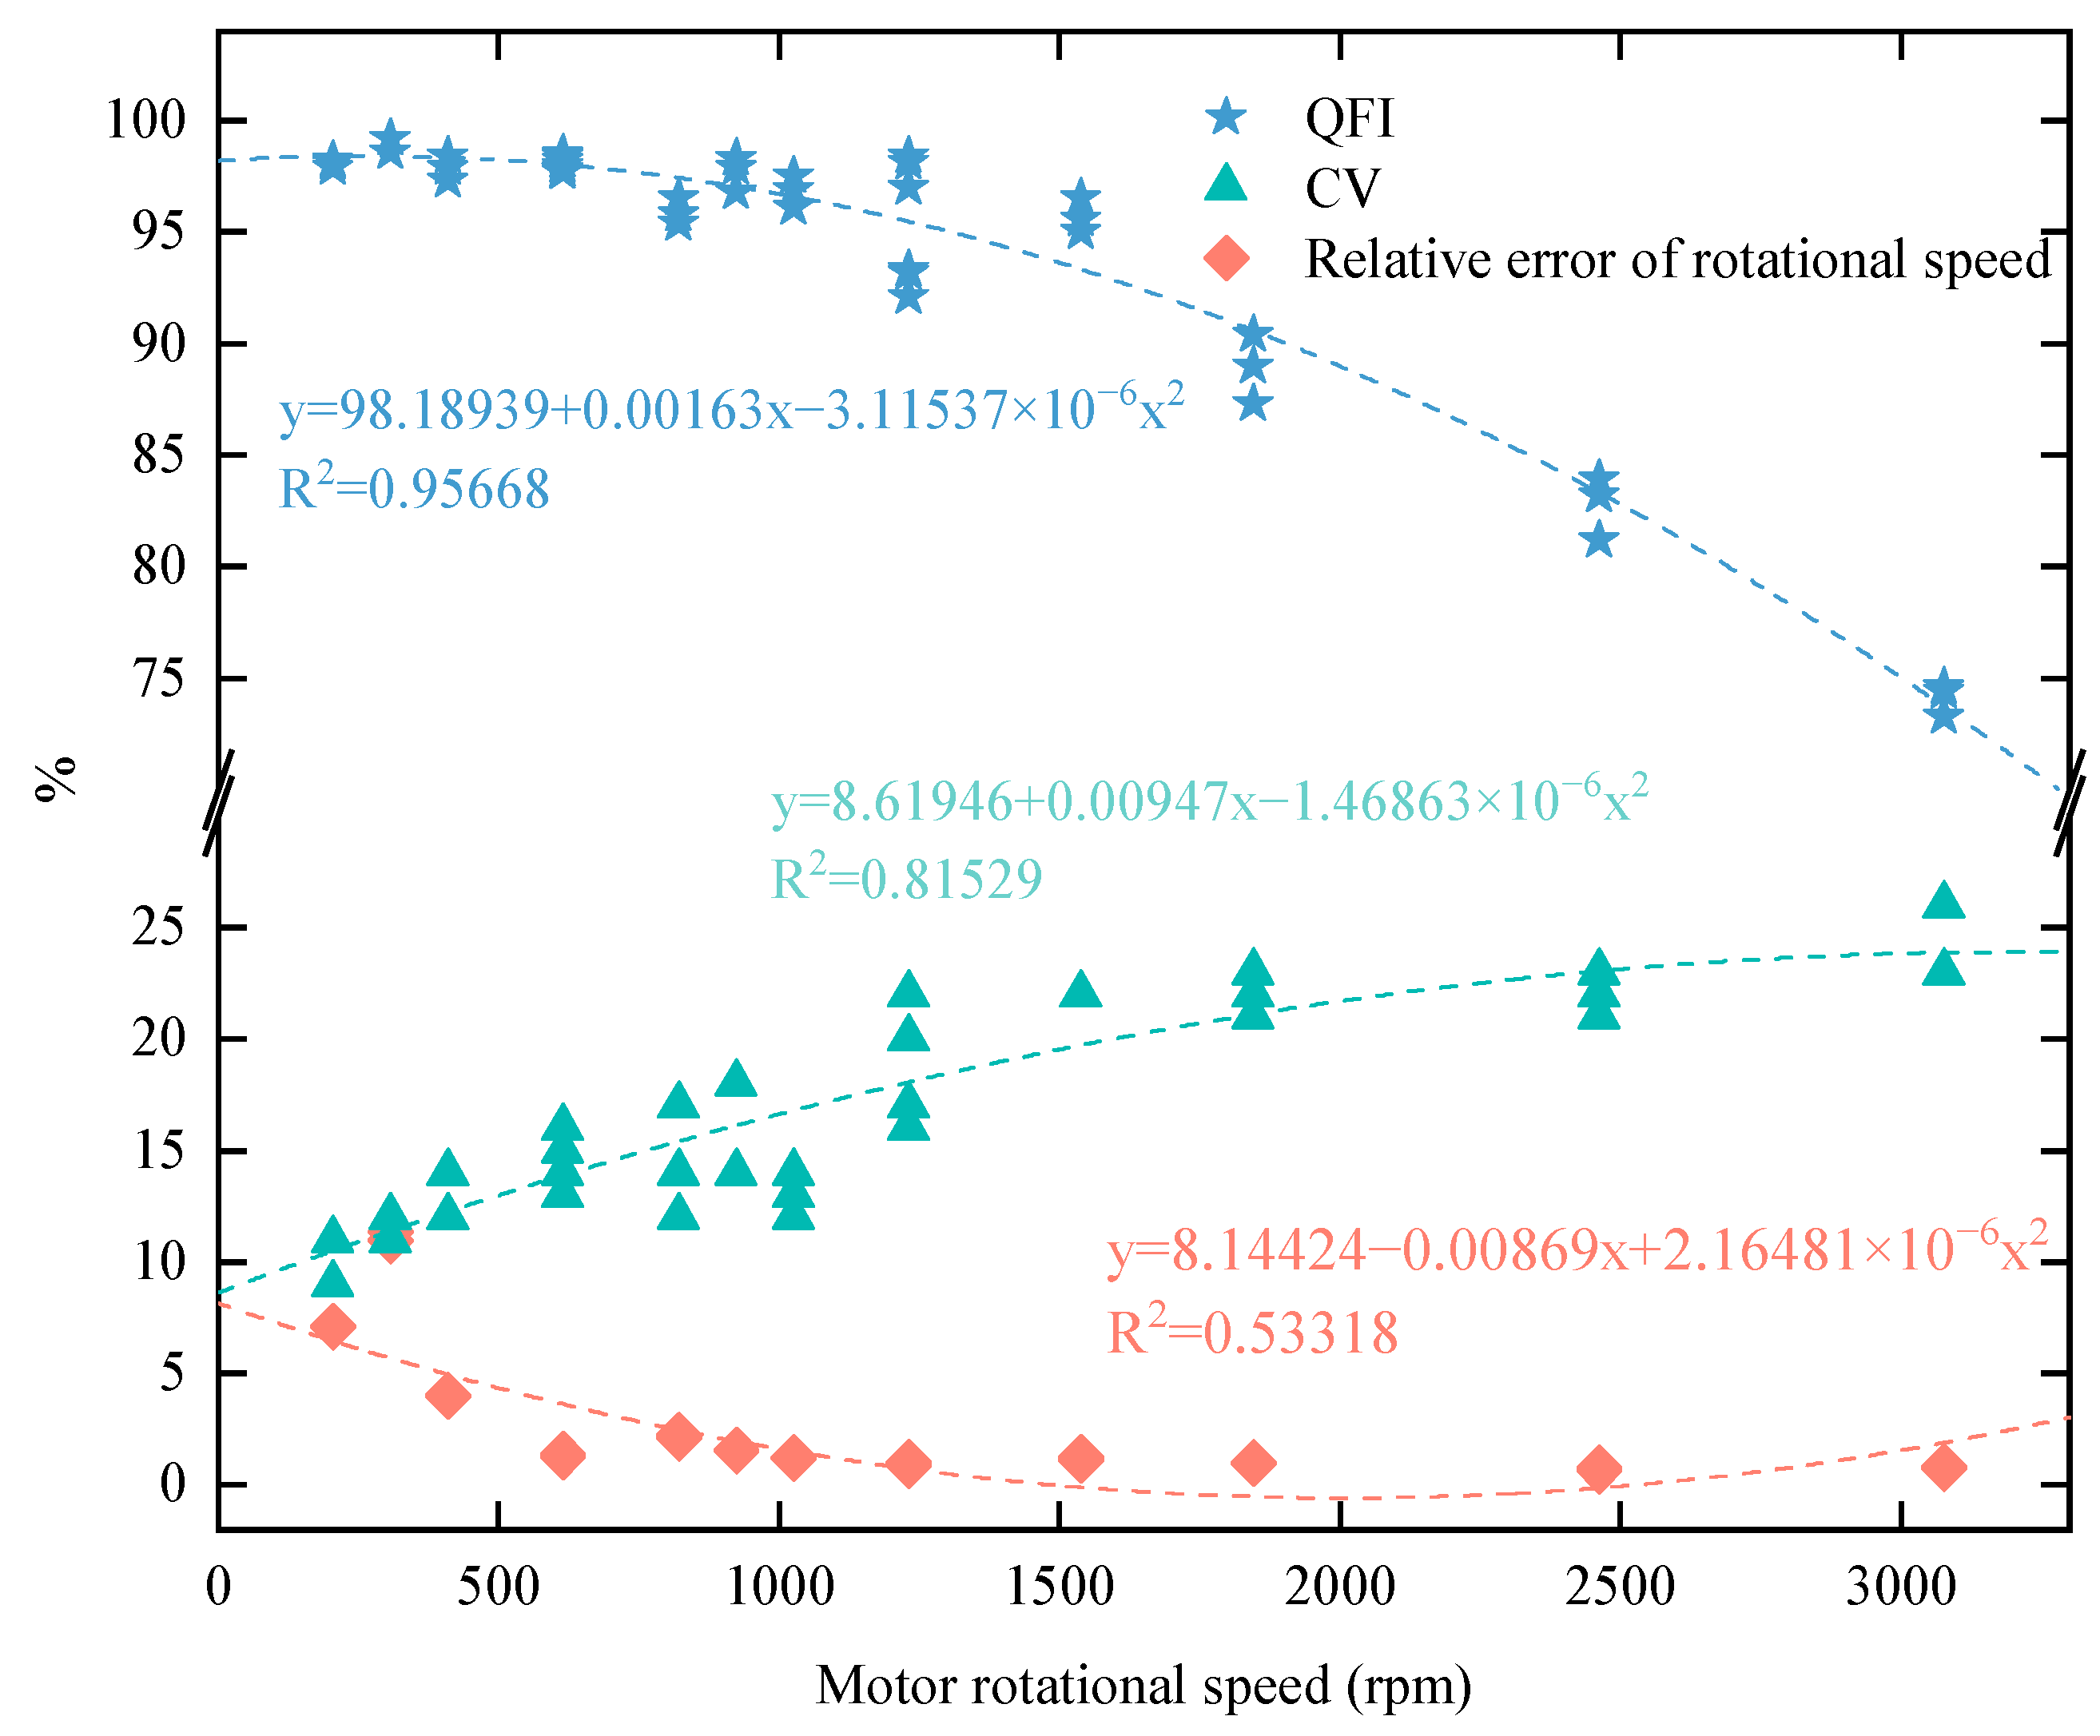
4.1.3. Accuracy Analysis of Motor Rotational Speed
4.2. Analysis and Discussion of Field Tests
4.2.1. Seeding Quality of Field Tests
4.2.2. Comparison of Bench and Field Tests Results
5. Conclusions
- To improve the expandability, seeding accuracy, and operating speed range, an EDS for a maize precision seeder was designed based on the CAN bus and FOC algorithm. A CAN bus communication protocol designed based on ISO 11783 standard can be applied to different row seeders. The seeding controller based on the FOC algorithm can effectively ensure the seeding accuracy and speed range.
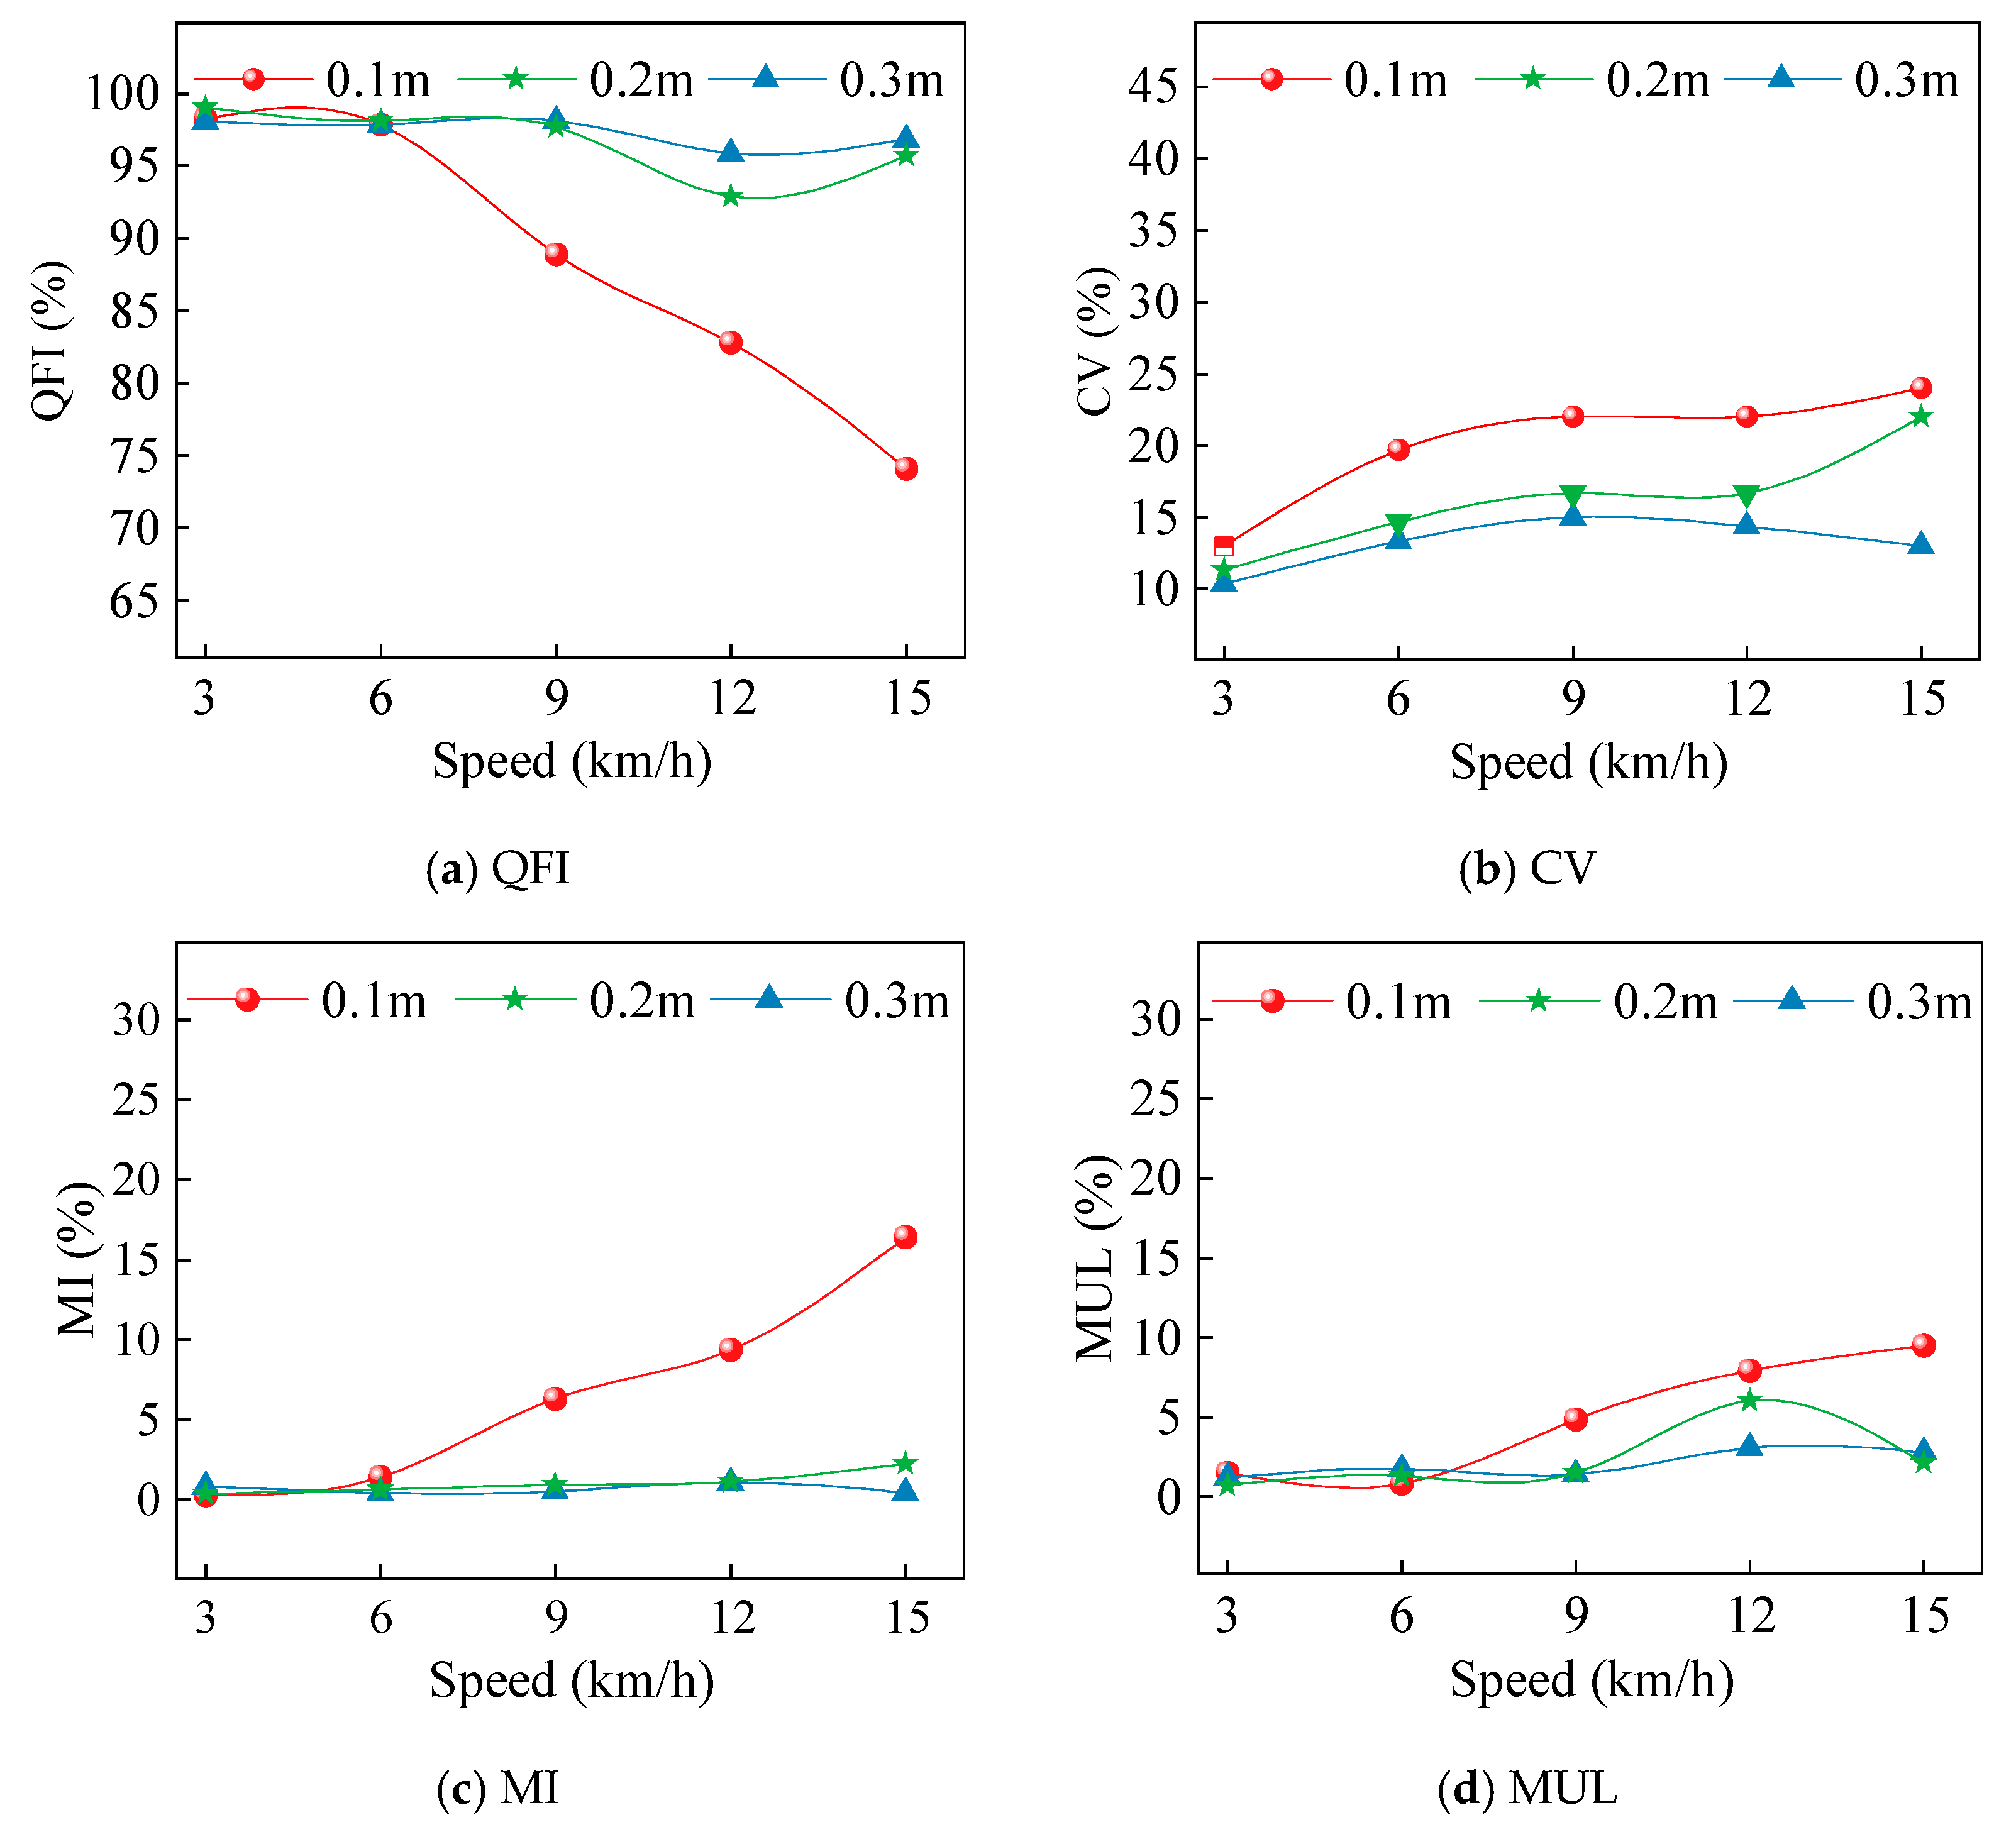
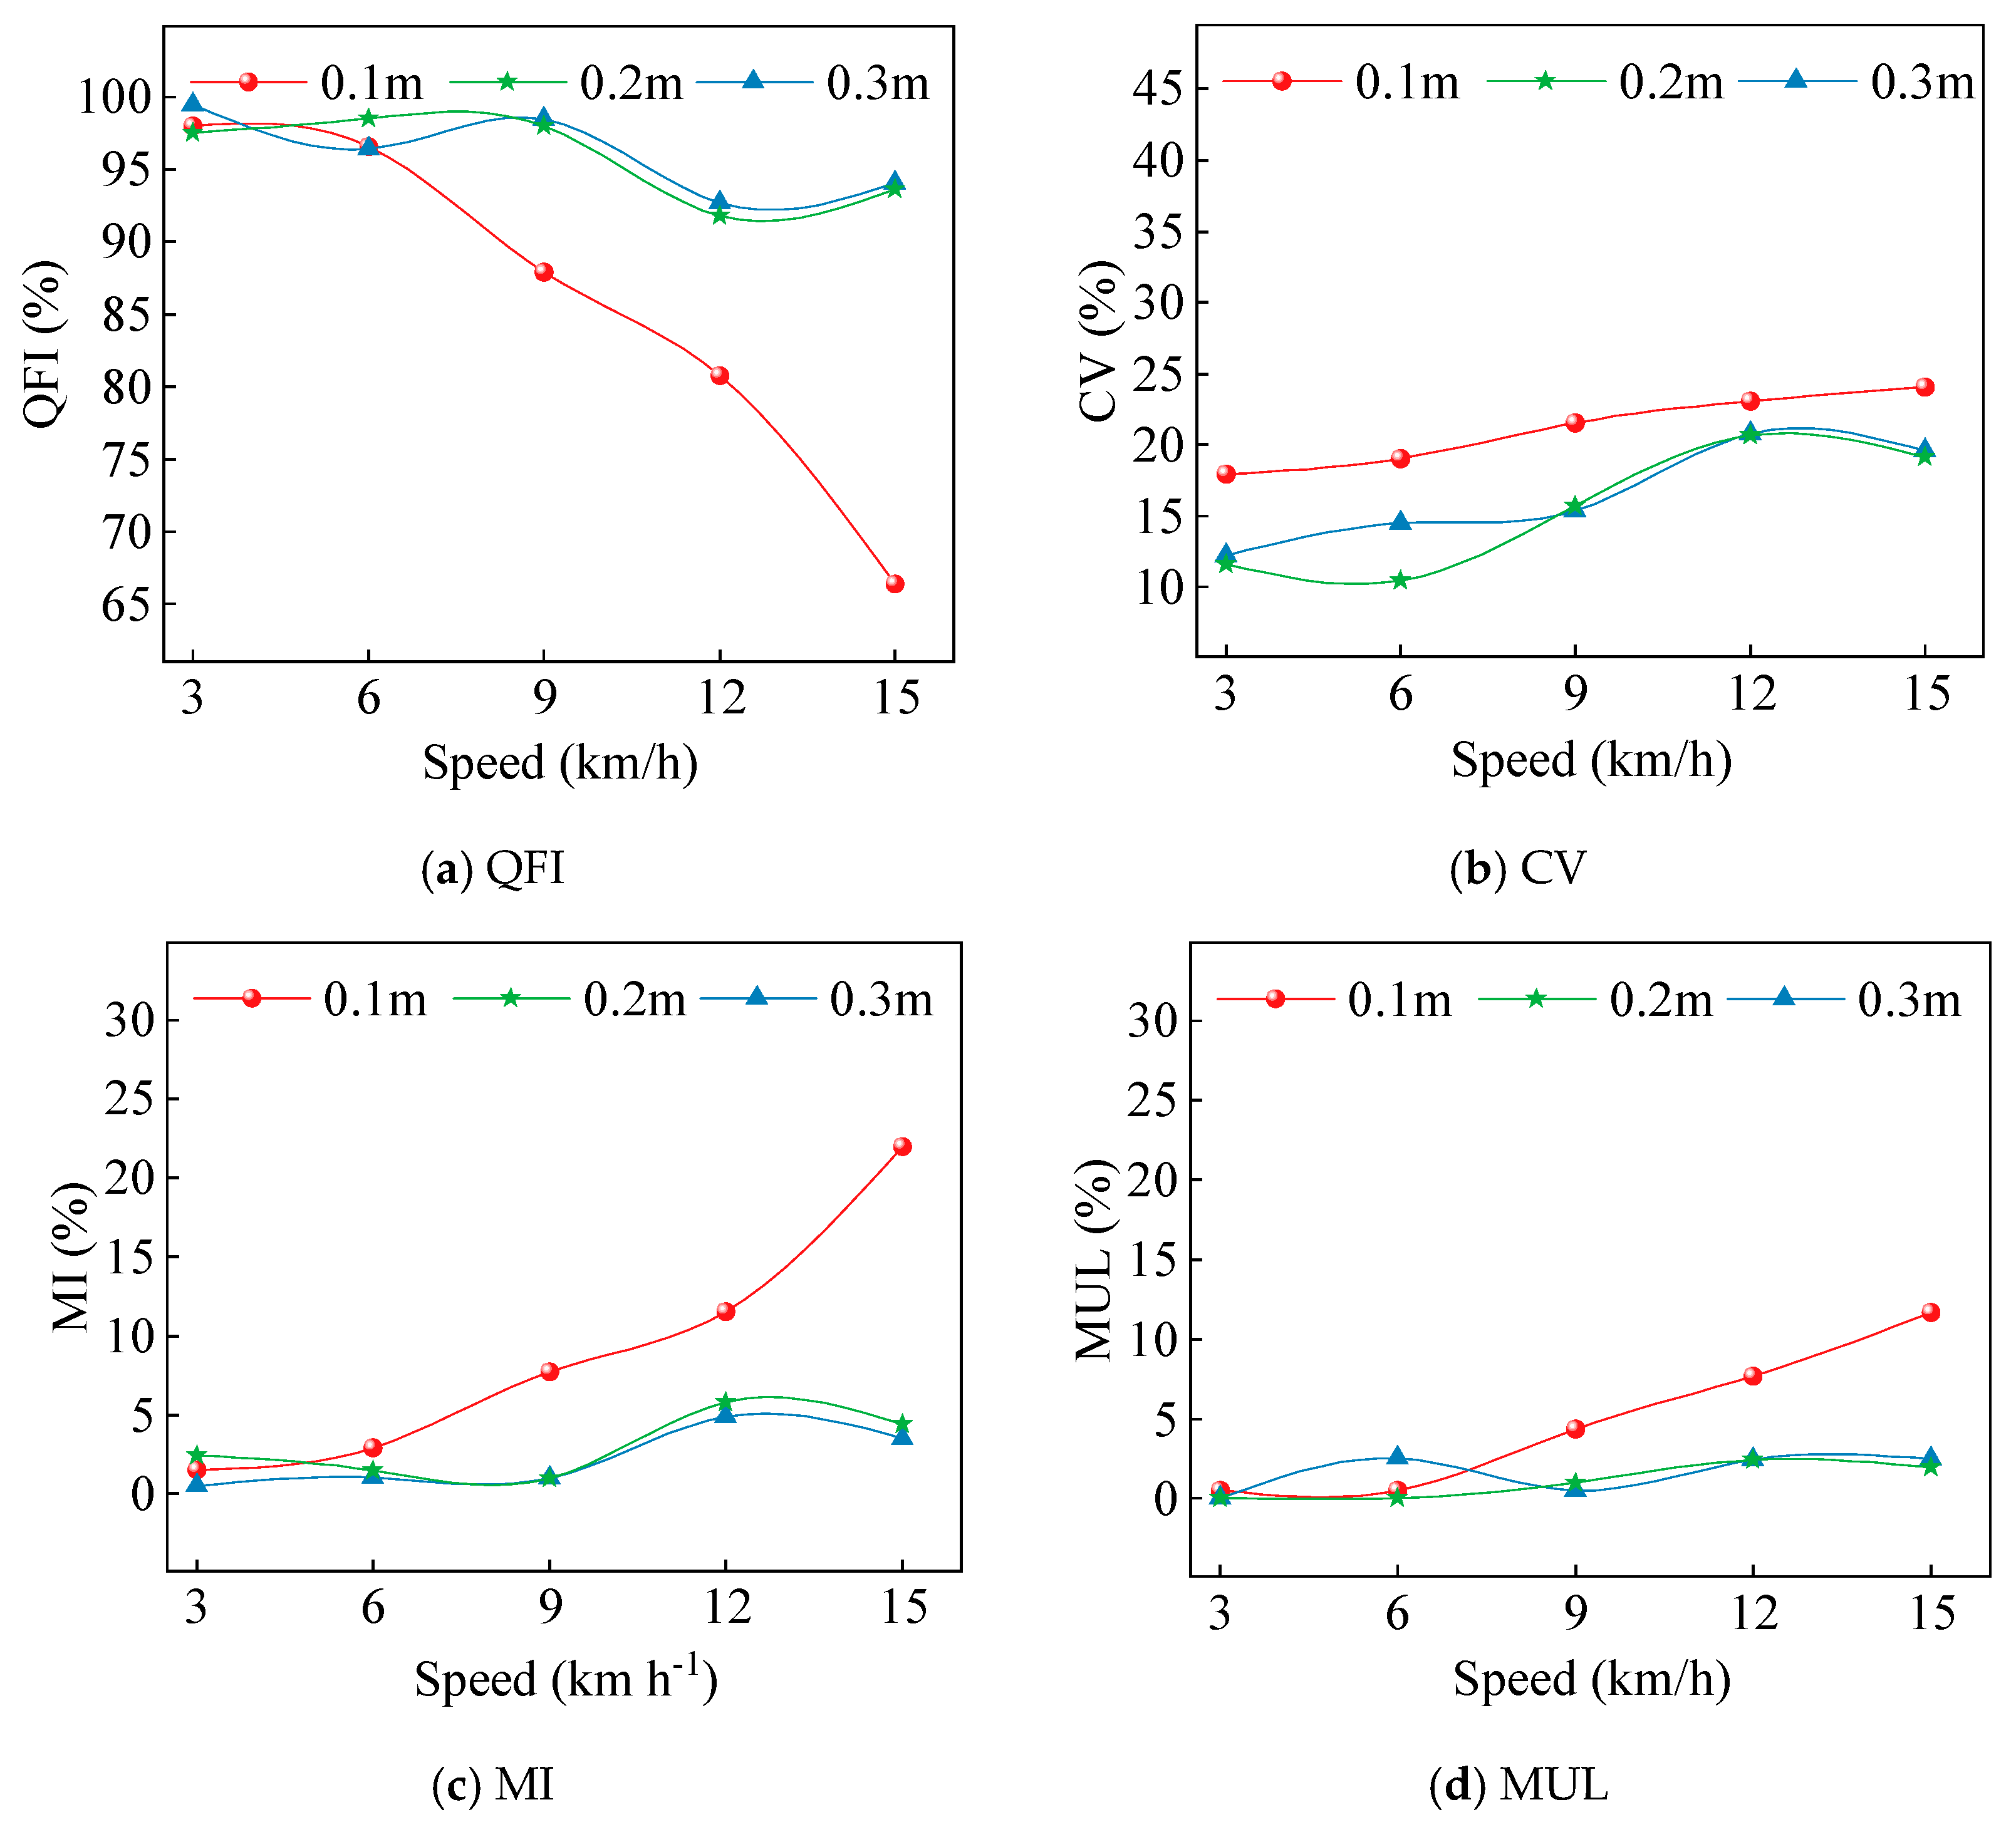
- To explore the performance of the EDS and the change rule for seeding quality, bench tests were carried out. The results of the bench tests showed that seeding quality varied inversely with operating speed and positively with seed spacing. over a range of seed spacings (0.1, 0.2, and 0.3 m) and operating speeds (3, 6, 9, 12, and 15 km/h). The average QFI at 0.1, 0.2, and 0.3 m seed spacing in bench tests was 88.38%, 96.67%, and 97.36%, with the average CV being 20.13%, 16.27%, and 13.20%.
- To explore the effect of tests factors on seeding quality, ANOVA and rotational speed accuracy were conducted based on bench tests. ANOVA showed that both operating speed and seed spacing have a significant effect on QFI and CV (p < 0.001). Both seed spacing and operating speed have a greater effect on QFI than on CV, and the effect of seed spacing on QFI and CV is greater than the effect of operating speed on QFI and CV. The analysis of motor rotational speed accuracy showed that the relative error of motor rotational speed above 410 rpm does not exceed 2.24% and the rotational speed control error has less influence on the seeding quality.
- To further determine the performance of the system, field tests were conducted. The results of the field tests showed that the average QFI was 85.93%, 95.91%, and 96.24% at 0.1, 0.2, and 0.3 m seed spacing, and the average CV was 21.12%, 15.50%, and 16.49% in the range of operating speeds of 3, 6, 9, 12, and 15 km/h. Compared with the bench tests, the average QFI at 0.1 m, 0.2 m, and 0.3 m seed spacing decreasing by 2.45%, 0.76%, and 1.12%, and the average CV increased by 0.98%, −0.77%, and 3.29%, respectively.
Author Contributions
Funding
Data Availability Statement
Conflicts of Interest
References
- Zhang, Q.; Dong, W.; Wen, C.; Li, T. Study on Factors Affecting Corn Yield Based on the Cobb-Douglas Production Function. Agric. Water Manag. 2020, 228, 105869. [Google Scholar] [CrossRef]
- Ling, L.; Wu, G.; Wen, C.; Xiao, Y.; Fu, W.; Dong, J.; Ding, J.; Meng, Z.; Yan, B. Influence of Speed Measurement Method on Performance of an Electric-Drive Maize Precision Planter. Biosyst. Eng. 2024, 238, 175–187. [Google Scholar] [CrossRef]
- Ding, Y.; He, X.; Yang, L.; Zhang, D.; Cui, T.; Li, Y.; Zhong, X.; Xie, C.; Du, Z.; Yu, T. Low-Cost Turn Compensation Control System for Conserving Seeds and Increasing Yields from Maize Precision Planters. Comput. Electron. Agric. 2022, 199, 107118. [Google Scholar] [CrossRef]
- Yang, S.; Zhai, C.; Gao, Y.; Dou, H.; Zhao, X.; He, Y.; Wang, X. Planting Uniformity Performance of Motor-Driven Maize Precision Seeding Systems. Int. J. Agric. Biol. Eng. 2022, 15, 101–108. [Google Scholar] [CrossRef]
- Wang, H.; Yang, L.; Zhang, D.; Cui, T.; He, X.; Xiao, T.; Li, H.; Du, Z.; Xie, C. Comparative Investigation and Evaluation of Electric-Drive Seed-Metering Systems across Diverse Speed Ranges for Enhanced High-Precision Seeding Applications. Comput. Electron. Agric. 2024, 222, 108976. [Google Scholar] [CrossRef]
- He, X.; Zhang, D.; Yang, L.; Cui, T.; Ding, Y.; Zhong, X. Design and Experiment of a GPS-Based Turn Compensation System for Improving the Seeding Uniformity of Maize Planter. Comput. Electron. Agric. 2021, 187, 106250. [Google Scholar] [CrossRef]
- Mishler, B.D. Quantifying Seed Uniformity and Yield Advantage of Precision Planter Technologies through Use of Field Tests and Machine Data. Master’s Thesis, Kansas State University, Manhattan, KS, USA, 2021. [Google Scholar]
- Nørremark, M.; Griepentrog, H.W.; Nielsen, J.; Søgaard, H.T. The Development and Assessment of the Accuracy of an Autonomous GPS-Based System for Intra-Row Mechanical Weed Control in Row Crops. Biosyst. Eng. 2008, 101, 396–410. [Google Scholar] [CrossRef]
- Yang, L.; Yan, B.; Zhang, D.; Zhang, T.; Wang, Y.; Cui, T. Research Progress on Precision Planting Technology of Maize. Trans. Chin. Soc. Agric. Mach. 2016, 47, 38–48. [Google Scholar] [CrossRef]
- Griepentrog, H.W. Seed Distribution Over The Area. In Proceedings of the AgEng. 1998: International Conference on Agricultural Engineering, Oslo, Norway, 24–27 August 1998; p. 98-A-059. [Google Scholar]
- Panning, J.; Kocher, M.; Smith, J.; Kachman, S. Laboratory and Field Testing of Seed Spacing Uniformity for Sugarbeet Planters. Appl. Eng. Agric. 2000, 16, 7–13. [Google Scholar] [CrossRef]
- Valentin, M.T.; Białowiec, A.; Karayel, D.; Jasinskas, A.; Ciolkosz, D.; Lavarias, J.A. Investigation of the Performance of a Cylindrical Hopper and Metering Device of a Carrot Seeder. Sci. Rep. 2023, 13, 813. [Google Scholar] [CrossRef] [PubMed]
- Kamgar, S. Eslami Design, Development and Evaluation of a Mechatronic Transmission System for Upgrading Performance of a Row Crop Planter. Int. J. Agron. Plant Prod. 2013, 4, 480–487. [Google Scholar]
- Wang, Y.; Zhang, W.; Qi, B.; Xia, Q. Comparison of Field Performance of Different Driving Systems and Forward Speed Measuring Methods for a Wet Direct Seeder of Rice. Agronomy 2022, 12, 1655. [Google Scholar] [CrossRef]
- He, X.; Cui, T.; Zhang, D.; Wei, J.; Wang, M.; Yu, Y.; Liu, Q.; Yan, B.; Zhao, D.; Yang, L. Development of an Electric-Driven Control System for a Precision Planter Based on a Closed-Loop PID Algorithm. Comput. Electron. Agric. 2017, 136, 184–192. [Google Scholar] [CrossRef]
- Wang, Y.; Zhang, W.; Qi, B.; Ding, Y.; Xia, Q. Research on Control System of Corn Planter Based on Radar Speed Measurement. Agronomy 2024, 14, 1043. [Google Scholar] [CrossRef]
- MAESTRO SV/SX. Available online: https://www.horsch.com/en-ca/products/planting/maestro/maestro-sv/sx (accessed on 10 September 2024).
- vDrive|Drive Systems. Available online: https://www.precisionplanting.com/products/planters/vdrive (accessed on 10 September 2024).
- CHRONO—International—Corporate Website. Available online: https://www.maschiogaspardo.com/en/web/international/chrono (accessed on 10 September 2024).
- Li, Y.; Xiantao, H.; Tao, C.; Dongxing, Z.; Song, S.; Zhang, R.; Mantao, W. Development of Mechatronic Driving System for Seed Meters Equipped on Conventional Precision Corn Planter. Int. J. Agric. Biol. Eng. 2015, 8, 1–9. [Google Scholar] [CrossRef]
- Cay, A.; Kocabiyik, H.; May, S. Development of an Electro-Mechanic Control System for Seed-Metering Unit of Single Seed Corn Planters Part II: Field Performance. Comput. Electron. Agric. 2018, 145, 11–17. [Google Scholar] [CrossRef]
- He, X.; Ding, Y.; Zhang, D.; Yang, L.; Cui, T.; Zhong, X. Development of a Variable-Rate Seeding Control System for Corn Planters Part I: Design and Laboratory Experiment. Comput. Electron. Agric. 2019, 162, 318–327. [Google Scholar] [CrossRef]
- Ding, Y.; Yang, L.; Zhang, D.; Cui, T.; Li, Y.; Zhong, X.; Xie, C.; Ding, Z. Novel Low-Cost Control System for Large High-Speed Corn Precision Planters. Int. J. Agric. Biol. Eng. 2021, 14, 151–158. [Google Scholar] [CrossRef]
- Yang, S.; Wang, X.; Gao, Y.; Zhao, X.; Dou, H.; Zhao, C. Design and Experiment of Motor Driving Bus Control System for Corn Vacuum Seed Meter. Nongye Jixie Xuebao/Trans. Chin. Soc. Agric. Mach. 2019, 50, 57–67. [Google Scholar] [CrossRef]
- Du, Z.; Yang, L.; Zhang, D.; Cui, T.; He, X.; Xiao, T.; Xing, S.; Xie, C.; Li, H. Development and Testing of a Motor Drive and Control Unit Based on the Field-Oriented Control Algorithm for the Seed-Metering Device. Comput. Electron. Agric. 2023, 211, 108024. [Google Scholar] [CrossRef]
- Paraforos, D.S.; Sharipov, G.M.; Griepentrog, H.W. ISO 11783—Compatible Industrial Sensor and Control Systems and Related Research: A Review. Comput. Electron. Agric. 2019, 163, 104863. [Google Scholar] [CrossRef]
- Gao, Y.; Wang, X.; Yang, S.; Zhai, C.; Zhao, X.; Zhao, C. Development of CAN-Based Sowing Depth Monitoring and Evaluation System. Nongye Jixie Xuebao/Trans. Chin. Soc. Agric. Mach. 2019, 50, 15–28. [Google Scholar] [CrossRef]
- Ramesh, P.; Umavathi, M.; Bharatiraja, C.; Ramanathan, G.; Athikkal, S. Development of a PMSM Motor Field-Oriented Control Algorithm for Electrical Vehicles. Mater. Today Proc. 2022, 65, 176–187. [Google Scholar] [CrossRef]
- Wang, X.; Liu, N.; Na, R. Simulation of PMSM Field-Oriented Control Based on SVPWM. In Proceedings of the 2009 IEEE Vehicle Power and Propulsion Conference, Dearborn, MI, USA, 7–10 September 2009; pp. 1465–1469. [Google Scholar]
- Hao, Y.; Cui, T.; Bora, G.; Zhang, D.; Wei, J.; He, X.; Wang, M.; Yang, L. Development of an Instrument to Measure Planter Seed Meter Performance. Appl. Eng. Agric. 2017, 33, 31–40. [Google Scholar] [CrossRef]
- ISO 7256-1:1984; Sowing Equipment—Test Methods Part 1: Single Seed Drills (Precision Drills). ISO: Geneva, Switzerland, 1984.
- Yan, B.; Wu, G.; Xiao, Y.; Mei, H.; Meng, Z. Development and Evaluation of a Seed Position Mapping System. Comput. Electron. Agric. 2021, 190, 106446. [Google Scholar] [CrossRef]
- Wang, S.; Zhao, B.; Yi, S.; Zhou, Z.; Zhao, X. GAPSO-Optimized Fuzzy PID Controller for Electric-Driven Seeding. Sensors 2022, 22, 6678. [Google Scholar] [CrossRef]
- Wang, Y.; Xie, W.; Chen, H.; Day-Uei, L.D. High-Resolution Time-to-Digital Converters (TDCs) with a Bidirectional Encoder. Measurement 2023, 206, 112258. [Google Scholar] [CrossRef]
- Parish, R.L.; Bracy, R.P. An Attempt to Improve Uniformity of a Gaspardo Precision Seeder. Horttech 2003, 13, 100–103. [Google Scholar] [CrossRef]


| Equipment | P | R | DP | PF | PS | SA | Parameter Group PCN | PDU Identification |
|---|---|---|---|---|---|---|---|---|
| Controller | 6 | 0 | 0 | 0xFF | 0x22 | 0x80 | 00FF22 | 18FF2280 |
| Android terminal | 2 | 0 | 0 | 0xFF | 0x23 | 0x26 | 00FF23 | 18FF2326 |
| Device | Byte1 | Byte2 | Byte3 | Byte4 | Byte5 | Byte6 | Byte7 | Byte8 |
|---|---|---|---|---|---|---|---|---|
| Controller | / | Row number | Motor/seeder lift status | Motor actual rotational speed | Motor target rotational speed | / | ||
| Android terminal | / | Row number | Motor status | Motor target rotational speed | / | / | / | |
| Test Factor | Level |
|---|---|
| Seed spacing/m | 0.1, 0.2, 0.3 |
| Operating speed/(km/h) | 3, 6, 9, 12, 15 |
| Name | Parameter |
|---|---|
| Overall dimensions/mm | 2000 × 5900 × 1800 |
| Weights/kg | 1500 |
| Working width/m | 3.9 |
| Number of rows | 6 |
| Row spacing/m | 0.65 |
| Seeding depth/mm | 50 |
| Fertilizer opener type | Double disk |
| Suppression wheel | V-shaped |
| Hitch way with tractor | Three-point suspension |
| Profiling mechanism | Machinery |
| Seed Spacing/m | Operating Speed/(km/h) | QFI/% | Average QFI/% | ED of QFI/% | CV/% | Average CV/% | ED of CV/% |
|---|---|---|---|---|---|---|---|
| 0.1 | 3 | 98.30 | 88.38 | 24.20 | 13.00 | 20.13 | 11.00 |
| 6 | 97.83 | 19.67 | |||||
| 9 | 88.90 | 22.00 | |||||
| 12 | 82.77 | 22.00 | |||||
| 15 | 74.10 | 24.00 | |||||
| 0.2 | 3 | 99.00 | 96.67 | 6.13 | 11.33 | 16.27 | 10.67 |
| 6 | 98.10 | 14.67 | |||||
| 9 | 97.67 | 16.67 | |||||
| 12 | 92.87 | 16.67 | |||||
| 15 | 95.70 | 22.00 | |||||
| 0.3 | 3 | 98.07 | 97.36 | 2.23 | 10.33 | 13.20 | 4.67 |
| 6 | 97.87 | 13.33 | |||||
| 9 | 98.13 | 15.00 | |||||
| 12 | 95.90 | 14.33 | |||||
| 15 | 96.83 | 13.00 |
| Index | Factor | SS | Df | MS | F | p |
|---|---|---|---|---|---|---|
| Seed spacing | QFI | 748.950 | 2 | 374.475 | 655.695 | 0.000 |
| CV | 362.133 | 2 | 181.067 | 94.744 | 0.000 | |
| Operating speed | QFI | 670.056 | 4 | 167.514 | 293.313 | 0.000 |
| CV | 343.200 | 4 | 85.800 | 44.895 | 0.000 |
| Seed Spacing/m | Operating Speed/(km/h) | QFI/% | Average QFI/% | ED of QFI | CV | Average CV | ED of CV |
|---|---|---|---|---|---|---|---|
| 0.1 | 3 | 98.02 | 85.93 | 31.65 | 17.94 | 21.12 | 6.08 |
| 6 | 96.59 | 19.05 | |||||
| 9 | 87.92 | 21.54 | |||||
| 12 | 80.77 | 23.05 | |||||
| 15 | 66.37 | 24.02 | |||||
| 0.2 | 3 | 97.56 | 95.91 | 6.73 | 11.61 | 15.50 | 10.22 |
| 6 | 98.52 | 10.43 | |||||
| 9 | 98 | 15.69 | |||||
| 12 | 91.79 | 20.65 | |||||
| 15 | 93.66 | 19.13 | |||||
| 0.3 | 3 | 99.5 | 96.24 | 6.82 | 12.19 | 16.49 | 8.61 |
| 6 | 96.45 | 14.49 | |||||
| 9 | 98.51 | 15.38 | |||||
| 12 | 92.68 | 20.8 | |||||
| 15 | 94.06 | 19.58 |
Disclaimer/Publisher’s Note: The statements, opinions and data contained in all publications are solely those of the individual author(s) and contributor(s) and not of MDPI and/or the editor(s). MDPI and/or the editor(s) disclaim responsibility for any injury to people or property resulting from any ideas, methods, instructions or products referred to in the content. |
© 2024 by the authors. Licensee MDPI, Basel, Switzerland. This article is an open access article distributed under the terms and conditions of the Creative Commons Attribution (CC BY) license (https://creativecommons.org/licenses/by/4.0/).
Share and Cite
Ling, L.; Xiao, Y.; Huang, X.; Wu, G.; Li, L.; Yan, B.; Geng, D. Design and Testing of Electric Drive System for Maize Precision Seeder. Agriculture 2024, 14, 1778. https://doi.org/10.3390/agriculture14101778
Ling L, Xiao Y, Huang X, Wu G, Li L, Yan B, Geng D. Design and Testing of Electric Drive System for Maize Precision Seeder. Agriculture. 2024; 14(10):1778. https://doi.org/10.3390/agriculture14101778
Chicago/Turabian StyleLing, Lin, Yuejin Xiao, Xinguang Huang, Guangwei Wu, Liwei Li, Bingxin Yan, and Duanyang Geng. 2024. "Design and Testing of Electric Drive System for Maize Precision Seeder" Agriculture 14, no. 10: 1778. https://doi.org/10.3390/agriculture14101778
APA StyleLing, L., Xiao, Y., Huang, X., Wu, G., Li, L., Yan, B., & Geng, D. (2024). Design and Testing of Electric Drive System for Maize Precision Seeder. Agriculture, 14(10), 1778. https://doi.org/10.3390/agriculture14101778