Abstract
Corn is one of the global staple grains and the largest grain crop in China. During harvesting, grain separation, and corn production, corn is susceptible to mechanical damage including surface cracks, internal cracks, and breakage. However, the internal cracks are difficult to observe. In this study, hyperspectral imaging was used to detect mechanical damage in corn seeds. The corn seeds were divided into four categories that included intact, broken, internally cracked, and surface-crackedtv. This study compared three feature extraction methods, including principal component analysis (PCA), kernel PCA (KPCA), and factor analysis (FA), as well as a joint feature extraction method consisting of a combination of these methods. The dimensionality reduction results of the three methods (FA + KPCA, KPCA + FA, and PCA + FA) were combined to form a new combined dataset and improve the classification. We then compared the effects of six classification models (ResNet, ShuffleNet-V2, MobileNet-V3, ResNeSt, EfficientNet-V2, and MobileNet-V4) and proposed a ResNeSt_E network based on the ResNeSt and efficient multi-scale attention modules. The accuracy of ResNeSt_E reached 99.0%, and this was 0.4% higher than that of EfficientNet-V2 and 0.7% higher than that of ResNeSt. Additionally, the number of parameters and memory requirements were reduced and the frames per second were improved. We compared two dimensionality reduction methods: KPCA + FA and PCA + FA. The classification accuracies of the two methods were the same; however, PCA + FA was much more efficient than KPCA + FA and was more suitable for practical detection. The ResNeSt_E network could detect both internal and surface cracks in corn seeds, making it suitable for mobile terminal applications. The results demonstrated that detecting mechanical damage in corn seeds using hyperspectral images was possible. This study provides a reference for mechanical damage detection methods for corn.
1. Introduction
Corn, along with rice and wheat, is one of the three major food crops worldwide. Corn is an indispensable raw material for light, chemical, and other industries. In 2012, the corn production in China exceeded its rice production for the first time and it has since become the largest grain crop in China [1]. Compared to rice and wheat, corn has a significantly higher grain yield [2]. Since the 21st century, the expansion of corn acreage areas has accelerated. Based on current trends, corn is expected to replace wheat as the most widely grown crop of the world by 2030 [3]. Mechanical damage is an important factor that affects the quality of corn seeds. From harvest to sowing, during mechanical harvesting, seed separation, drying, processing, and other processes [4,5,6,7], corn seeds are susceptible to mechanical damage. Common forms of mechanical damage include surface cracks, internal cracks, breaks, and other damage [8,9]. This damage shortens the shelf life of corn seeds and reduces their germination rate and seed vigor.
With the development of detection technology, an increasing number of non-destructive detection techniques have been applied to agricultural detection [10]. Spectral and imaging technologies are the most widely used methods for identifying crop seeds. Santana et al. [11] used hyperspectral sensors and machine learning to classify Asian soybean rust. Xuan et al. [12] used hyperspectral technology to determine the protein content in rice grains. Zhao et al. [13] collected images of wheat grains and achieved the rapid detection of wheat grain quality by improving the YOLOv5 model. Many studies have been conducted examining detection of corn seeds. Liu et al. [14] used visible/near-infrared spatially resolved spectroscopy to predict individual corn-seed vigor with an accuracy of 91.67%. Javanmardi et al. [15] classified corn seed varieties based on computer vision and deep learning with an accuracy of 98.1%. Based on hyperspectral imaging, Yang et al. [16] proposed a spectral and spatial attention module that enabled the detection of defective corn seeds with an accuracy of 94.56% on a test set. Yang et al. [17] used near-infrared spectroscopy combined with deep learning to determine the quality of corn, with an accuracy of 96.46%.
Mechanical damage to crop seeds is typically divided into surface and internal damage, with surface cracks and breaks being easier to detect. Wang et al. [18] proposed an improved BCK-YOLOv7 model to solve the problem of dense distribution of corn seeds during harvesting and this successfully detected broken and intact corn seeds under high-density conditions with a recognition accuracy of 96.9%. Based on the YOLOv4-small model, Li et al. [19] designed a device to detect broken grains and damaged corn seeds with an accuracy of 93%. Wang et al. [20] collected near-infrared spectra of soybean seeds, used principal component analysis (PCA) and random forest variable selection, and classified surface-cracked and normal seeds with an accuracy of 84%. In contrast to surface cracks, certain cracks arise inside corn seed, extend only to the pericarp, and are not visible on the surface [21]. These types of internal cracks are difficult to detect and can cause further harm. The detection of internal cracks requires the observation of the internal structure. This was achieved by placing a bright light source under the corn seeds and a camera above the corn to collect images. Internal crack detection in corn seeds has been achieved using deep learning [22,23]. Wang et al. [24] used near-infrared spectroscopy to detect internal cracks in rice seeds with an accuracy of 91.3%. Chen et al. [25] used an X-ray imaging system to collect maize seed images and classified damaged and intact seeds with an average accuracy of 99.66% based on the improved YOLOv8 model. X-ray microcomputed tomography (μCT) can be used to obtain high-precision three-dimensional images of samples. Dong et al. [26] observed and studied internal cracks in corn kernels using μCT and analyzed the relationship between cracks and the kernel breakage rate. Jiao et al. [27] used μCT technology to study the variation of endosperm cracks in corn seeds during soaking and proposed the R-YOLOv7-small model to determine the number and length of cracks in corn seeds. The μCT technology can capture the three-dimensional microstructure of corn seeds with good detection results, but its high costs make it unsuitable for application in agricultural production lines.
Hyperspectral imaging exhibits a wide range of applications for the detection of corn seed quality. Hyperspectral imaging combines the advantages of spectroscopy and imaging, obtains the spectral and spatial information of the target, and meets the requirements of rapid nondestructive detection [28]. Zhang et al. [29] collected the hyperspectral images of several types of corn seeds and identified corn varieties by comprehensively considering their spatial, spectral, and textural features. Zhang et al. [30] combined the spatial and spectral information of hyperspectral images and proposed a deep one-class learning network to identify counterfeit corn seeds. Qiao et al. [31] collected hyperspectral images of corn seeds, combined the spectral and textural information, and determined the starch and protein contents of corn seeds without drying. Xue et al. [32] obtained spectral images of corn seeds using hyperspectral imaging technology and achieved rapid and nondestructive detection of the moisture content of corn seeds. Regarding to the detection of corn seed quality using hyperspectral technology, few reports are available regarding the detection of mechanical damage.
Based on previous studies and an analysis of the literature, three problems have been observed regarding the detection of mechanical damage in corn seeds. First, few studies have been conducted examining the detection of internal cracks in corn seeds, and only a few have reported detection methods. Secondly, hyperspectral datasets containing mechanical damage to corn seeds are lacking, thus making it difficult to develop models suitable for detecting mechanical damage. Finally, research investigating the detection of mechanical damage to corn seed slack has identified both internal and surface cracks. In this study, hyperspectral imaging technology was used to detect mechanical damage in corn seeds. The hyperspectral image, containing both spatial and spectral information, was used to improve the detection of internal cracks and detect both internal and surface cracks.
2. Materials and Methods
2.1. Sample Preparation
The corn samples used in this study were obtained from Anhui Province. All samples were stored at room temperature in a dry area away from light. The specific process of corn seed classification is as follows:
- (1)
- Pick up a single seed and observe the appearance. If the appearance is broken, mark it as surface cracked; if the appearance is intact, proceed to the next step;
- (2)
- Place the experimental seeds flatly on the transmitted light source, move and observe the seeds to ensure that all areas of the seeds can be transmitted;
- (3)
- If cracks are observed, mark the current seed as internally cracked; if no cracks are observed, proceed to the next step;
- (4)
- Turn the seed over and repeat steps (2) and (3); if no cracks are observed, the current seed is labeled as intact;
- (5)
- Repeat the above steps until all seeds have been screened.
The 2496 kernels were divided into four categories that included intact (IN; 600 kernels), broken (BR; 552 kernels), internally cracked (IC; 720 kernels), and surface cracked (SC; 624 kernels). All seed images were divided according to the ratio of training:validation:test sets = 4:1:1 and a hyperspectral mechanical damage dataset for corn seeds was constructed. The composition of the dataset is shown in Table 1. Hyperspectral true color images of seeds of various categories are shown in Figure 1.

Table 1.
Datasets.
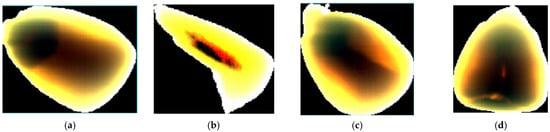
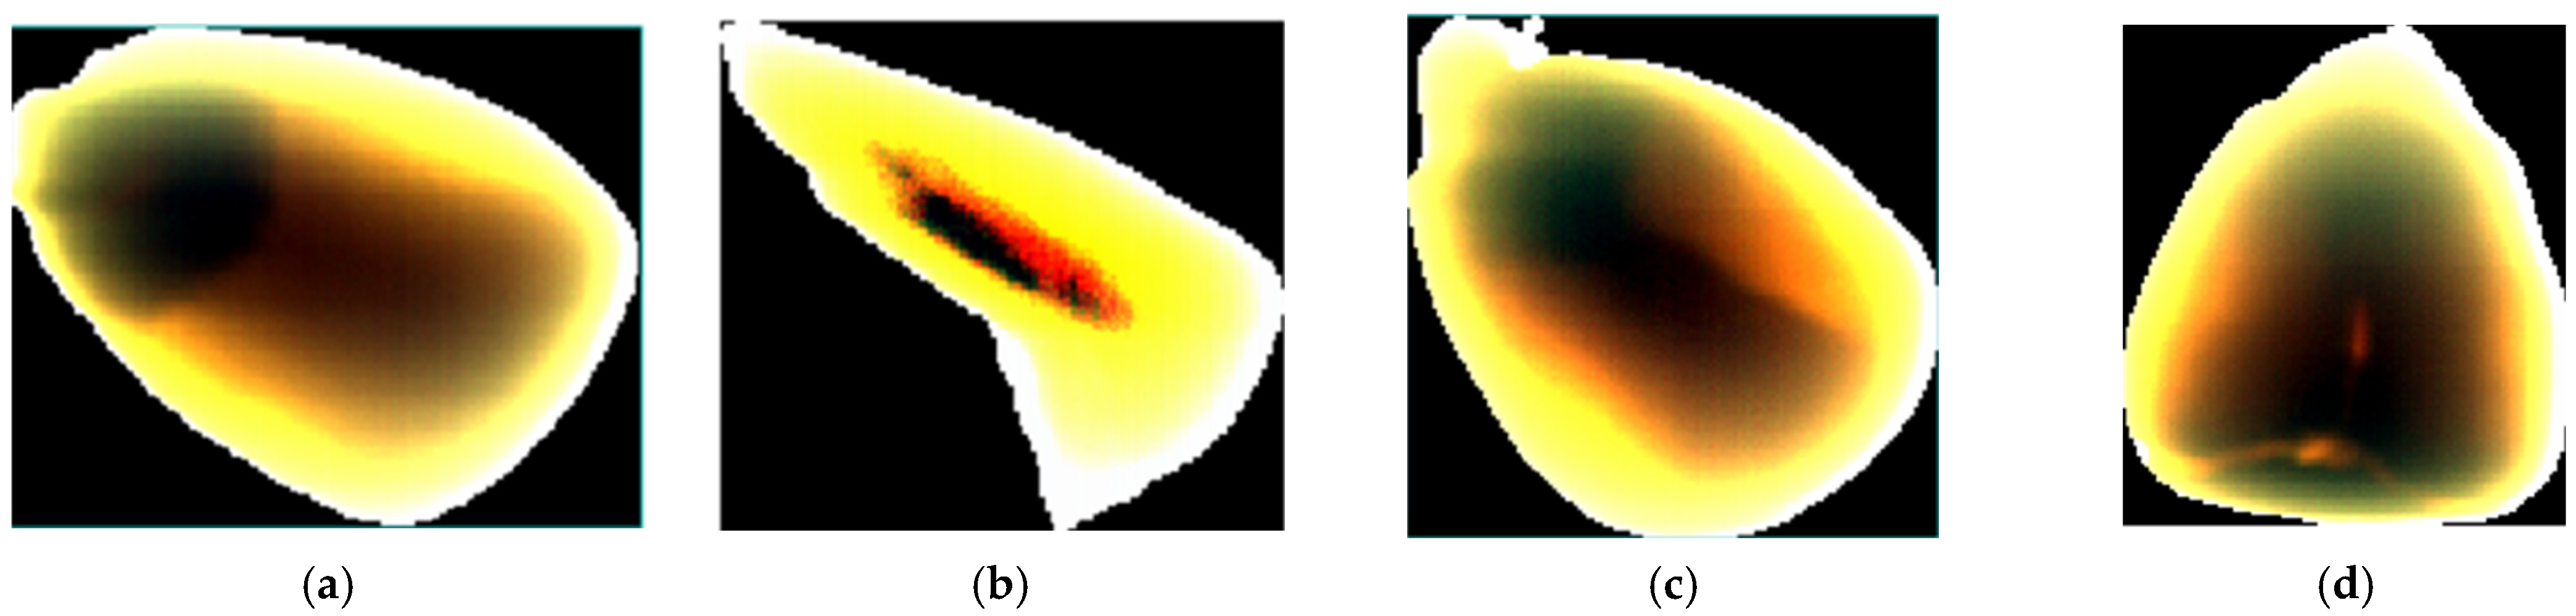
Figure 1.
Hyperspectral true-color images of corn seeds: (a) IN, (b) BR, (c) IC, and (d) SC.
2.2. Hyperspectral Image Acquisition
An HIS-VNIR-B1621 visible/near-infrared hyperspectral imaging system was used for data acquisition. The system consisted of a CCD camera (Raptor EM285CL, Raptor Photonics Incorporated, USA), 363–1025 nm spectral imager (Imspector V10E, Specim, Oulu, Finland), an IT 3900 150 W halogen light source, a mobile platform, and a dark box. The samples were then placed on a movable glass platform. A halogen lamp was placed below the glass platform, light was passed vertically through the sample, and the lens was placed above the sample. Hyperspectral imaging software Hyper Spectral Image was used to control the camera and mobile platform to acquire hyperspectral images. The image resolution was 1632 × 1232 pixels.
2.3. Hyperspectral Image Preprocessing
To eliminate the influence of ambient noise, ambient light, and dark current of the device, performing a black-white correction for the hyperspectral data was necessary. Correction was performed according to Formula (1):
where R is the corrected hyperspectral image, W is the whiteboard calibration image captured when the dark door is closed, the light source is turned on, and no sample is present; D is the blackboard calibration image taken when the dark door is closed, the light source is turned off, the lens cover is covered, and no sample is present; and R0 is the original hyperspectral image captured when the dark door is closed, the light source is turned on, and the sample is placed.
As the acquired hyperspectral image contained noisy areas around the sample, it was cropped to preserve only the sample area. As the acquired hyperspectral image exhibited noise at the beginning and end bands, these bands were removed to maintain 1113 bands in the range of 400.3854–1000.5995 nm.
2.4. Standardization
The images were standardized prior to processing. Standardization allows the original data to be proportionally shifted within a certain range, and this can improve the speed of image processing and accuracy of the results. The formula for standardization is as follows:
where x′ is the standardized image matrix, x is the original image matrix, μ is the mean of the image matrix, and σ is the standard deviation of the image matrix.
2.5. Hyperspectral Image Feature Extraction
Hyperspectral images are characterized by numerous bands. The information is rich; however, the correlation between adjacent bands is very large, resulting in significant information redundancy. Therefore, feature extraction from hyperspectral images is required [33].
2.5.1. Principal Component Analysis
PCA is a classic method for the dimensionality reduction of data [34]. PCA calculates the covariance matrix of the original data and determines the optimal projection based on the covariance matrix to identify new features, called principal components (PC). The obtained PCs were orthogonal and independent.
2.5.2. Factor Analysis
Factor analysis (FA) is a dimensionality reduction method that extracts potential common factors from multiple variables [35]. The FA examines the relationship between the original variables. The FA assumes that the presence of a few main factors among the variables affects external performance. These factors reflected most of the information in the original data without missing important information, thereby reducing dimensionality.
Compared with PCA, both seek to respond to most of the information in the original data with a few variables. Both methods seek new variables that are not present in the original variables. The difference is that the new variables identified by PCA are linear combinations of the original variables. The FA, on the other hand, decomposes the original variables to obtain common and special factors. The common factors are the factors that are common to all the original variables and the special factors are the factors that are unique to each original variable. The FA is to extract these common factors.
2.5.3. Kernel PCA (KPCA)
PCA is a linear dimensionality-reduction method [36]. KPCA is a nonlinear extension of PCA that achieves the nonlinear dimensionality reduction of data. KPCA first maps the data nonlinearly to a high-dimensional feature space, and then performs PCA on the feature space, maps the PCs back to the original space, and obtains reduced-dimensional data.
2.6. Sobel Edge Detection
To highlight the edge details of the internal and surface cracks in corn seeds, performing edge detection on a reduced-dimensional image is necessary. The Sobel operator is a classic first-order edge detection operator. The Sobel operator exhibits a low computational complexity, high accuracy, and the ability to suppress noise. The Sobel operator performs gradient detection in both horizontal and vertical directions of an image. The formula used is as follows:
where Gx and Gy are the horizontal and vertical gradient maps, A is the original image, and G is the final edge-detection image.
2.7. Laplace Edge Detection
The Laplace operator is a second-order differential operator that detects edges based on the gray value of the image. The Laplace operator is suitable for fuzzy detection. The Laplace operator is expressed as:
2.8. Linear Stretching
As the storage format of hyperspectral data is different from that of RGB image data, the pixel values of the hyperspectral image must be stretched to a range of 0–255 to save them in the RGB format. The stretching formulas are as follows:
where R is the stretched image; maxo is the maximum value of the output image, typically 255; mino is the minimum value of the output image, typically 0; maxi is the maximum value of the input image, that is the gray value corresponding to 95% in this study; mini is the minimum value of the input image, which is the gray value corresponding to 5% in this study; and gray is the gray value of a pixel.
2.9. Classification Networks
Traditional deep neural networks are equipped with deep network structures for feature extraction. These designs can improve network detection; however, the requirements for storage devices and computational resources are high. Therefore, considering practical applications, the networks chosen in this study are lightweight networks with fewer layers.
2.9.1. ResNet
The ResNet model exhibits a low network complexity and introduces residual modules that reduce the difficulty of training, speed up training, make network models easier to deploy and train, and can be better applied to devices.
ResNet was proposed by Kaiming He’s team in 2015 [37]. As the layers of the convolutional neural network become deeper, the network becomes difficult to train and tends to cause problems such as gradient explosion and gradient vanishing, that degrade the network performance. ResNet uses a residual structure to effectively alleviate these problems. ResNet has various versions, such as ResNet-18 and ResNet-152, with the main difference being the number of layers used. The ResNet-18 network was used in this study.
2.9.2. ShuffleNet-V2
ShuffleNet-V2 was proposed by the Megvii Technology (Beijing, China) team in 2018 [38]. They proposed four design guidelines for efficient networks, improved ShuffleNet-V1 based on these guidelines. Channel separation divides an input channel into two branches. The left branch was neither manipulated nor displayed identically. The right branch performs three consecutive convolutions and maintains the same input and output channels. ShuffleNet-V2 enabled efficient and accurate detection. ShuffleNet-V2-1.0x was used in this study.
2.9.3. MobileNet-V3
Google released MobileNet-V3 in 2019 [39], which added SE modules to the core blocks of MobileNet-V2 and updated its activation functions. The SE module was relatively simple. Each channel is pooled and passed through two fully connected layers to obtain the output vector. Additionally, the activation function was redesigned. This paper proposes an activation function called h-swish. Compared to the original Swish activation function, h-swish improves the inference speed of the network and is more friendly to the quantization process. The MobileNetv3-large network was used in this study.
2.9.4. ResNeSt
ResNeSt, that is, an improved version of ResNet, was proposed by Amazon’s Mu Li team (Amazon, Seattle, WA, USA) in 2020 [40]. This study proposed a split attention block and combined it with ResNet to create ResNeSt. The ResNeSt block divides the input into k parts, denoted as Cardinal 1~k, and subsequently splits each cardinal into r parts. Following these operations, kr groups were obtained. In this way, the network has many convolutional kernel branches in the same layer that extract features separately so that the network can obtain more features. The minimal network provided in the original paper was ResNeSt50. In this study, we refer to the ResNet18 network structure and constructed the ResNeSt18 network.
2.9.5. EfficientNet-V2
Google proposed EfficientNet-V2 in April 2021 [41]. In EfficientNet-v1, the authors reported that the use of Depthwise Convolutions was slow in the shallow layers of the network. Although Depthwise Convolutions possess fewer parameters and smaller floating-point operations (FLOPs), they cannot fully utilize the existing accelerators. Therefore, a fused MBConv module was proposed. This module used an accelerator to accelerate the network. The EfficientNetv2-s network was used in this study.
2.9.6. MobileNet-V4
Google launched MobileNet-V4 in 2024 [42]. The core of MobileNet-V4 is the proposed Universal Inverted Bottleneck (UIB) structure. The UIB introduces two optional depthwise convolutions into the original inverted bottleneck block, with one located before the expansion layer and the other between the expansion and projection layers. This simple change unifies several important existing modules, including the original inverted bottleneck block, ConvNext, and FFN in the ViT. A MobileNetv4-medium network was used in this study.
2.10. Overview of the Entire Methodology
As presented in Figure 2, hyperspectral images are first preprocessed after acquisition. Then, a binary mask was obtained based on the 1000.5995 nm gray scale image. Based on the mask, it is cropped to one image per seed. These seed images were divided into datasets by species and scale. Feature extraction is performed separately for each seed picture, followed by Sobel edge detection and Laplace edge detection. The image after edge detection is linearly stretched and then resized to 224 × 224 and then saved as a jpg. Each feature extraction method receives its respective corresponding jpg dataset. The corresponding jpg images obtained by different feature extraction methods are input into the six classification models. The classification results of the six models are synthesized and the three jpg datasets with the best results are filtered to form a combined dataset. The combined dataset is put into the six models and the ResNeSt model is selected by considering other metrics. The improved ResNeSt_E model is proposed on the basis of ResNeSt.
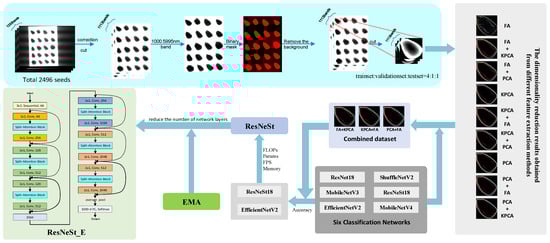
Figure 2.
Overall process.
2.11. Model Implementation
The hardware environment of the experimental platform was designed, where the CPU model was Intel® CoreTM i5-13600KF (Intel, Mountain View, CA, USA), and GPU model was NVIDIA GeForce RTX 4060 Ti (Nvidia, Santa Clara, CA, USA). The software environment used was a Windows 11 23H2 operating system, CUDA version 12.1, programming language Python 3.6, and deep learning framework Pytorch 1.10. All subsequent experiments were conducted using this platform.
2.12. Performance Evaluation
In this study, accuracy was used to evaluate the training results of the model. The accuracy was calculated as follows:
where ACC is the accuracy, TP is the number of true positive samples, TN is the number of true negative samples, FP is the number of false positive samples, and FN is the number of false negative samples.
3. Results
3.1. Creating a Dataset
To facilitate the analysis, a preprocessed hyperspectral image was processed. An image with a wavelength of 1000.5995 nm was selected. The sample exhibited a relatively clear outline in the band image. A grayscale histogram is used to separate the sample from the image, obtain an outline of each seed, and generate a binary mask. A hyperspectral image with the background removed was obtained by multiplying the binary mask by the image of all bands. The image was then cut using a binary mask to obtain the hyperspectral image of each seed. The flowchart is presented in Figure 3.
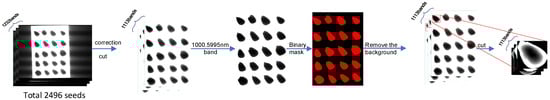
Figure 3.
Hyperspectral image processing procedure.
3.2. Hyperspectral Image Dimensionality Reduction
In this study, PCA, FA, and KPCA were used to extract features. The feature extraction process is presented in Figure 4.
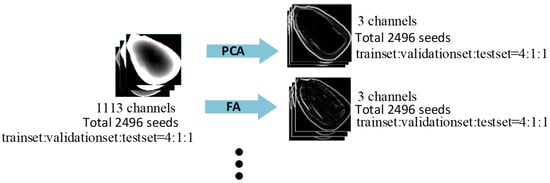
Figure 4.
Feature extraction.
3.2.1. Determination of the Number of Components
We randomly selected hyperspectral images of some seeds and downscaled them using PCA, FA, and KPCA, and the explained variance of each component calculated. Table 2 presented the results for one of the seeds. It can be seen that the cumulative explained variance of the first three components exceeds 99% in all three methods. Therefore, we set the final number of components to three.
Table 2.
Explained variance of each component.
3.2.2. Combined Feature Extraction
Considering that different feature extraction methods extract features with different emphases, combinations of two of the three methods were used to extract the features together. We first use one method to go down to some (>3) dimensions and then use another method to go to 3 dimensions. After a comparative study, we determined that we would first drop to 12 dimensions. This number of dimensions retains the majority of information and avoids the noise associated with more components.
3.2.3. Edge Detection and Linear Stretching
After feature extraction for each corn seed image, we obtain the corresponding three-channel image. First, we perform Sobel edge detection on this three-channel image. The result of Sobel edge detection is still a three-channel image. We perform Laplace edge detection on the grayscale image of each channel of this image, and then perform linear stretching so that the value of each pixel of the grayscale map is between 0 and 255. The three grayscale maps are then synthesized into a three-channel image to obtain the processed result. Finally, the synthesized image was resized to a uniform size of 224 × 224 and saved in JPG format.
3.3. Classification Results
3.3.1. Comparison of Dimensionality Reduction Methods
For the dimension reduction results obtained from different feature extraction methods, ResNet-18, ShuffleNet-V2, MobileNet-V3, ResNeSt-18, EfficientNet-V2, and MobileNet-V4 were used for training. The cross-entropy loss function was used uniformly, with a batch size of 32 and training epoch of 60. The optimizer was selected as Adam and the learning rate was adjusted using the StepLR function, where the number of learning rate decrease intervals was set to five and the learning rate adjustment multiple was set to 0.5. The results of the validation set are presented in Table 3:
Table 3.
Accuracy of the validation set.
Bold numbers in Table 3 indicate the results with the highest classification accuracy for each network. As presented in this Table, these results correspond to three feature extraction methods, including FA + KPCA, KPCA + FA, and PCA + FA. Where FA + KPCA means FA down to 12 dimensions, then KPCA down to 3 dimensions; KPCA + FA means KPCA down to 12 dimensions, then FA down to 3 dimensions; PCA + FA means PCA down to 12 dimensions, then FA down to 3 dimensions.
3.3.2. Combined Dataset
In machine vision, images are typically processed by adding noise and rotations. This enables one image to be augmented into multiple images, ultimately allowing the limited data to produce a value equal to that of the additional data. In this study, different feature extraction methods were used to extract different features from original hyperspectral images. Combining these different dimensionality reduction results enabled the classification network to obtain more features and improve the accuracy of the classification results. The above three-dimensional reduction results for FA + KPCA, KPCA + FA, and PCA + FA were combined into a new dataset. The composition of the combined dataset is presented in Table 4. Notice from Table 4 that unlike the training and calibration sets, the test set does not combine the downscaling results corresponding to the three methods but are independent of each other.
Table 4.
Combined dataset.
3.3.3. Classification Results for Combined Datasets
Six models were trained using the combined dataset. The highest accuracies in the test set corresponding to FA + KPCA, KPCA + FA, and PCA + FA are listed in Table 5.
Table 5.
Classification accuracy for the combined dataset.
As presented in Table 5, the network with the best classification performance was Efficientnetv2, with an accuracy of 98.6%, and this was followed by ResNeSt (98.3%).
3.4. Model Comparison
The accuracy of Efficientnetv2 reached 98.6% and the accuracy of ResNest reached 98.3%. The difference between the two was not significant. Therefore, we compared the two in terms of FLOPs, the total number of parameters to be trained in the network model (Params), frames per second (FPS), and the memory required for inference (memory). The results of these comparisons are presented in Table 6. Efficientnetv2 exhibited lower FLOPs than did ResNest18, whereas ResNest18 outperformed Efficientnetv2 in terms of Params, FPS, and Memory. A higher FPS indicated that more images were processed simultaneously. A smaller Memory implies that fewer resources are available. Therefore, considering practical applications, we recommend using ResNest18 as the classification network.
Table 6.
Model comparison.
3.5. Model Improvements
3.5.1. Efficient Multi-Scale Attention Module
Efficient multi-scale attention (EMA) is an efficient attention mechanism introduced in 2023 [43]. In machine-vision tasks, channel or spatial attention mechanisms can produce clearer feature representations. Based on coordinate attention (CA), the authors improved the sequential processing through a grouping structure and proposed an EMA module without dimensionality reduction. The goal of EMA is to reduce the computational cost while preserving the information of each channel. The EMA transforms parts of the channels into batch dimensions and divides the channel dimension into several subfeatures so that the spatial semantic features are evenly distributed in each feature group.
3.5.2. ResNeSt_E
Based on ResNeSt and the EMA, this study proposes an improved ResNeSt_E network, the structure of which is illustrated in Figure 5. We reduced the number of network layers of ResNeSt and added an EMA module to improve accuracy while simultaneously reducing the memory of the model and improving the FPS, and this made the model more suitable for end devices.
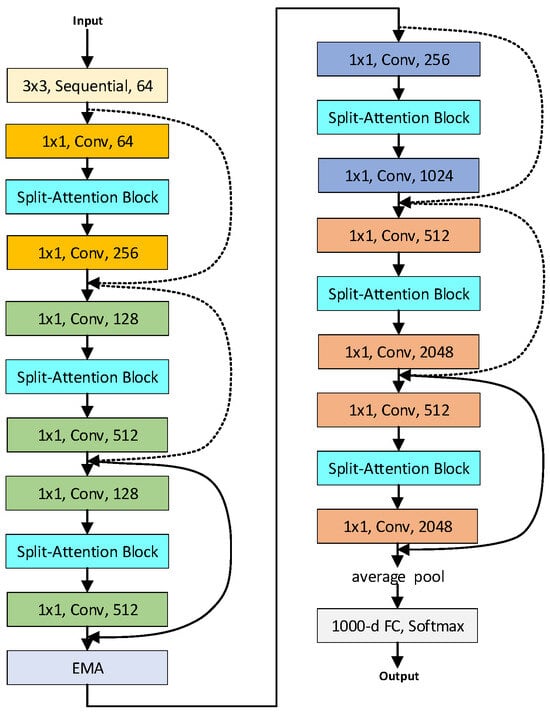
Figure 5.
Schematic depicting the functioning of ResNeSt_E.
3.5.3. Training Model
Training ResNeSt_E on the combined dataset. The hyperparameters of the training process are set as follows: the batch size is 32; the epoch is 60; the loss function is the cross-entropy loss function; the optimizer is Adam; the learning rate is adjusted by using the StepLR function; the number of learning rate descent intervals is set to 5; and the learning rate adjustment multiplier is set to 0.5. The training process and results are presented in Figure 6.
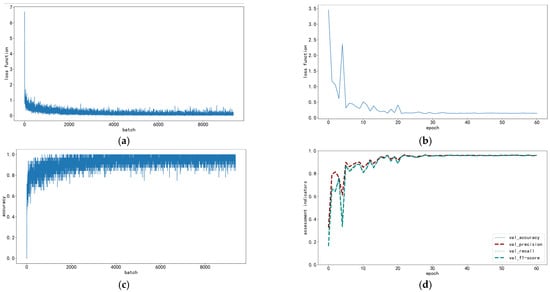
Figure 6.
Training process of ResNeSt_E on combined dataset: (a) training set loss function, (b) validation set loss function, (c) training set accuracy, (d) assessment indicators for the classification of validation set.
3.5.4. Test Set Results
The confusion matrix obtained by predicting the test set using the trained ResNeSt_E is presented in Figure 7.
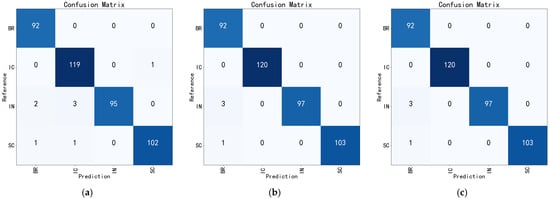
Figure 7.
Confusion matrix of ResNeSt_E on the test set: (a) FA + KPCA, (b) KPCA + FA, (c) PCA + FA.
In Figure 7, it can be concluded that the accuracy of FA + KPCA is 0.981, KPCA + FA is 0.990 and PCA + FA is 0.990. The FLOPs, Params, FPS, and Memory of ResNeSt_E were calculated and compared to those of the ResNeSt18 and Efficientnetv2 models. The results are summarized in Table 6.
As listed in Table 6, ResNeSt_E achieved the highest accuracy of 99.0%. Compared to ResNeSt18, the highest accuracy, FLOPs, Params, FPS, and Memory of ResNeSt_E were all improved. Compared with Efficientnetv2, ResNeSt_E exhibited larger FLOPs but higher accuracy and FPS, fewer parameters and less memory, and was more suitable for end devices.
3.6. Selection of Dimensionality Reduction Methods
The accuracies of the classification results of Efficientnetv2, ResNeSt18, and ResNeSt_E for KPCA + FA and PCA + FA are the same for the test set. Therefore, the operational efficiencies of the two models were compared.
For each of the four seed categories, 25 hyperspectral images were captured for a total of 100 images. KPCA + FA and PCA + FA were used to reduce the dimensionality of 100 hyperspectral images, and the completion times were compared. The results demonstrated that PCA + FA took 47.86 s and KPCA + FA took 12354.25 s. Thus, PCA + FA was much more efficient than was KPCA + FA. Therefore, when applying the trained model in practice, we recommend using PCA + FA, as that can significantly improve efficiency while ensuring accuracy.
4. Discussion
In studies that use hyperspectral images to detect crop quality, the average spectrum of each sample area is typically obtained as the spectral curve of the target, and detection is subsequently performed based on this [44,45]. In this study, cracks in corn seeds, particularly internal cracks, occupied a very small area throughout the seeds. If the average spectrum of each seed is extracted for detection, large errors are produced. Therefore, the detection in this study was primarily based on spatial texture features.
We compared the performance of the three feature extraction methods and six joint methods in each classification network and then selected three feature extraction methods that included FA + KPCA, KPCA + FA, and PCA + FA. We combined the dimensionality reduction results of the three methods into a single dataset, and this allowed the classification network to obtain more features and improve the classification results. We compared the performances of six classification networks on the combined dataset and selected two classification networks, Efficientnetv2 and ResNeSt18. We compared the accuracy of the two models, including FLOPs, Params, FPS, and memory. Although the accuracy of Efficientnetv2 was slightly higher than that of ResNeSt18, the parameters, FPS, and memory of ResNeSt18 were better than that of Efficientnetv2, and this made ResNeSt18 more suitable for application in end-devices. Therefore, we chose to improve it using ResNeSt18. We propose an improved ResNeSt_E network based on the ResNeSt and EMA modules. ResNeSt_E achieved higher accuracy with a higher number of parameters, FPS, and Memory than did Efficientnetv2.
We compare studies related to mechanical damage to crop seeds in Table 7. It can be seen that our work is of interest. We used hyperspectral imaging to identify mechanical damage in corn seeds, and we identified both internal and surface damage in corn seeds with 99% accuracy. Our study provides a reference for related work.
Table 7.
Comparison of related studies.
5. Conclusions
Hyperspectral imaging was used to identify mechanical damage in corn seeds. Few existing studies have investigated mechanical damage using hyperspectral technology for seed quality detection. Furthermore, the detection of mechanical damage in corn seeds typically involves only one aspect. For example, identification only occurs in the case of internal cracks, or only in the case of surface damage. In this study, we divided corn seeds into four categories that included intact, broken, internally cracked, and surface cracked, and we successfully identified both internal and surface cracks. We compared multiple feature extraction methods, and based on the comparison results, we recommended using three feature extraction methods (FA + KPCA, KPCA + FA, and PCA + FA) in the model training process. PCA + FA was used to apply the trained model to the device. We propose combining the dimensionality reduction results of different feature extraction methods to form a combined dataset that can provide additional features to the network during training. We compared common classical lightweight networks and proposed a ResNeSt_E classification network based on ResNeSt, that achieved 99.0% accuracy while optimizing the parameters, FPS, and memory. This study identified the mechanical damage to corn seeds and provided a new method for identifying internal and surface cracks in corn seeds. This study has some limitations. Although we considered this situation in an actual application, we could not deploy it in a terminal, and this does not represent the actual situation. This study used more spatial texture features and did not fully explore features in the spectral dimension. These shortcomings should be addressed in future studies.
Author Contributions
Writing the original draft, Writing—review and editing, Resources, Data Curation, Funding acquisition, Investigation, H.H.; Writing the original draft, Conceptualization, Methodology, Formal analysis, Software, Validation, Investigation, Y.L.; Validation, Resources, Data curation, writing—review and editing, Supervision, Project administration, and funding acquisition, S.Z. (Shiping Zhu); investigation and methodology, C.F.; Investigation, Formal analysis, S.Z. (Shaoqi Zhang); Resources, Funding acquisition, and project administration, L.S.; Project administration and resources, T.S.; Investigation, Data curation, C.L. All authors have read and agreed to the published version of the manuscript.
Funding
This work was supported by Research on Rapid Detection and Evaluation Methods for Seed Displacement Quality of Planters under the Major Science and Technology Project of Henan Province: R&D and Industrialization of Key Equipment for High-Performance Tillage, Planting, and Harvesting of Major Grain Crops funded by the Henan Provincial Department of Science and Technology (Project No. 231100110200).
Institutional Review Board Statement
Not applicable.
Data Availability Statement
The original contributions presented in the study are included in the article; further inquiries can be addressed to the corresponding author.
Acknowledgments
We would like to thank the editors and reviewers for their professional advice on this manuscript.
Conflicts of Interest
The authors declare no conflicts of interest.
References
- Deng, H.; Zheng, W.; Shen, Z.; Štreimikienė, D. Does fiscal expenditure promote green agricultural productivity gains: An in-vestigation on corn production. Appl. Energy 2023, 334, 120666. [Google Scholar] [CrossRef]
- Erenstein, O.; Jaleta, M.; Sonder, K.; Mottaleb, K.; Prasanna, B. Global maize production, consumption and trade: Trends and R&D implications. Food Secur. 2022, 14, 1295–1319. [Google Scholar] [CrossRef]
- Erenstein, O.; Chamberlin, J.; Sonder, K. Estimating the global number and distribution of maize and wheat farms. Glob. Food Secur. 2021, 30, 100558. [Google Scholar] [CrossRef]
- Hundal, J.; Takhar, P.S. Experimental study on the effect of glass transition on moisture profiles and stress-crack formation during continuous and time-varying drying of maize kernels. Biosyst. Eng. 2010, 106, 156–165. [Google Scholar] [CrossRef]
- Zheng, Z.; Ren, L.; Fu, H.; Yang, P.; Lv, L.; Xu, J.; Yang, D. Effect of glass transition on the formation of drying cracks in the component parts of maize kernels. Biosyst. Eng. 2023, 236, 131–146. [Google Scholar] [CrossRef]
- Rocha-Villarreal, V.; Hoffmann, J.F.; Vanier, N.L.; Serna-Saldivar, S.O.; García-Lara, S. Hydrothermal treatment of maize: Changes in physical, chemical, and functional properties. Food Chem. 2018, 263, 225–231. [Google Scholar] [CrossRef]
- Sun, T.; Cao, R.; Liu, J.; Wang, K. Mechanism of crack formation in corn during microwave drying process. Cereal Chem. 2024, 101, 563–576. [Google Scholar] [CrossRef]
- Kruszelnicka, W.; Leda, P.; Tomporowski, A.; Ambrose, K. Breakage behavior of corn kernels subjected to repeated loadings. Powder Technol. 2024, 435, 119372. [Google Scholar] [CrossRef]
- Shahbazi, R.; Shahbazi, F. Effects of cushion box and closed let-down ladder usage on mechanical damage during corn kernel handling: Cracking. J. Stored Prod. Res. 2022, 99, 102006. [Google Scholar] [CrossRef]
- Neri, I.; Caponi, S.; Bonacci, F.; Clementi, G.; Cottone, F.; Gammaitoni, L.; Figorilli, S.; Ortenzi, L.; Aisa, S.; Pallottino, F.; et al. Real-Time AI-Assisted Push-Broom Hyperspectral System for Precision Agriculture. Sensors 2024, 24, 344. [Google Scholar] [CrossRef]
- Santana, D.C.; de Queiroz Otone, J.D.; Baio, F.H.R.; Teodoro, L.P.R.; Alves, M.E.M.; da Silva Junior, C.A.; Teodoro, P.E. Machine learning in the classification of asian rust severity in soybean using hyperspectral sensor. Spectrochim. Acta Part A Mol. Biomol. Spectrosc. 2024, 313, 124113. [Google Scholar] [CrossRef]
- Xuan, G.; Jia, H.; Shao, Y.; Shi, C. Protein content prediction of rice grains based on hyperspectral imaging. Spectrochim. Acta Part A Mol. Biomol. Spectrosc. 2024, 320, 124589. [Google Scholar] [CrossRef]
- Zhao, W.; Liu, S.; Li, X.; Han, X.; Yang, H. Fast and accurate wheat grain quality detection based on improved YOLOv5. Comput. Electron. Agric. 2022, 202, 107426. [Google Scholar] [CrossRef]
- Liu, W.; Luo, B.; Kang, K.; Xia, Y.; Zhang, H. Non-destructive detection of single corn seed vigor based on visible/near-infrared spatially resolved spectroscopy combined with chemometrics. Spectrochim. Acta Part A Mol. Biomol. Spectrosc. 2024, 312, 124089. [Google Scholar] [CrossRef] [PubMed]
- Javanmardi, S.; Miraei Ashtiani, S.-H.; Verbeek, F.J.; Martynenko, A. Computer-vision classification of corn seed varieties using deep convolutional neural network. J. Stored Prod. Res. 2021, 92, 101800. [Google Scholar] [CrossRef]
- Yang, D.; Zhou, Y.; Jie, Y.; Li, Q.; Shi, T. Non-destructive detection of defective maize kernels using hyperspectral imaging and convolutional neural network with attention module. Spectrochim. Acta Part A Mol. Biomol. Spectrosc. 2024, 313, 124166. [Google Scholar] [CrossRef]
- Yang, J.; Ma, X.; Guan, H.; Yang, C.; Zhang, Y.; Li, G.; Li, Z.; Lu, Y. A quality detection method of corn based on spectral technology and deep learning model. Spectrochim. Acta Part A Mol. Biomol. Spectrosc. 2024, 305, 123472. [Google Scholar] [CrossRef] [PubMed]
- Wang, Q.; Yang, H.; He, Q.; Yue, D.; Zhang, C.; Geng, D. Real-Time Detection System of Broken Corn Kernels Based on BCK-YOLOv7. Agronomy 2023, 13, 1750. [Google Scholar] [CrossRef]
- Li, X.; Du, Y.; Yao, L.; Wu, J.; Liu, L. Design and Experiment of a Broken Corn Kernel Detection Device Based on the Yolov4-Tiny Algorithm. Agriculture 2021, 11, 1238. [Google Scholar] [CrossRef]
- Wang, L.; Huang, Z.; Wang, R. Discrimination of cracked soybean seeds by near-infrared spectroscopy and random forest variable selection. Infrared Phys. Technol. 2021, 115, 103731. [Google Scholar] [CrossRef]
- Wei, S.; Xiao, B.; Xie, W.; Wang, F.; Chen, P.; Yang, D. Stress simulation and cracking prediction of corn kernels during hot-air drying. Food Bioprod. Process. 2020, 121, 202–212. [Google Scholar] [CrossRef]
- Li, J.; Zhao, B.; Wu, J.; Zhang, S.; Lv, C.; Li, L. Stress-Crack detection in maize kernels based on machine vision. Comput. Electron. Agric. 2022, 194, 106795. [Google Scholar] [CrossRef]
- Zhang, Y.; Lv, C.; Wang, D.; Mao, W.; Li, J. A novel image detection method for internal cracks in corn seeds in an industrial in-spection line. Comput. Electron. Agric. 2022, 197, 106930. [Google Scholar] [CrossRef]
- Wang, L.; Wang, W.; Huang, Z.; Zhen, S.; Wang, R. Discrimination of internal crack for rice seeds using near infrared spectroscopy. Spectrochim. Acta Part A Mol. Biomol. Spectrosc. 2024, 319, 124578. [Google Scholar] [CrossRef] [PubMed]
- Chen, S.; Li, Y.; Zhang, Y.; Yang, Y.; Zhang, X. Soft X-ray image recognition and classification of maize seed cracks based on image enhancement and optimized YOLOv8 model. Comput. Electron. Agric. 2024, 216, 108475. [Google Scholar] [CrossRef]
- Dong, P.-F.; Xie, R.-Z.; Wang, K.-R.; Ming, B.; Hou, P.; Hou, J.-F.; Xue, J.; Li, C.-H.; Li, S.-K. Kernel crack characteristics for X-ray computed microtomography (μCT) and their relationship with the breakage rate of maize varieties. J. Integr. Agric. 2020, 19, 2680–2689. [Google Scholar] [CrossRef]
- Jiao, Y.; Wang, Z.; Shang, Y.; Li, R.; Hua, Z.; Song, H. Detecting endosperm cracks in soaked maize using μCT technology and R-YOLOv7-tiny. Comput. Electron. Agric. 2023, 213, 108232. [Google Scholar] [CrossRef]
- Saha, D.; Manickavasagan, A. Machine learning techniques for analysis of hyperspectral images to determine quality of food products: A review. Curr. Res. Food Sci. 2021, 4, 28–44. [Google Scholar] [CrossRef] [PubMed]
- Zhang, W.; Li, Z.; Sun, H.-H.; Zhang, Q.; Zhuang, P.; Li, C. SSTNet: Spatial, Spectral, and Texture Aware Attention Network Using Hyperspectral Image for Corn Variety Identification. IEEE Geosci. Remote Sens. Lett. 2022, 19, 5514205. [Google Scholar] [CrossRef]
- Zhang, L.; Wei, Y.; Liu, J.; An, D.; Wu, J. Maize seed fraud detection based on hyperspectral imaging and one-class learning. Eng. Appl. Artif. Intell. 2024, 133, 108130. [Google Scholar] [CrossRef]
- Qiao, M.; Cui, T.; Xia, G.; Xu, Y.; Li, Y.; Fan, C.; Han, S.; Dong, J. Integration of spectral and image features of hyperspectral imaging for quantitative determination of protein and starch contents in maize kernels. Comput. Electron. Agric. 2024, 218, 108718. [Google Scholar] [CrossRef]
- Xue, H.; Xu, X.; Yang, Y.; Hu, D.; Niu, G. Rapid and Non-Destructive Prediction of Moisture Content in Maize Seeds Using Hy-perspectral Imaging. Sensors 2024, 24, 1855. [Google Scholar] [CrossRef] [PubMed]
- Lu, B.; Dao, P.D.; Liu, J.; He, Y.; Shang, J. Recent Advances of Hyperspectral Imaging Technology and Applications in Agriculture. Remote. Sens. 2020, 12, 2659. [Google Scholar] [CrossRef]
- Bro, R.; Smilde, A.K. Principal component analysis. Anal. Methods 2014, 6, 2812–2831. [Google Scholar] [CrossRef]
- Gaskin, C.J.; Happell, B. On exploratory factor analysis: A review of recent evidence, an assessment of current practice, and recommendations for future use. Int. J. Nurs. Stud. 2014, 51, 511–521. [Google Scholar] [CrossRef]
- Schölkopf, B.; Mika, S.; Smola, A.; Rätsch, G.; Müller, K.R. Kernel Principal Component Analysis. In Proceedings of the International Conference on Artificial Neural Networks—ICANN ’97: 7th International, Lausanne, Switzerland, 8–10 October 1997. [Google Scholar]
- He, K.; Zhang, X.; Ren, S.; Sun, J. Deep Residual Learning for Image Recognition. In Proceedings of the IEEE Conference on Computer Vision and Pattern Recognition, Las Vegas, NV, USA, 27–30 June 2016; pp. 770–778. [Google Scholar]
- Ma, N.; Zhang, X.; Zheng, H.-T.; Sun, J. ShuffleNet V2: Practical Guidelines for Efficient CNN Architecture Design. In Proceedings of the European Conference on Computer Vision (ECCV), Munich, Germany, 8–14 September 2018; pp. 116–131. [Google Scholar] [CrossRef]
- Howard, A.; Sandler, M.; Chu, G.; Chen, L.C.; Chen, B.; Tan, M.; Wang, W.; Zhu, Y.; Pang, R.; Vasudevan, V.; et al. Searching for Mobilenetv3. In Proceedings of the IEEE/CVF International Conference on Computer Vision, Seoul, Republic of Korea, 27 October–2 November 2019; pp. 1314–1324. [Google Scholar]
- Zhang, H.; Wu, C.; Zhang, Z.; Zhu, Y.; Lin, H.; Zhang, Z.; Sun, Y.; He, T.; Mueller, J.; Manmatha, R.; et al. Resnest: Split-Attention Networks. In Proceedings of the IEEE/CVF Conference on Computer Vision and Pattern Recognition, New Orleans, LA, USA, 19–24 June 2022; pp. 2736–2746. [Google Scholar]
- Tan, M.; Le, Q. Efficientnetv2: Smaller Models and Faster Training. In Proceedings of the International Conference on Machine Learning, Online, 18–24 July 2021; pp. 10096–10106. [Google Scholar]
- Qin, D.; Leichner, C.; Delakis, M.; Fornoni, M.; Luo, S.; Yang, F.; Wang, W.; Banbury, C.; Ye, C.; Akin, B.; et al. Mobilenetv4-universal models for the mobile ecosystem. arXiv 2024, arXiv:2404.10518. [Google Scholar]
- Ouyang, D.; He, S.; Zhang, G.; Luo, M.; Guo, H.; Zhan, J.; Huang, Z. Efficient Multi-Scale Attention Module with Cross-Spatial Learning. In Proceedings of the ICASSP 2023—2023 IEEE International Conference on Acoustics, Speech and Signal Processing, Rhodes Island, Greece, 4–10 June 2023; pp. 1–5. [Google Scholar]
- Yuan, W.; Zhou, H.; Zhou, Y.; Zhang, C.; Jiang, X.; Jiang, H. In-field and non-destructive determination of comprehensive maturity index and maturity stages of Camellia oleifera fruits using a portable hyperspectral imager. Spectrochim. Acta Part A Mol. Biomol. Spectrosc. 2024, 315, 124266. [Google Scholar] [CrossRef]
- Wu, N.; Weng, S.; Xiao, Q.; Jiang, H.; Zhao, Y.; He, Y. Rapid and accurate identification of bakanae pathogens carried by rice seeds based on hyperspectral imaging and deep transfer learning. Spectrochim. Acta Part A Mol. Biomol. Spectrosc. 2024, 311, 123889. [Google Scholar] [CrossRef]


Disclaimer/Publisher’s Note: The statements, opinions and data contained in all publications are solely those of the individual author(s) and contributor(s) and not of MDPI and/or the editor(s). MDPI and/or the editor(s) disclaim responsibility for any injury to people or property resulting from any ideas, methods, instructions or products referred to in the content. |
© 2024 by the authors. Licensee MDPI, Basel, Switzerland. This article is an open access article distributed under the terms and conditions of the Creative Commons Attribution (CC BY) license (https://creativecommons.org/licenses/by/4.0/).