Article

Excellent Canopy Structure in Soybeans Can Improve Their Photosynthetic Performance and Increase Yield

1
College of Agronomy, Sichuan Agricultural University, Chengdu 611100, China
2
Key Laboratory of Crop Ecophysiology and Farming System in Southwest, Ministry of Agriculture and Rural Affairs, Chengdu 611100, China
*
Author to whom correspondence should be addressed.
Agriculture 2024, 14(10), 1783; https://doi.org/10.3390/agriculture14101783
Submission received: 9 August 2024 / Revised: 4 October 2024 / Accepted: 9 October 2024 / Published: 11 October 2024
(This article belongs to the Section Crop Production)

Abstract

:
In the maize-soybean intercropping system, varying degrees of maize leaf shading are an important factor that reduces the uniformity of light penetration within the soybean canopy, altering the soybean canopy structure. Quantitative analysis of the relationship between the soybean canopy structure and canopy photosynthesis helps with breeding shade-tolerant soybean varieties for intercropping systems. This study examined the canopy structure and photosynthesis of intercropped soybeans during the shading stress period (28 days before the corn harvest), the high light adaptation period (15 days after the corn harvest), and the recovery period (35 and 55 days after the corn harvest), using a field high-throughput phenotyping platform and a plant gas exchange testing system (CAPTS). Additionally, indoor shading experiments were conducted for validation. The results indicate that shade-tolerant soybean varieties (STV varieties) have significantly higher yields than shade-sensitive soybean varieties (SSV varieties). This is attributable to the STV varieties having a larger top area, lateral width, and lateral external rectangular area. Compared to the SSV varieties, the four top areas of the STV varieties are, on average, 52.09%, 72.05%, and 61.37% higher during the shading stress, high light adaptation, and recovery periods, respectively. Furthermore, the average maximum growth rates (GRs) for the side mean width (SMW) and side rectangle area (SRA) of the STV varieties are 62.92% and 22.13% in the field, and 83.36% and 55.53% in the indoor environment, respectively. This results in a lower canopy overlap in STV varieties, leading to a more uniform light distribution within the canopy, which is reflected in higher photosynthetic rates (Pn), apparent quantum efficiency, and whole-leaf photosynthetic potential (WLPP) for the STV varieties, thereby enhancing their adaptability to shading stress. Above-ground dry matter accumulation was higher in STV varieties, with more assimilates stored in the source and sink, promoting assimilate accumulation in the grains. These results provide new insights into how the superior canopy structure and photosynthesis of shade-tolerant soybean varieties contribute to increased yield.

1. Introduction

Soybeans originated in China and have been cultivated for over 5000 years. They are an important crop used for grain, oil, and feed, playing a significant role in China’s economy and in addressing food security issues [1]. However, despite economic development and significant improvements in living standards, China has long faced the issue of low soybean yields and high import volumes [2]. Therefore, increasing soybean yield per unit area has become a key issue in the development of Chinese agriculture. Increasing grain production involves expanding the planting area as a crucial factor. According to the National Bureau of Statistics (www.gov.cn/yaowen/liebiao/202312/content_6919648.htm, accessed on 1 August 2024), in 2023, China’s total arable land area was 1.914 billion mu, with grain planting covering 1.785 billion mu, accounting for 93.26% of the arable land. The possibility of significantly increasing soybean yield solely by expanding the planting area on existing arable land is minimal. The strip intercropping technology of maize and soybean effectively addresses the issue of land competition through reasonable variety pairing and suitable spatial-temporal configuration, attracting significant attention from the government.
During the symbiotic period of maize and soybean, the lower soybeans are partially shaded by the upper maize leaves, resulting in a significant reduction in the light environment for soybean growth, which in turn alters its canopy structure and related physiological indicators. Previous studies have shown that intercropped soybeans have a significantly increased plant height, leading to a much higher lodging rate [3]. The shaded environment inhibits soybean branching development, significantly downregulating the expression of GmSMXLs genes, among other effects [4]. Related physiological traits change with alterations in the canopy structure; for instance, the net photosynthetic rate (Pn), transpiration rate (Tr), and stomatal conductance (Gs) of intercropped soybeans all decrease significantly [5]. Additionally, crop phenotypic traits are influenced by the interaction between their own genes and the environment, evolving throughout the growth period [6,7].
In the past, crop phenotypic research primarily relied on traditional manual measurements, which were limited to destructive measurements of traits such as plant height, stem thickness, and leaf thickness. These methods were time-consuming, labor-intensive, and subject to significant human bias. However, with the rapid advancements in genomics, bioinformatics, and big data computation, the study of crop phenotypes has progressed. Researchers have begun to develop and utilize high-throughput phenotyping platforms to acquire relevant plant phenotypic characteristics. These platforms are used to explore the interaction between crop growth environments and genes, identify regulatory windows and growth-limiting factors, guide the correct implementation of cultivation practices, and establish cultivation technology systems aimed at achieving “super-high-yield plant types”. Current research has employed advanced sensor and image analysis technologies to acquire more phenotypic information, offering advantages such as full automation, high efficiency, precision, and non-destructive measurement [8,9]. Among various sensors, visible light cameras have become the most frequently used by phenotypic researchers due to their low cost and wide applicability [10].
There are two methods for measuring the crop photosynthetic rate: closed-circuit and open-circuit. Traditionally, leaf photosynthetic rates have been measured using the open-circuit method under artificially set saturated light conditions, which overlooks the microclimatic differences within the canopy when compared to canopy photosynthesis [11]. It is well known that canopy photosynthesis is not merely the sum of the photosynthesis of individual leaves but is inferred through the interactions between leaves [12]. To address the challenges of measuring leaf photosynthetic rates, the plant gas exchange testing system (CAPTS) was developed to quantitatively assess the canopy photosynthetic activity of whole plants under actual field conditions, offering the advantage of full automation [13]. Research indicates that canopy photosynthesis is more beneficial for studying ideal plant types with high photosynthetic efficiency, which is closely related to high yield potential [14,15].
Multiple studies have shown that the net photosynthetic rate of plant leaves in shade intensity areas responds linearly to photosynthetically active radiation, with the slope reflecting the apparent quantum efficiency (AQE) [16]. Generally, the greater the AQE, the lower the light compensation point, and thus the stronger the plant’s ability to respond to the light environment [17]. The size of the AQE can be used to assess a crop’s adaptability to shaded environments, which has rarely been reported in the field of soybean research.
The coordination between the source (leaves), flow (transport of photosynthetic products), and sink (grains) is fundamental for achieving super high-yield crops [18,19]. The light energy required during the yield formation process mainly comes from solar energy, but only a small portion of solar energy is converted into light energy that plants can absorb and utilize, with a conversion efficiency of just 1–2%. Most of the light energy is intercepted by various factors [20]. Achieving the goal of super high soybean yield depends on an efficient utilization of light energy [21]. Photosynthetic efficiency and the canopy structure determine the overall utilization of light energy by the crop population, making the canopy structure a decisive factor influencing crop yield. Previous studies on crop yield contribution have primarily focused on leaf tissues or other individual tissues. There has been relatively little research on the contribution and reactivation rate of each above-ground organ (including both vegetative and reproductive organs) to yield formation, making it difficult to evaluate the main reasons for yield formation. Therefore, studying the yield contribution rate of different soybean organs is important for balancing the growth of vegetative organs and the development of reproductive organs, providing a valuable research perspective for improving soybean yield.
Previous studies have obtained numerous plant structure parameters, such as plant height [22] and branching angle [23], using traditional methods to assess soybean plant structure characteristics and indirectly predict the light interception area. This approach is nearing maturity in traditional research fields. However, in the long term, this method has significant subjective bias and is insufficient for the large-scale measurement of plant phenotypic traits. Therefore, high-throughput phenotyping technology has emerged as a superior solution [24,25]. Additionally, there has been an increasing focus on studying soybean photosynthesis throughout the entire growth period under varying light environments in intercropping systems. However, most of these studies are based on measurements of single-leaf photosynthesis, overlooking the interaction between photosynthetic tissues and external microclimates. Numerous studies have shown that combining the canopy structure with canopy photosynthesis can accelerate the breeding of superior varieties [26,27,28]. Currently, there is a lack of research that integrates the canopy structure and canopy photosynthesis to explain the yield advantages of shade-tolerant soybeans within the corn-soybean intercropping system.
Based on this, this study investigates the dynamic changes in the canopy structure and canopy photosynthesis during the “three phases” of soybean growth within a corn-soybean intercropping system, utilizing high-throughput technologies to measure and validate relevant traditional traits. By combining the canopy structure, canopy photosynthesis, and related traditional agricultural indicators, the study reveals the physiological mechanisms of shade tolerance. Indoor shading experiments focus on exploring the phenotypic and physiological differences among various shade-tolerant soybean types during the shading period, further elucidating the outstanding yield performance of shade-tolerant soybean varieties and providing new insights for selecting high-yield, shade-tolerant soybean cultivars.

2. Materials and Methods

2.1. Experimental Design

This study selected soybean varieties with significant differences in shade tolerance and plant type structure. Shade-tolerant varieties included ND12 (STV-1) and NJQP (STV-2), while shade-sensitive varieties included C103 (SSV-1) and BYH (SSV-2) [29]. Field experiments were conducted in 2023 at the Modern Agricultural Research and Development Base of Sichuan Agricultural University, Chongzhou City, Chengdu, Sichuan Province (103.40° E, 30.39° N). Indoor experiments were carried out in 2024 at the Chongzhou Greenhouse.
The experimental field planting modes included soybean-maize intercropping and soybean monoculture (Figure 1). The maize variety used was Zhongyu No. 3 (semi-compact type), and normal field management was conducted after sowing. Intercropped potted soybeans were placed in the wide rows of maize, while monoculture soybeans were uniformly placed on the open ground. For each treatment, pots with a top diameter of 25 cm, a bottom diameter of 20 cm, and a height of 25 cm were used, each filled with 10 kg of soil. The field sowing date was 8 June 2023, with 5 soybean seeds sown per pot and thinned to 1 plant per pot after emergence. A total of 24 pots per soybean variety were used for the canopy structure and photosynthetic dynamics monitoring throughout the growth period, and 480 pots for destructive sampling at various stages. Maize was harvested 50 days after soybean sowing.
Due to the presence of numerous uncontrollable factors in the field environment, this study integrated indoor experiments for validation purposes. The environmental parameters in the greenhouse were set as follows: daytime temperature of 25 °C; nighttime temperature of 20 °C; a light period of 12.5 h; and relative humidity maintained at 65 ± 5%. The same soybean varieties used in the field experiment were selected for the indoor experiment. Seeds with a uniform size and fullness were planted in a substrate consisting of PINDSTRUP soil mixed with vermiculite at a ratio of 3:1. After seeding, two light conditions were established until 50 days after emergence (to coincide with the field shading and re-lighting periods): normal light (NL) with intensities of 527.83 ± 1.76 µmol·m−2·s−1 (red light: 309.51 ± 0.86 blue light: 101.13 ± 0.46), and shade treatment (ST) with intensities of 230.57 ± 2.86 µmol·m−2·s−1 (red light: 134.77 ± 1.53, blue light: 44.50 ± 0.71). After 50 days, the shade treatment was adjusted to normal light. To simulate the light environment under field intercropping conditions, ST was set to 40% of NL.

2.2. Canopy Structure Acquisition

Using the high-throughput phenotyping platform developed by our research group [30], RGB imaging was conducted at specific stages of soybean growth both in the field and indoors (the details are specified in Table 1). Each imaging session yielded 6 side-view images and 1 top-view image per treatment (Figure 1), resulting in a total of 336 raw images collected during the experiment. Subsequently, these raw images were processed and features were extracted using the Unet neural network method. This allowed us to obtain 46 parameters related to the soybean canopy structure. Detailed parameter information is shown in Annex Table S1.
The 46 canopy structure parameters of soybean obtained can be divided into top and side parameters. Each one contains four types, namely, area, circumference, length, and compactness. Therefore, the top and side parameters are defined as the top/side area class, top/side perimeter class, plant height/side width class, and top/side compactness class.

2.3. Single-Leaf Photosynthesis Measurement

Indoor soybeans were measured using a portable photosynthesis measurement system (Li-6800, Beijing Laikuo Biotechnology Co., Ltd., Beijing, China) to determine the leaf net photosynthetic rate, transpiration rate, stomatal conductance, and intercellular CO2 concentration on the 23rd, 16th, and 9th days before and the 5th day after the return to normal light conditions. Measurements were taken at the uppermost fully expanded trifoliate leaf position between 9:00 AM and 11:00 AM. During the measurements, the leaf chamber environment was set as follows: the PAR, CO2 concentration, temperature, relative humidity, and gas flow rate were 600 µmol·m−2·s−1, 400 µmol·m−2·s−1, 25 °C, 60 ± 5%, and 500 mL/min, respectively.

2.4. Canopy Photosynthetic Rate Measurement

We used a multi-channel plant photosynthesis gas exchange testing system (CAPTS-100, Shufeng Biological Technology Co., Ltd., Shanghai, China). STV-1 and SSV-1, two typical varieties, were selected for specific time period measurements before and after the maize harvest in the field, as depicted in Figure 1 for the specific field layout. Each measurement session was recorded for 5 min with a 10-s data recording interval, utilizing two measurement chambers (each measuring box had a volume of 1.5 (1 × 1 × 1.5) m3) for continuous monitoring throughout the day, to obtain the raw data.
The raw data were imported into the accompanying analysis software (CAPTS_Suite1.3), where the analysis process included the batch data input, quality control, data fitting, and outputting of result files. The canopy CO2 fixation rate (Ac) and canopy transpiration rate (Ec) can be calculated from Formulas (1) and (2). After the data analysis, outputs such as the net photosynthetic rate, respiration rate, transpiration rate, and PPFD values were obtained. Data were selected based on a comprehensive assessment of the R2 fitting degree and PPFD coefficient of variation. Specifically, data with R2 ≥ 0.5 and a PPFD coefficient of variation between 0 and 3 were chosen for further analysis.
A c = d C d T × V × P S × R × T
E c = d W d T × V × P S × R × T
where dC/dT (unit: μmol × mol−1 × s−1) is the change rate of CO2 in the assimilation box over time, V (unit: m3) is the volume of the assimilation box, and P (unit: kPa) is the air pressure, S (unit: m2) is the area occupied by the assimilation chamber, R is the ideal gas constant (8.3 × 10⁻³ m3·kPa × mol−1 k−1), and T (unit: K) is the air temperature. dW/dT is the rate of change of moisture concentration with time.
The whole-leaf photosynthetic potential (WLPP, μmol/s) was calculated using the average canopy net photosynthetic rate and leaf area [31]. That is,
WLPP = Pn × LA

2.5. Analysis of Plant Growth and Development

During the V1-R5 growth stage, destructive sampling of the plants was conducted every 7 days. The plants were dissected into leaves, main stems, branches, and pods, and their fresh weights were recorded. After drying at 105 °C, followed by further drying at 80° C to constant weight, organ dry weights were measured using an electronic balance. During the grain-filling stage, parameters such as the organ reactivation rate (RR, %) and contribution rate (CR, %) to grain yield were calculated [32]. The specific calculation formulas are shown below:
R R = W i m a x W i m i n W m a x × 100 %
C R = W T m a x W T m i n g r a i n   y i e l d × 100 %
In Formulas (4) and (5): i represents the dry matter mass of each organ part (including the leaves, branches, main stems, and pods); T represents the total above-ground dry matter of each treatment; W m a x and W m i n represent the maximum and minimum values of the organ dry matter at the grain-filling stage (R5), respectively.

2.6. Data Analysis and Processing

All the data were collected and stored using Microsoft Excel 2019 software. After preliminary screening, SPSS 22.0 software was used for significance testing and ANOVA analysis of the screened data. Origin 2021 software was employed for data visualization and analysis after processing.

3. Results

3.1. Growth and Development of Different Shade-Tolerant Soybeans

3.1.1. Accumulation of Dry Matter in Above-Ground Organs

As the emergence time progressed, the accumulation of dry matter in leaves, main stems, and branches shows an “S”-shaped growth trend, fitting well with a typical logistic function. The R2 values ranged from 0.977 to 0.999, indicating a high degree of fit (Figure 2).
The accumulation of dry matter in the above-ground parts is an important form of photosynthesis produced, significantly influencing the crop yield formation. As shown in Figure 1, during the shading period, the total dry matter accumulation of intercropped soybeans is significantly lower than that of sole-cropped soybeans. Compared to sole cropping, the total dry matter accumulation of STV and SSV under shading is reduced by an average of 35.91% and 26.97%, respectively, with no significant difference.
Under intercropping treatment, STV varieties show more significant advantages in dry matter accumulation in leaves and main stems compared to SSV varieties, with the advantage being particularly pronounced in leaves. During the shading stress period, the leaf dry matter accumulation in STV varieties is on average 18.29% higher than that in SSV varieties. Similarly, during the strong light adaptation period and recovery growth period, the leaf dry matter accumulation in STV varieties is on average 3.90% and 5.18% higher than that in SSV varieties, respectively. Due to the higher dry matter productivity of STV varieties, the assimilates available for seed development increase accordingly, providing greater potential for yield formation.

3.1.2. Yield and Yield Composition of Different Shade-Tolerant Soybeans

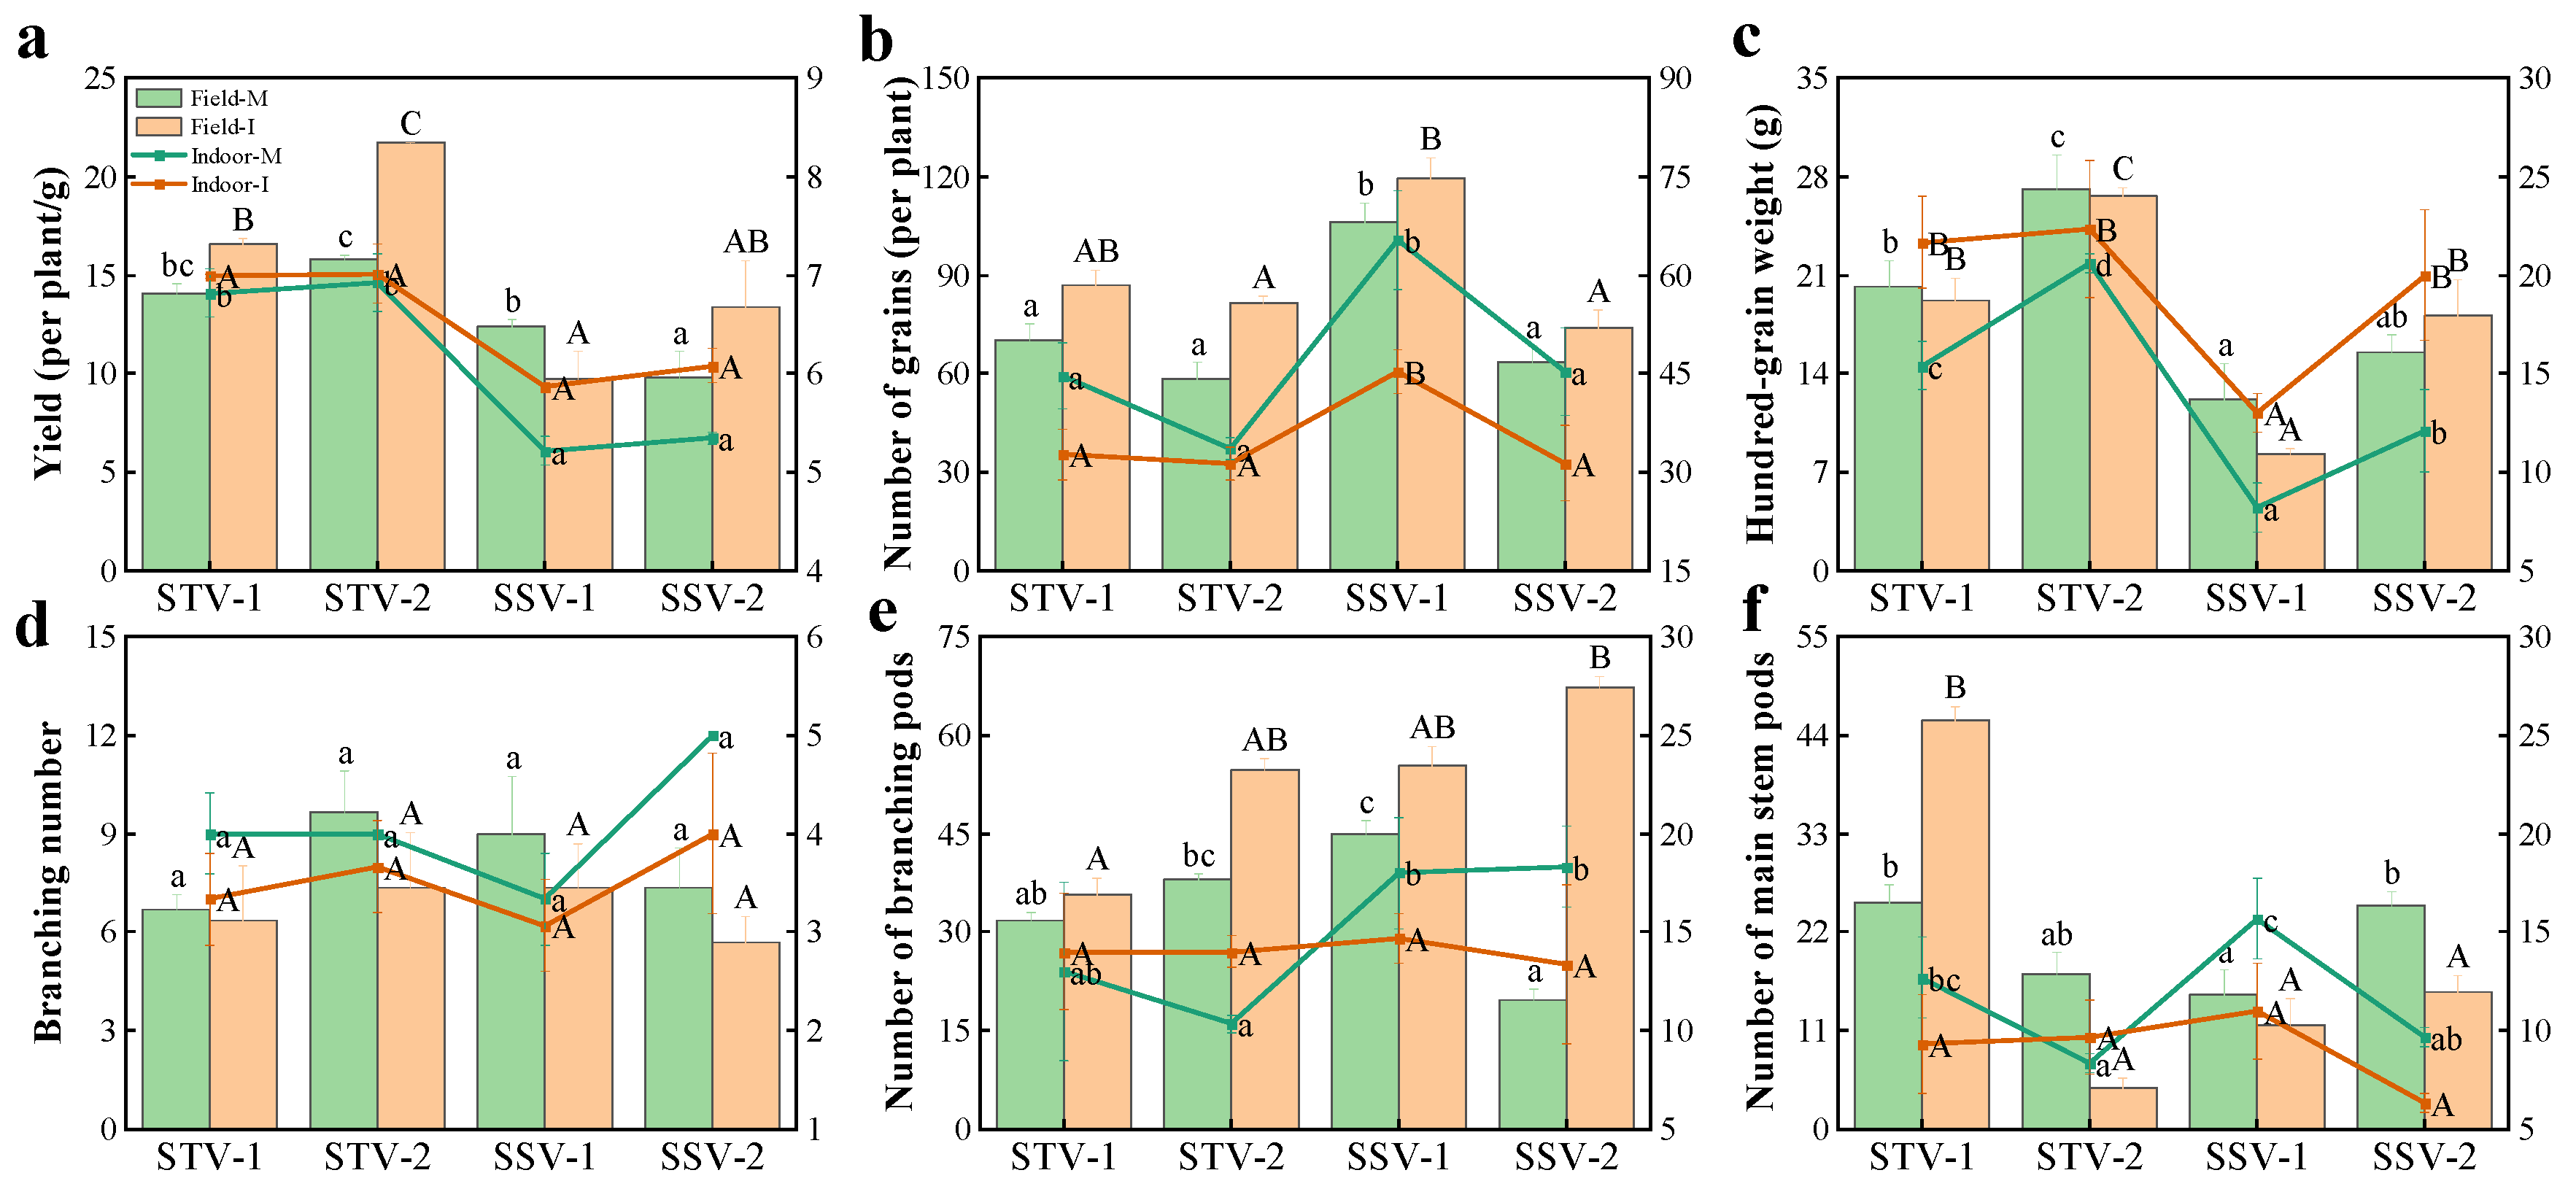
After the soybeans matured, the number of branches per plant, number of pods per branch, and number of pods on the main stem were collected as the primary factors contributing to the soybean yield composition. In the soybean-maize intercropping system, the shaded environment inhibited soybean branch development (Figure 3d), resulting in a higher number of branches in sole cropping compared to intercropping. Under intercropping conditions, the number of seeds per plant and the number of pods per branch significantly increased. Except for STV-1, the number of pods on the main stem significantly decreased in other varieties when compared to sole cropping. It is noteworthy that, for the same variety, the soybean yield was higher under intercropping than sole cropping (Figure 3a). In both sole cropping and intercropping treatments, the yield of SSV varieties was significantly lower than that of STV varieties, with differences prominently observed in the field, reaching up to 55.03%.
To further verify the significant contribution of shade-tolerant soybean varieties to yield formation, we calculated the remobilization rate of each above-ground organ and its contribution rate to the grain for each treatment. We also calculated the total remobilization rate of the above-ground organs and performed a comprehensive ranking on this basis. Whether soybeans were grown in the field or indoors, their comprehensive ranking was highly consistent with the yield ranking across treatments (Figure 3, Table 2). Therefore, studying the total nutrient remobilization rate of the above-ground parts of soybeans has a positive effect on yield prediction. Additionally, the yield contribution rate of the STV varieties was significantly higher than that of the SSV varieties.
The field data show that under intercropping conditions, there is no clear pattern of reactivation rates among the different varieties, but the STV varieties consistently show the highest rates in leaves, followed by pods. Compared to the main stem and branches, leaves and pods exhibit significant differences among the varieties, with the maximum differences reaching 57.54% and 80.77%, respectively. These variations are due to inherent genetic factors and the complexity of the environment. In the indoor experiment, the remobilization rate of nutrients in the above-ground organs of soybeans was mainly concentrated in the branches. This was due to the limited height of later growth, promoting branch development to maintain normal growth. A common phenomenon observed in both field-grown and indoor soybeans was that STV varieties had a higher remobilization rate of nutrients in leaves and pods compared to SSV varieties. This positively reflected the transport and accumulation of photosynthetic assimilates to the source and sink.

3.2. Single-Leaf Photosynthetic Characteristics of Different Shade-Tolerant Soybeans

Table 3 shows that in the early stage of shade stress (PL-23d), the net photosynthetic rate (Pn), transpiration rate (Tr), intercellular CO2 concentration (Ci), and stomatal conductance (Gs) of soybeans were all lower than under normal light conditions. Among these, Pn, Tr, and Gs exhibited the most significant decreases, with maximum reduction rates of 60.31%, 65.85%, and 71.43%, respectively. These maximum reduction rates were all observed in the SSV varieties.
In the indoor soybean experiment, the initial flowering stage occurred at PL-16d. When soybeans entered the reproductive growth stage, the Pn of all varieties at the same stage was lower under shade treatment compared to normal light treatment, but the differences between treatments were not significant. The transpiration rate (Tr), intercellular CO2 concentration (Ci), and stomatal conductance (Gs) were not always lower under shade treatment compared to normal light, which was more evident at the initial flowering stage. At PL-16d, under shade, the average increases for STV varieties in Tr, Ci, and Gs were 22.68%, 13.89%, and 26.47%, respectively; for SSV varieties, the average increases in Tr, Ci, and Gs were 32.09%, 8.32%, and 38.28%, respectively. In summary, early shading reduced the photosynthetic characteristics of individual soybean leaves, while later shading accelerated soybean transpiration consumption, which had a more significant impact on SSV varieties.

3.3. Canopy Photosynthetic Characteristics of Different Shade-Tolerant Soybeans

3.3.1. Diurnal Variation of Photosynthetic Rate

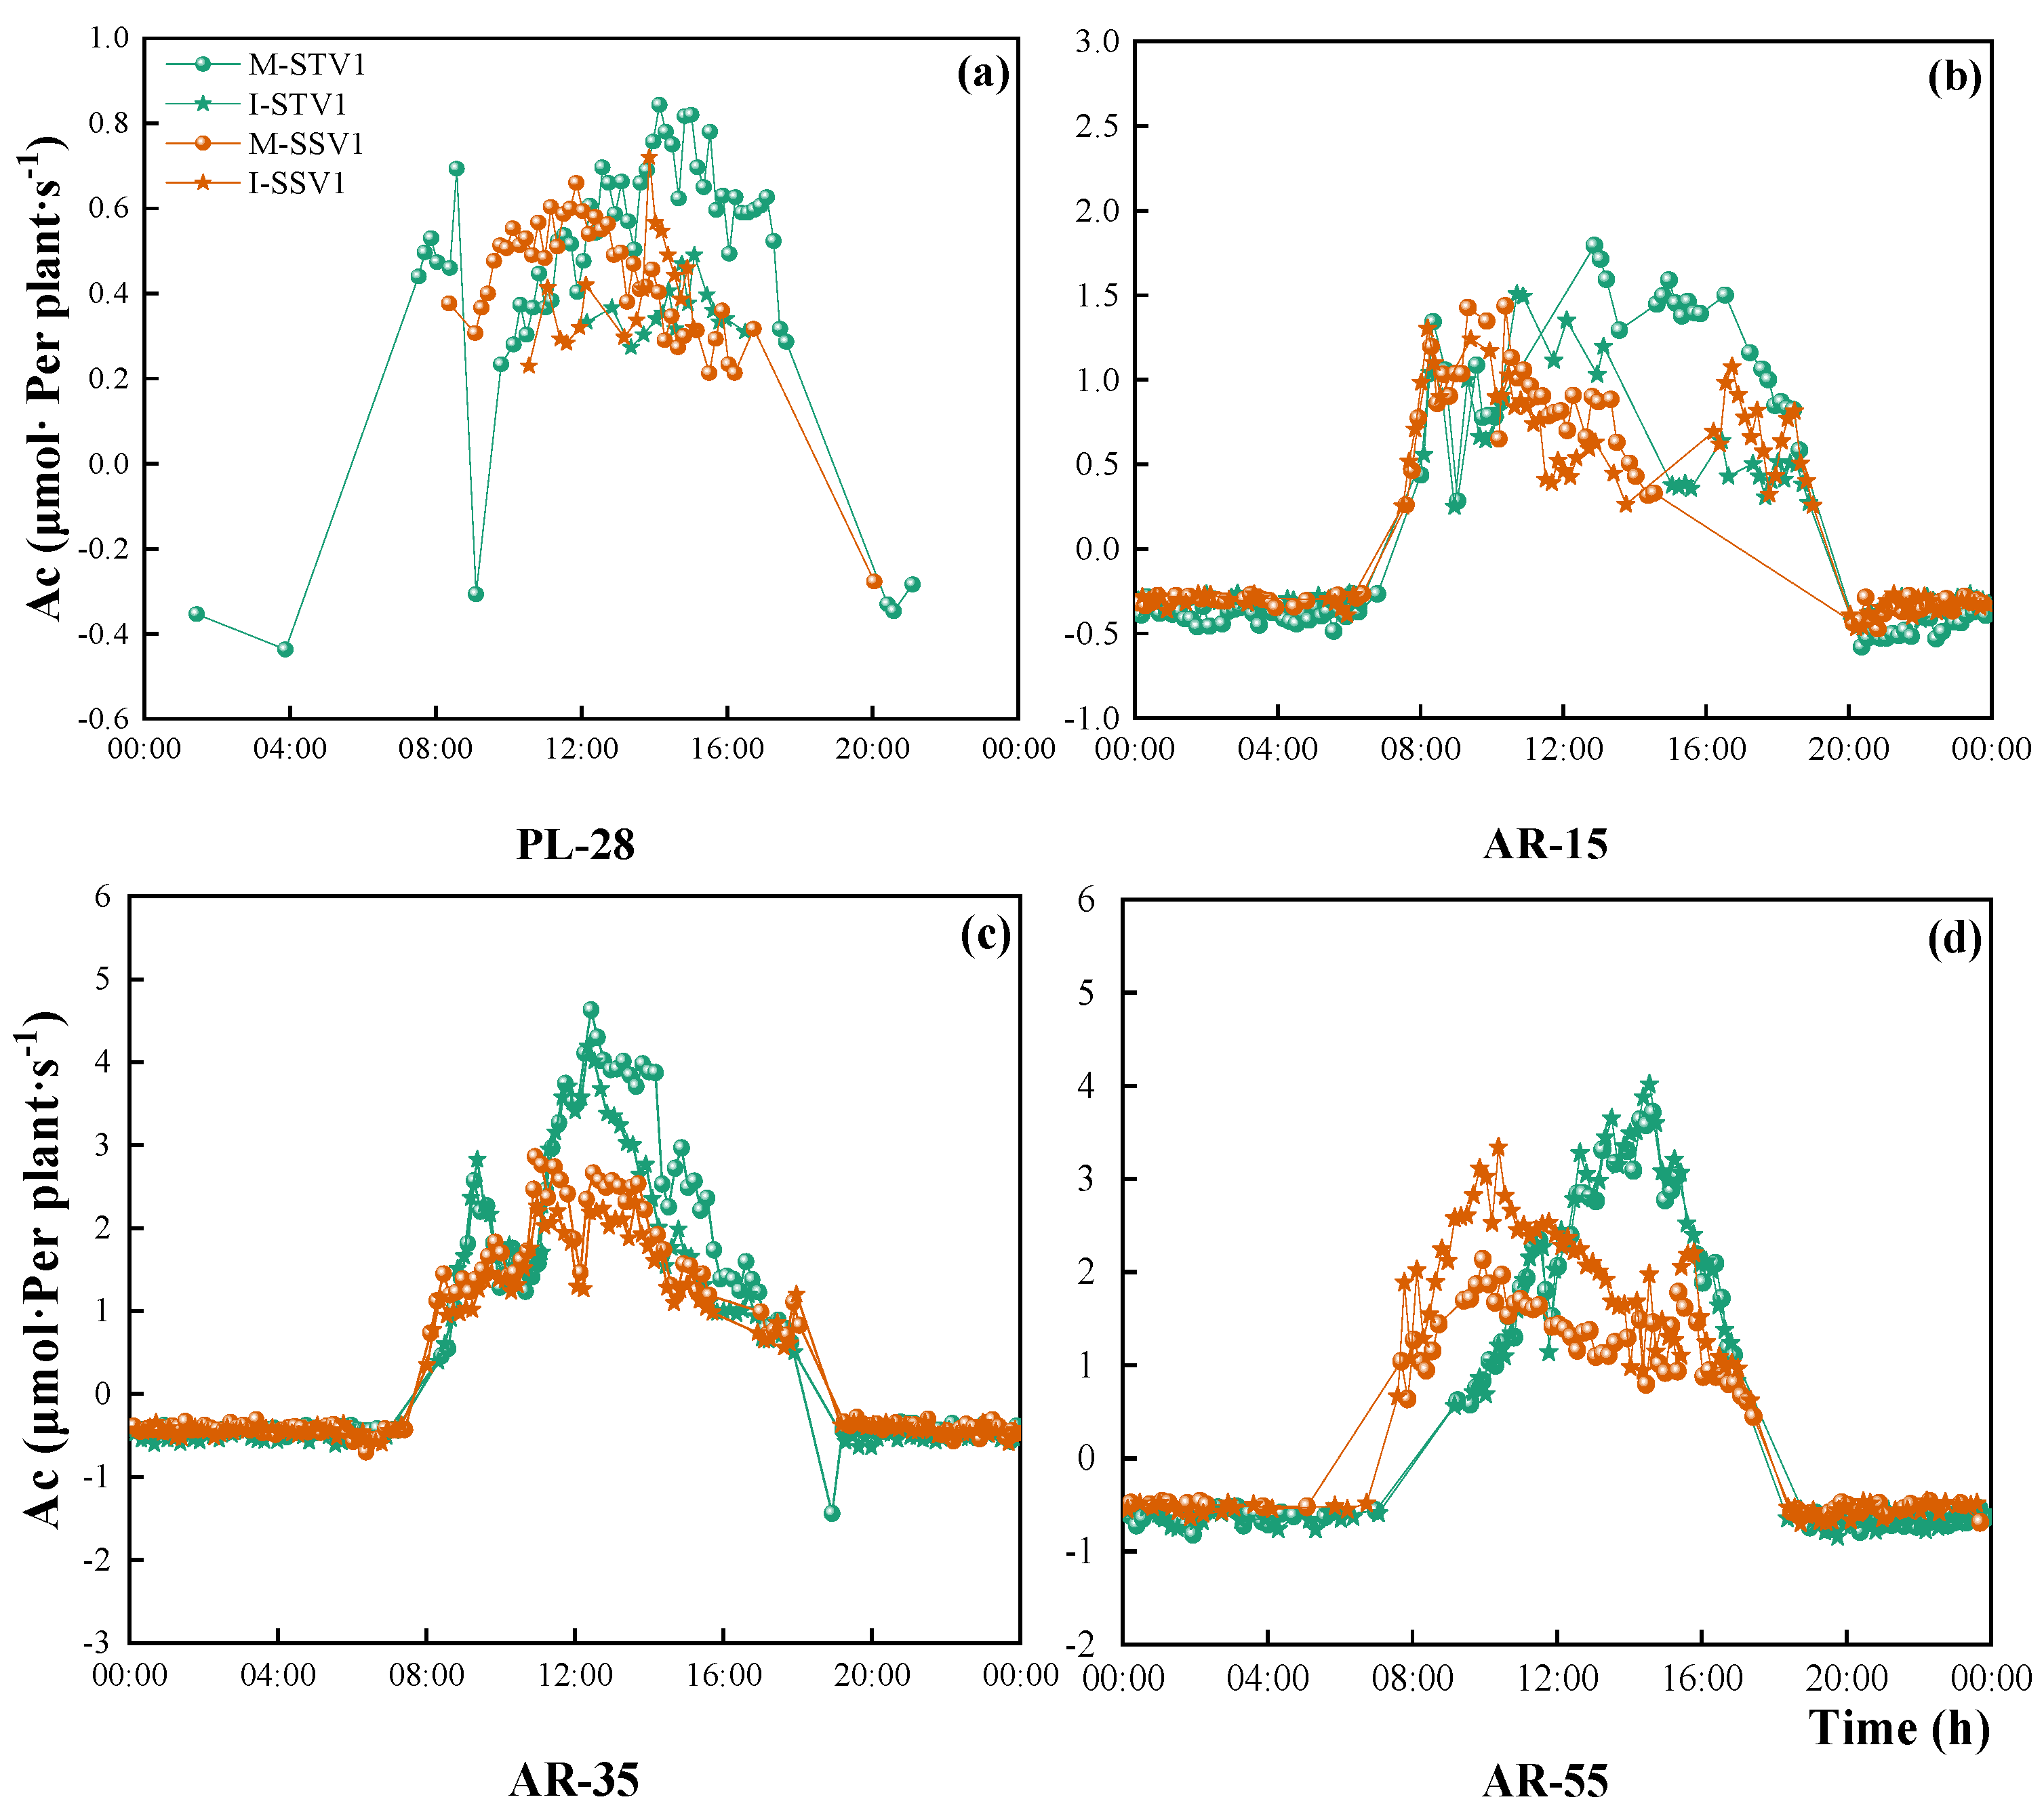
Soybeans undergo a “weak-strong-weak” variation in photosynthetic radiation throughout the day, resulting in a pronounced diurnal pattern in their photosynthetic rate. Data from Figure 4 show that as the soybean growth period progresses, the number of canopy photosynthesis data points increases, and data stability improves accordingly. During the shading stress period, there is little variation in the canopy photosynthetic rates among treatments, with individual soybean plants under both monoculture and intercropping conditions concentrating around 0.45 μ mol · per   plant · s 1 and 0.28 μ mol · er   plant · s 1 , respectively (Figure 4a). After the maize harvest, the light environment in the intercropping system recovers, allowing the intercropped soybeans to resume growth. The difference in Pn between net and intercropped treatments of the same variety gradually decreases and eventually becomes parallel (Figure 4b–d). This parallel state appears earlier in the STV-1 variety compared to the SSV-1 variety, indicating that STV-1 has a stronger recovery growth ability than SSV-1. During the strong light adaptation period, there is no significant difference in the net photosynthetic rate between the STV and SSV varieties. However, during the recovery growth phase, the net photosynthetic rate of STV-1 is significantly higher than that of SSV-1.
Overall, there is a trend of higher respiration rates in SSV-1 compared to STV-1. This is particularly evident with SSV-1, which exhibits an average respiration rate 34.29% higher than STV-1 at AR-15d. Additionally, both STV-1 and SSV-1 show a decline in photosynthetic rates between 12:00–14:00 across various periods. This decline is attributed to the phenomenon of midday depression in photosynthesis, where daily variations in photosynthetic rates exhibit an “M”-shaped trend, which becomes more pronounced after the maize harvest.

3.3.2. Optical Response Curve

Figure 5 illustrates the fitting relationship between the photosynthetic rate (Ac) and photosynthetic photon flux density (PPFD). There is a good fit between Ac and PPFD, with R2 values all above 0.82 across treatments. As the growth period progresses, the fitting degree of each treatment shows an increasing trend. During the shading stress period (Figure 5a), there are no significant differences in the light compensation point and light saturation point between the STV and SSV varieties. In the strong light adaptation period (Figure 5b), STV varieties exhibit a lower light compensation point compared to SSV varieties, with no significant difference in the light saturation point. After entering the recovery growth period (Figure 5c,d), the early stages of recovery show a weaker light compensation point for the STV varieties and a significantly higher light saturation point compared to the SSV varieties. In the later stages of recovery growth, the difference in the light compensation point between the two varieties is minimal, but the STV varieties still maintain a significantly higher light saturation point than the SSV varieties. In summary, after maize harvesting, the STV varieties exhibit characteristics of a lower light compensation point and a stronger light saturation point, allowing for more effective photosynthesis under higher photosynthetic radiation environments, thereby facilitating a rapid accumulation of assimilates.
Typically, the measurement of apparent quantum efficiency (AQE) values is conducted under “light-limited” conditions, so measuring AQE near the light compensation point is crucial. Based on the fitted functions for each period, we calculated the value of Ac corresponding to when light intensity equals 0, which determines the AQE. The dashed lines in Figure 5 represent the apparent quantum efficiency. AQE values across treatments consistently show that STV-1 is greater than SSV-1, thus confirming once again that STV-1 exhibits stronger adaptation to shaded environments compared to SSV-1.

3.3.3. Whole-Leaf Photosynthetic Potential

Whole-leaf photosynthetic potential (WLPP) reflects the dry matter production per unit leaf area at a specific growth stage of the plant. Generally, a higher whole-leaf photosynthetic capacity indicates greater biomass production and consequently higher yields. The dynamic changes shown in Figure 6 reveal that throughout the growth period, STV varieties exhibit a greater whole-leaf photosynthetic potential compared to SSV varieties, with the differences becoming more pronounced in the later stages. Interestingly, on the day of the corn harvest, an “anomaly” occurred where the WLPP of the SSV varieties was slightly higher than that of the STV varieties. This was due to the weaker environmental adaptability of the SSV varieties, causing them to react more strongly to the sudden increase in light intensity.
STV-1 and SSV-1 both reached their maximum whole-leaf photosynthetic potential 40 days after the maize harvest. Based on the changes observed in each treatment curve, all the treatments remained consistent before the maize harvest, but after the maize harvest, the WLPP of the soybeans in each treatment increased. The increase in STV-1 was significantly higher than that in SSV-1, indicating that shade stress had a smaller impact on STV-1, which facilitated its recovery growth.
In general, throughout the soybean growth period, STV varieties exhibit higher net photosynthetic rates (Pn) and lower respiration rates (BR) compared to SSV varieties, which is crucial for assimilate accumulation. During the grain-filling stage, STV varieties show relatively higher assimilate reactivation rates in leaves and pods, and lower rates in stems. This demonstrates that STV varieties can synthesize a large number of assimilates in the source and transport them quickly to the reservoir, and the highly concentrated assimilates in the reservoir, which is beneficial for yield formation.
It has been reported that canopy structure significantly affects photosynthesis [33]. Similarly, this study reveals significant differences in canopy structure between shade-tolerant and shade-sensitive varieties, obtained through high-throughput phenotyping platforms. This further explains the superior photosynthetic performance of the STV varieties, as detailed in Section 3.4 and Section 3.5.

3.4. Selection of Canopy Structure Parameters

3.4.1. Relationship between the Canopy Structure and Canopy Photosynthesis

Canopy structure is a critical determinant of yield and a key aspect in improving high-efficiency cultivation practices. It primarily affects canopy light distribution and interception, and consequently influences canopy photosynthetic efficiency.
This study classified 46 canopy structure parameters into 16 top parameters and 30 side parameters. Table 4 presents the correlation results between top and side parameters with canopy photosynthesis, revealing that 25 canopy structure parameters show highly significant correlations with canopy photosynthesis (p ≤ 0.001), including 11 top parameters and 14 side parameters. Four structure parameters exhibit highly significant correlations with canopy photosynthesis (p ≤ 0.01), all occurring among the side parameters. Additionally, one top structure and five side structures show significant correlations with canopy photosynthesis (0.01 < p ≤ 0.05). In summary, this study identifies these 25 canopy structure parameters that are highly correlated with Pn as preliminary screening indicators.

3.4.2. Regression Analysis between Canopy Structure Parameters and Yield

To establish the quantitative relationships between the 25 initial screening canopy structure parameters and yield, polynomial functions ( y = a X 2 + b X + C ) were used to fit these parameters against yield. The results (see Figure S1) show that parameters related to the top area such as TPA1 (top projected area), TCA1 (top contour area), TRA (top rectangle area), TCA2 (top circle area), and side parameters like SMW (side mean width), SRA (side rectangle area) all exhibit R2 values greater than 0.86 with yield. As the growth period progresses, the fitting accuracy shows an increasing trend, reaching an R2 of 0.99 on the 35th day after the maize harvest. Therefore, this study identifies these 6 parameters as key focus indicators. Subsequently, based on these 6 canopy parameters, the study will analyze differences among soybean varieties of different shade tolerance levels, aiming to lay a theoretical foundation for exploring superior canopy structures.

3.5. The Canopy Structure of Different Shade-Tolerant Soybeans

3.5.1. Top Parameters

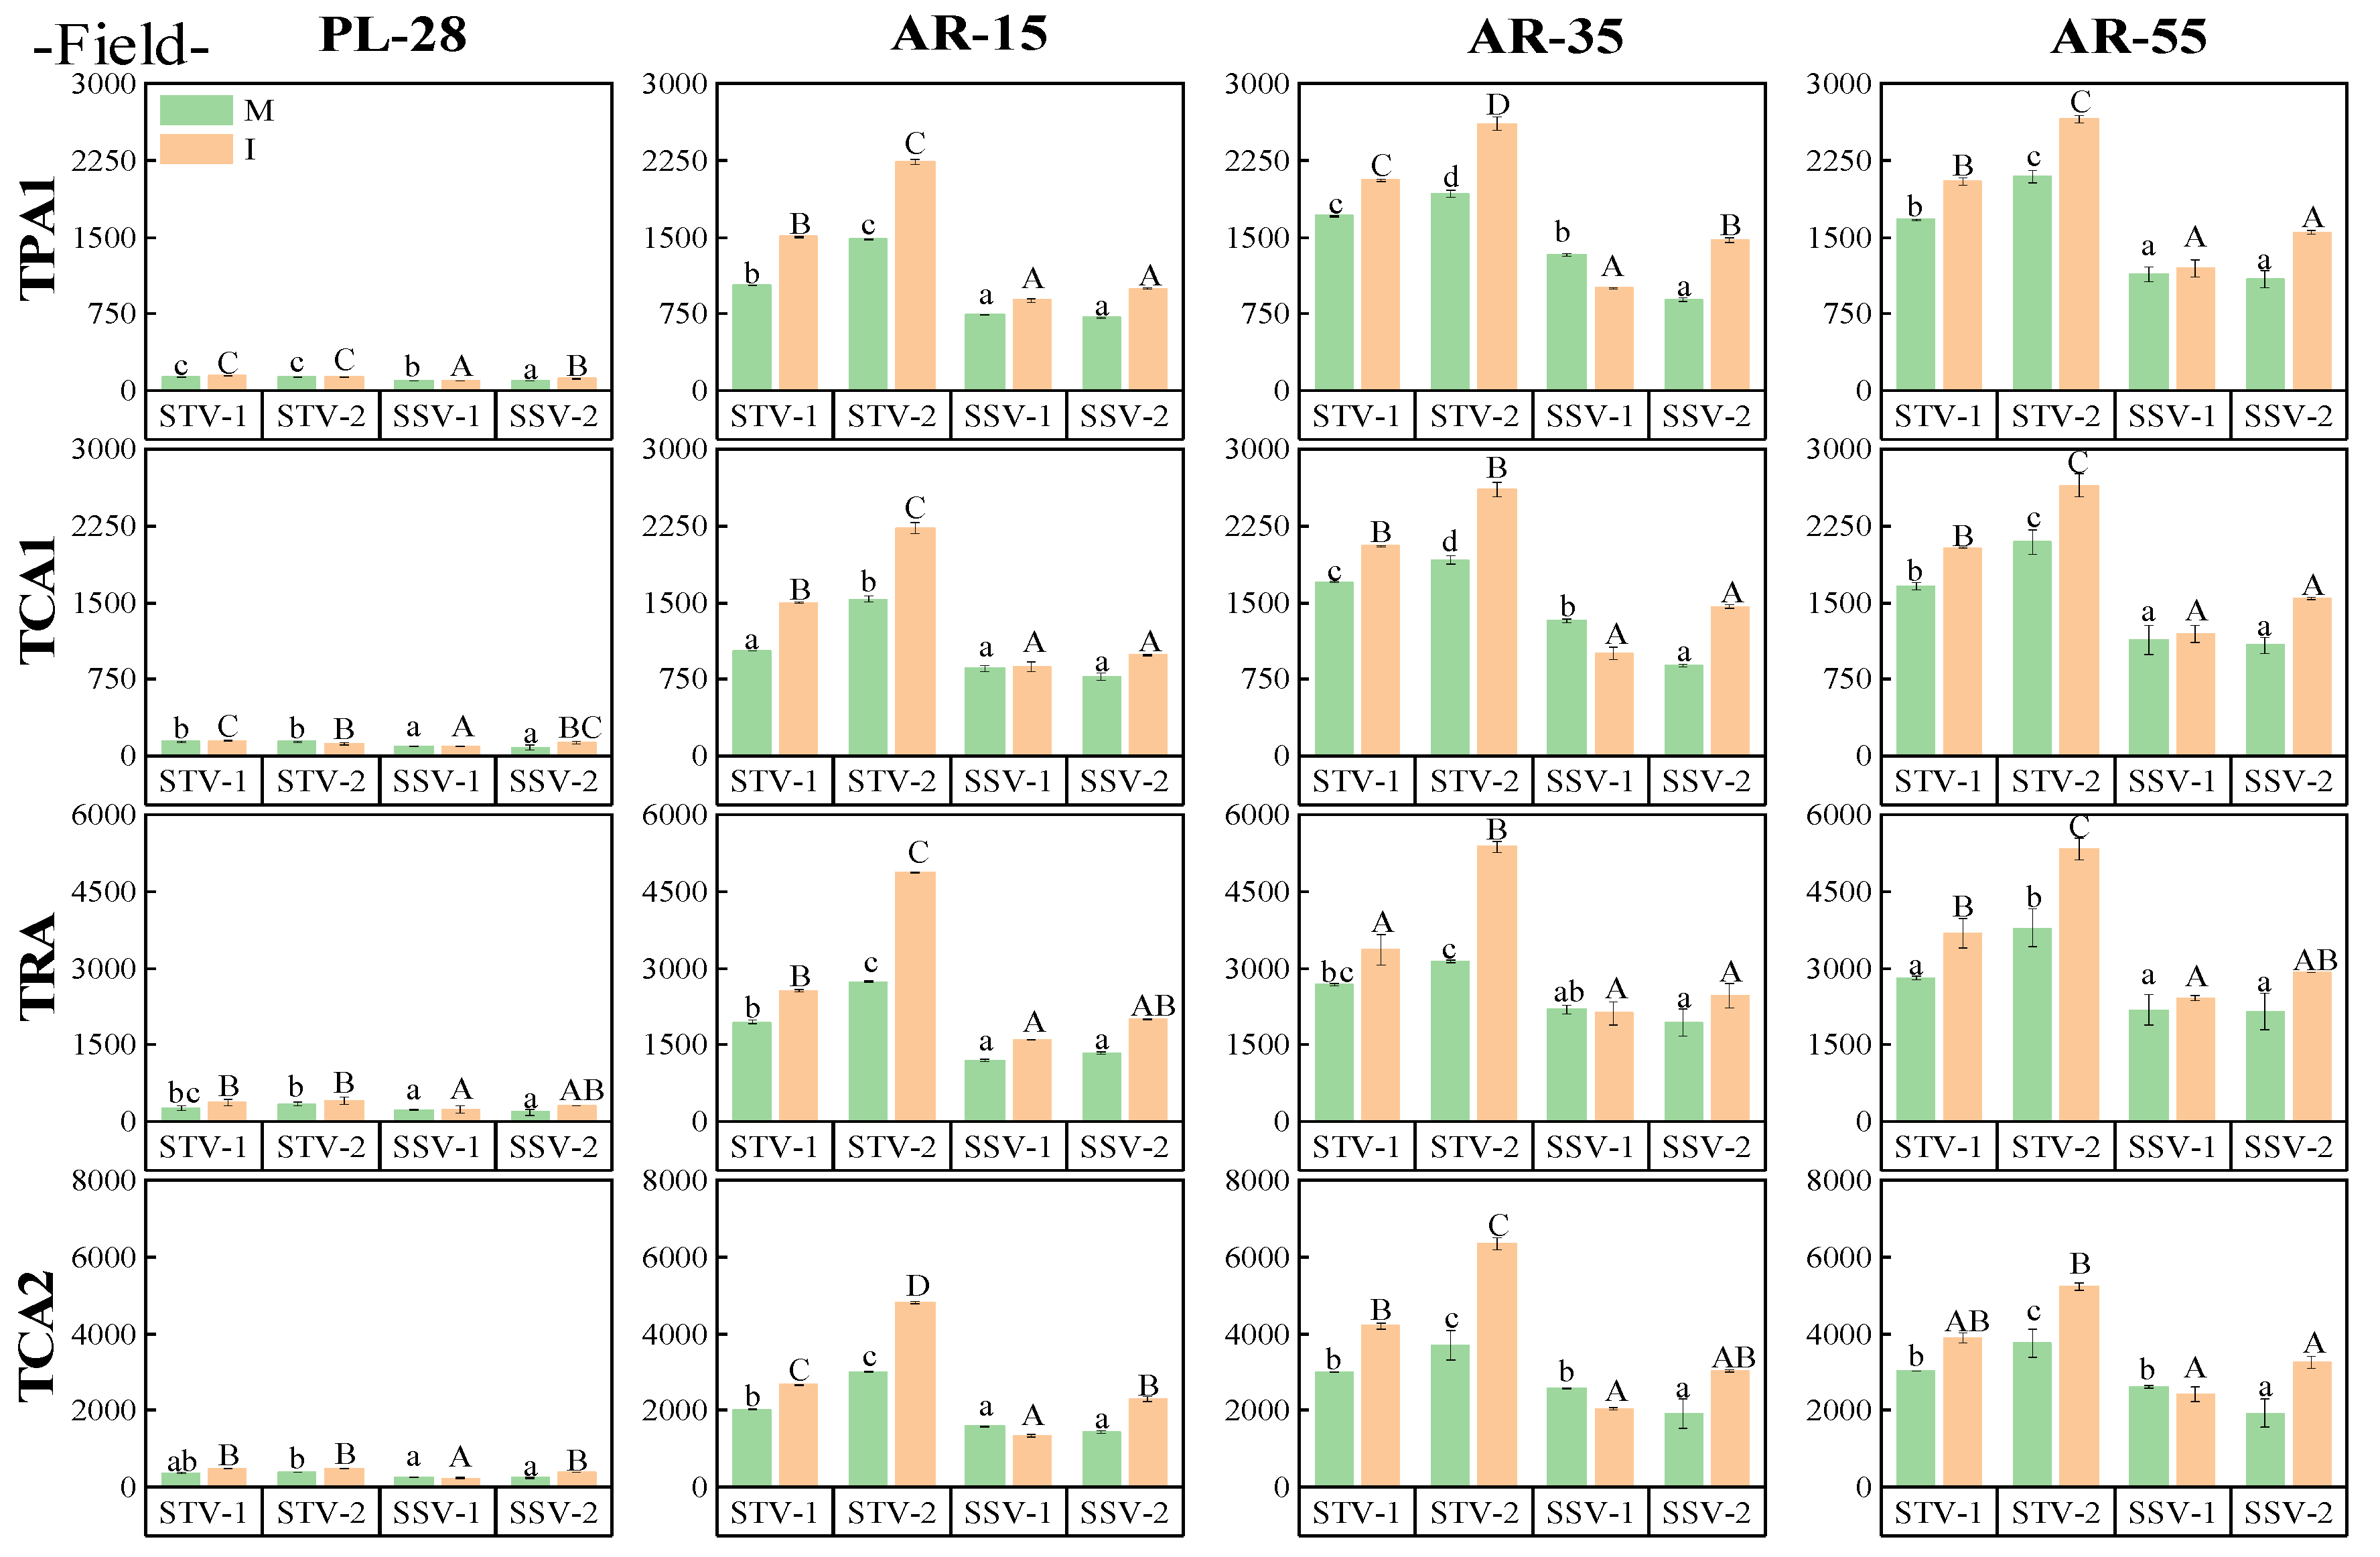
The top area refers to the uppermost area of the plant, significantly influencing the light transmission within the soybean canopy. Through the analysis of four top area parameters in soybeans, all the top area sizes consistently show STV varieties significantly larger than SSV varieties at the same period, with the greatest difference observed in field conditions. During shading stress, strong light adaptation, and recovery growth periods, the differences were 52.09%, 72.05%, and 61.37%, respectively. The field data in Figure 7 demonstrate that within the same period, most instances show a larger top area in intercropped soybeans compared to sole cropping, increasing the illuminated area of the intercropped soybean top layer and indirectly enhancing the canopy light transmission. The variation pattern of the top area in indoor soybeans slightly differs from that of field-grown soybeans, but overall, indoor soybeans still exhibit a larger top area in STV varieties.
As the growth period progresses, the top areas of all four increase, with the effect being more significant under the intercropping system. This study measures the growth dynamics of soybean top areas using growth rates ( G R = T i T i 1 T i × 100 % , where T i represents the top area at a specific period and T i 1 represents the top area at the previous period). The results show that in the field, the growth rate (GR) of the top areas of soybean plants reaches its maximum during the high light adaptation period (AR-15d). Compared to the SSV variety, the STV variety has an average maximum GR that is higher by 3.52%, 4.14%, 3.27%, and 2.76% for the four top areas. However, for indoor soybeans, the STV variety’s highest increase rate mostly occurs at PL-9d, while the SSV variety’s highest AR mostly occurs at PL-16d. This is closely related to the STV variety’s stronger ability to adapt to shading stress.

3.5.2. Side Parameters

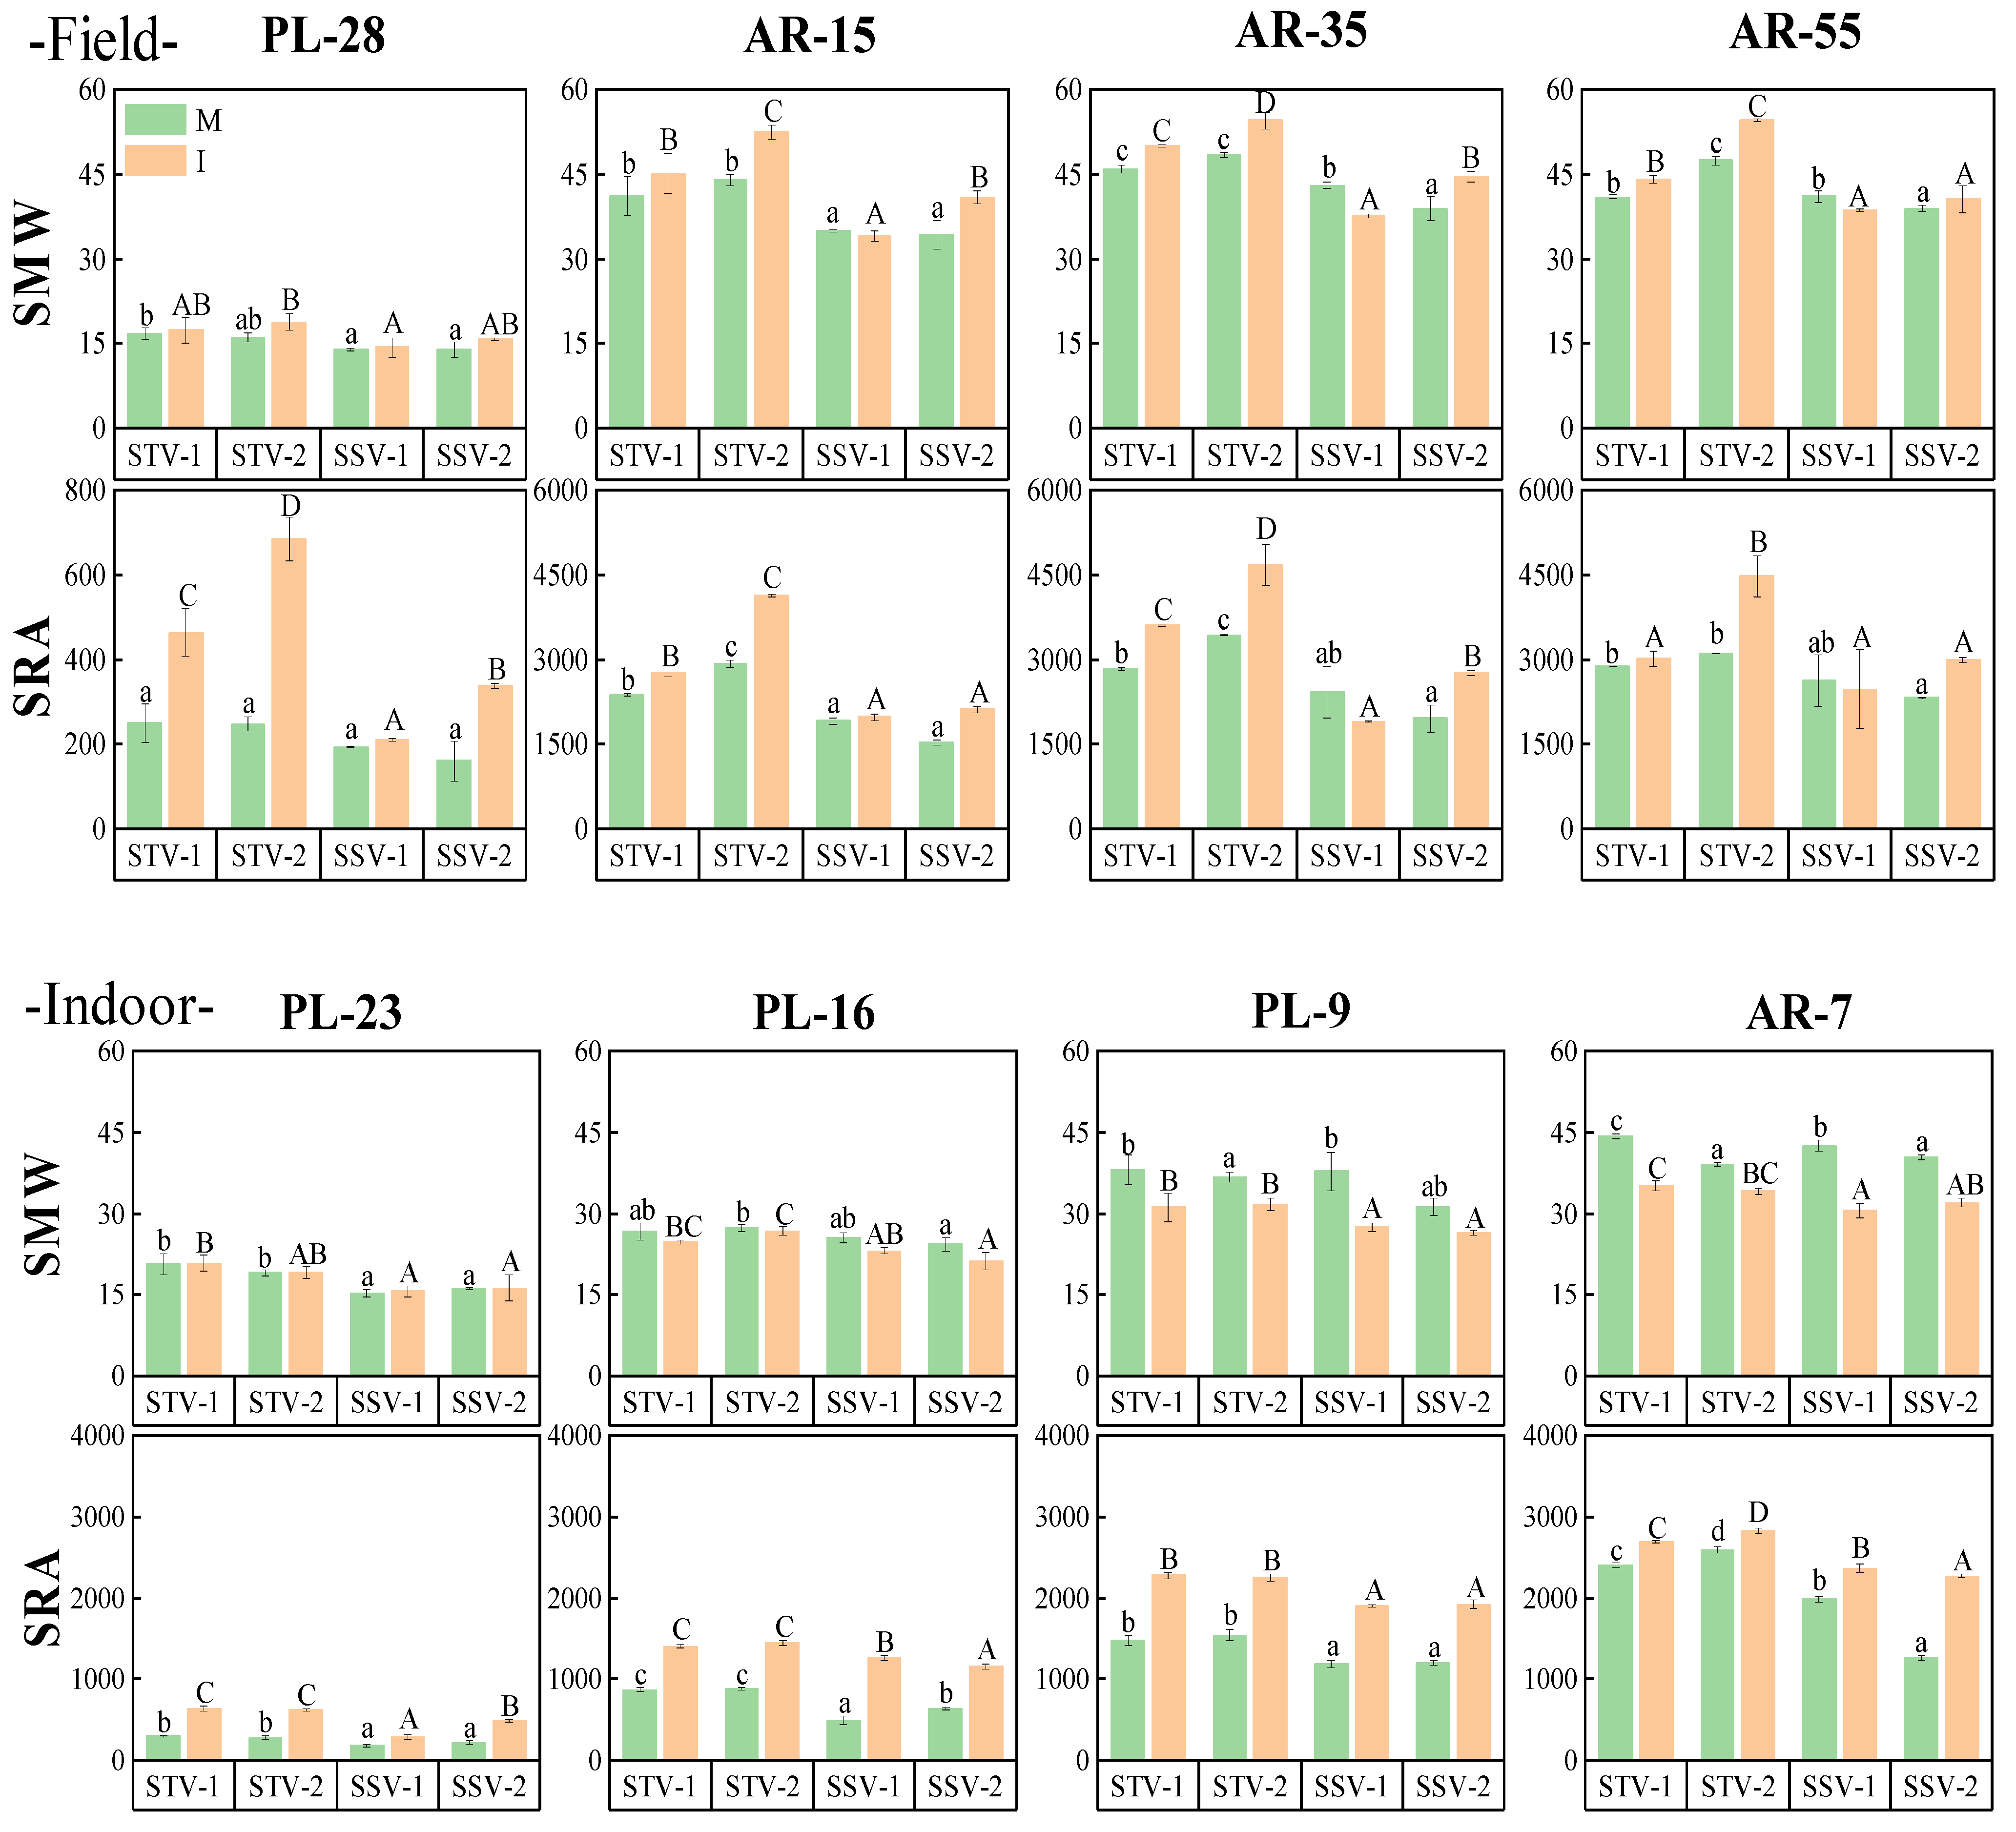
Side width refers to the horizontal breadth of the plant canopy, and studies have shown that canopy width is an important aspect reflecting the soybean canopy phenotype [34]. Overall, SMW and SRA in all treatments follow a trend of “rapid growth-slow growth-stabilization”, which is consistent with the change pattern of the top area (Figure 8). The SMW and SRA of the STV variety are more advantageous than those of the SSV variety. The maximum difference in SMW between the STV and SSV varieties, both in the field and indoors, occurs at the beginning of flowering, with average differences of 18.41 cm and 5.52 cm, respectively. However, the maximum difference in SRA occurs at different periods (20 days after the beginning of flowering in the field and 14 days after the beginning of flowering indoors). The cause of this phenomenon requires further in-depth study. Similarly, using the growth rate (GR) to evaluate the growth status of EMW and ERA for each variety, the maximum GR for EMW and ERA occurred during the initial flowering stage for all varieties. For the STV varieties, the average maximum GRs of EMW and ERA in field and indoor environments were 62.92%, 22.13%, and 83.36%, 55.53%, respectively.
To further investigate the side width of soybean canopies, we divided the canopy structure into five equal parts for side width analysis (i.e., 1_5MW, 2_5MW, 3_5MW, 4_5MW, 5_5MW), following the method detailed by Li et al. [35]. The results in Figure 9 show that throughout the growth period, STV varieties exhibit wider upper-middle layer structures and narrower lower layer structures compared to the SSV varieties. In particular, under field conditions, STV-2 demonstrates the most typical side width, with average values of 832.90, 1034.38, 896.93, 658.85, and 280.46 cm for the upper, middle-upper, middle, middle-lower, and lower layers, respectively. This variety maintains a significant advantage in terms of overall side width compared to the others. Next, during the recovery growth period, the 5_5MW of the STV varieties significantly increases, with STV-1 and STV-2 increasing by 65.92% and 64.41%, respectively, by AR-55d, thereby promoting an increased light interception area.

3.5.3. The Canopy Overlap Ratio

The canopy overlap ratio (COR) reflects the proportion of upper and lower leaf layers in the vertical structure of plants, significantly affecting the light transmission within the soybean canopy [36], which is crucial for light-use efficiency. A smaller COR indicates more distributed light within the canopy. Table 5 reflects the COR of four soybean varieties under different treatments, showing that STV varieties often exhibit the lowest COR values within the same treatment, whereas the SSV varieties exhibit the opposite trend. The maximum COR difference between field and indoor conditions for the STV and SSV varieties is 89.47% and 52.12%, respectively, with notably larger differences observed in field conditions. Occasionally, STV varieties show a higher COR than SSV varieties during certain periods, which is attributed to the wider upper leaf blades in shade-tolerant soybeans (Figure 8), which reduces light loss. It is noteworthy that, whether under shade stress or after maize harvesting, in most cases, the COR of the same variety is smaller under intercropping conditions, which belongs to the response of intercropping soybeans to shade stress.
This study demonstrates that top area and lateral width collectively influence the light-use efficiency of soybeans, thereby affecting assimilate formation and distribution. STV varieties, characterized by a larger top area, wider upper-middle lateral width, and smaller canopy overlap ratio, exhibit significantly increased light transmission within the canopy during periods of strong light adaptation and recovery growth. This enhances the illuminated area available for photosynthesis. Research indicates that intercropped soybeans benefit more from an increased illuminated area in enhancing photosynthetic capacity, rather than altering light conversion efficiency, thus effectively increasing the soybean yield [5].

4. Discussion

4.1. The High Biomass Productivity in the Source and Reservoir Provided Advantages for the High Yield of STV Varieties

The process by which green leaves synthesize assimilates through photosynthesis and transport them to storage organs is complex and constitutes one of the important physiological processes within crops. Seeds, as crucial storage organs, have their assimilate content and distribution influenced by both crop intrinsic factors and environmental conditions [37]. Relevant studies indicate that enhancing biomass production capacity in both source (leaves) and sink (seeds) organs is a prerequisite for achieving high and stable crop yields [38].
Seed formation largely depends on the long-distance transport of assimilates from photosynthetic active sources (leaves) to sinks (seeds). Enhancing assimilate allocation towards seeds is beneficial for achieving high crop yields [39]. This study shows that during the grain-filling period, the reactivation rate of assimilates in the STV variety is higher in leaves (source) and pods (sink) than in the main stem and branches (flow). This indicates that the biomass in the STV variety not only has a strong production capacity in the source but also transports a greater amount to the sink, with relatively less assimilate remaining in the flow. This effectively demonstrates that the STV variety has high assimilate transport efficiency, facilitating the transfer of assimilates to the grains, which will be an important reason for the high yield advantage of the STV variety.
Currently, there is an increasing number of studies predicting crop yield based on the accumulation of assimilates in various plant organs. Fu et al. [40]. demonstrated that after intercropped soybeans begin to recover, they enhance leaf functional traits and increase dry matter accumulation, resulting in a win-win yield advantage for both corn and soybeans. Egashira et al. [41]. explored the effects of drought stress on cowpea seed yield and the changes in assimilate distribution between source and sink organs. Their results indicated that during the grain-filling process, although the photosynthetic rate of drought-stressed cowpeas sharply declined, transferring assimilates from source organs helped maintain seed yield.

4.2. High Photosynthesis Provides the Power for Biomass Productivity of STV Varieties

Soybeans are photophilic crops with strong stress resistance. To adapt to the increased blue and purple light under intercropping conditions, soybeans exhibit shade avoidance responses to capture more light energy and mitigate external shading stress. Apparent quantum efficiency directly reflects a crop’s response capability under shade stress and has been studied in rice [42], wheat [43], and maize [44] among others. This study shows that the apparent quantum efficiency of STV-1 is consistently higher than that of SSV-1, a trend more pronounced under seedling shade conditions. Therefore, compared to SSV varieties, STV varieties exhibit stronger resistance to shade stress.
Differences in the external light environment can lead to corresponding changes in the photosynthetic rate of crops. This study indicates that the intercropping light environment reduces the photosynthetic rate (Pn) of the tested soybean, with a greater decline during the seedling stage compared to the reproductive stage. Additionally, there are no significant differences in Pn during the strong light adaptation and recovery periods between intercropped and sole-cropped soybeans. Shade stress during the seedling stage leads to a significant reduction in stomatal conductance and a decrease in intercellular CO2 concentration, combined with an insufficient CO2 supply, which lowers the photosynthetic rate [45]. After the corn harvest, the recovery of light allows the soybeans to experience compensatory growth. During the critical nutritional period (which impacts soybean grain formation), stomatal conductance and intercellular CO2 concentration in intercropped soybeans are higher than in sole-cropped ones, replenishing photosynthetic resources and resulting in a noticeable increase in the photosynthetic rate. However, the photosynthetic rate does not reach the levels of sole cropping, possibly due to excessive transpiration in soybeans. Additionally, due to the phenomenon of midday depression in photosynthesis, the daily variation in photosynthetic rates exhibits an “M” shape, which is more pronounced during the recovery period of soybeans.
The dynamic changes in whole-leaf photosynthetic potential (WLPP) reflect the situation of biomass accumulation, which is currently underreported in the field of soybean research. It has been reported that crops with a high whole-plant photosynthetic capacity promote biomass accumulation, thereby enhancing the final yield [46]. In this study, the biomass content of leaves, main stems, and branches followed logistic growth patterns with emergence time, with leaves showing the fastest growth rate. However, the STV variety, due to its higher photosynthetic activity and larger leaf area, shows a significantly greater average WLPP compared to the SSV variety.
On the whole, the STV varieties have a higher net photosynthetic rate (Pn) and whole-leaf photosynthetic potential (WLPP) and a lower transpiration rate (Tr) and respiratory rate (BR), regardless of single-leaf photosynthesis or canopy photosynthesis. Such high photosynthesis activity is conducive to the rapid accumulation of photoenergy compounds in soybeans, which provides the basis for biomass productivity.
Crop canopy photosynthesis is the integrated value of the photosynthetic interactions of various organs above ground, and research on canopy photosynthesis has become the focus of future high-efficiency breeding and high-efficiency cultivation. In the maize-soybean intercropping system, the light environment for soybean growth changes from “weak-strong-strong”, leading to three stages in the soybean growth process: “shading stress-strong light adaptation-recovery growth.” Different shade-tolerant soybean varieties exhibit variations in canopy photosynthesis at each growth stage, which is closely related to the yield formation process. Therefore, analyzing canopy photosynthesis during the “three stages” of soybean growth is of significant importance.

4.3. Excellent Canopy Structure Provided a Guarantee for High Photosynthesis of STV Varieties

In the interplanting environment of corn and soybeans, the light environment in the soybean canopy decreased significantly due to the shielding of corn leaves during the symbiotic period, which restricted the related physiological and biochemical processes of soybeans. In recent years, research on superior canopy structures has been increasingly prominent. Relevant studies have shown that the quality of the plant canopy structure significantly affects light transmittance within the canopy [47], thereby influencing canopy photosynthesis [48,49].
This study demonstrates that in the intercropping light environment, the tested soybeans exhibit increased plant height and reduced branching, consistent with previous research findings. More importantly, STV varieties occupy larger top areas, including top projection area and contour area, which not only satisfy the light reception of the top leaves but also enhance light transmittance within the canopy. Studies have shown that due to the complex structure of the soybean canopy, the downward transmission of solar rays mainly concentrates photosynthetically active radiation in the middle and upper layers of leaves, while the light transmittance of the lower layers is greatly weakened [50]. In this study, in combination with the horizontal direction, the STV varieties have wider side widths in the middle and upper layers and narrower side widths in the lower layers. Therefore, the light-receiving areas of the STV varieties are mainly concentrated in the middle to upper layers, which are precisely positioned where canopy light transmittance is relatively saturated. We speculate that such characteristics will be conducive to photosynthesis in the high canopy. According to reports, canopy structural plasticity contributes to enhanced light capture ability and yields advantages in intercropped soybeans [51]. Combining the results of this study, intercropped soybeans increase light capture capacity by enlarging the top and side areas, contributing to an enhanced yield. This phenomenon persists across other intercropping patterns [52].
It is important to emphasize the significant yield advantage of the STV-2 variety, which is closely associated with canopy structure distribution. Due to its broader upper and middle canopy layers and relatively wide lower layers, light distribution throughout the entire plant is achieved uniformly. Therefore, we advocate for optimizing the plant architecture to ensure structural integrity in the upper and middle canopy layers, appropriately increasing the width of lower canopy leaves to enhance light interception. This is closely intertwined with the leaf morphology and average leaf angle [16,23].
Changes in the crop canopy structure significantly affect photosynthesis, as evidenced in many studies. Liu et al. [31]. demonstrated that optimizing the maize canopy structure can increase light capture, enhance photosynthetic potential, and achieve higher yields. Bi et al. [53] optimized the canopy structure of peanut by reducing the branching angle of the upper and middle canopy layers and increasing the branching angle of the lower layers through inoculation with arbuscular mycorrhizal fungi. Their study showed a positive correlation between the canopy structure and the net photosynthetic rate. It is noteworthy that in this study, the STV varieties showed the highest growth rates in the top area and side width during the strong light adaptation period, which happened to be in the critical period of assimilate accumulation in soybeans. Photosynthetic characteristics also significantly increased during this period, once again confirming that an excellent canopy structure provides a guarantee for high photosynthetic activity in plants.
Therefore, we strongly recommend that, in intercropping systems, attention be focused on selecting soybean varieties with excellent canopy structure traits, such as the top area and side width examined in this study. A larger top area and wider upper-middle layer structure effectively increase light transmission within the plant canopy, enhancing the light interception area, which is beneficial for the photosynthesis of intercropped soybeans. This promotes the rapid accumulation and proper distribution of assimilates, thereby significantly enhancing yield performance.

5. Conclusions

This study combined field and indoor experiments by simulating the light environment of maize-soybean strip intercropping in the field. It was found that STV varieties have advantages in canopy structure, photosynthetic activity, and assimilate accumulation, thereby highlighting their outstanding yield performance. This provides a new research approach for the selection and breeding of shade-tolerant soybean varieties.
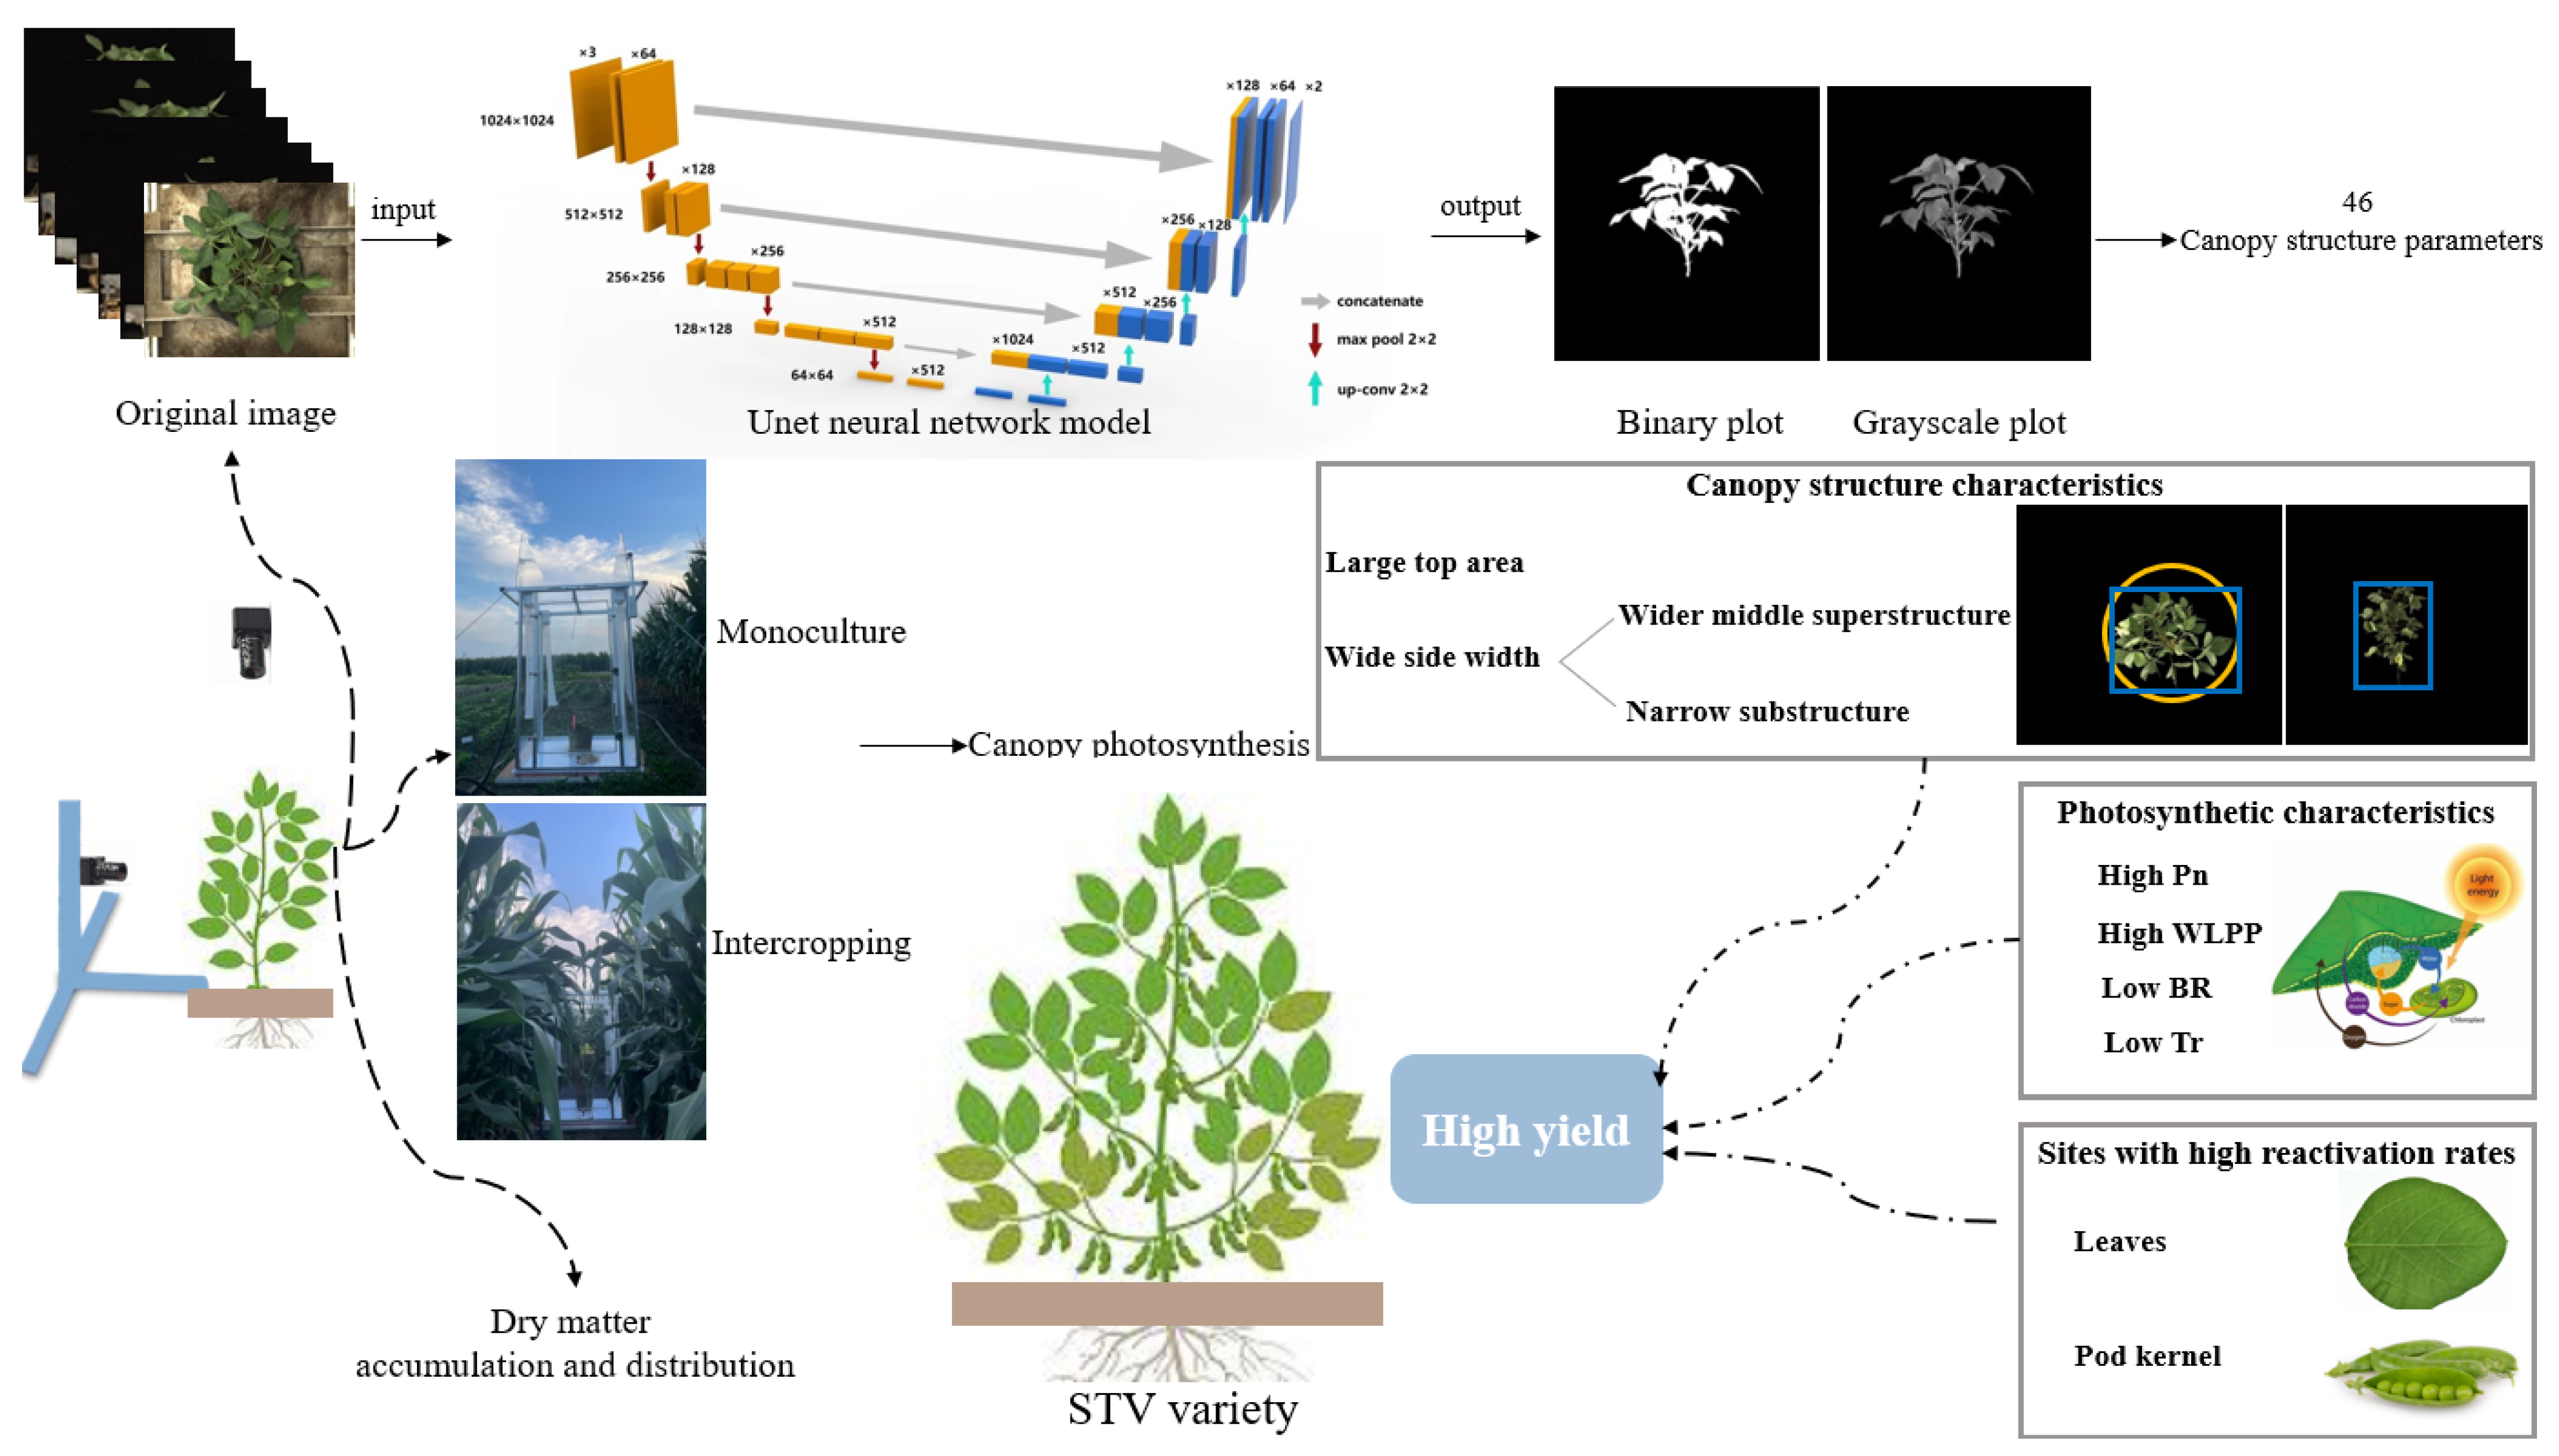
Under the strip intercropping mode with maize, the unique light environment shapes STV varieties to have larger top areas, wider upper-middle layer widths, and relatively narrower lower layer structures. This excellent canopy structure is advantageous for enhancing the photosynthetic efficiency of soybeans. This study indicates that STV varieties exhibit higher net photosynthetic rates (Pn) and apparent quantum efficiency, along with
Lower respiration (BR) and transpiration rates (Tr), whether considering single-leaf or canopy photosynthesis. High efficiency and low consumption capacity benefit the synthesis and accumulation of photosynthates. Additionally, assimilate accumulation in above-ground organs of STV varieties primarily concentrates in leaves (source) and pods (sink), with fewer nutrients remaining in stems and branches (translocation), promoting nutrient transfer to seeds and ultimately achieving high yields (Figure 10).

Supplementary Materials

The following supporting information can be downloaded at: https://www.mdpi.com/article/10.3390/agriculture14101783/s1, Table S1: Summary of 46 canopy structure parameters. This includes 16 top parameters (left) and 30 side parameters (right).; Figure S1: Regression analysis between image index and yield after screening.

Author Contributions

Writing—original draft preparation and software, S.H.; Writing—review & editing, S.H., X.L. and W.Z.; Data curation, S.H., M.C., X.X. and M.X.; Formal analysis, S.H.; Investigation, P.S., F.T., T.G. and M.G.; Resources, W.L.; Supervision, W.Y. and W.L.; Visualization, M.C. and H.C. All authors have read and agreed to the published version of the manuscript.

Funding

This study was supported by the Molecular mechanism of relay intercropping light environment regulating shade-tolerant plant architecture formation in soybean (32172122), Major Project on Agricultural Biotechnology Breeding under the Technology Innovation 2030 Initiative (2023ZD0403405) and the National Modern Agricultural Industry Technology System, Sichuan Soybean Innovation Team (SC-CXTD-2020-20).

Institutional Review Board Statement

Not applicable.

Data Availability Statement

The original contributions presented in this study are included in the article/Supplementary Materials; further inquiries can be directed to the corresponding author(s).

Acknowledgments

The authors would like to thank the anonymous reviewers and journal editor for their valuable suggestions, which helped to improve the manuscript.

Conflicts of Interest

The authors declare no conflicts of interest.

References

  1. Fu, J.J.; Lyu, D.; Sun, J. China’s Grain Trade Research Based on DEA model of National Food Security Perspective: Soybean as an Example. Teh. Vjesn. Tech. Gaz. 2021, 28, 609–615. [Google Scholar]
  2. Sun, J.; Yang, L.; Zhao, F.Q.; Wu, W.B. Domestic dynamics of crop production in response to international food trade: Evidence from soybean imports in China. J. Land Use Sci. 2020, 15, 91–98. [Google Scholar] [CrossRef]
  3. Wang, L.; Cheng, B.; Zhou, T.; Jing, S.Z.; Liu, R.J.; Gao, Y.; Deng, C.Y.; Ye, W.W.; Luo, Z.G.; Raza, A.; et al. Quantifying the effects of plant density on soybean lodging resistance and growth dynamics in maize-soybean strip intercropping. Front. Plant Sci. 2023, 14, 1264378. [Google Scholar] [CrossRef]
  4. Zhang, H.; Wang, L.; Gao, Y.; Guo, Y.K.; Zheng, N.W.; Xu, X.Y.; Xu, M.; Wang, W.Y.; Liu, C.Y.; Liu, W.G.; et al. Genome-Wide Identification of SMXL Gene Family in Soybean and Expression Analysis of GmSMXLs under Shade Stress. Plant 2022, 11, 2410. [Google Scholar] [CrossRef]
  5. Liu, S.P.; Wang, L.X.; Chang, L.; Khan, I.; Nadeem, F.; Rehman, A.; Suo, R. Evaluating the influence of straw mulching and intercropping on nitrogen uptake, crop growth, and yield performance in maize and soybean. Front. Plant Sci. 2023, 14, 1280382. [Google Scholar] [CrossRef]
  6. Robert, P.; Gouis, J.L.; Consortium, T.B.; Rincent, R. Combining Crop Growth Modeling With Trait-Assisted Prediction Improved the Prediction of Genotype by Environment Interactions. Front. Plant Sci. 2020, 11, 827. [Google Scholar] [CrossRef]
  7. Onogi, A. Integration of Crop Growth Models and Genomic Prediction. Genom. Predict. Complex Trait. Methods Protoc. 2022, 2467, 359–396. [Google Scholar]
  8. Choudhury, S.D.; Samal, A.; Awada, T. Leveraging Image Analysis for High-Throughput Plant Phenotyping. Front. Plant Sci. 2019, 10, 508. [Google Scholar] [CrossRef]
  9. Song, P.; Wang, J.L.; Guo, X.Y.; Yang, W.N.; Zhao, C.J. High-throughput phenotyping: Breaking through the bottleneck in future crop breeding. Crop J. 2021, 9, 633–645. [Google Scholar] [CrossRef]
  10. He, S.Y.; Li, X.N.; Chen, M.G.; Tang, F.D.; Gong, T.; Xu, M.; Yang, W.Y.; Liu, W.G. Crop HTP Technologies: Applications and Prospects. Agriculture 2024, 14, 723. [Google Scholar] [CrossRef]
  11. Adachi, S.; Tanaka, Y.; Miyagi, A.; Kashima, M.; Tezuka, A.; Toya, Y.; Kobayashi, S.; Ohkubo, S.; Shimizu, H.; Kawai-Yamada, M.; et al. High-yielding rice Takanari has superior photosynthetic response to a commercial rice Koshihikari under fluctuating light. J. Exp. Bot. 2019, 70, 5287–5297. [Google Scholar] [CrossRef] [PubMed]
  12. Russell, G. Canopy architecture. Encycl. Appl. Plant Sci. 2017, 3, 13–17. [Google Scholar] [CrossRef]
  13. Song, Q.F.; Xiao, H.; Xiao, X.L.; Zhu, X.G. A new canopy photosynthesis and transpiration measurement system (CAPTS) for canopy gas exchange research. Agric. For. Meteorol. 2016, 217, 101–107. [Google Scholar] [CrossRef]
  14. Xu, C.L.; Li, R.D.; Song, W.W.; Wu, T.T.; Sun, S.; Han, T.F.; Wu, C.X. High Density and Uniform Plant Distribution Improve Soybean Yield by Regulating Population Uniformity and Canopy Light Interception. Agronomy 2021, 11, 1880. [Google Scholar] [CrossRef]
  15. Zhao, W.; Ren, T.H.; Huang, X.Y.; Xu, Z.; Zhou, Y.Z.; Yin, C.L.; Zhao, R.; Liu, S.B.; Ning, T.Y.; Li, G. Leaf shape, planting density, and nitrogen application affect soybean yield by changing direct and diffuse light distribution in the canopy. Plant Physiol. Biochem. 2023, 204, 108071. [Google Scholar] [CrossRef]
  16. Ye, Z.P.; Yu, Q. Comparison of photocooperative photoresponse models. Chin. J. Plant Ecol. 2008, 32, 1356–1361. (In Chinese) [Google Scholar]
  17. Zhang, H.Y.; Tian, P.; Mei, N.; Sui, P.X.; Zhang, W.K.; Qi, H. Effects of Light Stress and Light Recovery on Two Maize (Zea mays L.) Cultivars. Bangladesh J. Bot. 2019, 48, 513–520. [Google Scholar] [CrossRef]
  18. Puteh, A.B.; Mondal, N.M.A.; Ismail, M.R.; Latif, M.A. Grain Sterility in relation to Dry Mass Production and Distribution in Rice (Oryza sativa L.). BioMed Res. Int. 2014, 2014, 302179. [Google Scholar] [CrossRef]
  19. Chen, B.L.; Wang, Q.H.; Tang, X.X.; Ye, Z.P.; Stiles, S.; Feng, G. Growth and sink-source relationship of cotton (Gossypium hirsutum L.) under mulched drip irrigation in response to phosphorus fertilization and cultivar. J. Plant Nutr. 2021, 45, 259–272. [Google Scholar] [CrossRef]
  20. Zhu, X.G.; Ort, D.R.; Parry, M.A.J.; von Caemmerer, S. A wish list for synthetic biology in photosynthesis research. J. Exp. Bot. 2020, 71, 2219–2225. [Google Scholar] [CrossRef]
  21. Du, W.G.; Gai, J.Y. Discussion on research progress of soybean breeding for super high yield. Soils Crop. 2014, 3, 81–92. (In Chinese) [Google Scholar]
  22. Suo, R.Z.; Wang, M.J.; Zhao, T.Q. Contribution of Photosynthetic, Root and Phenotypic Traits to Soybean Plant Height. Sustainability 2024, 16, 2886. [Google Scholar] [CrossRef]
  23. Virdi, K.S.; Sreekanta, S.; Dobbels, A.; Haaning, A.; Jarquin, D.; Stupar, R.M.; Lorenz, A.J.; Muehlbauer, G.J. Branch angle and leaflet shape are associated with canopy coverage in soybean. Plant Genome 2023, 16, e20304. [Google Scholar] [CrossRef] [PubMed]
  24. Zhao, C.J.; Zhang, Y.; Du, J.J.; Guo, X.Y.; Wen, W.L.; Gu, S.H.; Wang, J.L.; Fan, J.C. Crop Phenomics: Current Status and Perspectives. Front. Plant Sci. 2019, 10, 714. [Google Scholar] [CrossRef] [PubMed]
  25. Fan, J.C.; Li, Y.L.; Yu, S.; Gou, W.B.; Zhao, C.J. Application of Internet of Things to Agriculture—The LQ-FieldPheno Platform: A High-Throughput Platform for Obtaining Crop Phenotypes in Field. Sci. Partn. J. 2023, 6, 0059. [Google Scholar] [CrossRef]
  26. Tillier, L.C.; Murchie, E.H.; Sparkes, D.L. Does canopy angle influence radiation use efficiency of sugar beet? Field Crop Res. 2023, 293, 108841. [Google Scholar] [CrossRef]
  27. Chang, T.G.; Zhao, H.L.; Wang, N.; Song, Q.F.; Xiao, Y.; Qu, M.N.; Zhu, X.G. A three-dimensional canopy photosynthesis model in rice with a complete description of the canopy architecture, leaf physiology, and mechanical properties. J. Exp. Bot. 2019, 70, 2479–2490. [Google Scholar] [CrossRef]
  28. Zhang, Z.Y.; Xu, S.J.; Wei, Q.R.; Yang, Y.X.; Pan, H.Q.; Fu, X.L.; Fan, Z.H.; Qin, B.T.; Wang, X.C.; Ma, X.M.; et al. Variation in Leaf Type, Canopy Architecture, and Light and Nitrogen Distribution Characteristics of Two Winter Wheat (Triticum aestivum L.) Varieties with High Nitrogen-Use Efficiency. Agronomy 2022, 12, 2411. [Google Scholar] [CrossRef]
  29. Hussain, S.; Pang, T.; Lqbal, N.; Shafiq, I.; Skalicky, M.; Brestic, M.; Safdar, M.E.; Mumtaz, M.; Ahmad, A.; Asghar, M.A. Acclimation strategy and plasticity of different soybean genotypes in intercropping. Funct. Plant Biol. 2020, 47, 592–610. [Google Scholar] [CrossRef]
  30. Li, X.; Chen, M.; He, S.; Xu, X.; He, L.; Wang, L.; Gao, Y.; Tang, F.; Gong, T.; Wang, W.; et al. Estimation of soybean yield based on high-throughput phenotyping and machine learning. Front. Plant Sci. 2024, 15, 1395760. [Google Scholar] [CrossRef]
  31. Liu, N.; Li, L.; Li, H.T.; Liu, Z.M.; Lu, Y.; Shao, L.W. Selecting maize cultivars to regulate canopy structure and light interception for high yield. Agron. J. 2022, 115, 770–780. [Google Scholar] [CrossRef]
  32. Cheng, Y.X.; Xiao, F.; Huang, D.Y.; Yang, Y.; Cheng, W.D.; Jin, S.C.; Li, G.H.; Ding, Y.F.; Paul, M.J.; Liu, Z.H. High canopy photosynthesis before anthesis explains the outstanding yield performance of rice cultivars with ideal plant architecture. Field Crop. Res. 2024, 306, 109223. [Google Scholar] [CrossRef]
  33. Furbank, R.T.; Jimenez-Berni, J.A.; George-Jaeggli, B.; Potgieter, A.B.; Deery, D.M. Field crop phenomics: Enabling breeding for radiation use efficiency and biomass in cereal crops. New Phytol. 2019, 223, 1714–1727. [Google Scholar] [CrossRef]
  34. Ma, X.D.; Zhu, K.X.; Guan, H.O.; Feng, J.R.; Yu, S.; Liu, G. High-Throughput Phenotyping Analysis of Potted Soybean Plants Using Colorized Depth Images Based on A Proximal Platform. Remote Sens. 2019, 11, 1085. [Google Scholar] [CrossRef]
  35. Li, X.N.; Xu, X.Y.; Xiang, S.; Chen, M.G.; He, S.Y.; Wang, W.Y.; Xu, M.; Liu, C.Y.; Yu, L.; Liu, W.G.; et al. Soybean leaf estimation based on RGB images and machine learning methods. Plant Methods 2023, 19, 59. [Google Scholar] [CrossRef]
  36. Sreekanta, S.; Haaning, A.; Dobbels, A.; O’Neill, R.; Hofstad, A.; Virdi, K.; Katagiri, F.; Stupar, R.M.; Muehlbauer, G.J.; Lorenz, A.J. Variation in shoot architecture traits and their relationship to canopy coverage and light interception in soybean (Glycine max). BMC Plant Biol. 2024, 24, 194. [Google Scholar] [CrossRef] [PubMed]
  37. Falchi, R.; Bonghi, C.; Drincovich, M.F.; Famiani, F.; Lara, M.V.; Walker, R.P.; Vizzotto, G. Sugar Metabolism in Stone Fruit: Source-Sink Relationships and Environmental and Agronomical Effects. Front. Plant Sci. 2020, 11, 573982. [Google Scholar] [CrossRef]
  38. Yan, S.C.; Wu, Y.; Fan, J.L.; Zhang, F.C.; Zheng, J.; Guo, J.J.; Lu, J.S.; Wu, L.F.; Qiang, S.C.; Xiang, Y.Z. Source-sink relationship and yield stability of two maize cultivars in response to water and fertilizer inputs in northwest China. Agric. Water Manag. 2022, 262, 107331. [Google Scholar] [CrossRef]
  39. Lu, M.Z.; Snyder, R.; Grant, J.; Tegeder, M. Manipulation of sucrose phloem and embryo loading affects pea leaf metabolism, carbon and nitrogen partitioning to sinks as well as seed storage pools. Plant J. 2019, 101, 217–236. [Google Scholar] [CrossRef]
  40. Fu, Z.D.; Chen, P.; Zhang, X.N.; Du, Q.; Zheng, B.C.; Yang, H.; Luo, K.; Lin, P.; Li, Y.L.; Pu, T.; et al. Maize-legume intercropping achieves yield advantages by improving leaf functions and dry matter partition. BMC Plant Biol. 2023, 23, 438. [Google Scholar] [CrossRef]
  41. Egashira, C.; Hashiguchi, Y.; Kurauchi, E.; Tatsumi, Y.; Nakagawa, A.C.S.; Hamaoka, N.; Yuasa, T.; Iwaya-inoue, M.Y.; Ishibashi, Y. A rapid translocation of photoassimilates from source organs maintains grain yield in cowpea subjected to drought stress during grain filling. Biol. Plant. 2019, 64, 529–534. [Google Scholar] [CrossRef]
  42. Panda, D.; Dash, G.K.; Mohanty, S.; Sekhar, S.; Roy, A.; Tudu, C.; Behera, L.; Tripathy, B.C.; Baig, M.J. Phytochrome A mediated modulation of photosynthesis, development and yield in rice (Oryza sativa L.) in fluctuating light environment. Environ. Exp. Bot. 2023, 206, 105183. [Google Scholar] [CrossRef]
  43. Yang, H.K.; Zhao, J.R.; Ma, H.L.; Shi, Z.Q.; Huang, X.L.; Fan, G.Q. Shading affects the starch structure and digestibility of wheat by regulating the photosynthetic light response of flag leaves. Int. J. Biol. Macromol. 2023, 236, 123972. [Google Scholar] [CrossRef]
  44. Zheng, B.; Zhao, W.; Ren, T.H.; Zhang, X.H.; Ning, T.Y.; Liu, P.; Li, G. Low Light Increases the Abundance of Light Reaction Proteins: Proteomics Analysis of Maize (Zea mays L.) Grown at High Planting Density. Int. J. Mol. Sci. 2022, 23, 3015. [Google Scholar] [CrossRef]
  45. Zhang, J.Z.; Shi, L.; Shi, A.P.; Zhang, Q.X. Photosynthetic responses of four Hosta cultivars to shade treatments. Photosyntheti 2004, 42, 213–218. [Google Scholar] [CrossRef]
  46. Fan, Y.H.; Lv, Z.Y.; Qin, B.Y.; Yang, J.H.; Ren, K.M.; Liu, Q.X.; Jiang, F.Y.; Zhang, W.J.; Ma, S.Y.; Ma, C.X.; et al. Night warming at the vegetative stage improves pre-anthesis photosynthesis and plant productivity involved in grain yield of winter wheat. Plant Physiol. Biochem. 2022, 186, 19–30. [Google Scholar] [CrossRef] [PubMed]
  47. Luo, C.S.; Guo, Z.P.; Xiao, J.X.; Dong, K.; Dong, Y. Effects of Applied Ratio of Nitrogen on the Light Environment in the Canopy and Growth, Development and Yield of Wheat When Intercropped. Front. Plant Sci. 2021, 12, 719850. [Google Scholar] [CrossRef]
  48. Deng, F.; Li, B.; Yuan, Y.J.; He, C.Y.; Zhou, X.; Li, Q.P.; Zhu, Y.Y.; Huang, X.F.; He, Y.X.; Ai, X.F.; et al. Increasing the number of seedlings per hill with reduced number of hills improves rice grain quality by optimizing canopy structure and light utilization under shading stress. Field Crop. Res. 2022, 287, 108668. [Google Scholar] [CrossRef]
  49. Liang, F.B.; Yang, C.X.; Sui, L.L.; Xu, S.Z.; Yao, H.S.; Zhang, W.F. Flumetralin and dimethyl piperidinium chloride alter light distribution in cotton canopies by optimizing the spatial configuration of leaves and bolls. J. Integr. Agric. 2020, 19, 1777–1788. [Google Scholar] [CrossRef]
  50. Oikawa, S.; Ainsworth, E.A. Changes in leaf area, nitrogen content and canopy photosynthesis in soybean exposed to an ozone concentration gradient. Environ. Pollut. 2016, 215, 347–355. [Google Scholar] [CrossRef]
  51. Li, S.W.; van Der Werf, W.; Zhu, J.Q.; Guo, Y.; Li, B.G.; Ma, Y.T.; Evers, J.B. Estimating the contribution of plant traits to light partitioning in simultaneous maize/soybean intercropping. J. Exp. Bot. 2021, 72, 3630–3646. [Google Scholar] [CrossRef] [PubMed]
  52. Gou, F.; van Ittersum, M.K.; Simon, E.; Leffelaar, P.A.; van der Putten, P.E.L.; Zhang, L.Z.; van der Werf, W. Intercropping wheat and maize increases total radiation interception and wheat RUE but lowers maize RUE. Eur. J. Agron. 2017, 84, 125–139. [Google Scholar] [CrossRef]
  53. Bi, Y.L.; Zhou, H.L. Changes in peanut canopy structure and photosynthetic characteristics induced by an arbuscular mycorrhizal fungus in a nutrient-poor environment. Sci. Rep. 2021, 11, 14832. [Google Scholar] [CrossRef] [PubMed]
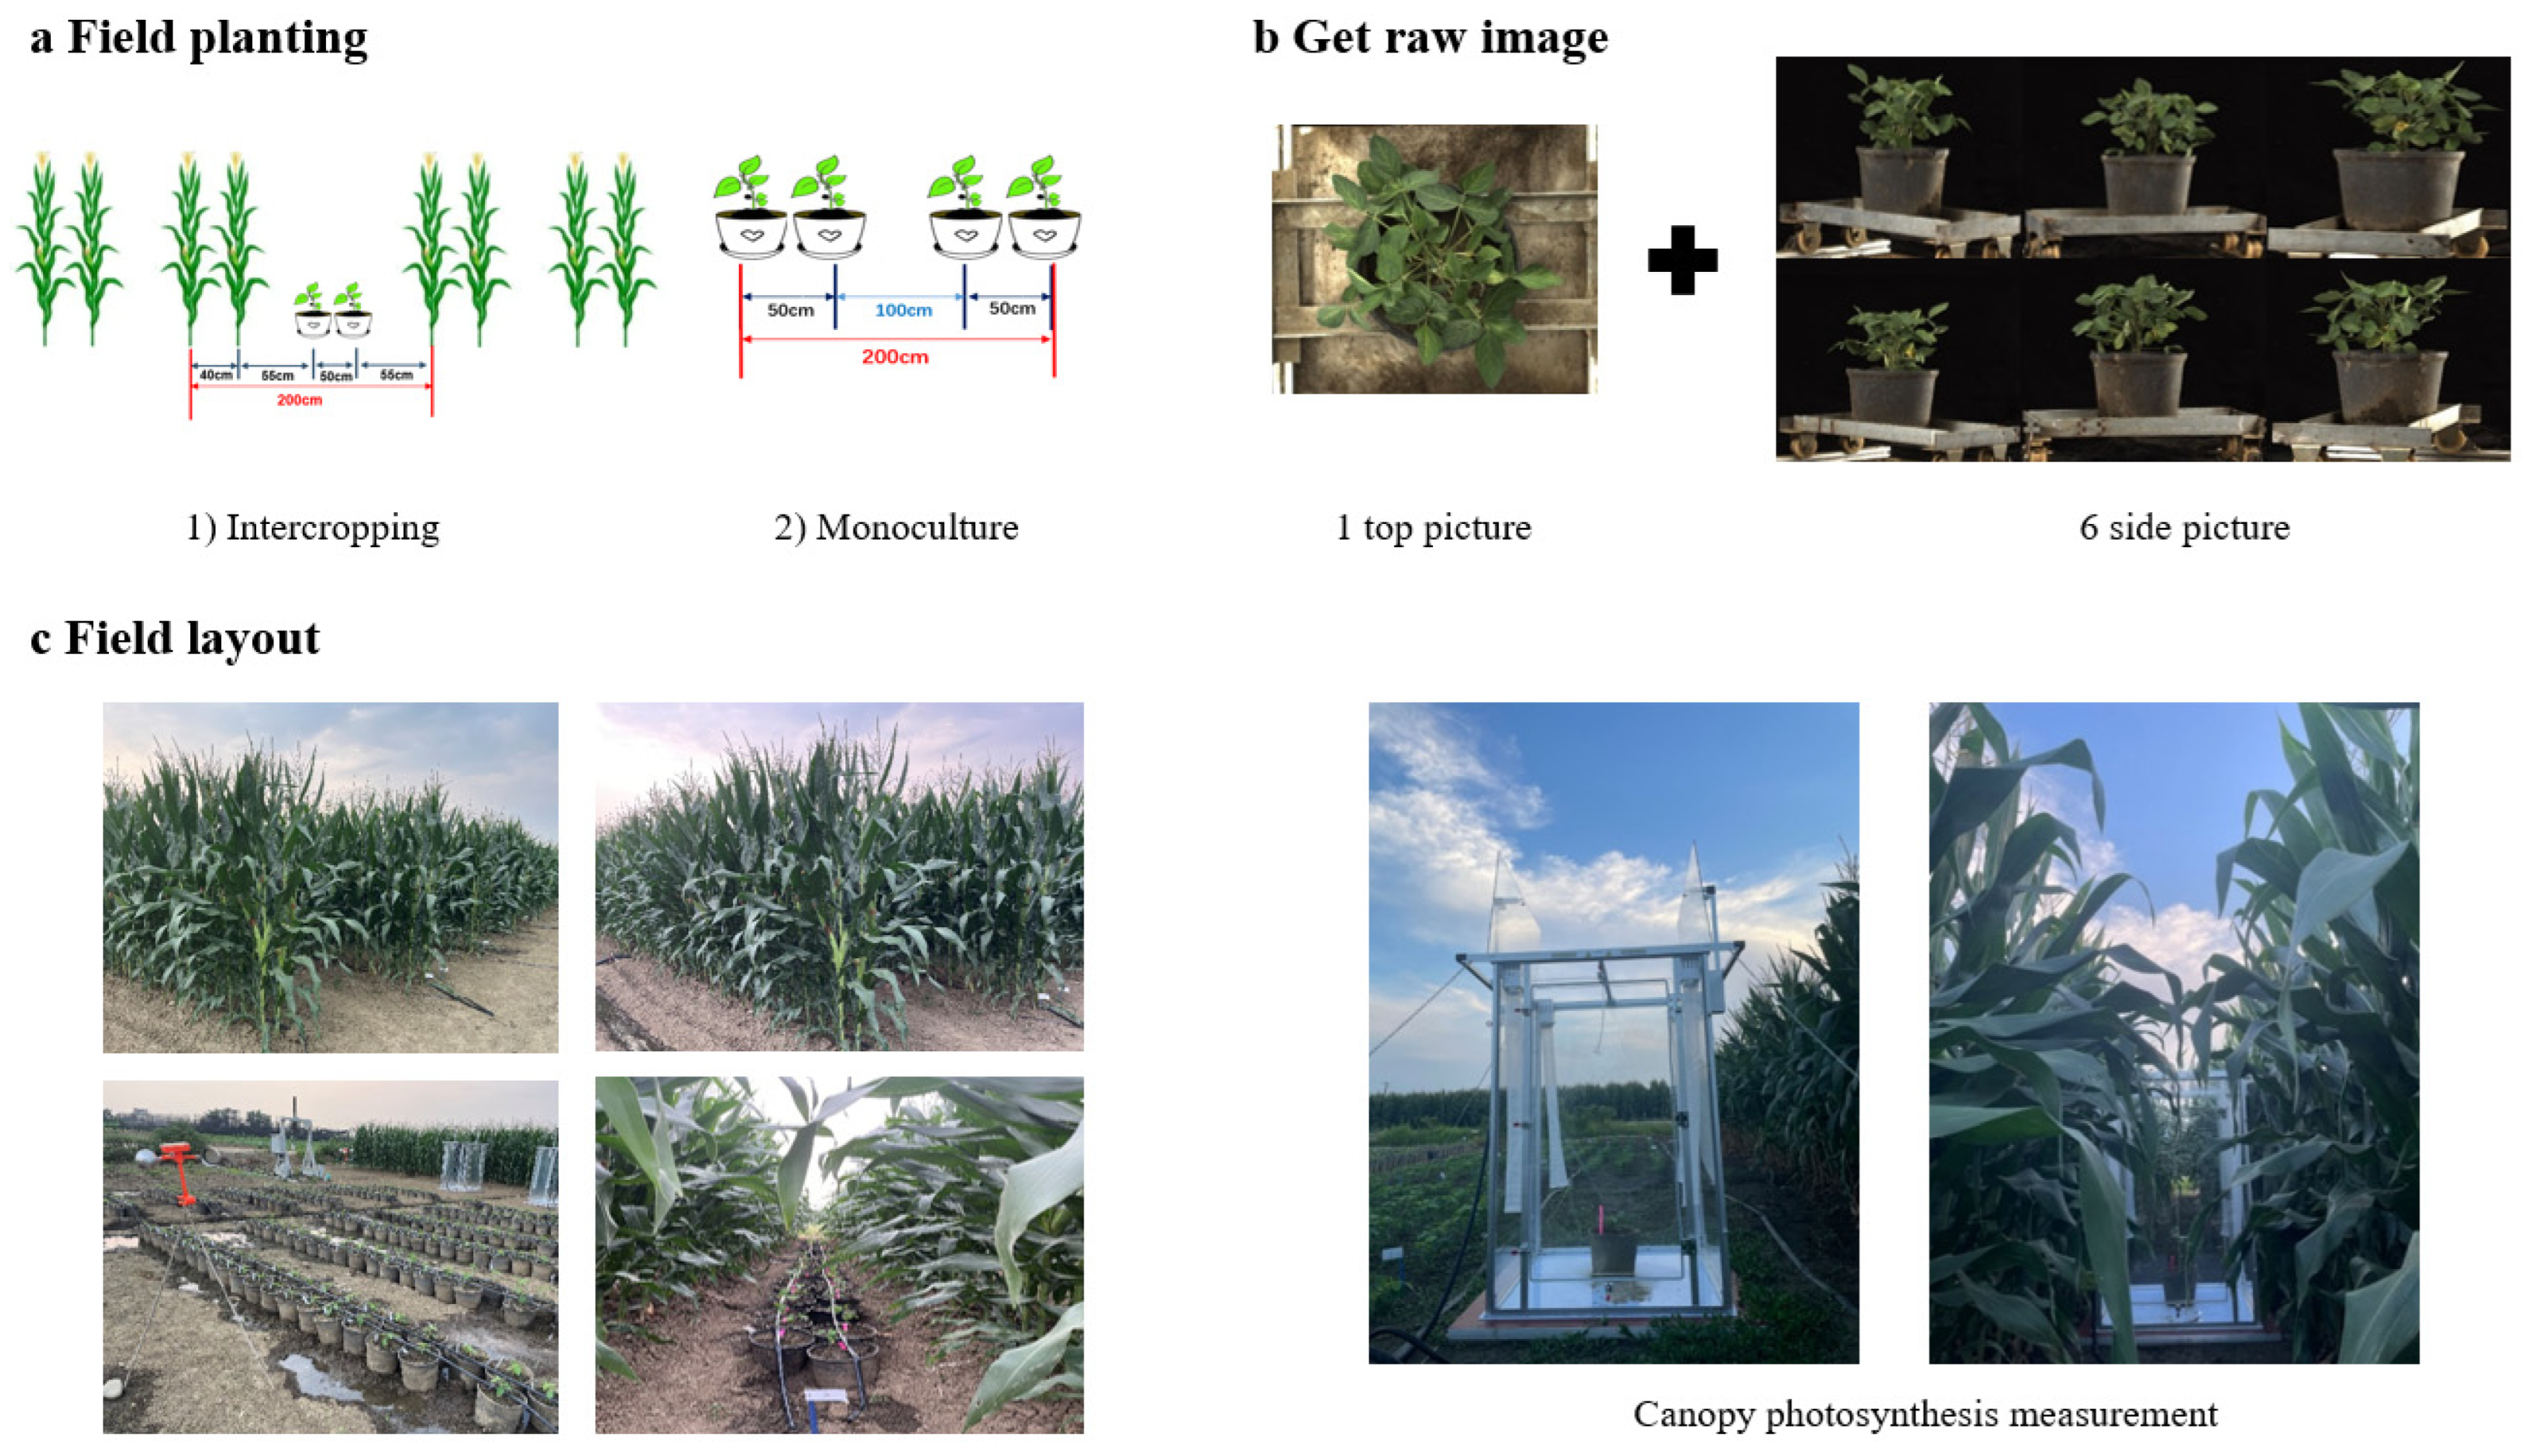
Figure 1. Soybean test layout. Figure (a) shows the experimental layout of the soybeans in field conditions. Figure (b) represents the original image generated by an RGB camera; Figure (c) shows the layout of the field environmental test and the real state of canopy photosynthesis.
Agriculture 14 01783 g001
Figure 2. Changes in dry matter content in leaves, main stems, and branches with emergence time. The red solid line in the figure indicates the day of the corn harvest. STV-1, STV-2, SSV-1, and SSV-2 represent ND12, NJQP, C103, and BYH soybean varieties, respectively. “M” represents soybean monoculture, and “I” represents soybean and corn intercropping.
Agriculture 14 01783 g002
Figure 3. Figures (af) represent, in sequence, soybean yield per plant, number of grains per plant, 100-grain weight, number of branches, number of pods on branches, and number of pods on the main stem. The significance analysis in this study is conducted at the p = 0.05 level. In the figures, lowercase and uppercase letters are used to distinguish between sole cropping and intercropping levels. Lowercase letters indicate sole cropping, while uppercase letters indicate intercropping, and the same applies to the following figures.
Agriculture 14 01783 g003
Figure 4. Diurnal variation of canopy photosynthetic rate.
Agriculture 14 01783 g004
Figure 5. Light response diagram. Figures (ad) represent the light response curves of soybeans at 28 days before corn harvest, and at 15, 35, and 55 days after corn harvest, respectively. The solid line in the figure represents the information concerning the canopy light response curve, and the dashed line represents the apparent quantum efficiency of the STV-1 and SSV-1 varieties.
Agriculture 14 01783 g005
Figure 6. Whole-leaf photosynthetic potential map. The red solid line in the figure indicates the day of the corn harvest.
Agriculture 14 01783 g006
Figure 7. Four canopy structure parameters related to the top area. The significance analysis in this study is conducted at the p = 0.05 level. In the figures, lowercase and uppercase letters are used to distinguish between sole cropping and intercropping levels. Lowercase letters indicate sole cropping, while uppercase letters indicate intercropping.
Agriculture 14 01783 g007aAgriculture 14 01783 g007b
Figure 8. Two canopy structure parameters related to side width. The significance analysis in this study is conducted at the p = 0.05 level. In the figures, lowercase and uppercase letters are used to distinguish between sole cropping and intercropping levels. Lowercase letters indicate sole cropping, while uppercase letters indicate intercropping.
Agriculture 14 01783 g008
Figure 9. 1_5, 2_5, 3_5, 4_5, 5_5 side width diagram. In the figure, M represents the net planting mode, and I represents the intercropping planting mode; 1–4 represent STV-1, STV-2, SSV-1, and SSV-2, respectively.
Agriculture 14 01783 g009
Figure 10. Illustrates the mechanism of STV variety yield prominence. The blue rectangles in the canopy structure represent the top and side bounding rectangle areas, and the yellow circles represent the top bounding circle area. The gray boxes highlight the advantages of STV varieties in terms of canopy structure, photosynthetic activity, and assimilate accumulation, which lead to their outstanding yield performance.
Agriculture 14 01783 g010
Table 1. Related information concerning index measurement. PL means before corn harvest AR means after corn harvest.
IndexVarietyEnvironmentMeasurement Period
Canopy structureSTV-1,2; SSV-1,2Field,PL-28d; AR-15, 35, 55d
IndoorPL-23, 16, 9d; AR-7d
Single-leaf photosynthesisSTV-1,2; SSV-1,2IndoorPL-23, 16, 9d; AR-7d
Canopy photosynthesisSTV-1, SSV-1FieldPL-28d; AR-15, 35, 55d
Growth and development monitoringSTV-1,2; SSV-1,2FieldPeriod V1-R5
Table 2. Nutrient reactivation rate and yield contribution rate of each organ. The overall ranking was based on the sum of the remobilization rates of the above-ground organs for each treatment. RR represents the nutrient reactivation rate of each organ, and CR represents the yield contribution rate. The case of the letters in the table is used solely to distinguish between sole cropping and intercropping levels. Lowercase letters indicate sole cropping, while uppercase letters indicate intercropping, and the same applies to the following tables.
TreatmentVarietyPlanting PatternRR (%)CR (%)
LeavesStemBranchPodsSynthetic Sort
FiledSTV-1M32.4 b2.5 a2.8 a6.3 b459.15 bc
STV-230.9 b3.0 a4.3 a6.5 b361.80 c
SSV-120.0 a4.6 a1.9 a4.0 ab658.81 b
SSV-219.4 a4.8 a3.0 a3.3 a722.92 a
STV-1I36.3 BC3.2 A4.0 B8.9 C274.61 A
STV-246.4 C4.8 A4.6 B10.4 C162.76 A
SSV-119.7 A3.9 A1.2 A2.0 A853.86 A
SSV-229.5 AB5.2 A3.1 AB4.9 B555.42 A
IndoorSTV-1M0.34 c0.25 b0.68 c0.25 c476.85 c
STV-20.47 d0.16 a0.82 d0.30 d388.48 d
SSV-10.21 b0.35 c0.35 a0.17 a859.45 b
SSV-20.15 a0.36 c0.40 b0.22 b752.18 a
STV-1I0.38 C0.29 B0.71 C0.41 C244.92 C
STV-20.51 D0.14 A0.75 D0.46 D172.99 D
SSV-10.20 B0.34 C0.66 B0.22 A637.32 B
SSV-20.05 A0.52 D0.62 A0.25 B529.45 A
Table 3. Photosynthesis of single leaf of soybean with different shade tolerance types. The significance analysis in this study is conducted at the p = 0.05 level. In the table, lowercase and uppercase letters are used to distinguish between sole cropping and intercropping levels. Lowercase letters indicate sole cropping, while uppercase letters indicate intercropping. NL indicates normal light processing, ST indicates shade processing, ST = 40%NL.
IndexPeriodTreatmentSTV-1STV-2SSV-1SSV-2
Pn
µmol·m−2·s−1
PL-23NL15.09 ± 0.45 c14.70 ± 1.04 c12.95 ± 1.18 b10.92 ± 0.15 a
ST8.34 ± 1.09 C7.38 ± 1.36 BC5.14 ± 0.68 A5.98 ± 0.63 AB
PL-16NL18.48 ± 0.06 b18.91 ± 0.83 b14.60 ± 1.21 a17.80 ± 0.32 b
ST17.19 ± 0.79 C16.87 ± 0.14 BC14.44 ± 0.53 A16.00 ± 0.65 B
PL-9NL15.82 ± 0.14 c14.65 ± 0.72 b13.31 ± 0.13 a12.68 ± 0.06 a
ST15.54 ± 0.72 C14.53 ± 1.55 BC13.06 ± 0.14 AB12.22 ± 0.55 A
AR-7NL8.38 ± 0.22 ab9.14 ± 0.22 b8.92 ± 0.18 ab8.08 ± 0.99 a
ST7.91 ± 2.58 AB8.82 ± 1.52 B8.44 ± 0.72 B5.07 ± 1.43 A
Tr
mmol·m−2·s−1
PL-23NL5.11 ± 0.07 b4.12 ± 0.31 a3.40 ± 0.83 a3.28 ± 0.55 a
ST2.55 ± 0.94 B1.52 ± 0.57 AB1.38 ± 0.30 AB1.12 ± 0.64 A
PL-16NL3.72 ± 0.26 a3.99 ± 0.36 ab4.07 ± 0.54 ab4.76 ± 0.78 b
ST5.69 ± 0.31 AB4.47 ± 0.39 A6.95 ± 0.62 B6.16 ± 1.92 AB
PL-9NL3.39 ± 0.23 b2.74 ± 0.59 ab2.96 ± 0.18 ab2.47 ± 0.13 a
ST4.20 ± 0.71 A3.36 ± 1.26 A4.02 ± 0.13 A4.20 ± 2.08 A
AR-7NL1.67 ± 0.62 ab1.12 ± 0.38 a2.02 ± 0.44 b0.93 ± 0.18 a
ST1.15 ± 0.81 A1.44 ± 0.16 A1.41 ± 0.29 A0.86 ± 0.47 A
Ci
µmol·m−2·s−1
PL-23NL333.47 ± 1.2 c322.07 ± 19.8 ab298.61 ± 18.6 a317.95 ± 12.8 ab
ST327.93 ± 23.9 B296.24 ± 14.6 A301.66 ± 1.5 AB295.88 ± 11.5 A
PL-16NL295.22 ± 6.46 a296.02 ± 13.05 a320.01 ± 7.73 b312.42 ± 12.66 ab
ST352.40 ± 7.78 A330.92 ± 18.85 A353.04 ± 6.44 A336.90 ± 26.90 A
PL-9NL311.93 ± 14.48 b262.55 ± 30.49 a295.54 ± 16.34 ab253.32 ± 27.71 a
ST320.22 ± 17.90 A286.96 ± 38.11 A306.85 ± 5.50 A313.89 ± 33.10 A
AR-7NL276.46 ± 28.63 b218.03 ± 26.50 a258.65 ± 10.79 b203.88 ± 8.48 a
ST217.64 ± 48.11 A241.89 ± 7.39 A233.64 ± 31.66 A232.02 ± 55.36 A
Gs
µmol·m−2·s−1
PL-23NL0.50 ± 0.05 b0.37 ± 0.05 a0.28 ± 0.08 a0.27 ± 0.05 a
ST0.24 ± 0.14 B0.11 ± 0.04 AB0.08 ± 0.01 A0.09 ± 0.05 AB
PL-16NL0.31 ± 0.03 a0.33 ± 0.04 a0.34 ± 0.05 a0.41 ± 0.09 a
ST0.62 ± 0.09 B0.34 ± 0.09 A0.66 ± 0.09 B0.57 ± 0.22 AB
PL-9NL0.34 ± 0.06 b0.19 ± 0.05 a0.26 ± 0.03 ab0.17 ± 0.04 a
ST0.41 ± 0.04 A0.26 ± 0.12 A0.33 ± 0.03 A0.36 ± 0.24 A
AR-7NL0.12 ± 0.04 b0.08 ± 0.02 ab0.13 ± 0.01 b0.06 ± 0.02 a
ST0.08 ± 0.06 A0.10 ± 0.01 A0.10 ± 0.02 A0.06 ± 0.03 A
Table 4. Correlation analysis between canopy structure and canopy photosynthesis. The data in the table are the combined values of four samples taken before and after the harvest of corn in the field. *, **, and *** indicate significant differences at a probability level of 0.05, 0.01, and 0.001, respectively; ns indicates a non-significant difference.
Canopy StructureMeaningPnSignificance
Top parameterTop perimeterTP0.80***
Top projected areaTPA10.91***
Top contour areaTCA10.92***
Top rectangular widthTRW0.86***
Top rectangular heightTRH0.91***
Top outer circle radiusTCR0.90***
Top rectangular areaTRA0.91***
Top circle areaTCA20.91***
Top circle compactnessTCC0.46ns
The ratio of the area of the top projection to the area of the outer rectangleTPRA−0.17ns
Ratio of top height to widthTHW0.45ns
Ratio of top circumference to areaTPA2−0.84***
Top convex hull areaTCA30.89***
Number of top convex hull verticesTCN−0.57*
Top shape rate compactnessTSC0.91***
Top round rate compactnessTRC−0.45ns
Side parameterSide perimeterSP0.77***
Side projection areaSPA10.90***
Side profile areaSCA10.90***
1_5 area ratio1_5AR−0.51*
2_5 area ratio2_5AR0.04ns
3_5 area ratio3_5AR0.43ns
4_5 area ratio4_5AR0.54*
5_5 area ratio5_5AR0.001ns
1_5 maximum width1_5MW0.93***
2_5 maximum width2_5MW0.94***
3_5 maximum width3_5MW0.89***
4_5 maximum width4_5MW0.83***
5_5 maximum width5_5MW0.62**
Side mean widthSMW0.87***
Crown heightCH0.54*
Crown height/plant heightCPH−0.28ns
Crown breadthTC20.91***
Minimum side widthSMIW0.90***
Side external rectangular heightSRH0.71**
Radius of the side circumscribed circleSCR0.73**
Side rectangle areaSRA0.92***
Side circumscribed circular areaSCA20.72**
Side shape rate compactnessSSC0.92***
Side circularity compactnessSRC−0.23ns
Compactness of side circumferential circleSCC0.61*
Side projected area/external rectangular areaSPRA0.61*
Side height/widthSHW−0.20ns
Side circumference/areaSPA2−0.89***
Area of convex hullSCA0.87***
Number of vertices of convex hullSCN0.43ns
Table 5. Canopy overlap ratio (COR). C O R = 5 / 5 M W 1 / 5 M W × 100 % . The significance analysis in this study is conducted at the p = 0.05 level. In the table, lowercase and uppercase letters are used to distinguish between sole cropping and intercropping levels. Lowercase letters indicate sole cropping, while uppercase letters indicate intercropping.
COR (%)MIMIMIMI
Treatment PL-28AR-15AR-35AR-55
FieldSTV-140.03 c8.12 A27.54 a5.07 A24.32 a19.50 A84.44 b62.03 B
STV-223.46 a11.55 B55.38 c23.35 B54.53 b23.04 B105.02 d60.34 B
SSV-151.63 d13.75 C52.48 b24.43 B70.52 c26.40 C100.15 c23.34 A
SSV-232.18 b14.11 C54.73 c48.15 C69.27 c90.37 D71.65 a82.85 C
PL-23PL-16PL-9AR-7
IndoorSTV-185.53 a120.60 B229.38 b103.29 B106.05 a97.53 B128.79 b123.84 B
STV-286.78 a86.56 A155.32 a96.39 A155.59 b74.69 A121.00 a121.86 A
SSV-1252.02 c180.79 D387.73 c123.29 C313.32 d135.50 C336.74 d171.49 D
SSV-2219.75 b152.62 C398.32 d122.23 C166.53 c145.70 D176.32 c153.26 C
Disclaimer/Publisher’s Note: The statements, opinions and data contained in all publications are solely those of the individual author(s) and contributor(s) and not of MDPI and/or the editor(s). MDPI and/or the editor(s) disclaim responsibility for any injury to people or property resulting from any ideas, methods, instructions or products referred to in the content.