Article

Enhancing Nutritional Value of Rhubarb (Rheum rhaponticum L.) Products: The Role of Fruit and Vegetable Pomace

1
Department of Plant Product Technology and Nutrition Hygiene, Faculty of Food Technology, University of Agriculture in Krakow, Balicka 122 Street, 30-149 Krakow, Poland
2
Department of Carbohydrate Technology and Cereal Processing, Faculty of Food Technology, University of Agriculture in Krakow, Balicka 122 Street, 30-149 Kraków, Poland
*
Author to whom correspondence should be addressed.
Agriculture 2024, 14(10), 1784; https://doi.org/10.3390/agriculture14101784
Submission received: 18 September 2024 / Revised: 7 October 2024 / Accepted: 9 October 2024 / Published: 11 October 2024
(This article belongs to the Special Issue Nutritional Quality and Health of Vegetables)

Abstract

:
In this study, the quality and health-promoting components in rhubarb products sweetened with isomaltulose and enriched with fruit (apple, chokeberry, black currant) and vegetable (beetroot, carrot) pomace were assessed. All products with added pomace had higher levels of ash (27–65%) and macro- and microelements (5–436% and 5–333%) compared to the sample without pomace. The addition of pomace also increased the total antioxidant activity. The addition of pomace increased the value of gel strength (Fe) by 22–73% compared to the control; the highest value was found in the product enriched with chokeberry pomace (1.71 N). Red (a* > 0) and yellow (b* > 0) dominated all products, and values of the L* parameter ranged from 7.81 to 37.54. The brightest were the products with added carrot, apple, and beet pomace, while the darkest were those containing chokeberry and blackcurrant pomace. The values of the texture parameters decreased after storage, but to a lesser extent in the products with pomace; however, the products with pomace maintained greater antioxidant activity and retained beneficial components better than those without. A slight darkening of the products and a decrease in the proportion of red (a*) and yellow (b*) color was also observed.

1. Introduction

Fruits and vegetables are essential for a balanced daily diet, as they are a source of phytochemicals (e.g., phenolics, carotenoids), vitamins (e.g., vitamin C, folate, pro-vitamin A), minerals (e.g., potassium, calcium, magnesium) and fibers [1,2]. World Health Organization [3] recommends the consumption of at least 400 g (i.e., five servings) of fruit and vegetables per day. Increasing intake of these products within a balanced diet may prevent or at least reduce the risk of many non-communicable diseases (NCDs), including hypertension, coronary heart disease, and stroke [4,5,6]. Additionally, a higher intake of fruits and vegetables is likely to lower the risk of developing cancer, such as gastrointestinal types [7]. Conversely, low intake results in higher rates of non-communicable diseases [8,9,10].
In recent years, interest in natural foods has been steadily increasing and foods rich in substances beneficial to human health [11]. In addition to fruit, vegetables play a key role in the production of such foods. Consumers are increasingly aware of the importance of eating enough vegetables and their impact on body functions. Nevertheless, in most countries, the supply of vegetables is currently insufficient to satisfy the dietary recommendations for daily intake of these raw materials. Innovative approaches to diet are therefore needed [10]. Hence, vegetable products with sucrose substitute, i.e., isomaltulose, also known as palatinose, can be an alternative to popular fruit preserves with solid consistency (jams, preserves, marmalades), often sweetened with sucrose. Isomaltulose (IM), made up of glucose and fructose linked by alpha-1,6 bonds, has attracted growing attention as a sweetener replacement for sucrose due to its low glycemic index. (GI 32 for IM vs. 65 for sucrose) [12]. In the European Union (EU), IM has been approved for general use in food by the Regulation of the European Parliament and the EU Council [13]. In the USA, it has a confirmed status of GRAS—Generally Recognized as Safe—indicating that it is safe [14]. It is also authorized for use in Japan, China, and Taiwan [15]. IM is presently utilized in a range of food and beverage products, as well as in specialized nutrition formulas and clinical diets, serving as a food ingredient and sugar substitute [16]. Replacing sugar with IM may have positive effects on cardiovascular health by promoting a more stable and balanced blood glucose response [16,17]. Keyhani-Nejad et al. [18] demonstrated that IM positively impacts glucose metabolism and lowers insulin secretion in individuals with type 2 diabetes.
The rise in the functional food assortment is also an important trend in the food industry. Therefore, an increasing number of plant-based traditional products are being enhanced with naturally sourced health-promoting ingredients, preventing cancer and cardiovascular diseases as well as improving metabolism [19,20]. Fruit and vegetable pomace, which is a post-production waste, is considered a valuable enrichment additive. They are mostly derived from fruit and vegetable processing (e.g., juice production) and consist mainly of peels, pomace, and seed fractions, which are high in various components with proven therapeutic potential, including bioactive ones (polyphenols, carotenoids) [21,22,23,24]. Therefore, they serve as valuable raw materials for the production of high-value products, pharmaceuticals, dietary supplements, or functional food [23,25].
The production of jam vegetable products as an alternative to popular fruit jams is an example of the utilization of vegetable post-production waste. Rhubarb is a popular vegetable that can be used with pomace. This perennial plant is grown for its stalks; however, its leaves are poisonous due to oxalic acid content [26]. Rhubarb comprises approx. 60 plant species in the genus Rheum L. [27], and is widespread in primarily Asian countries, where it is used for medicinal purposes as an anti-inflammatory and anti-cancer agent [28]. Primarily cultivated in Germany, France, and England, this crop is an important agricultural product in Europe [26]. Rhubarb also exhibits an effective antibacterial effect against multiple bacterial strains, including Staphylococcus aureus, Helicobacter pylori, and Escherichia coli [29]. This is attributed to the presence of various bioactive compounds, including flavonoids, tannins, glycosides, saponins, and volatile oils [30,31].
Rhubarb is eaten as a vegetable and is cherished for its use in a variety of cakes and sauces, as well as jellies, compotes, juices, wines, ice cream, and yogurt [32]. It seems that the inclusion of fruit and vegetable pomace in jelly, jam-like rhubarb products can benefit their health-promoting properties without compromising their quality (e.g., texture or color) and expand the range of products that are interesting for the consumer.
Therefore, based on the information presented, the research aimed to assess the potential for utilizing fruit (apple, chokeberry, blackcurrant) and vegetable (carrot, red beet) pomace in isomaltulose-sweetened rhubarb products. These are popular species in juice production, from which the waste product (pomace) remains. Obtained products were evaluated immediately after production and after 8 months of storage.

2. Materials and Methods

2.1. Material

The experimental material was low-sugar rhubarb (Rheum rhaponticum L.) products, which were produced at the Department of Plant Product Technology and Nutrition Hygiene in Krakow (Poland) in 2022. The products were made with and without the addition of pomace obtained from fruit (chokeberry, apples, black currant) and vegetables (red beets, carrots). The fresh rhubarb (cv. Victoria) was purchased in 2022 at a local supermarket. The rhubarb was mature, and the stalks were characterized by an intense red color. After pre-processing (peeling, washing, removal of inedible parts), the rhubarb was sliced (2 cm pieces) and stored at −30 °C until the products were ready to be cooked. Fresh pomace was obtained in the laboratory (Department of Plant Product Technology and Nutrition Hygiene in Krakow) after pressing juices from fruits (chokeberries, apples, black currants) and vegetables (red beets, carrots). Juices were obtained using an Omega Sana EUJ-707 juicer (Sana 707, Sana Products Ltd., Ceske Budejovice, Czech Republic). The pomace was frozen and stored at −30 °C. Isomaltulose (Młyn Oliwski, Gdańsk, Poland), citrus–apple pectin (NECJ-A2, Naturex, Avignon, France), and citric acid (Chem Point, Kraków, Poland) were additionally incorporated into the production process.
The following product variants were prepared:
RO (control sample)—rhubarb product without pomace;
RA—rhubarb product with the addition of apple pomace;
RCh—rhubarb product with the addition of chokeberry pomace;
RBc—rhubarb product with the addition of blackcurrant pomace;
RC—rhubarb product with the addition of carrot pomace;
RB—rhubarb product with the addition of red beet pomace.

2.2. Methods

2.2.1. Production of Rhubarb Products

In the products, rhubarb and pomace accounted for 55% and 20% of the product weight, respectively. When establishing the products’ recipes, it was assumed that the extract of the products (total soluble solids content) was 20% and the total acidity of 0.6 g of citric acid in 100 g. Defrosted in a refrigerator, rhubarb and pomace, together with isomaltulose (weighed in accordance with the recipe, Table 1), were cooked in an open pot for 20 min at approx. 100 °C until the raw material was softened and a suitable extract was obtained. A prepared 4% solution of pectin was subsequently mixed and heated for approx. 3 min. Subsequently, citric acid was incorporated. The total cooking time was 25–30 min. The mass obtained was then poured into glass jars (130 mL), hermetically sealed, pasteurized (82–85 °C, 14 min), and cooled in water to 20 °C. The products have been stored in the dark inside a cold chamber at 8 °C until evaluated. The product assessment was conducted immediately following production and again after a period of 8 months from the date of production.

2.2.2. Chemical Analysis

Ash and macro- and microelements content were determined in the products immediately only after production. Ash content was determined using AOAC methods [33] by subjecting a sample to incineration at 460 °C in the L9/S 27 furnace (Nabertherm GmbH, Lilienthal, Germany). The concentrations of micro- and macroelements were determined using an ICP-OES spectrophotometer (Prodigy Spectrometer, Leeman Labs, New Hampshire, MA, USA) following microwave digestion with 65% super-pure HNO3. A total of 2 g of products were introduced into 55 mL vessels made from TFM-modified polytetrafluoroethylene (PTFE) and digested in 10 mL of 65% HNO3 with the aid of a CEM MARS-5 Xpress microwave digestion system (CEM World Headquarters, Matthews, NC, USA) [34].
The extraction of polyphenols and assessment of antioxidant activity were conducted using 80% methanol that had been acidified with 0.5% HCl. The total polyphenol concentration was measured using a spectrophotometric technique involving the Folin–Ciocalteau reagent [35]. For the total flavonoid content, a spectrophotometric method based on the complexation of flavonoids with aluminum chloride (AlCl3) was employed [36]. The quantities of polyphenols and flavonoids were derived from a standard curve based on (+)-catechin.
Total anthocyanin content was determined using a spectrophotometric method [37]. Samples were prepared for analysis according to the procedure described by Plessi, Bertelli, and Albasini [38]. Anthocyanin content, expressed as cyanidin-3-glucoside equivalent, was calculated from the absorbance measured and the coefficient of sample dilution.
The level of β-carotene was determined by a spectrophotometric method [39]. The samples were homogenized with the mixture of acetone/hexane mixture in a ratio of 4:6 for 2 min. The homogenate was quantitatively transferred into volumetric flasks (25 cm3) with the same acetone/hexane mixture, and after making up the mark, they were centrifuged (10 min, 4 °C, 5000× g) (centrifuge type MPW—260R, Warsaw, Poland). After centrifugation, the absorbance was measured at the wavelengths 453, 505, and 663 nm. The level of β-carotene was calculated from the following formula:
β-carotene (mg/100 mL) = 0.216A663 − 0.304A505 + 0.452A453,
The values obtained, after taking into account the sample dilution, were then converted to 100 g.
Antioxidant activity was evaluated using two spectrophotometric techniques: the scavenging effect on the DPPH (1,1-diphenyl-2-picrylhydrazyl) free radical [40] and the utilization of the ABTS (2,2′-azinobis(3-ethylbenzthiazoline-6-sulfonate)) cation radical [41]. Absorbance readings for these methods were taken at wavelengths of 516 nm and 734 nm, respectively. The results were reported as Trolox equivalent antioxidant activity in µmol Tx/g, with Trolox prepared in a phosphate-buffered saline (PBS) solution at a concentration of 2.5 mM/L and a pH of 7.4.
The concentrations of polyphenols, β-carotene, and antioxidant activity were assessed in both freshly produced and stored samples after 8 months, utilizing a Hitachi U-2900 double beam spectrophotometer (Hitachi Europe Ltd., Datchet, UK).

2.2.3. CIE (L*a*b*) Color Evaluation

The color of the upper surface was analyzed using a Konica MINOLTA CM-3500d instrument (Konica Minolta Inc., Tokyo, Japan), referencing the D65 illuminant and a visual angle of 10°. Results were reported according to the CIE (L*a*b*) color space system [42]. From these measurements, the following color parameters were established: L* indicating lightness (with L* = 0 representing black and L* = 100 indicating white); a* representing the balance of green (a* < 0) or red (a* > 0) color; b* indicating the balance of blue (b* < 0) or yellow (b* > 0) color; C* representing chroma; and h° indicating the hue angle. Color differences (ΔE*) between two samples were calculated using the established formula:
ΔE* = [(L*cL*s)2 + (a*ca*s)2 + (b*cb*s)2]1/2,
where the index c denotes the color parameters of the control sample and s denotes the color parameters of the tested sample.
The measurement was made immediately after the products were manufactured and after 8 months of storage.

2.2.4. Texture Analysis

Texture analysis was conducted according to Genovese, Ye, and Singh [43] using the TA-XT2 plus texturometer (Stable Micro Systems, Godalming, UK). Measurements were conducted at a compression rate of 2 mm/s using a P/20 probe with a diameter of 20 mm, at a penetration depth of 20 mm, with a trigger force set to 1 g. The specimens were conditioned at ambient temperature prior to measurement. Each sample was measured in triplicate using three different product packages. Results were calculated with the Texture Exponent program (Stable Micro Systems, UK). Texture indicators of the examined products were as follows:
Fe (N)—gel strength—the value of force after 3 mm penetration;
FR (N)—rupture strength—the value of force at gel rupture;
E (N s)—the energy of penetration;
A (N s)—adhesiveness—energy (work) required to remove the probe from the sample.
Determination of texture parameters was performed immediately after the products were made and after 8 months of storage.

2.2.5. Statistical Analysis

The results were statistically analyzed employing a one-way analysis of variance, utilizing Snedecor’s F test and Student’s t-test. The least significant difference (LSD) was determined at a probability level of p < 0.05. The analysis was conducted using Statistica 13.3 software (StatSoft, Kraków, Poland). Principal Components Analysis (PCA) using the XLSTAT ver. 2023.3.0 software (Addinsoft, Denver, CO, USA) was performed to analyze differences between samples and interdependencies between analyzed parameters.

3. Results and Discussion

3.1. Ash and Minerals of Rhubarb Products

Numerous authors have reported the health-promoting properties of fruit and vegetable pomace [23,24,44], as well as its polysaccharides, phenolics, and minerals content. Hence, they are used in various industries as an additive to food products [45,46,47,48].
The examined rhubarb products with added pomace (apple, chokeberry, blackcurrant, carrot, red beet) had a significantly (p < 0.05) higher ash content compared to the control sample (RO) (Table 2). Depending on the type of pomace added, 0.339–0.442 g of ash in 100 g fresh weight was noted in the products; hence, it was 27–65% greater than that found in the RO sample. In the case of the macroelements, the highest amounts were recorded for potassium (94–182 mg/100 g) and calcium (44.6–65.7 mg/100 g); although, sulfur (5.5–29.4 mg/100 g), phosphorus (5.6–15.2 mg/100 g), magnesium (6.3–11.0 mg/100 g), and sodium (2.8–7.3 mg/100 g) were also detected. The dominant microelements included zinc (0.163–0.707 mg/100 g), magnesium (0.131–0.241 mg/100 g), and iron (0.126–0.363 mg/100 g), whereas boron, copper, molybdenum and chrome were found in lower amounts (Table 3). All pomace-enriched products had significantly (p < 0.05) higher levels of macro- and microelements compared to the control (RO). Significant (p < 0.05) differences were also noted among the products based on the type of pomace used. The highest concentrations of potassium and phosphorus were found in the product containing chokeberry pomace (RCh), whereas the highest levels of calcium were detected in the RA, RCh, and RBc products. Additionally, the largest quantities of magnesium were found in the RBc product. The addition of beetroot pomace increased substantially the level of zinc and boron, whereas blackcurrant pomace increased iron and copper content, chokeberry pomace increased molybdenum and chrome content, and apple pomace increased magnesium content.

3.2. Antioxidant Properties and Antioxidant Activity of Rhubarb Products

Kalisz et al. [49] demonstrated the value of rhubarb as a significant (p < 0.05) contributor of polyphenols, highlighting its potential in the production of functional foods. The examined rhubarb products were characterized by a total polyphenol content of 18.2–93.1 mg/100 g, of which total flavonoids accounted for 30–50% (Table 4). Anthocyanins, a group of flavonoids, promote a dark blue color to the fruit and have various medicinal functions [50]. It was determined that anthocyanin levels in rhubarb products ranged from 9.4 to 76.4 mg/100 g (Table 4). In general, the addition of pomace significantly (p < 0.05) increased the level of polyphenolic compounds by 171–412% and 64–108% in the studied products after the addition of fruit and vegetable pomaces, respectively, compared to the control. A significantly (p < 0.05) higher level of anthocyanins was noted in RBc and RCh products (76.4 and 62.5 mg/100 g, respectively) due to the very high content of this compound in fruits. The results obtained aligned with previous findings, indicating that pomace derived from raw materials with high anthocyanin content remains a valuable source. Alternatively, they can be used as a natural replacement for synthetic food pigments [51,52]. Kapci et al. [53] observed that among the various chokeberry products studied, pomace showed the highest content of total phenolics and anthocyanins. Additionally, Vagiri and Jensen [54] found that chokeberry pomace contains up to 1.86 mg of anthocyanins in 1 g fresh weight. Furthermore, numerous studies have shown that high levels of anthocyanins are found in black currant pomace [55,56]. For example, <1368 mg of anthocyanins per 100 g is present in dried blackcurrant pomace extract [56].
The literature strongly emphasizes the protective effect of a diet abundant in compounds with high antioxidant activity, such as polyphenols, against most chronic diseases [57]. According to Wojdyło, Oszmiański, and Bober [58], polyphenol content increased significantly (p < 0.05) after the addition of 10% chokeberry to strawberry jams. Furthermore, Abdel-Hady, Gamila, and Afaf [59] enriched strawberry jam with the addition of 30% purple carrot, which increased anthocyanin content by 120%. Hence, the examined rhubarb products with added pomace can be a good source of these compounds in the diet.
Carotenoids are potent antioxidants that scavenge free radicals. Vegetable-derived carotenoids provide approx. 68% of vitamin A ingested in the diet. β-carotene is one of the most significant carotenoids affecting human health [60]. In rhubarb products, β-carotene content varied between 74 and 397 µg/100 g, where the RC sample exhibited the highest level. Carrot pomace contains up to 2 g of total carotenoids per kg, influenced by the processing methods used. Therefore, they are considered an enriching ingredient for products such as cakes, bread, and cookies [61]. In general, pomace is abundant in natural pigments, including anthocyanins and carotenoids, which could potentially aid in creating functional foods and improving bio-therapeutic properties [62].
The pro-health properties of rhubarb products can be enhanced through the addition of fruit or vegetable pomace. However, to-date, a comprehensive and broad study has yet to be conducted on rhubarb in the food industry. Wojdylo et al. [58] noted that adding rhubarb juice to strawberry jams increased their antioxidant properties and reduced adverse color changes. A comparable effect was noted by Oszmiański and Wojdyło [63] for apple puree. In the case of our study, the rhubarb products showed total antioxidant activities in the range of 16.1–76.3 µmol Tx/g (ABTS) and 13.4–55.9 µmol Tx/g (DPPH) and all pomace-enriched products had higher antioxidant activity, compared to RO sample (Table 4). Primarily, the addition of chokeberry and blackcurrant pomace enhanced the antioxidant activity by 374% and 321% (ABTS) and 317% and 249% (DPPH), respectively, compared to the RO sample. Therefore, the use of pomace of “superfruits”, noted for its high antioxidant content, allows rhubarb products to be enriched with valuable compounds with health-promoting properties.
After 8 months of storage (Table 4), reduction in the level of total polyphenols by 14–26%, flavonoids by 13–24%, anthocyanins by 25–43%, β-carotene by 6–13%, and antioxidant activity by 9–24% (ABTS) and 22–34% (DPPH) was observed. It should be noted that the products with added pomace retained a higher percentage of bioactive components compared to the RO sample, which recorded higher percentage losses of these ingredients after storage.
Numerous studies have examined the preservation of bioactive compounds in food over storage. A decrease in polyphenolic compounds and antioxidant activity in jam products during storage was previously reported [64,65,66]. Additionally, phenolic components easily oxidize during storage, resulting in a gradual decrease in concentration [66]. Kopjar et al. [67] showed that changes in antioxidant activity may stem from degradation or chemical alteration of antioxidants.

3.3. Color Parameters of Rhubarb Products

Color is one of the most important criteria for visual food evaluation. In non-stored rhubarb products, the value of the parameter L*, which determined the brightness, ranged from 7.81 to 37.54 (Table 5). The highest reduction of this parameter was noted in RCh and RBc samples by 44% and 74%, respectively, compared to the RO sample. Therefore, these products were the darkest, which was due to the highest anthocyanin content and originated from fruit pomace with high pigment content [68,69]. However, the addition of pomace obtained from light-colored raw materials, i.e., apple and carrot, lightened the products by 9% and 23%, respectively.
The addition of pomace also affected the values a* and b* parameters (Table 5). All samples with rhubarb pomace showed a 9–42% reduction in a* parameter, i.e., a lower proportion of red color, compared to the RO sample. The share of yellow color (b* parameter) was the lowest in the RCh and RBc samples (4.17 and 1.87, respectively) and the highest in the RC sample (25.71).
It has been shown that the color of products can be influenced by the type of ingredients used. According to Hussein et al. [70], the values of color parameters are different in jams with various ingredients. The jam made with mandarin peels exhibited the greatest lightness (L* = 39.8), surpassing the jam with carrot (29.46) and banana peels (15.19), as well as apple pomace (18.27). The addition of black bean seed coat to bread significantly (p < 0.05) reduced the value of the L*, a*, and b* parameters of the crumb [71]. A similar effect was observed when powdered grape pomace was added to the cookies [72]. However, Banaś et al. [73] found that the color of gooseberry jams with added flax and wheat germ was the lightest, while the darker were jams with chokeberry and elderberry fruits. Kirca et al. [74] showed that the addition of dark-colored raw materials to jams was a good alternative for coloring products whose color was unstable during the production process.
All products were characterized by saturated color (23.76–30.94) except for RCh and RBc samples, which were the darkest. In these products, the value of parameter C* was lower by 34% and 54%, respectively, compared to the RO sample. A similar relationship was applied to the hue angle (h°). RCh and RBc products had lower values of h° by 66% and 78%, respectively, compared to the RO sample. Hence, a shift in color towards red-purple occurred. The remaining products had higher h° values, which proved a shift in color towards yellow and corresponded to higher values of the b* parameter. In grape pomace-enriched biscuits, h° and C* (color saturation) values significantly (p < 0.05) decreased with increasing percentage of grape pomace addition [75]. Kirca et al. [74] noted that the addition of raw materials with high anthocyanin content to the product reduced h° value. Additionally, jams with added black carrot concentrate showed lower h° value.
The overall color difference is represented by ΔE*, where a higher value indicates a more significant color difference between the two samples. Color differences were interpreted as follows: 0 < ΔE* < 1—color differences were indistinguishable to a standard observer; 1 < ΔE* < 2—only an experienced observer could detect the difference; 2 < ΔE* < 3.5—an inexperienced observer was able to notice the differences; 3.5 < ΔE* < 5—all observers could readily see the difference; and ΔE* > 5—an observer clearly recognizes two distinct colors [76]. The addition of pomace substantially modified the color of the examined products. In all products enriched with the pomace, the differences were large (ΔE* > 9), especially in RCh and RBc samples (ΔE* > 20). Hence, their color could be perceived as two different colors (Table 5).
Taking into account shelf life and the perception of the product’s attractiveness by the consumer, where the color change that occurs during storage is an important phenomenon. After 8 months of storage of rhubarb products, fluctuations were observed in the level of individual color parameters, depending on the type of added pomace (Table 5). Compared with 0-month stored samples, the greatest color changes were found in the RBc product. This product showed a significant (p < 0.05) darkening (L*), the greatest increase in yellowness (b*) and color saturation (C*). These changes were most noticeable because ΔE* increased by 20% compared to the non-stored sample. Touati et al. [77] reported that the color of apricot jam turned brown after 40 days of storage at 5 °C. Vukoja et al. [78] also found that the storage of cherry jam decreased the brightness of the product and increased the proportion of yellow color. This was associated with a reduction in anthocyanin content and the development of brown pigment due to the Maillard reaction.

3.4. Texture of Rhubarb Products

Pectin, which affects gel hardness, is the main agent responsible for consistency throughout jam products [79]. In general, compounds with gelling properties and water retention ability increase hardness. Furthermore, raising the fruit concentration in the product enhances its hardness, which can be attributed to the higher natural pectin content of the fruit [80]. It can also be assumed that the increase in the product’s hardness results from the increase of pomace-originated dry matter. Mohammadi-Moghaddam et al. [81] demonstrated that higher levels of pectin, along with interactions with crude fiber and carbohydrates in black plum peel, led to increased bonding between components in the formulation and enhanced cohesiveness.
The gel strength (Fe) of non-stored rhubarb products was within the range of 0.99–1.71 N (Table 6). The addition of pomace increased Fe in all products, especially in RBc and RCh samples, by 61% and 73%, respectively. An analogous pattern is noted in the case of the FR parameter, which measures the force required to rupture the product and penetration force (E). Additionally, adhesiveness (A), the force necessary to detach the material adhering to the teeth, is an important food quality parameter. In non-stored products, this parameter ranged from −0.92 to −1.92 Ns (Table 6). The value of the A parameter increased with the increasing hardness of the examined products after pomace addition.
In various food products, changes in texture parameters were found after the addition of fiber-rich compounds. For example, Mousavi et al. [82] found that the increased hardness in yogurts enriched with flaxseed was attributed to the fiber content in flaxseed. The strongest gel strength (Fe) was observed in jams containing wheat germ and flax seeds [73]. In bread, the crumb firmness grew as the amount of grape pomace powder increased. The inclusion of grape pomace likely disrupted gluten network formation, reducing gas retention and leading to a firmer texture [83]. Comparable outcomes were observed in bread made with higher amounts of dietary fiber extracted from culinary banana bract [84]. The firmness and adhesiveness of pasta were improved with the addition of grape pomace [83], while the inclusion of 12% orange peel decreased the adhesiveness of orange jam [85]. Lemon peel had a similar effect when added to papaya jam [86].
After 8 months of storage, Fe decreased by the greatest extent in the RO sample (25%) compared to the sample analyzed immediately after production and did not exceed 10% in the remaining samples with pomace. A similar trend was noted for other texture parameters (Table 6). Reports have shown a reduction of jam firmness during storage [87,88,89]. Morris et al. [90] claimed that the observed changes stem from the breakdown of pectic compounds by acids present in the product and the loosening of the texture.

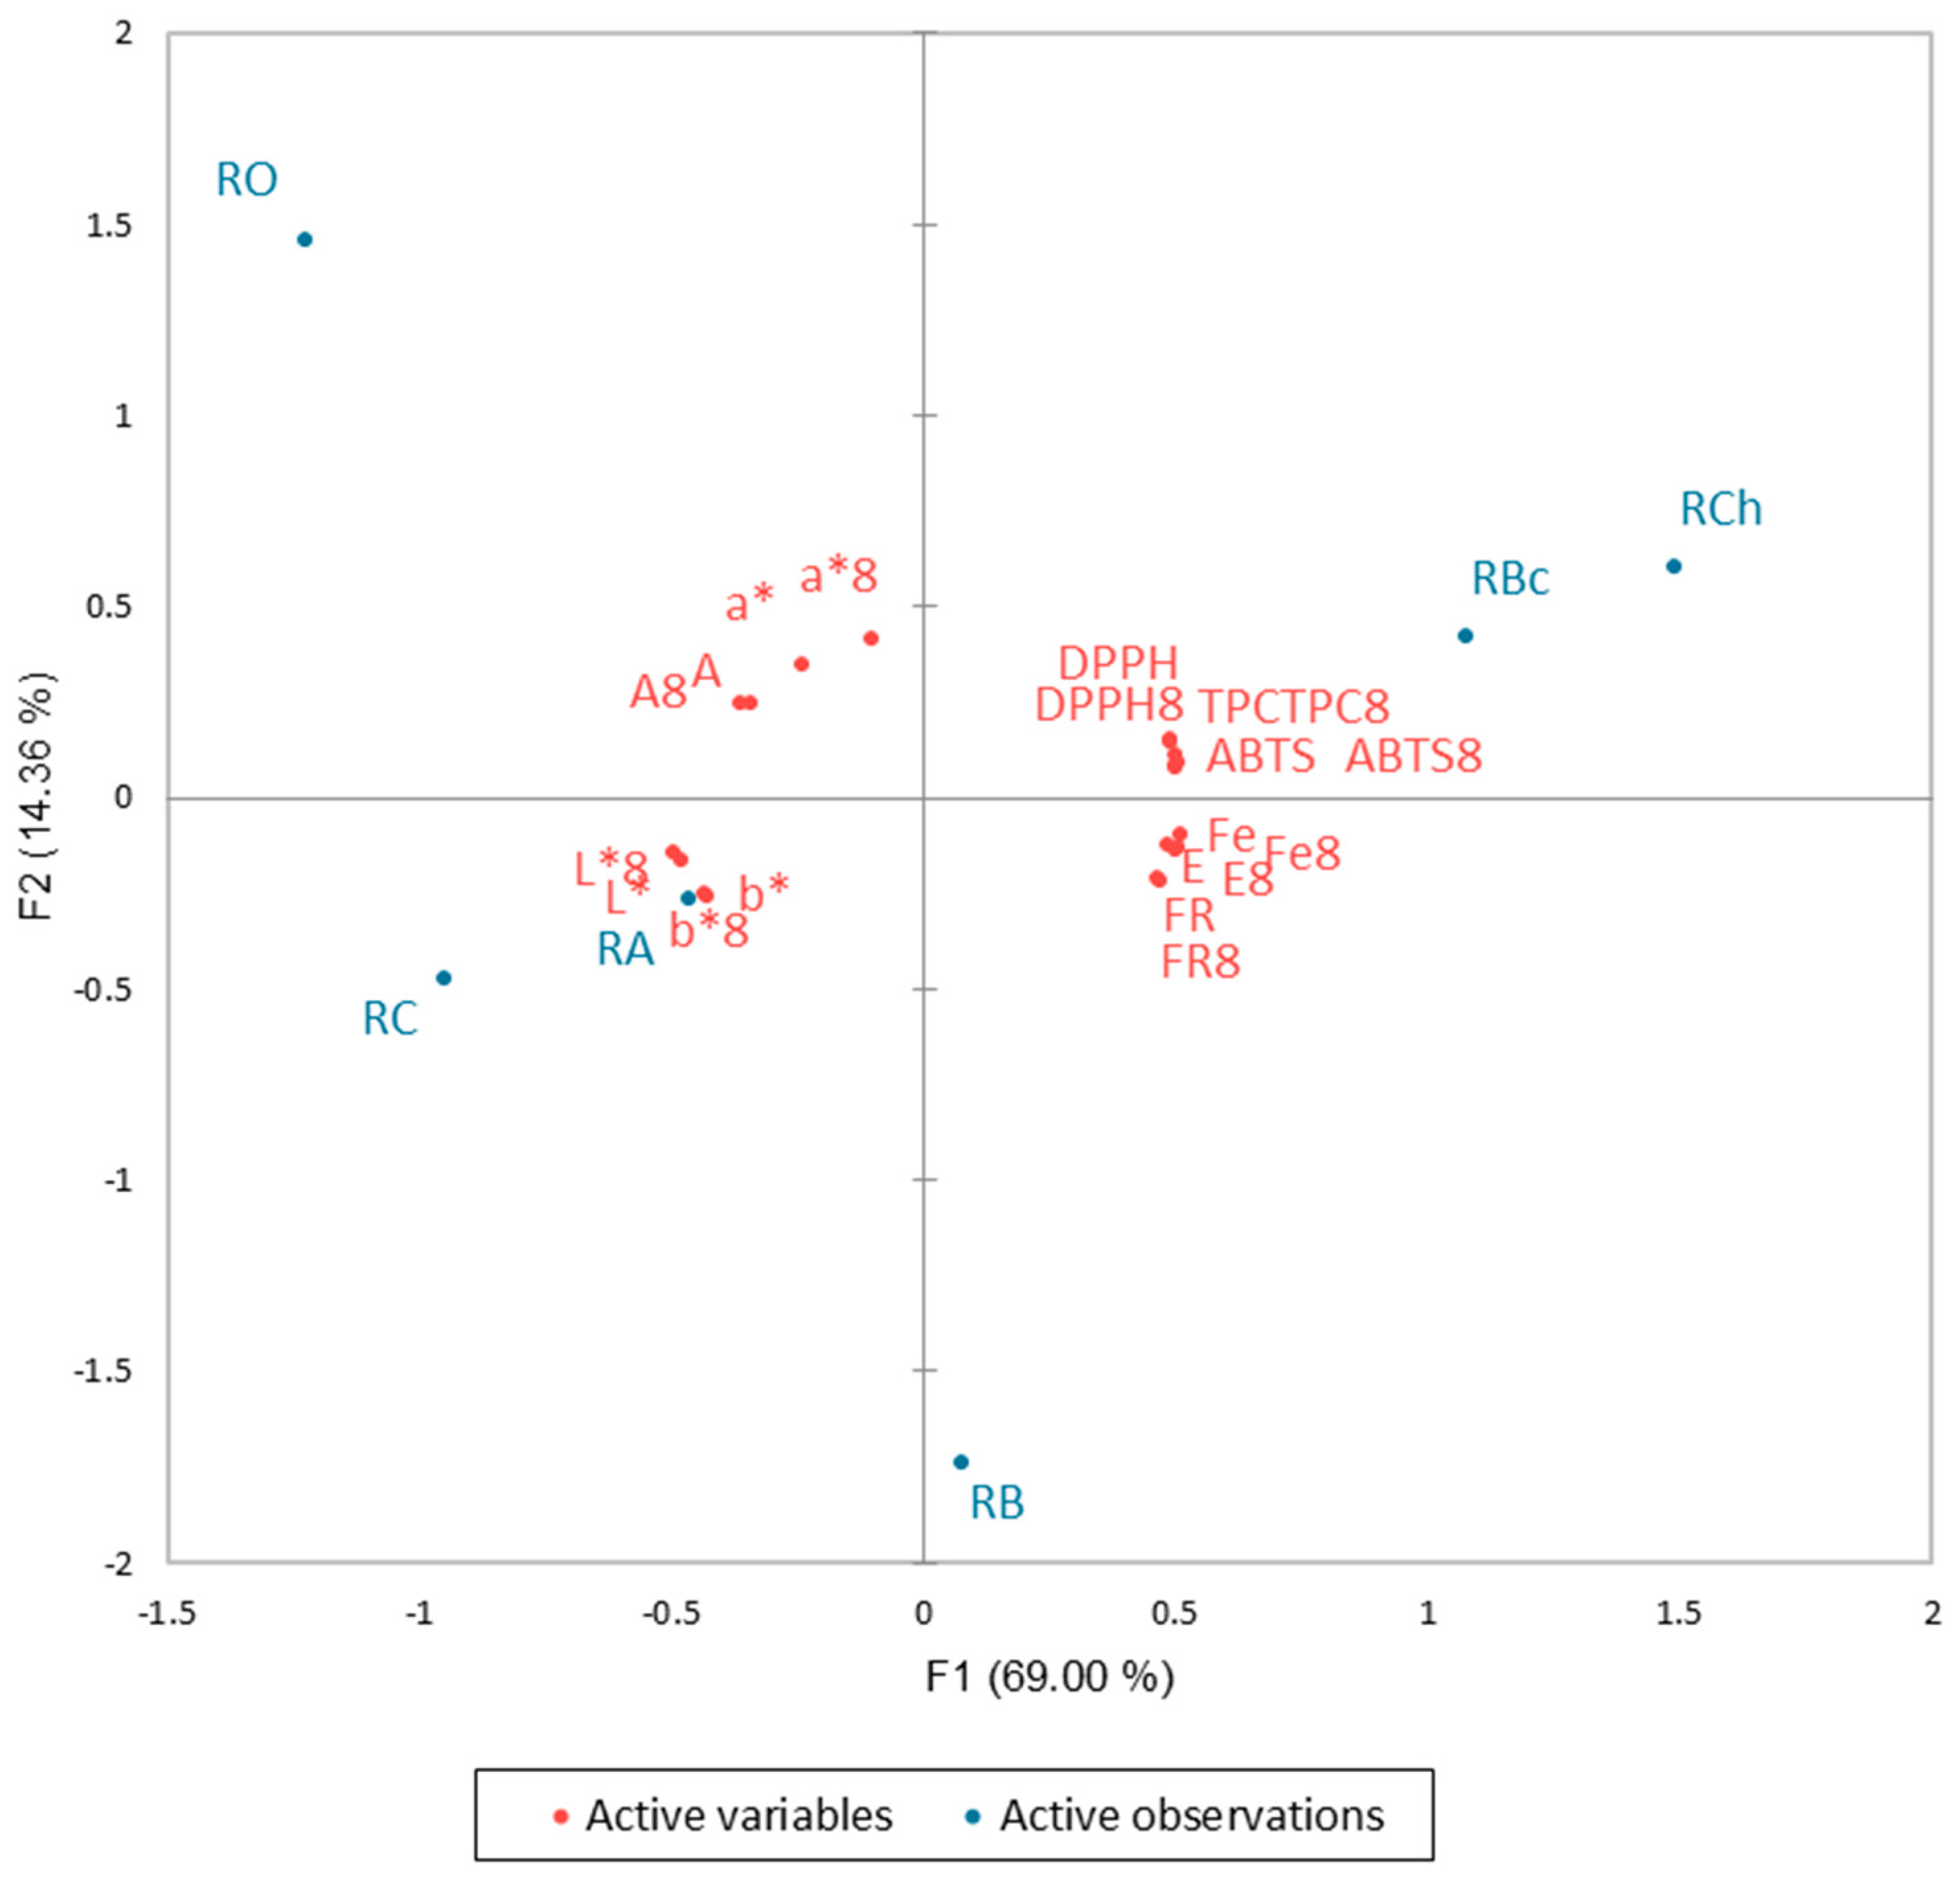
3.5. Principal Component Analysis (PCA)

The results of the PCA analysis depicting the relationships between selected parameters of the examined vegetable products (antioxidant content, antioxidant activity, color parameters, and texture) are presented in Figure 1. Two factors were chosen for the analysis, accounting for 83.36% of the variability, while the remaining factors, responsible for 10.69%, 4.27%, and 1.68%, were omitted. Considering the two analyzed factors, samples RBc and RCh exhibit similarity, as do the pair RA and RC. In contrast, samples RO and RB differ from the others. The value of the first factor is most strongly influenced by parameters related to polyphenol content and antioxidant activity, as well as parameters reflecting the texture of the products (excluding adhesiveness). Color parameters are divided between both factors. Samples RBc and RCh show the highest polyphenol content and associated antioxidant activity, both immediately after production and after 8 months of storage.

4. Conclusions

Unhealthy lifestyles and increasing environmental pollution contribute to stress on the body. Consequently, there is a need to produce food that will reduce these adverse effects by increasing the proportion of antioxidants in products and reducing the use of sucrose as a sweetener. Fruit and vegetable pomace, used as a component of functional food, can be a good source of pro-health compounds. The use of pomace in the production of processed vegetable products may be one approach to post-production waste management, which benefits from the environmental protection perspective and the “Zero Waste” strategy introduced by EU legislation. This study revealed that the combination of rhubarb with fruit and vegetable pomace allows for the obtainment of products with valuable sources of minerals and antioxidants. Chokeberry and blackcurrant pomaces are particularly recommended as enriching additives. Products with these ingredients are characterized by the highest content of total polyphenols, including anthocyanins, and high antioxidant activity (ABTS, DPPH). Also noteworthy are carrot pomace to increase β-carotene levels in the product and beet pomace to increase zinc and boron levels.

Author Contributions

A.K.: conceptualization and methodology, A.K. and J.K.: formal analysis and investigation, data curation, writing-original draft, review and editing. All authors have read and agreed to the published version of the manuscript.

Funding

The work was financed by a subsidy of the Ministry of Education and Science Republic of Poland for the University of Agriculture in Kraków.

Institutional Review Board Statement

Not applicable.

Data Availability Statement

Data are contained within the article. The data presented in this study are available in the article.

Conflicts of Interest

The authors declare no conflicts of interest.

References

  1. Appleton, K.M.; Hemingway, A.; Saulais, L.; Dinnella, C.; Monteleone, E.; Depezay, L.; Morizet, D.; Armando Perez-Cueto, F.J.; Bevan, A.; Hartwell, H. Increasing vegetable intakes: Rationale and systematic review of published interventions. Eur. J. Nutr. 2016, 55, 869–896. [Google Scholar] [CrossRef]
  2. Sarac, I.; Butnariu, M. Food pyramid—The principles of a balanced diet. Int. J. Nutr. 2020, 5, 24–31. [Google Scholar] [CrossRef]
  3. World Health Organization. Healthy Diet. Available online: https://www.who.int/news-room/fact-sheets/detail/healthy-diet (accessed on 9 September 2024).
  4. Zhan, J.; Liu, Y.-J.; Cai, L.-B.; Xu, F.-R.; Xie, T.; He, Q.-Q. Fruit and vegetable consumption and risk of cardiovascular disease: A meta-analysis of prospective cohort studies. Crit. Rev. Food Sci. Nutr. 2017, 57, 1650–1663. [Google Scholar] [CrossRef]
  5. Aune, D.; Giovannucci, E.; Boffetta, P.; Fadnes, L.T.; Keum, N.; Norat, T.; Greenwood, D.C.; Riboli, E.; Vatten, L.J.; Tonstad, S. Fruit and vegetable intake and the risk of cardiovascular disease, total cancer and all-cause mortality-a systematic review and dose-response meta-analysis of prospective studies. Int. J. Epidemiol. 2017, 46, 1029–1056. [Google Scholar] [CrossRef]
  6. Sharifi-Rad, J.; Rodrigues, C.F.; Sharopov, F.; Docea, A.O.; Can Karaca, A.; Sharifi-Rad, M.; Kahveci Karıncaoglu, D.; Gülseren, G.; Şenol, E.; Demircan, E.; et al. Diet, lifestyle and cardiovascular diseases: Linking pathophysiology to cardioprotective effects of natural bioactive compounds. Int. J. Environ. Res. Public Health 2020, 17, 2326. [Google Scholar] [CrossRef]
  7. Key, T.J.; Bradbury, K.E.; Perez-Cornago, A.; Sinha, R.; Tsilidis, K.K.; Tsugane, S. Diet, nutrition, and cancer risk: What do we know and what is the way forward? BMJ 2020, 368, m511. [Google Scholar] [CrossRef]
  8. Zurbau, A.; Au-Yeung, F.; Blanco Mejia, S.; Khan, T.A.; Vuksan, V.; Jovanovski, E.; Leiter, L.A.; Kendall, C.W.C.; Jenkins, D.J.A.; Sievenpiper, J.L. Relation of different fruit and vegetable sources with incident cardiovascular outcomes: A systematic review and meta-analysis of prospective cohort studies. J. Am. Heart Assoc. 2020, 9, e017728. [Google Scholar] [CrossRef]
  9. Nawamawat, J.; Prasittichok, W.; Prompradit, T.; Chatchawanteerapong, S.; Sittisart, V. Prevalence and characteristics of risk factors for non-communicable diseases in semi-urban communities. J. Health Res. 2020, 34, 295–303. [Google Scholar] [CrossRef]
  10. Kalmpourtzidou, A.; Eilander, A.; Talsma, E.F. Global vegetable intake and supply compared to recommendations: A systematic review. Nutrients 2020, 12, 1558. [Google Scholar] [CrossRef]
  11. Hurtado-Barroso, S.; Tresserra-Rimbau, A.; Vallverdú-Queralt, A.; Lamuela-Raventós, R.M. Organic food and the impact on human health. Crit. Rev. Food Sci. Nutr. 2019, 59, 704–714. [Google Scholar] [CrossRef]
  12. Shyam, S.; Ramadas, A.; Chang, S.K. Isomaltulose: Recent evidence for health benefits. J. Funct. Foods 2018, 48, 173–178. [Google Scholar] [CrossRef]
  13. EU Commission Decision 2005/581/EC of 25th July 2005 Authorising the Placing on the Market of Isomaltulose as a Novel Food or Novel Food Ingredient under Regulation (EC) no 258/97 of the European Parliament and of the Council. 2007. Available online: http://data.europa.eu/eli/dec/2005/581/ (accessed on 17 September 2024).
  14. US GRAS Notification no 0184 on Isomaltulose. 2006. Available online: https://cfsanappsexternal.fda.gov/scripts/fdcc/index.cfm?set=GRASNotices&id=184 (accessed on 17 September 2024).
  15. von Rymon Lipinski, G.-W. Reduced-calorie sweeteners and caloric alternatives. In Optimising Sweet Taste in Foods, 1st ed.; Spillane, W.J., Ed.; Woodhead Publishing: Boca Raton, FL, USA, 2006; pp. 252–280. ISBN 9781845690083. [Google Scholar]
  16. Maresch, C.C.; Petry, S.F.; Theis, S.; Bosy-Westphal, A.; Linn, T. Low glycemic index prototype isomaltulose-update of clinical trials. Nutrients 2017, 9, 381. [Google Scholar] [CrossRef] [PubMed]
  17. de Groot, E.; Schweitzer, L.; Theis, S. Efficacy of isomaltulose compared to sucrose in modulating endothelial function in overweight adults. Nutrients 2020, 12, 141. [Google Scholar] [CrossRef] [PubMed]
  18. Keyhani-Nejad, F.; Kemper, M.; Schueler, R.; Pivovarova, O.; Rudovich, N.; Pfeiffer, A.F.H. Effects of palatinose and sucrose intake on glucose metabolism and incretin secretion in subjects with type 2 diabetes. Diabetes Care 2016, 39, e38–e39. [Google Scholar] [CrossRef]
  19. Foschia, M.; Peressini, D.; Sensidoni, A.; Brennan, C.S. The effects of dietary fibre addition on the quality of common cereal products. J. Cereal Sci. 2013, 58, 216–227. [Google Scholar] [CrossRef]
  20. Granato, D.; Barba, F.J.; Bursać Kovačević, D.; Lorenzo, J.M.; Cruz, A.G.; Putnik, P. Functional foods: Product development, technological trends, efficacy testing, and safety. Annu. Rev. Food Sci. Technol. 2020, 11, 93–118. [Google Scholar] [CrossRef]
  21. Kumar, K.; Yadav, A.N.; Kumar, V.; Vyas, P.; Dhaliwal, H.S. Food waste: A potential bioresource for extraction of nutraceuticals and bioactive compounds. Bioresour. Bioprocess. 2017, 4, 18. [Google Scholar] [CrossRef]
  22. Sagar, N.A.; Pareek, S.; Sharma, S.; Yahia, E.M.; Lobo, M.G. Fruit and vegetable waste: Bioactive compounds, their extraction, and possible utilization. Compr. Rev. Food Sci. Food Saf. 2018, 17, 512–531. [Google Scholar] [CrossRef]
  23. Fierascu, R.C.; Sieniawska, E.; Ortan, A.; Fierascu, I.; Xiao, J. Fruits by-products—A source of valuable active principles. A short review. Front. Bioeng. Biotechnol. 2020, 8, 319. [Google Scholar] [CrossRef]
  24. Coman, V.; Teleky, B.-E.; Mitrea, L.; Martău, G.A.; Szabo, K.; Călinoiu, L.-F.; Vodnar, D.C. Bioactive potential of fruit and vegetable wastes. Adv. Food Nutr. Res. 2020, 91, 157–225. [Google Scholar] [CrossRef]
  25. de Brito Nogueira, T.B.; Da Silva, T.P.M.; deAraújo Luiz, D.; de Andrade, C.J.; de Andrade, L.M.; Ferreira, M.S.L.; Fai, A.E.C. Fruits and vegetable-processing waste: A case study in two markets at Rio de Janeiro, RJ, Brazil. Environ. Sci. Pollut. Res. Int. 2020, 27, 18530–18540. [Google Scholar] [CrossRef] [PubMed]
  26. Cojocaru, A.; Munteanu, N.; Petre, B.A.; Stan, T.; Teliban, G.C.; Vintu, C.; Stoleru, V. Biochemical and production of rhubarb under growing technological factors. Rev. Chim. 2019, 70, 2000–2003. [Google Scholar] [CrossRef]
  27. Cao, Y.-J.; Pu, Z.-J.; Tang, Y.-P.; Shen, J.; Chen, Y.-Y.; Kang, A.; Zhou, G.-S.; Duan, J.-A. Advances in bio-active constituents, pharmacology and clinical applications of rhubarb. Chin. Med. 2017, 12, 36. [Google Scholar] [CrossRef]
  28. Xiang, H.; Zuo, J.; Guo, F.; Dong, D. What we already know about rhubarb: A comprehensive review. Chin. Med. 2020, 15, 88. [Google Scholar] [CrossRef] [PubMed]
  29. Wang, J.; Zhao, H.; Kong, W.; Jin, C.; Zhao, Y.; Qu, Y.; Xiao, X. Microcalorimetric assay on the antimicrobial property of five hydroxyanthraquinone derivatives in rhubarb (Rheum palmatum L.) to Bifidobacterium adolescentis. Phytomedicine 2010, 17, 684–689. [Google Scholar] [CrossRef]
  30. Cojocaru, A.; Vlase, L.; Munteanu, N.; Stan, T.; Teliban, G.C.; Burducea, M.; Stoleru, V. Dynamic of phenolic compounds, antioxidant activity, and yield of rhubarb under chemical, organic and biological fertilization. Plants 2020, 9, 355. [Google Scholar] [CrossRef]
  31. Clapa, D.; Borsai, O.; Hârța, M.; Bonta, V.; Szabo, K.; Coman, V.; Bobiș, O. Micropropagation, genetic fidelity and phenolic compound production of Rheum rhabarbarum L. Plants 2020, 9, 656. [Google Scholar] [CrossRef]
  32. Takeoka, G.R.; Dao, L.; Harden, L.; Pantoja, A.; Kuhl, J.C. Antioxidant activity, phenolic and anthocyanin contents of various rhubarb (Rheum spp.) varieties. Int. J. Food Sci. Technol. 2013, 48, 172–178. [Google Scholar] [CrossRef]
  33. Horwitz, W.; Latimer, G.W. (Eds.) Official Methods of Analysis of AOAC International, 18th ed.; Current throug revision 1; AOAC International: Gaithersburg, MA, USA, 2006; ISBN 9780935584776. [Google Scholar]
  34. Paslawski, P.; Migaszewski, Z.M. The quality of element determinations in plant materials by instrumental methods. Polish J. Environ. Stud. 2006, 15, 154–164. [Google Scholar]
  35. Heimler, D.; Vignolini, P.; Dini, M.G.; Romani, A. Rapid tests to assess the antioxidant activity of Phaseolus vulgaris L. dry beans. J. Agric. Food Chem. 2005, 53, 3053–3056. [Google Scholar] [CrossRef]
  36. Csepregi, K.; Kocsis, M.; Hideg, E. On the spectrophotometric determination of total phenolic and flavonoid contents. Acta Biol. Hung. 2013, 64, 500–509. [Google Scholar] [CrossRef]
  37. Giusti, M.M.; Wrolstad, R.E. Characterization and measurement of anthocyanins by UV-visible spectroscopy. Curr. Protocols Food Analyt. Chem. 2001, 1, F1.2.1–F1.2.13. [Google Scholar] [CrossRef]
  38. Plessi, M.; Bertelli, D.; Albasini, A. Distribution of metals and phenolic compounds as a criterion to evaluate variety of berries and related jams. Food Chem. 2007, 100, 419–427. [Google Scholar] [CrossRef]
  39. Nagata, M.; Yamashita, I. Simple method for simultaneous determination of chlorophyll and carotenoids in tomato fruit. Nippon Shokuhin Kogyo Gakkaishi 1992, 39, 925–928. [Google Scholar] [CrossRef]
  40. Pekkarinen, S.S.; Heinonen, I.M.; Hopia, A.I. Flavonoids quercetin, myricetin, kaemferol and (+)-catechin as antioxidants in methyl linoleate. J. Sci. Food Agric. 1999, 79, 499–506. [Google Scholar] [CrossRef]
  41. Re, R.; Pellegrini, N.; Proteggente, A.; Pannala, A.; Yang, M.; Rice-Evans, C. Antioxidant activity applying an improved ABTS radical cation decolorization assay. Free Radic. Biol. Med. 1999, 26, 1231–1237. [Google Scholar] [CrossRef]
  42. CIE TC 1-85. In CIE 015:2018 Colorimetry, 4th ed.; International Commission on Illumination (CIE): Vienna, Austria, 2018; ISBN 978-3-902842-13-8.
  43. Genovese, D.B.; Ye, A.; Singh, H. High methoxyl pectin/apple particles composite gels: Effect of particle size and particle concentration on mechanical properties and gel structure. J. Texture Stud. 2010, 41, 171–189. [Google Scholar] [CrossRef]
  44. Arakaki, D.G.; Santos, V.S.D.; de Melo, E.P.; Pereira, H.; Figueiredo, P.S.; Cortês, M.R.; Carollo, C.A.; Silva de Oliveira, L.C.; Tschinkel, P.; Reis, F.; et al. Canjiqueira fruit: Are we losing the best of it? Foods 2020, 9, 521. [Google Scholar] [CrossRef]
  45. Kowalska, H.; Czajkowska, K.; Cichowska, J.; Lenart, A. What’s new in biopotential of fruit and vegetable by-products applied in the food processing industry. Trends Food Sci. Technol. 2017, 67, 150–159. [Google Scholar] [CrossRef]
  46. Ferrentino, G.; Asaduzzaman, M.; Scampicchio, M.M. Current technologies and new insights for the recovery of high valuable compounds from fruits by-products. Crit. Rev. Food Sci. Nutr. 2018, 58, 386–404. [Google Scholar] [CrossRef]
  47. Kumar, H.; Bhardwaj, K.; Sharma, R.; Nepovimova, E.; Kuča, K.; Dhanjal, D.S.; Verma, R.; Bhardwaj, P.; Sharma, S.; Kumar, D. Fruit and vegetable peels: Utilization of high value horticultural waste in novel industrial applications. Molecules 2020, 25, 2812. [Google Scholar] [CrossRef]
  48. Umul, D.; Korus, A.; Ziobro, R. Extruded preparations with sour cherry pomace influence quality and increase the level of bioactive components in gluten-free breads. Int. J. Food Sci. 2020, 2020, 8024398. [Google Scholar] [CrossRef]
  49. Kalisz, S.; Oszmiański, J.; Kolniak-Ostek, J.; Grobelna, A.; Kieliszek, M.; Cendrowski, A. Effect of a variety of polyphenols compounds and antioxidant properties of rhubarb (Rheum rhabarbarum). LWT 2020, 118, 108775. [Google Scholar] [CrossRef]
  50. Mattioli, R.; Francioso, A.; Mosca, L.; Silva, P. Anthocyanins: A comprehensive review of their chemical properties and health effects on cardiovascular and neurodegenerative diseases. Molecules 2020, 25, 3809. [Google Scholar] [CrossRef]
  51. Raikos, V.; Ni, H.; Hayes, H.; Ranawana, V. Antioxidant properties of a yogurt beverage enriched with salal (Gaultheria shallon) berries and blackcurrant (Ribes nigrum) pomace during cold storage. Beverages 2019, 5, 2. [Google Scholar] [CrossRef]
  52. Toscano Martínez, H.; Gagneten, M.; Díaz-Calderón, P.; Enrione, J.; Salvatori, D.; Schebor, C.; Leiva, G. Natural food colorant from blackcurrant spray-dried powder obtained by enzymatic treatment: Characterization and acceptability. J. Food Process. Preserv. 2021, 45, e15011. [Google Scholar] [CrossRef]
  53. Kapci, B.; Neradová, E.; Čížková, H.; Voldřich, M.; Rajchl, A.; Capanoglu, E. Investigating the antioxidant potential of chokeberry (Aronia melanocarpa) products. J. Food Nutr. Res. 2013, 52, 219–229. [Google Scholar]
  54. Vagiri, M.; Jensen, M. Influence of juice processing factors on quality of black chokeberry pomace as a future resource for colour extraction. Food Chem. 2017, 217, 409–417. [Google Scholar] [CrossRef]
  55. Basegmez, H.I.O.; Povilaitis, D.; Kitrytė, V.; Kraujalienė, V.; Šulniūtė, V.; Alasalvar, C.; Venskutonis, P.R. Biorefining of blackcurrant pomace into high value functional ingredients using supercritical CO2, pressurized liquid and enzyme assisted extractions. J. Supercrit. Fluids 2017, 124, 10–19. [Google Scholar] [CrossRef]
  56. Azman, E.M.; Nor, N.D.M.; Charalampopoulos, D.; Chatzifragkou, A. Effect of acidified water on phenolic profile and antioxidant activity of dried blackcurrant (Ribes nigrum L.) pomace extracts. LWT 2022, 154, 112733. [Google Scholar] [CrossRef]
  57. Arfaoui, L. Dietary plant polyphenols: Effects of food processing on their content and bioavailability. Molecules 2021, 26, 2959. [Google Scholar] [CrossRef]
  58. Wojdyło, A.; Oszmiański, J.; Bober, I. The effect of addition of chokeberry, flowering quince fruits and rhubarb juice to strawberry jams on their polyphenol content, antioxidant activity and colour. Eur. Food Res. Technol. 2008, 227, 1043–1051. [Google Scholar] [CrossRef]
  59. Abdel-Hady, M.M.; Attia, G.Y.; Ali, A.M. Color stability of strawberry jam fortified by purple carrot puree. Egypt. J. Agric. Res. 2014, 92, 323–336. [Google Scholar] [CrossRef]
  60. Milani, A.; Basirnejad, M.; Shahbazi, S.; Bolhassani, A. Carotenoids: Biochemistry, pharmacology and treatment. Br. J. Pharmacol. 2017, 174, 1290–1324. [Google Scholar] [CrossRef]
  61. Surbhi, S.; Verma, R.C.; Deepak, R.; Jain, H.K.; Yadav, K.K. A review: Food, chemical composition and utilization of carrot (Daucus carota L.) pomace. Int. J. Chem. Stud. 2018, 6, 2921–2926. [Google Scholar]
  62. Sharma, M.; Usmani, Z.; Gupta, V.K.; Bhat, R. Valorization of fruits and vegetable wastes and by-products to produce natural pigments. Crit. Rev. Biotechnol. 2021, 41, 535–563. [Google Scholar] [CrossRef]
  63. Oszmiański, J.; Wojdyło, A. Polyphenol content and antioxidative activity in apple purées with rhubarb juice supplement. Int. J. Food Sci. Technol. 2008, 43, 501–509. [Google Scholar] [CrossRef]
  64. Kumar, A.; Madhumathi, C.; Sadarunnisa, S.; Srikanth, K. Standardization of protocol for best blending ratio of papaya cv. Red Lady and guava cv. Lalit fruit pulp for preparation of fruit bar. Plant Arch. 2017, 17, 59–68. [Google Scholar]
  65. Lafarga, T.; Aguiló-Aguayo, I.; Bobo, G.; Chung, A.V.; Tiwari, B.K. Effect of storage on total phenolics, antioxidant capacity, and physicochemical properties of blueberry (Vaccinium corymbosum L.) jam. J. Food Process. Preserv. 2018, 42, e13666. [Google Scholar] [CrossRef]
  66. Nafri, P.; Singh, A.K.; Sharma, A.; Sharma, I. Effect of storage condition on physiochemical and sensory properties of papaya jam. J. Pharmacogn. Phytochem. 2021, 10, 1296–1301. [Google Scholar] [CrossRef]
  67. Kopjar, M.; Pichler, A.; Turi, J.; Piližota, V. Influence of trehalose addition on antioxidant activity, colour and texture of orange jelly during storage. Int. J. Food Sci. Technol. 2016, 51, 2640–2646. [Google Scholar] [CrossRef]
  68. Meng, L.; Zhu, J.; Ma, Y.; Sun, X.; Li, D.; Li, L.; Bai, H.; Xin, G.; Meng, X. Composition and antioxidant activity of anthocyanins from Aronia melanocarpa cultivated in Haicheng, Liaoning, China. Food Biosci. 2019, 30, 100413. [Google Scholar] [CrossRef]
  69. Hurst, R.D.; Lyall, K.A.; Wells, R.W.; Sawyer, G.M.; Lomiwes, D.; Ngametua, N.; Hurst, S.M. Daily consumption of an anthocyanin-rich extract made from New Zealand blackcurrants for 5 weeks supports exercise recovery through the management of oxidative stress and inflammation: A randomized placebo controlled pilot study. Front. Nutr. 2020, 7, 16. [Google Scholar] [CrossRef] [PubMed]
  70. Hussein, A.M.; Kamil, M.M.; Hegazy, N.A.; Mahmoud, K.F.; Ibrahim, M.A. Utilization of some fruits and vegetables by-products to produce high dietary fiber jam. Food Sci. Qual. Manag. 2015, 37, 39–45. [Google Scholar]
  71. Chávez-Santoscoy, R.A.; Lazo-Vélez, M.A.; Serna-Sáldivar, S.O.; Gutiérrez-Uribe, J.A. Delivery of flavonoids and saponins from black bean (Phaseolus vulgaris) seed coats incorporated into whole wheat bread. Int. J. Mol. Sci. 2016, 17, 222. [Google Scholar] [CrossRef]
  72. Maner, S.; Sharma, A.K.; Banerjee, K. Wheat flour replacement by wine grape pomace powder positively affects physical, functional and sensory properties of cookies. Proc. Natl. Acad. Sci. India Sect. B Biol. Sci. 2017, 87, 109–113. [Google Scholar] [CrossRef]
  73. Banaś, A.; Korus, A.; Korus, J. Texture, color, and sensory features of low-sugar gooseberry jams enriched with plant ingredients with prohealth properties. J. Food Qual. 2018, 2018, 1–12. [Google Scholar] [CrossRef]
  74. Kirca, A.; Özkan, M.; Cemeroğlu, B. Storage stability of strawberry jam color enhanced with black carrot juice concentrate. J. Food Process. Preserv. 2007, 31, 531–545. [Google Scholar] [CrossRef]
  75. Dordoni, R.; Duserm Garrido, G.; Marinoni, L.; Torri, L.; Piochi, M.; Spigno, G. Enrichment of whole wheat cocoa biscuits with encapsulated grape skin extract. Int. J. Food Sci. 2019, 2019, 9161840. [Google Scholar] [CrossRef]
  76. Mokrzycki, W.; Tatol, M. Colour difference ΔE—A survey. Mach. Graph. Vis. 2011, 20, 383–411. [Google Scholar]
  77. Touati, N.; Tarazona-Díaz, M.P.; Aguayo, E.; Louaileche, H. Effect of storage time and temperature on the physicochemical and sensory characteristics of commercial apricot jam. Food Chem. 2014, 145, 23–27. [Google Scholar] [CrossRef] [PubMed]
  78. Vukoja, J.; Pichler, A.; Kopjar, M. Stability of anthocyanins, phenolics and color of tart cherry jams. Foods 2019, 8, 255. [Google Scholar] [CrossRef] [PubMed]
  79. Kopjar, M.; Piližota, V.; Nedić Tiban, N.; Šubarić, D.; Babić, J.; Ačkar, Đ.; Sajdl, M. Strawberry jams: Influence of different pectins on colour and textural properties. Czech J. Food Sci. 2009, 27, 20–28. [Google Scholar] [CrossRef]
  80. Nourmohammadi, A.; Ahmadi, E.; Heshmati, A. Optimization of physicochemical, textural, and rheological properties of sour cherry jam containing stevioside by using response surface methodology. Food Sci. Nutr. 2021, 9, 2483–2496. [Google Scholar] [CrossRef]
  81. Mohammadi-Moghaddam, T.; Firoozzare, A.; Daryadar, S.; Rahmani, Z. Black plum peel jam: Physicochemical properties, sensory attributes, and antioxidant capacity. Int. J. Food Prop. 2020, 23, 1737–1747. [Google Scholar] [CrossRef]
  82. Mousavi, M.; Heshmati, A.; Daraei Garmakhany, A.; Vahidinia, A.; Taheri, M. Texture and sensory characterization of functional yogurt supplemented with flaxseed during cold storage. Food Sci. Nutr. 2019, 7, 907–917. [Google Scholar] [CrossRef]
  83. Tolve, R.; Pasini, G.; Vignale, F.; Favati, F.; Simonato, B. Effect of grape pomace addition on the technological, sensory, and nutritional properties of durum wheat pasta. Foods 2020, 9, 354. [Google Scholar] [CrossRef]
  84. Begum, Y.A.; Chakraborty, S.; Deka, S.C. Bread fortified with dietary fibre extracted from culinary banana bract: Its quality attributes and in vitro starch digestibility. Int. J. Food Sci. Technol. 2020, 55, 2359–2369. [Google Scholar] [CrossRef]
  85. Teixeira, F.; Santos, B.A.D.; Nunes, G.; Soares, J.M.; Amaral, L.A.d.; de Souza, G.H.O.; de Resende, J.T.V.; Menegassi, B.; Rafacho, B.P.M.; Schwarz, K.; et al. Addition of orange peel in orange jam: Evaluation of sensory, physicochemical, and nutritional characteristics. Molecules 2020, 25, 1670. [Google Scholar] [CrossRef]
  86. Younis, K.; Islam, R.U.; Jahan, K.; Yousuf, B.; Ray, A. Effect of addition of mosambi (Citrus limetta) peel powder on textural and sensory properties of papaya jam. Cogent Food Agric. 2015, 1, 1023675. [Google Scholar] [CrossRef]
  87. Abolila, R.M.; Barakat, H.; El-Tanahy, H.A.; El-Mansy, H.A. Chemical, nutritional and organoleptical characteristics of orange-based formulated low-calorie jams. Food Nutr. Sci. 2015, 06, 1229–1244. [Google Scholar] [CrossRef]
  88. Rababah, T.M.; Al-u’datt, M.H.; Al-Mahasneh, M.A.; Feng, H.; Alothman, A.M.; Almajwal, A.; Yang, W.; Kilani, I.; Alhamad, M.N.; Ereifej, K.; et al. Effect of storage on the physicochemical properties, total phenolic, anthocyanin, and antioxidant capacity of strawberry jam. J. Food Agric. Environ. 2011, 9, 101–105. [Google Scholar]
  89. Sutwal, R.; Dhankhar, J.; Kindu, P.; Mehla, R. Development of low calorie jam by replacement of sugar with natural sweetener stevia. Int. J. Curr. Res. Rev. 2019, 11, 9–16. [Google Scholar] [CrossRef]
  90. Morris, G.A.; Castile, J.; Smith, A.; Adams, G.G.; Harding, S.E. The effect of different storage temperatures on the physical properties of pectin solutions and gels. Polym. Degrad. Stab. 2010, 95, 2670–2673. [Google Scholar] [CrossRef]
Figure 1. Principal Component Analysis (PCA) biplot for rhubarb products: RO (control sample)—rhubarb product without pomace, RA—rhubarb product with addition of apple pomace, RCh—rhubarb product with addition of chokeberry pomace, RBc—rhubarb product with addition of blackcurrant pomace, RC—rhubarb product with addition of carrot pomace, RB—rhubarb product with addition of red beet pomace. L*, a*, b*—color parameters of CIE (L*a*b*) system; TPC—total polyphenols content, ABTS, DPPH—antioxidant activity against ABTS or DPPH free radicals; A—adhesiveness, Fe—gel strength, FR—rupture strength of investigated rhubarb products. The index “8” indicates values after 8 months of sample storage.
Agriculture 14 01784 g001
Table 1. Rhubarb product formulations, g/1000 g.
Type of Product bIngredients a
RAPChPBcPCPBPIsomaltulosePectinCitric AcidWater
RO550 190141.2244.8
RA550200 177122.558.5
RCh550 200 150122.585.5
RBc550 200 185122.051.0
RC550 200 185124.548.5
RB550 200186124.547.5
a R—rhubarb, AP—apple pomace, ChP—chokeberry pomace, BcP—blackcurrant pomace, CP—carrot pomace, BP—red beet pomace. b Type of product: RO (control sample)—rhubarb product without pomace, RA—rhubarb product with addition of apple pomace, RCh—rhubarb product with addition of chokeberry pomace, RBc—rhubarb product with addition of blackcurrant pomace, RC—rhubarb product with addition of carrot pomace, RB—rhubarb product with addition of red beet pomace.
Table 2. Ash (g/100 g) and macroelements (mg/100 g) concentrations in rhubarb products.
Type of Product aAshPotassium Calcium MagnesiumPhosphorusSulfurSodium
RO0.268 a ± 0.02194 a ± 444.6 a ± 1.36.3 a ± 0.45.6 a ± 0.25.5 a ± 0.12.8 a ± 0.2
RA0.345 bc ± 0.006123 b ± 460.0 c ± 2.19.5 c ± 0.48.8 b ± 0.413.2 b ± 1.93.4 b ± 0.2
RBc0.366 c ± 0.007173 e ± 365.7 d ± 1.411.0 d ± 1.111.7 c ± 1.129.4 d ± 5.44.0 c ± 0.2
RCh0.351 bc ± 0.006182 f ± 563.0 cd ± 2.69.8 c ± 0.315.2 e ± 1.220.0 c ± 1.24.2 c ± 0.5
RB0.442 d ± 0.009164 d ± 349.3 b ± 1.89.6 c ± 0.513.4 d ± 0.215.5 b ± 1.77.1 d ± 0.2
RC0.339 b ± 0.006134 c ± 648.8 b ± 1.17.7 b ± 0.19.8 b ± 0.615.3 b ± 1.17.3 d ± 0.3
Values are an average of three replications ± S.D. in fresh matter. Mean values in columns marked with the same letters do not differ significantly (p < 0.05). a Type of product: RO (control sample)—rhubarb product without pomace, RA—rhubarb product with addition of apple pomace, RBc—rhubarb product with addition of blackcurrant pomace, RCh—rhubarb product with addition of chokeberry pomace, RB—rhubarb product with addition of red beet pomace, RC—rhubarb product with addition of carrot pomace.
Table 3. Content of microelements in rhubarb products.
Type of
Product a
Zinc
mg/100 g
Manganese
mg/100 g
Iron
mg/100 g
Boron
µg/100 g
Copper
µg/100 g
Molybdenum
µg/100 g
Chromium
µg/100 g
RO0.163 a ± 0.1000.131 a ± 0.1000.126 a ± 0.10017.4 a ± 0.415.9 a ± 0.43.3 a ± 0.32.2 a ± 0.1
RA0.305 b ± 0.0050.333 e ± 0.0100.132 a ± 0.00951.8 b ± 0.824.1 b ± 1.67.1 c ±1.32.4 a ± 0.2
RBc0.598 d ± 0.0470.189 c ± 0.0120.363 c ± 0.05456.6 bc ± 2.945.4 c ± 3.68.5 d ± 0.52.1 a ± 0.5
RCh0.361 b ± 0.0150.241 d ± 0.0080.153 a ± 0.04760.9 c ± 3.128.0 b ± 5.111.8 e ± 0.53.1 b ± 0.3
RB0.707 e ± 0.0180.177 bc ± 0.0130.231 b ± 0.01173.1 d ± 7.127.1 b ± 1.25.3 b ± 0.62.4 a ± 0.2
RC0.438 c ± 0.0540.169 b ± 0.0090.142 a ± 0.00550.9 b ± 1.618.7 a ± 1.77.5 cd ± 0.72.4 a ± 0.4
Values are an average of three replications ± S.D. in fresh matter. Mean values in columns marked with the same letters do not differ significantly (p < 0.05). a Type of product: RO (control sample)—rhubarb product without pomace, RA—rhubarb product with addition of apple pomace, RBc—rhubarb product with addition of blackcurrant pomace, RCh—rhubarb product with addition of chokeberry pomace, RB—rhubarb product with addition of red beet pomace, RC—rhubarb product with addition of carrot pomace.
Table 4. The level of constituents with antioxidant properties and total antioxidant activity in rhubarb products.
Type of Product aTotal
Polyphenols
(mg EC b/100 g)
Total
Flavonoids
(mg EC/100 g)
Total
Anthocyanins
(mg Cyanidin-3-Glucoside Equivalent/100 g)
Beta-Carotene
(µg/100 g)
ABTS
(µmol Tx/g)
DPPH
(µmol Tx/g)
0 months stored:
RO18.2 b ± 1.18.3 b ± 0.39.4 cd ± 0.374 a ± 1016.1 b ± 0.513.4 b ± 0.5
RA49.3 f ± 2.518.8 ef ± 1.911.8 d ± 2.3107 cd ± 634.2 e ± 0.225.3 e ± 0.7
RBc87.1 i ± 1.526.2 g ± 0.976.4 h ± 4.177 ab ± 467.8 h ± 4.146.8 h ± 1.5
RCh93.1 j ± 3.739.7 i ± 1.862.5 g ± 3.5139 e ± 1776.3 i ± 1.855.9 i ± 0.9
RB37.8 e ± 2.617.1 e ± 0.79.7 d ± 0.6109 cd ± 627.6 d ± 0.217.4 d ± 0.2
RC29.7 d ± 1.914.9 d ± 1.710.5 d ± 0.5397 g ± 2925.3 cd ± 1.015.4 c ± 1.1
8 months stored:
RO13.5 a ± 1.36.3 a ± 0.55.4 a ± 0.465 a ± 712.2 a ± 0.88.8 a ± 0.5
RA40.1 e ± 1.515.0 d ± 0.68.9 bcd ± 1.198 bc ± 427.9 d ± 2.115.0 c ± 0.5
RBc72.5 g ± 1.522.4 f ± 1.152.0 f ± 2.472 a ± 655.1 f ± 2.134.7 f ± 1.5
RCh79.6 h ± 1.532.8 h ± 1.645.8 e ± 2.5125 de ± 1962.0 g ± 2.043.4 g ± 2.3
RB30.3 d ± 3.114.4 cd ± 0.66.0 ab ± 0.3100 c ± 1224.3 c ± 1.212.4 b ± 0.5
RC24.3 c ± 1.412.9 c ± 1.06.3 abc ± 0.4364 f ± 918.3 b ± 0.412.2 b ± 0.4
Values are an average of three replications ± S.D. in fresh matter. Mean values in columns marked with the same letters do not differ significantly (p < 0.05). a Type of product: RO (control sample)—rhubarb product without pomace, RA—rhubarb product with addition of apple pomace, RBc—rhubarb product with addition of blackcurrant pomace, RCh—rhubarb product with addition of chokeberry pomace, RB—rhubarb product with addition of red beet pomace, RC—rhubarb product with addition of carrot pomace. b Catechin equivalent.
Table 5. Color parameters of fresh and stored rhubarb products.
Type of Product aL* a* b* C* h° ΔE*
0 months stored:
RO30.45 e ± 0.4118.24 g ± 0.2916.96 c ± 0.0524.90 ± 0.2042.92 c ± 0.51
RA33.06 f ± 1.1913.56 d ± 0.7624.38 e ± 1.0927.90 f ± 1.1560.9 e ± 1.379.21 a ± 1.25
RBc17.17 c ± 0.5811.36 bc ± 0.371.87 a ± 0.2711.52 a ± 0.419.30 a ± 1.0221.20 c ± 0.71
RCh7.81 a ± 0.6815.90 ef ± 0.684.17 b ± 0.5116.44 b ± 0.7914.65 b ± 1.1226.11 d ± 1.02
RB27.93 d ± 1.5410.54 b ± 0.4621.28 d ± 1.8623.76 ± 1.7263.57 f ± 2.009.33 a ± 0.65
RC37.54 h ± 0.6016.53 f ± 0.8025.71 f ± 0.2330.94 g ± 0.8556.25 d ± 1.7311.42 b ± 0.58
8 months stored:
RO31.19 e ± 0.2115.61 ef ± 0.3716.64 c ± 0.2419.22 c ± 0.3960.00 e ± 0.66
RA33.80 f ± 0.7911.86 c ± 0.7524.28 e ± 1.0227.04 f ± 0.5763.94 f ± 2.4010.32 a ± 0.43
RBc9.77 b ± 0.2010.96 b ± 0.023.66 b ± 0.0518.30 c ± 0.0310.38 a ± 0.1125.65 d ± 0.32
RCh7.70 a ± 1.1815.08 e ± 0.084.09 b ± 0.1916.60 b ± 0.1114.26 b ± 0.5926.33 d ± 0.76
RB26.69 d ± 0.169.30 a ± 0.0420.09 d ± 0.2722.14 ± 0.2665.17 f ± 0.2510.20 a ± 0.36
RC36.11 g ± 0.2313.63 d ± 0.9723.52 e ± 0.3327.19 ± 0.7859.93 e ± 1.429.85 a ± 0.35
Values are an average of three replications ± S.D. in fresh matter. Mean values in columns marked with the same letters do not differ significantly (p < 0.05). a Type of product: RO (control sample)—rhubarb product without pomace, RA—rhubarb product with addition of apple pomace, RBc—rhubarb product with addition of blackcurrant pomace, RCh—rhubarb product with addition of chokeberry pomace, RB—rhubarb product with addition of red beet pomace, RC—rhubarb product with addition of carrot pomace.
Table 6. Texture parameters of fresh and stored rhubarb products.
Type of Product aGel Strength (Fe)
N
Rupture Strength (FR)
N
Energy of Penetration (E)
N s
Adhesiveness (A)
N s
0 months stored:
RO0.99 b ± 0.191.48 a ± 0.3612.80 a ± 1.32−0.78 d ±0.18
RA1.32 def ± 0.131.71 abc ± 0.1115.78 abc ± 1.30−0.96 cd ± 0.10
RBc1.59 h ± 0.362.59 d ± 0.2019.08 cd ± 1.03−0.99 bcd ± 0.12
RCh1.71 i ± 0.142.55 d ± 0.3621.05 d ± 2.71−1.56 a ± 0.10
RB1.43 fg ± 0.302.45 cd ± 0.1018.43 cd ± 1.08−1.46 a ± 0.31
RC1.21 cd ± 0.311.55 a ± 0.3015.47 abc ± 1.71−1.04 bcd ± 0.09
8 months stored:
RO0.74 a ± 0.530.98 a ± 0.4212.49 a ± 1.20−0.63 d ± 0.15
RA1.21 cd ± 0.311.59 ab ± 0.3215.49 abc ± 1.33−0.87 cd ± 0.08
RBc1.45 h ± 0.182.36 cd ± 0.1918.37 cd ± 1.07−0.90 cd ± 0.10
RCh1.57 h ± 0.452.33 bcd ± 0.8319.46 cd ± 6.89−1.42 ab ± 0.19
RB1.39 efg ± 0.142.32 bcd ± 0.3017.51 bcd ± 2.43−1.28 abc ± 0.09
RC1.16 c ± 0.101.44 a ± 0.3814.01 ab ± 2.09−0.95 cd ± 0.14
Values are average of 3 replication ± S.D. Mean values in columns marked with the same letters do not differ significantly (p < 0.05). a Type of product: RO (control sample)—rhubarb product without pomace, RA—rhubarb product with addition of apple pomace, RBc—rhubarb product with addition of blackcurrant pomace, RCh—rhubarb product with addition of chokeberry pomace, RB—rhubarb product with addition of red beet pomace, RC—rhubarb product with addition of carrot pomace.
Disclaimer/Publisher’s Note: The statements, opinions and data contained in all publications are solely those of the individual author(s) and contributor(s) and not of MDPI and/or the editor(s). MDPI and/or the editor(s) disclaim responsibility for any injury to people or property resulting from any ideas, methods, instructions or products referred to in the content.

