Article

Effect of Different Irrigated Crop Successions on Soil Carbon and Nitrogen–Phosphorus–Potassium Budget Under Mediterranean Conditions

1
Instituto Politécnico de Beja, Escola Superior Agrária de Beja, Rua Pedro Soares, 7800-295 Beja, Portugal
2
Center for Sci-Tech Research in Earth System and Energy (CREATE), Universidade de Évora-Pólo IPBeja, 7000-671 Évora, Portugal
3
Institute of Earth Sciences (ICT), University of Évora, Rua Romão Ramalho 59, 7000-671 Évora, Portugal
4
GeoBioTec, Nova School of Science and Technology, Campus da Caparica, 2829-516 Caparica, Portugal
5
MED-Instituto Mediterrânico para a Agricultura, Ambiente e Desenvolvimento & CHANGE-Global Change and Sustainable Institute, Universidade de Évora, Núcleo da Mitra, 7006-554 Évora, Portugal
*
Author to whom correspondence should be addressed.
Agriculture 2024, 14(11), 1908; https://doi.org/10.3390/agriculture14111908
Submission received: 19 September 2024 / Revised: 21 October 2024 / Accepted: 26 October 2024 / Published: 27 October 2024
(This article belongs to the Section Agricultural Water Management)

Abstract

:
Sustainability in agroecosystems relies on the optimized use of resources to achieve consistent yields while maintaining or improving soil health. The monitoring of soil quality is crucial when changes from rainfall-fed to irrigated crop systems occur. The objective of this study was to assess the impact of different crop successions in the Mediterranean area under irrigation and different technical practices. The soil nitrogen–phosphorous–potassium (NPK) and soil organic carbon (SOC) balances were observed in four fields with irrigated annual crops in a two-year succession timeframe, namely, sunflower–maize (P1), sunflower–clover (P2), maize–sunflower (P3), and alfalfa–alfalfa (P4). The SOC and nutrient balance, integrating the total irrigation, mineral fertilizers, and exported yield, was calculated for each farm. Except for maize–sunflower succession (P3), all fields presented a negative SOC balance at the end of the two-year crop succession, indicating losses from 2.84 to 4.91 Mg SOC ha−1 y−1. While in N-fixing plants the soil N decreased, in the remaining crops a surplus was observed, possibly leading to future N losses. The continuous depletion of soil P revealed a potential underestimation of this nutrient. Soil K appears to be related to specific crop management practices, namely, crop residue incorporation after harvest. In annual irrigated crops under Mediterranean conditions, crop succession can induce soil fertility degradation if conservation practices are absent.

Graphical Abstract

1. Introduction

Soil is an essential resource for ecosystemic services, such as food, feed, and fiber production and the maintenance of environmental quality and biodiversity [1]. The soil’s health is a holistic concept that includes its physical and chemical properties, in interaction with autotrophic and heterotrophic species in an ecosystem [2]. Its management connects agriculture and soil science to policy, stakeholder needs, and sustainable supply-chain management. The exponential human population increase has led to several technological shifts in soil management, namely, the replacement of fallow land period by permanent soil occupation. The maintenance of soil’s physical and chemical characteristics over time is a challenge for growers, while ensuring sustainable activity, from the economic, social, and environmental point of view. Land management has direct implications on climate change mitigation and adaptation, contributing to overcoming environmental and socioeconomic challenges [3]. Soil health has become a policy priority since the European Union (EU) proposed a new Soil Monitoring Law to protect and restore soil health for long term sustainability.
The impact of conservation farming practices on Mediterranean agro-ecosystem service provisioning was analyzed by Lee et al. [4]. Through a meta-analysis, the authors considered a total of 155 publications to underline the effects of management types and options, namely, tillage, mulching, use of cover crops, fertilization, weed management, and water management, on ecosystem services. The effect of different crop successions was not considered in this study, although it was concluded that overall sustainable agricultural management options had a positive effect on ecosystem services in Mediterranean conditions. Studies considering crop rotation as a sustainable practice to preserve and enhance soil fertility in the Mediterranean climate have been carried out mostly with winter crops (wheat) or protein peas (pea, faba bean) [5,6,7]. In semiarid regions, the effect of alfalfa crop rotation with spring wheat cropping or fallow on soil nutrient increase or loss was studied in a four-year field experiment [8]. In this study, the fallow fields conduced to the highest soil SOC (soil organic carbon) and nutrient total NPK (nitrogen, phosphorus, potassium) losses in opposition to the alfalfa fields. Forages have extensive fibrous root systems that explore large volumes of soil, deeper than most grain crops [9].
In low-C (carbon) soils (<1%), common in the southern Mediterranean region, management strategies that use continuous tillage and low-residue restitution in irrigated arable crops contribute to SOM (soil organic matter) depletion and soil degradation, compromising the future of agriculture. This is magnified by the shallow nature of Mediterranean soils with low infiltration and high erosion rates [10]. Annual-based arable ecosystems are strongly disturbed, exhibiting degraded soil structure, strong soil erosion, and soil organic matter impoverishment. Low water and nutrient retention and a less-diverse or functional soil microbiome are also common [11]. The Mediterranean climate is characterized by hot summer temperatures and an irregular and scarce amount of rainfall throughout the season, with special predominance in winter.
The adoption of irrigated agriculture in the Mediterranean region has led to the implementation of adaptation strategies at the farm level, driven by both biophysical and socioeconomic factors that determine the spatial variability of their implementation [12]. In Portugal, the irrigated agricultural land increased by 20.1% from 2009 to 2019. Although perennial species were mainly responsible for this increase, arable crops farmers in the south of Portugal also benefited from the access to water supply [13].
In the absence of irrigation water, winter cereals (wheat, barley, and rye) were the predominant arable crops in the south of Portugal. In the present climate change scenario, water provided by yearly rainfall has become scarcer and more irregular, and winter cereals have become low-yielded and low-income crops. Therefore, the transition from winter cereals to more productive and profitable summer crops was inevitable when irrigation water supply was made available.
The alternate use of different crop species in successive years is an ancient practice based on distinct characteristics, namely, the morphology of the root system, nutrient extractions, and pest and disease susceptibility. The main goal is to maintain soil fertility while reducing pest and disease pressure in the agroecosystem. Diverse crop rotations that include perennial legumes and grasses can improve soil health by enhancing all their functions, reducing their dependence on mineral fertilizers, irrigation, and chemical plant protection [13]. Legumes belonging to Fabaceae family are often used before or after cereal crops due to their capability of fixing N from the atmosphere, through symbiosis with Rhizobium sp. bacteria.
Maize (Zea mays L.) and sunflower (Helianthus annus L.) are economically important crops adapted to the Mediterranean climate, which can also be used in a crop succession due to their very distinct physiology, root morphology, and nutritional requirements. Sunflower and maize are both summer crops, belonging to different families (Asteraceae and Poaceae, respectively). Maize particularities include its C4 type physiology, enabling this crop to use carbon more efficiently. Maize presents a fasciculate and very dense root system that extracts nutrients mostly in the superficial soil layer. Sunflower is a C3 type plant, with a pivotal root system that can explore different soil depths and extract specific nutrients differently from maize.
Maize is the most cultivated cereal in Portugal [13] and the most important irrigated annual crop in Alentejo [14]. Within the oilseed crops, sunflower is the main crop produced in Portugal and Alentejo, often in rotation with maize [13,14]. In addition to cereal crops, permanent crops such as alfalfa or clover are grown as pastures for animal feed, usually with low fertilizer and water inputs.
Overall, carbon and nutrient cycling will depend on crops and multiple component interactions at farming level that establish the unique soil–plant–microbiome. The transition from nonirrigated winter cereals agroecosystems to irrigated spring crops (cereals, sunflower, and other annual or perennial crops), brings new and complex interactions between climate, crops, and technical practices interactions. In Mediterranean conditions, shifting from winter to spring crops normally implies the absence of crops or vegetation during the rainy season (autumn–winter), increasing the risks of soil erosion and nutrient leaching.
Organic cropping systems that alternate legumes with other arable crops (cereals) in temperate regions have been shown to result in balanced N fluxes, leaving a surplus of only a few kg N ha−1 y−1, with legumes accounting for 86% of total N inputs [15]. The adoption of different cropping systems (conventional, low input, conservation agriculture, and organic management) in arable crops in northern France resulted in a positive N surplus after 19 years, but this parameter was not a good indicator of the N fate of the four agricultural systems [16]. These authors confirmed the importance of N availability for SOC sequestration. In Poyda et al.’s study [17], after 16 years analyzing the effect of two crop rotations, differing in their proportion of maize and perennial legume–grass leys in SOC, a low contribution of silage maize crop to SOM increase was observed. The introduction of perennial crops in crop rotations is thought to be more important than crop diversity when considering SOC stocks’ increase and stabilization efficiency [18]. Perennial plants, such as alfalfa, were shown to increase soil nutrients, not only because of the belowground biomass inputs, but also through the surface vegetation characteristics that enable soil protection and prevent nutrient losses during their long crop cycle [8,9]. When compared with monocultures, crop rotation and intercropping significantly promote the release and utilization of P in soils [19]. The retention of soil K was enhanced by both crop residue return and K fertilization in wheat–maize and rice–maize systems, alleviating soil K depletion [20,21].
Knowledge gap: To understand the impacts on soil carbon sequestration and nutrient stocks from the transition of winter cereal agroecosystems to irrigated (annual or perennial) crops in Mediterranean conditions.
We hypothesize the following:
(i)
The succession of different crop species (C3 and C4 plants; annual and perennial) will ensure that both water and nutrients are used more efficiently.
(ii)
The autumn–winter fallow period, when rainfall is frequent, can eventually lead to nutrient and carbon losses, increasing soil degradation.
The objective of this study was to assess the impact of different annual crop successions practiced in the southern region of Portugal (Alentejo), under irrigation and different technical practices, on the soil macronutrient (N, P, K) and carbon budget over a two-year period. The development of practices that promote efficient resource management will assist growers to proactively face European challenges in the European Ecological Pact and Common Agricultural Policy frameworks, also responding to the United Nations Sustainable Development Goals (SDGs).

2. Materials and Methods

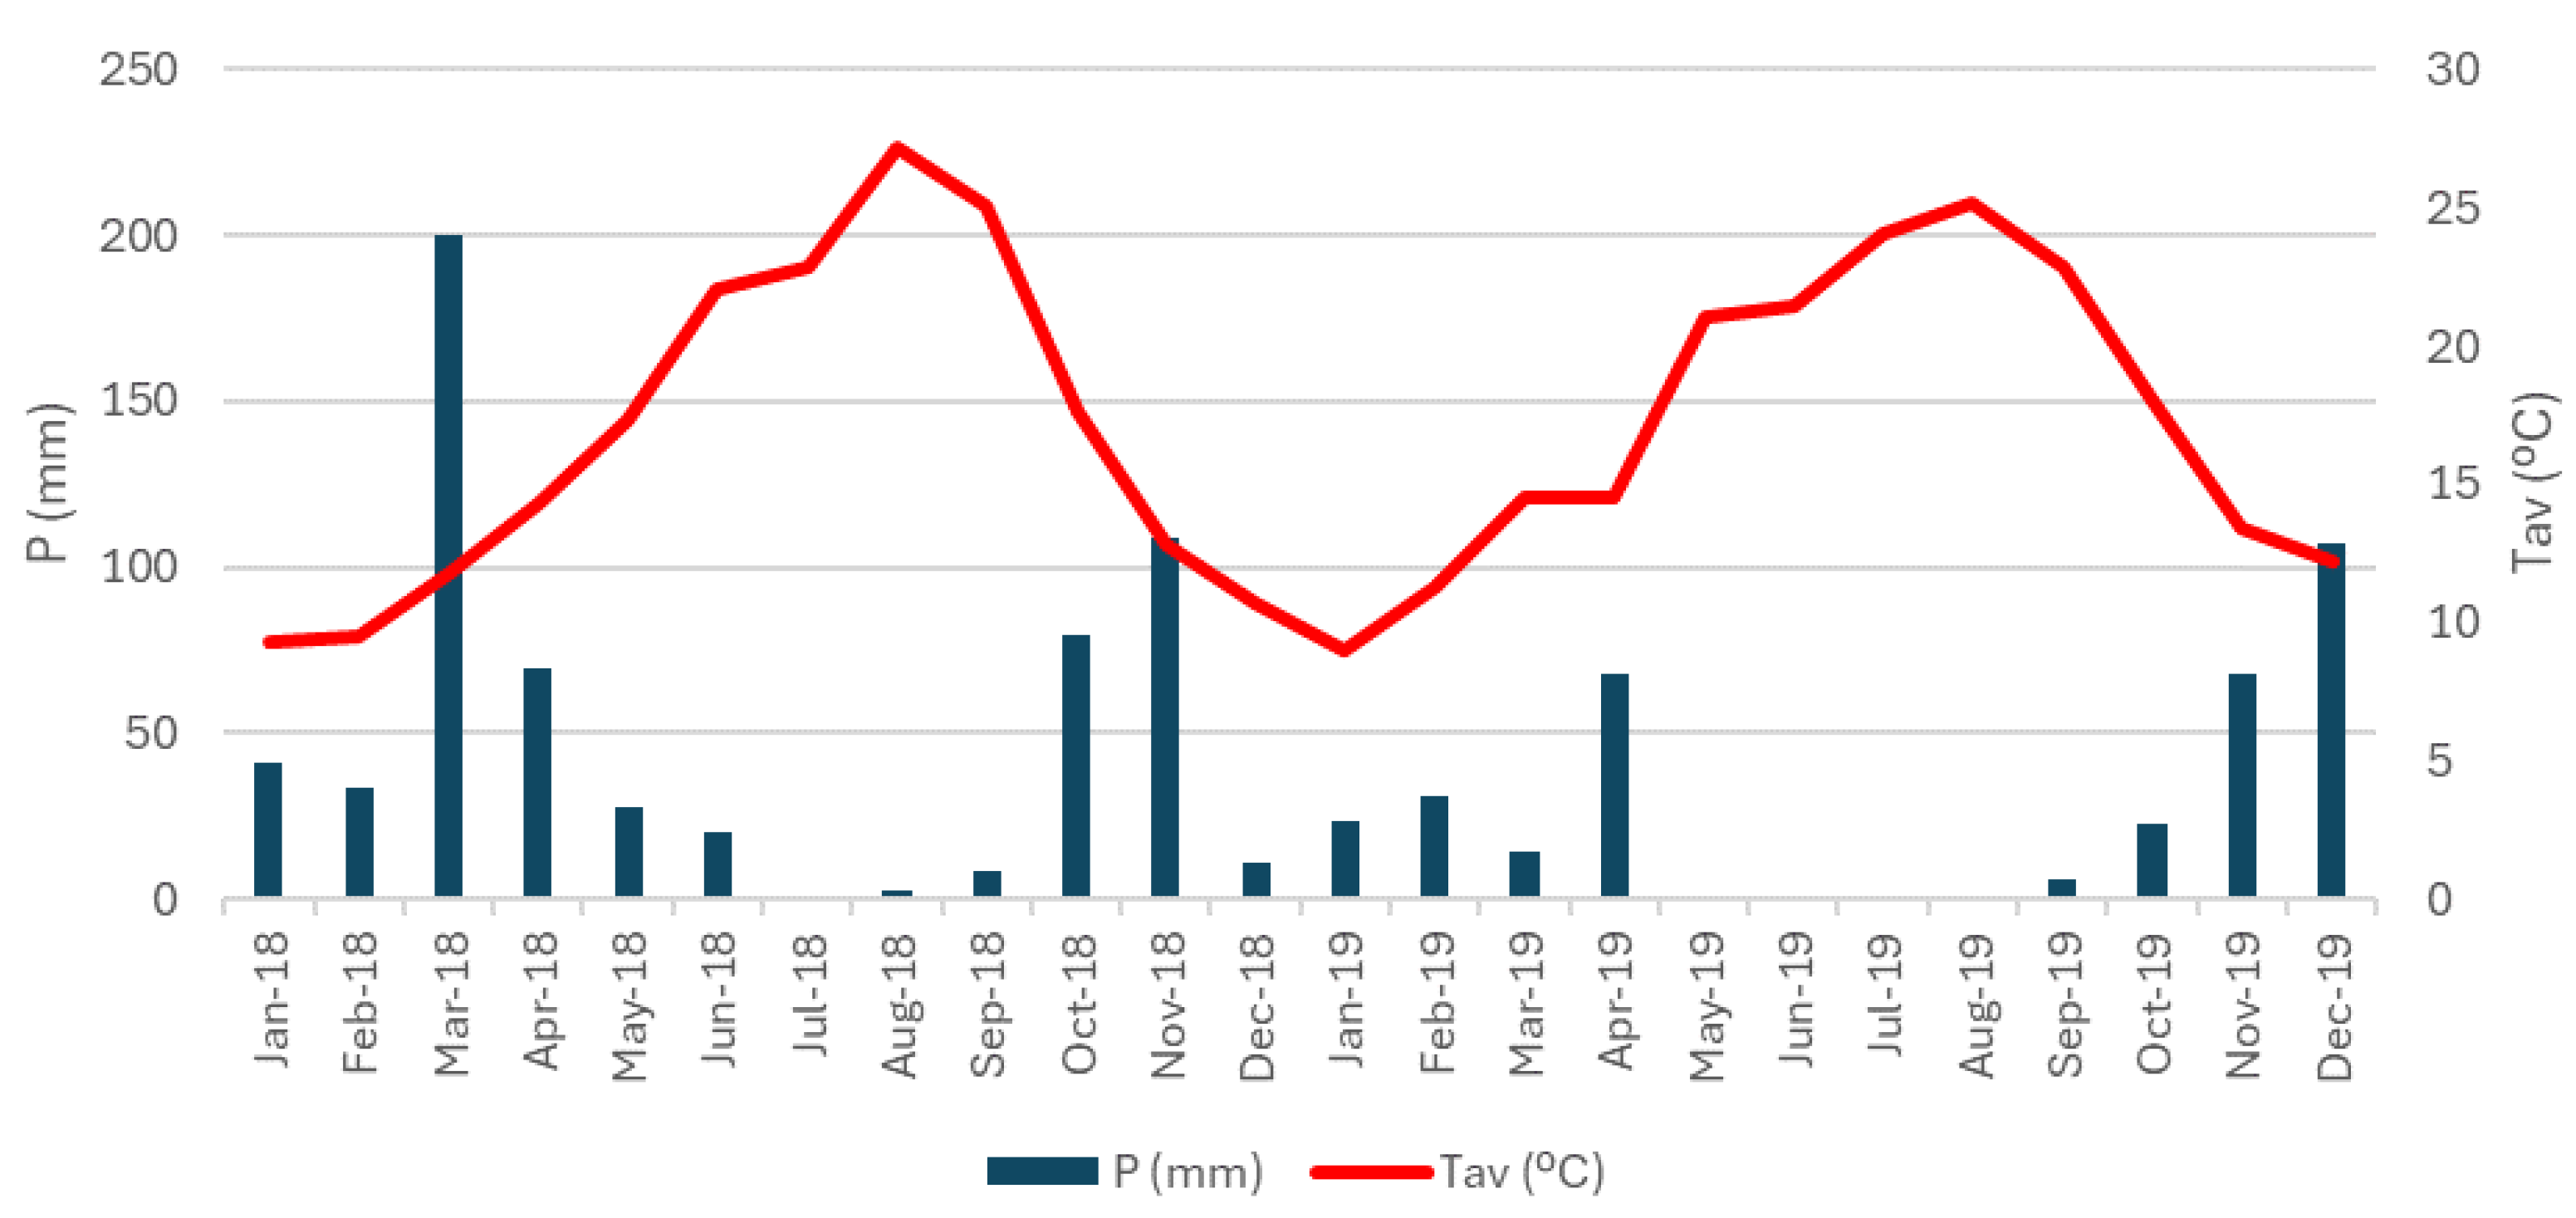
2.1. Site and Crop Description

An on-farm study was carried out over two years (2018 to 2019) in four fields of annual crops irrigated by center-pivot (P1, P2, P3, and P4) in southern Portugal, Alentejo. The crop successions and respective coordinates are mentioned in Table 1. Sunflower (Helianthus annus L.), maize (Zea mays L.), and arrowleaf clover (Trifolium vesiculosum Savi) were cultivated for seed production, whereas alfalfa (Medicago sativa L.) was used as forage, with several cuts per year and removal of its aboveground biomass (stems, leaves, and flowers). In P1, P2, and P3, a fallow period happened from Crop 1 harvest to Crop 2 sowing (Table 2). During this period, the soil was bare or covered with spontaneous weeds. In P4, the soil was permanently covered with the alfalfa crop.
The fields were in the Brinches-Enxoé hydro-agricultural area (HAA) that covers 5061 ha, being one of the areas belonging to the Alqueva irrigation system (EFMA–Empreendimento de Fins Múltiplos de Alqueva), centered in the Alqueva reservoir, Guadiana River Basin, southern Portugal. The Laje and the Montinhos reservoirs of the Brinches-Enxoé HAA ensure pressurized and gravity conveyance networks, respectively.
The region has a Mediterranean climate, temperate with hot and dry summers, with an annual precipitation and average mean monthly temperature of, respectively, 558 mm and 16.9 °C (long-term means for the 1981–2020 period [22]). During the two years of the study (2018–2019), an automatic weather station located in the HAA (37.96833° N; 7.55083° W), recorded annual precipitation values of 603 mm and 343 mm, respectively, and mean temperatures of 16.7 °C and 17.3 °C, respectively [23] (Figure 1).
Predominant soils in P1 and P3 are Calcaric Cambisols and Chromic Vertisols, while in P2 the soils are mainly Pelic Vertisols and Calcaric Vertisols; P4 presents Calcaric Cambisols and Regosols [24,25]. Common characteristics are medium to high pH, low organic matter content, and high clay content.
The sequential crop cycle data and inputs (irrigation, fertilizers) for the two-year period (2018–2019) were provided by the farmers (Table 2 and Table 3). Traditional tillage was performed in all fields by moldboard ploughing with soil inversion (30 cm deep), followed by two crossed chisel passes at 15–20 cm depth or by a disc harrowing of 15 cm depth. Crop residues were buried with the ploughing in autumn or winter time. Mineral fertilizers were incorporated at sowing, whereas water-soluble and liquid fertilizers were applied through the irrigation water over the crop cycle. Nitrogen (N) application was fractioned throughout the crop cycle, whereas P and K were applied only at sowing. The supply of other macro- and micronutrients was performed in some crops either by fertigation or foliar application, as described in Tomaz et al. (2022) [9].
Herbicide application for weed control was the main plant protection practice adopted, although punctual pest outbreaks implied an insecticide spray in sunflower and maize [9].

2.2. Sampling and Data Collection

2.2.1. Soil Sampling

Soil sampling was carried out at the beginning and end of each crop during the two years of the study (2018 and 2019), namely, in the spring (March/April) and at the end of the irrigation period (September/October) (Supplementary Data, Table S1). Composite samples of each 5 ha were collected using an open-ended soil probe in two soil layers, 0–20 cm and 20–40 cm. The composite samples were obtained from a mixture of approximately 5 subsamples collected following a zig-zag trajectory, randomly [26]. Samples were air-dried and sieved with a 2 mm mesh for further chemical analysis in the <2 mm fraction, namely, soil organic matter (SOM) (g kg−1) following the Walkley–Black method [27]; total N (TN) (g N kg−1) using the Kjeldahl method [28]; extractable P (mg P2O5 kg−1) and K (mg K2O kg−1) determined by the Egner–Riehm method [29]. Particle size distribution (coarse sand, fine sand, silt, and clay; g kg−1), following ISO 11277:2020 [30] and cation exchange capacity (CEC), exchangeable calcium (Ca), magnesium (Mg), potassium (K), sodium (Na), and aluminum (Al) (cmol (+) kg−1), following ISO 11260:2018 [31], were obtained only in the first sampling for the initial characterization of the fields. Electrical conductivity of the saturated soil extract (EC; dS m−1) and pH (soil:H2O 1:2 (w/v)) was also assessed.

2.2.2. Irrigation Water Sampling

This study covered three to four water samplings per year (Supplementary Data, Table S1) from four irrigation hydrants, H23, H7, H6, and H33, corresponding to fields P1, P2, P3, and P4, respectively. At the hydrants, 2 L water samples were collected in polyethylene bottles. The water samples were transported to the laboratory in a cooler at 4 °C, and stored, following the requisites for water conservation, for each parameter [32]. Total N (TN) was analyzed by the Kjeldahl method [28], P was determined by molecular absorption spectrometry, and K was analyzed by ionic chromatography, following the APHA Guidelines [32].

2.2.3. Yield and Plant Extractions

The total crop yield was given by the farmers for each year (Table 2). A sample of each representative plant organ was collected at harvest, namely, sunflower, maize, and arrowleaf clover seeds and alfalfa aboveground biomass (stems, leaves, and flowers) (Supplementary Data, Table S1).
The tissues (sunflower, maize, and arrowleaf clover seeds, and aboveground alfalfa organs: stems, leaves, and flowers) were dried and ground in a mill and analyzed as to their content in C, N, P, and K. Organic matter was obtained by calcination at 450 °C for 26 h, and TN was analyzed using the Kjeldahl method [28]. Phosphorus and K were analyzed after calcination and solubilization with concentrated chloridric acid (HCl 12.08 N), by molecular absorption spectrophotometry and flame photometry, respectively.

2.3. Balance of Soil C and Macronutrients NPK

Yearly and two-year succession balances were calculated for both SOC and NPK, using the average values of both soil layers, as described in Pacheco et al. [33]. SOC balance (Δn) was calculated as the difference between final (nend) and initial (nstart) nutrient content (Equation (1)).
Δn = nend − nstart,
For principal macronutrients (NPK), a simplified budget equation was performed [34]. NPK variation in the soil (Δn) was calculated as the difference between nutrient inputs, namely, by mineral fertilization (nF) and irrigation water (nw) and outputs, considering nutrient removal from the crop (nC) (Equation (2)).
Δn = nF + nw − nC,
Inputs: Nutrients supplied by mineral fertilization were directly obtained from Table 3, except for P and K, where the conversion of P2O5 to P and K2O to K was performed. The irrigation water nutrient supply was estimated by multiplying the total irrigation volume by the water nutrient concentration in the representative irrigation month. This depended on the crop and year considered, varying from April (arrowleaf clover), June (in 2018, for all crops), or July (2019, all crops but arrowleaf clover).
Outputs: The macronutrients (NPK) extracted by each crop and removed from the field were calculated by multiplying the harvested yield in each crop system (sunflower, maize, and arrowleaf clover seeds and alfalfa aboveground tissues: stems, leaves, and flowers) by the respective nutrient composition analyzed.
Given the fact that Equation (2) does not account for nutrient inputs in the system, resulting from SOM mineralization, nor losses, as N volatilization and denitrification, nutrient leaching, or soil erosion, an indirect estimation of nutrient surplus or deficiency was performed by comparing the measured final soil NPK content with the calculated amount derived from Equation (3).
nend = nstart + Δn,

2.4. Statistical Analysis

Soil, water, and plant data were analyzed using IBM SPSS Statistics Version 29.0.0.0 (241) [35]. A full-factorial analysis of variance (ANOVA) was performed for the three main factors (field, soil depth, and sampling date) for each parameter measured in the soil (SOC, TN, P, and K). In water and plant analysis, only two factors were considered, namely, field and sampling date, when performing the full-factorial ANOVA for TN, P, and K concentrations and content. Before performing the ANOVA, the compliance with the assumptions was confirmed. The Bonferroni post hoc test was performed at a significance level of α = 0.05.

3. Results

3.1. Soil Chemical Properties

The soils were characterized by having medium to fine textures (loam to clay–loam and silty clay–loam), with alkaline reaction (average pH values in the range of 8.0–8.5), high cation exchange capacity (Table S2), and low levels of electric conductivity [36]. From the soils’ textural characteristics, the bulk density was assumed as 1300 kg m3 [37], following the values proposed for croplands in Europe [38].

3.1.1. Soil Organic Matter and Soil Organic Carbon

The soils presented very low to low levels of soil organic matter (SOM) (4.2 to 19.3 g SOM kg1) (Supplementary Data, Table S3), a common characteristic of soils in regions in arid or semiarid climates [36]. The conversion of SOM to soil organic carbon (SOC) was performed using the van Bemmelen factor (0.58) [39] (Table 4).
The full-factorial analysis of variance for the three main factors (field, soil depth, and sampling date) revealed very significant interaction (p < 0.001) between field and sampling date, significant interaction (p < 0.01) between field and soil depth, and nonsignificant interaction (p > 0.05) between soil depth and sampling date, as well as for the three factors (field × soil depth × sampling date).
The four fields showed significant differences between soil SOC in each layer and sampling date. P1 showed the highest SOC in both soil depths at the beginning of the crops analysis, whereas P2 and P3 had the lowest starting SOC values. At the end of the two-year crop successions, P3 presented the highest SOC values in both layers, whereas P2 maintained the lowest SOC. P4 showed the lowest SOC in the sub-superficial layer at the end of the two-year succession period. SOC did not differ between soil layers except for P4, where the values were significantly higher in the topsoil when compared to the sub superficial layer.
The effect of crop succession in SOC was observed in all fields, although with different dynamics. While in P1 the SOC decreased after the first crop (sunflower) without any recovery in the second year (maize), in P3 there was an increase in SOC after the first crop (maize), which was maintained in the second year (sunflower) (Table 4). In P2, SOC increased significantly after the first crop (sunflower), decreasing afterward (with arrow leaf clover as the second crop). Finally, in the alfalfa–alfalfa crop succession (P4), a significant decrease in SOC after the second year was observed.

3.1.2. NPK Soil Composition

The soil TN was significantly higher in the topsoil layer (0–20 cm) when compared with the sub-superficial layer (20–40 cm) in all fields (Table 5). Considering the N inputs by superficial fertilizer application at sowing and through the irrigation water, it is expected that N should be more available for plant extraction in the superficial soil layers.
A significant soil TN increase was observed in P1 and P3 at the end of the two-year crop succession of sunflower and maize in both sequences (Table 5). There were different management options in terms of irrigation and N fertilization in both fields and years, namely, a higher N total input by fertilization in P1 (380 kg N ha−1) when compared with P3 (283 kg N ha−1). Additionally, the cumulative amount of water spent in the two years was also higher in P1 (10,017 m3 ha−1) than in P3 (8370 m3 ha−1). This difference was due to the different precipitation that occurred in each year (2019 was drier than 2018 by 56%), and the respective cycle length of each crop. The increase in soil N in both crop systems brings some concerns as to the possible N losses by ammonia volatilization, denitrification, and leaching. This could be related to N fertilizer applications exceeding crops’ needs.
In P2, the increase in soil TN was observed at the end of the first year, not differing significantly at the end of the second year, whereas in P4, the soil N content did not vary significantly between crop successions. The second crop in P2 and P4 in both years belonged to the Fabaceae family, which has a symbiotic relationship with N-fixing bacteria (Rhizobium sp). In addition, there was no N applied by fertilization in 2019 in P2 and only 10 kg N ha−1 were applied in P4 in the first year (2018). Apparently, the N-fixing plants could regulate N levels to fulfill the crops’ needs, buffering the N content in the soil.
All fields presented similar initial soil P values in both depths: very high in the superficial layer (above 200 mg P2O5 kg−1) and high in the sub-superficial layer (between 100 and 200 mg P2O5 kg−1) [40] (Table 4). At the end of the first crop, as well as at the end of the two-crop succession, P3 showed the significantly highest soil P in the total profile when compared with the other fields. This situation can be related to the much higher fertilizer P units applied in P3 in the first year at crop installation (144 kg P2O5 ha−1) when compared with the remaining fields (34, 40, and 10 kg P2O5 ha−1 applied in P1, P2, and P4, respectively) (Table 3).
The effect of soil depth in P amount was observed in all fields (P1 to P4), with P values significantly higher in the topsoil layer (0–20 cm) when compared with the sub-superficial layer (20–40 cm). This is explained by the low P mobility in the soil [41] and the P fertilization applied at sowing, usually incorporated at a maximum depth of 30 cm.
The soil P values showed a significant decrease between the start of the first crop to the end of the second year’s crop cycle in all fields, except for P3 which maintained a very high level of P during the two-year period in the upper soil layer, whereas a significant increase in soil P was observed in the sub-superficial layer after the first crop. As referred to above, in this field, a high P fertilization was applied initially, which could have resulted in the P enrichment of the deepest soil layer by leaching.
The overall decrease in soil P after the two-year succession could represent the P uptake by plants, but P fixation cannot be excluded, since the formation of insoluble calcium–phosphate compounds in soils with abundant Ca2+ or Mg2+ has been described [42]. Furthermore, P fixation in calcareous soils can lead to low crop P uptake, which can be as low as 10 to 20% of the applied P. As a result, consecutive P fertilization can lead to the increase in P pool in soils to reach high and very high values, which, when beyond the crop needs, increases the risk of leaching, potentially contributing to eutrophication processes [43].
Soil K contents at the start of the first crop were significantly higher in P2 and P3 than P1 and P4 for both soil depths (Table 5). At the end of the two-year succession, soil K presented the same trend between fields. P3 maintained the highest K soil content (above 200 mg K2O ha−1) [40], probably as a result of the highest fertilizer K units applied (Table 3).
Regarding the effect of soil depth, K values were generally significantly higher in the topsoil layer (0–20 cm) when compared with the sub-superficial layer (20–40 cm) (Table 5). In P1 there were no differences in soil K throughout the two-year period, during which no K fertilization was applied. The effect of crop succession on soil K was also not significant in P1, whereas in P4, soil K decreased at the end of the two-year alfalfa succession. No differences were observed in the sub-superficial layer (20–40 cm) of P2 and P3. In P2 and P4 topsoil, K decreased significantly after the two-year crop succession, whereas in P3, the soil K values in the superficial layer first showed an increase, reflecting the K fertilization at the start of the first crop (216 kg K2O ha−1), decreasing at the end of the second crop, where only 20 kg K2O ha−1 were applied at sowing.
According to soil’s texture characteristics, it is expected that the soils present high K buffer effect, allowing interchangeable K between the layers of vermiculite and illite clay minerals. In these K-fixing soils, K fertilization must be over the crops’ needs to compensate for the K fixed by the soil and guarantee the productivity response by the crop [44].
The soil nutrient content (Mg ha−1) in the topsoil (layer 0–20 cm), sub-superficial layer (20–40 cm), and total profile is described in Supplementary Data—Table S4, being the basis for the NPK budget.

3.1.3. C/N Ratio

The C/N ratio evolution in the four crop successions can be observed in Table 6. As a result of the C and N values between soil depths, discussed previously, the C/N ratio was calculated for the 0–40 cm layer, representing the depth explored by the roots.
C/N ratio decreased throughout the two-year period in P1 and P4, whereas in P2 and P3, the C/N ratio was higher at the end of the first crop but decreased afterward (Table 6).

3.2. NPK Content in Seed and Forage

Regarding the N composition of sunflower seeds, P1 and P2 presented similar values (around 22 g N kg−1 DM), whereas in P3, the seed N composition was significantly lower (6,20 g N kg−1 DM) (Supplementary Data, Table S5). Despite this difference, the protein values obtained in all fields (Supplementary Data, Table S6) were always below the reference for sunflower seeds (221 g protein kg−1 edible portion) [45]. Phosphorus values in sunflower seeds were also below the reference values of 6.7 mg kg−1 fresh weight (FW) [45], although for this nutrient, P3 seeds were significantly richer than the seeds from P2 and P1 (Supplementary Data, Table S5). Potassium values in sunflower seeds were all significantly different between fields, exceeding reference values of 6.7 g kg−1 FW [45], except for P3 (Supplementary Data, Table S5).
In maize seeds, N, P, and K values differed significantly between P1 and P3 (Supplementary Data, Table S5). Although maize seeds in P3 presented almost double the N content of P1 seeds, the protein values obtained in both fields (Supplementary Data, Table S6) were lower than the reference for maize grains (93 g protein kg−1 edible portion) [45]. Potassium values in maize grains were below the reference values (1.9 g kg−1 FW [45]) in both fields. The K content of maize seeds exceeded the reference value (2.9 g kg−1 FW [45]) in both P1 and P3 (Supplementary Data, Tables S5 and S6). Seed P and K content were both significantly higher in P1 than in P3 (Supplementary Data, Table S5).
Alfalfa N content, when translated into protein, revealed a significant difference between the first and second years, decreasing the forage quality. Therefore, the first year sampled cut could be classified as excellent quality [46], whereas, in the second year, the protein content was below the acceptable quality (Supplementary Data, Table S6). P content in alfalfa was deficient in the first year, but sufficient in the second year, in contrast to K values, which were excessive in the first year and deficient in the year after (Supplementary Data, Table S5) [47].
In arrowleaf clover, since it is a species used for forage, nutrient values are not available for seeds. Nevertheless, N, P, and K values analyzed in arrowleaf seeds were above the flower tissue references for this species (Supplementary Data, Table S5) [48,49].
Considering the chemical composition of the harvested plants and the respective yields obtained each year (expressed in DM), the extractions for each nutrient were obtained (Table 7).
Sunflower seed extractions were significantly different between P1, P2, and P3 for all nutrients. N extractions varied from 20.20 kg N ha−1 in P3 to 93.07 kg N ha−1 in P2 (Table 7). Except for P3, where the N extraction was lower than the national reference (27 to 106 kg N ha−1) P1 and P2 sunflower seed N extractions were in accordance with the reference values for yields between 1 and 4 Mg ha−1 [50]. Phosphorus extractions in sunflower seeds were much lower than the reference in all fields (17 to 68 kg P ha−1 [50]), with P3 presenting the highest value (10.62 kg P ha−1). Finally, sunflower seed K extractions followed the reference values (13 to 52 kg K ha−1 [50]) in all fields, being significantly higher for P2 (37.34 kg K ha−1).
For maize seeds, N extractions differed significantly in P1 and P3, both being below the reference (83 to 443 kg N ha−1 [50]) (Table 7). Phosphorus extractions in maize seeds were much lower than the reference values (31 to 165 kg P ha−1 [50]), whereas maize seeds K extractions were in accordance with the reference values in P1(63 to 347 kg K ha−1 [50]), but significantly much lower in P3.
Alfalfa nutrient extractions were significantly different between 2018 and 2019, with lower N and K exports in the second year, in contrast with the increase in the P extractions after the second season (Table 7).

3.3. Irrigation Water Inputs

The TN, P, and K present in the irrigation water for the four fields of the study during the representative irrigation months (April, June, or July) are shown in Table S7 (Supplementary Data).
The nutrients concentration varied between hydrants and years (Supplementary Data, Table S7). Total N concentrations in 2018 were always above 1.00 g N m−3 in all samples, whereas in 2019 only the P1 irrigation water presented TN amounts per irrigated volume above the unit. The P1 irrigation water showed similar P concentrations in the two years (0.10 g P m−3), whereas in P2, P3, and P4 the P concentration was much lower in the second year (0.03 g P m−3) when compared with the previous year (Supplementary Data, Table S7). The irrigation water in all hydrants provided similar K concentrations, although a decreasing trend was observed in P2, P3, and P4 from the first to the second year (Supplementary Data, Table S7). The contrasting reference month considered in the second year (2019) for P1 (July), when compared with P2, P3, and P4 (April), can explain the lower N, P, and K values obtained in those hydrants, since the absence of rain from April to July 2019 has certainly an impact on the higher nutrient concentration in the water of the collecting reservoirs (Figure 1).
The amount of N, P, and K supplied by the irrigation water during the growth cycle of each crop was calculated as the product of total irrigation water (m3 ha−1) in each field by the respective nutrient concentration in the representative month (Table 8).
Total yearly N supplied by irrigation water varied from a minimum of less than 1 kg N ha−1 in arrowleaf clover (P2) and alfalfa (P4) in 2019 to almost 13 kg N ha−1 in maize in P1 (Table 8). Phosphorus supplied by irrigation water was almost negligible for all the fields and crop successions, being below 1 kg P ha−1 at the end of the two-year period. Potassium was the nutrient for which irrigation water contributed the most to the crops’ nutrition, from a minimum of 8.80 kg K ha−1 in arrowleaf clover in P2 to 48.03 kg K ha−1 in maize of P1.

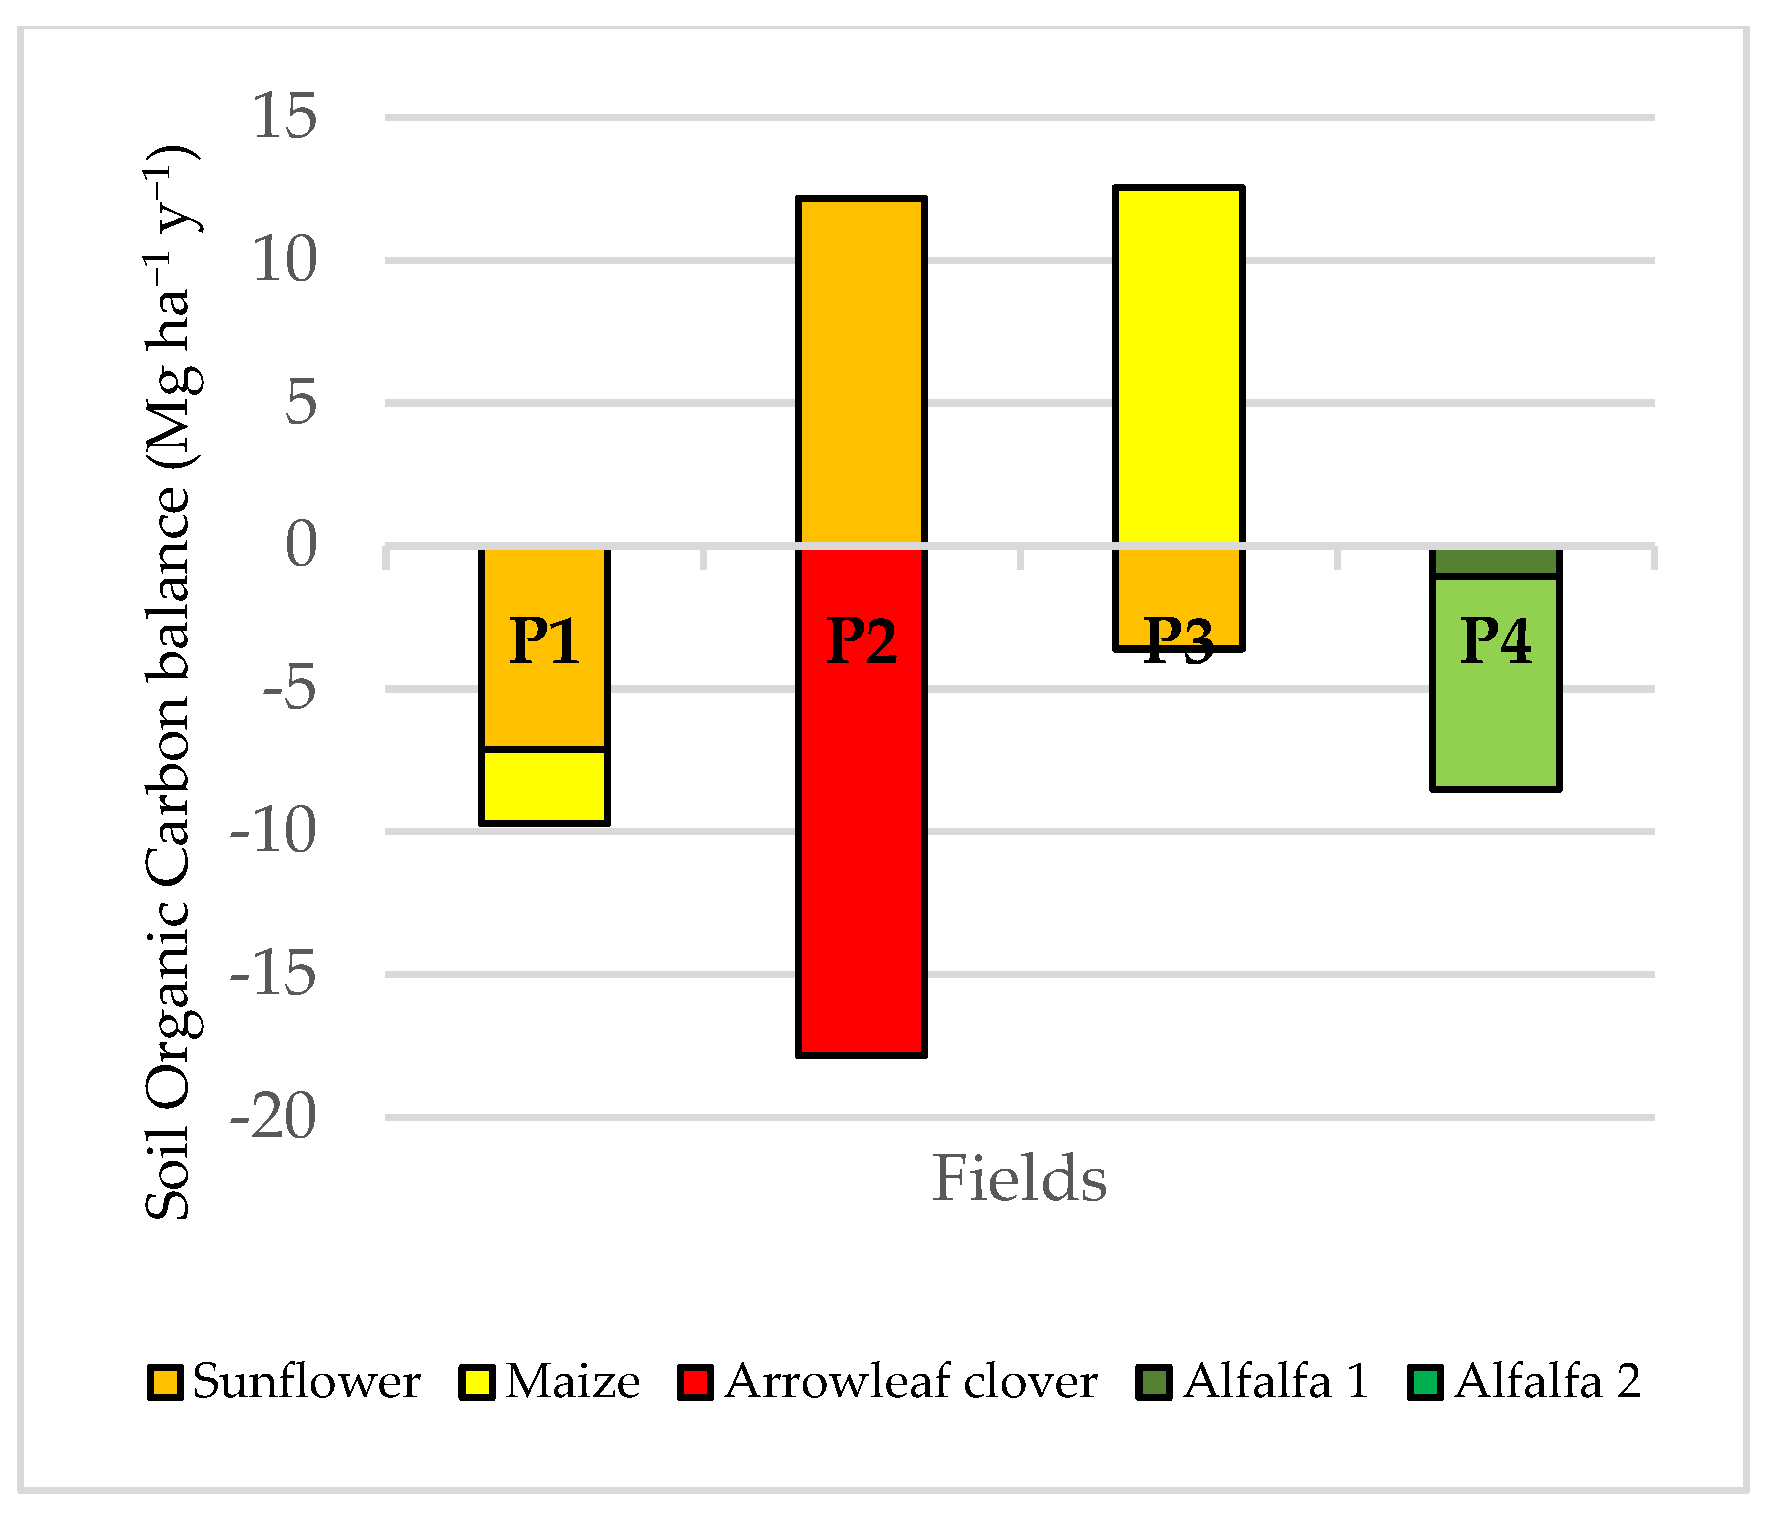
3.4. Soil Organic Carbon Balance
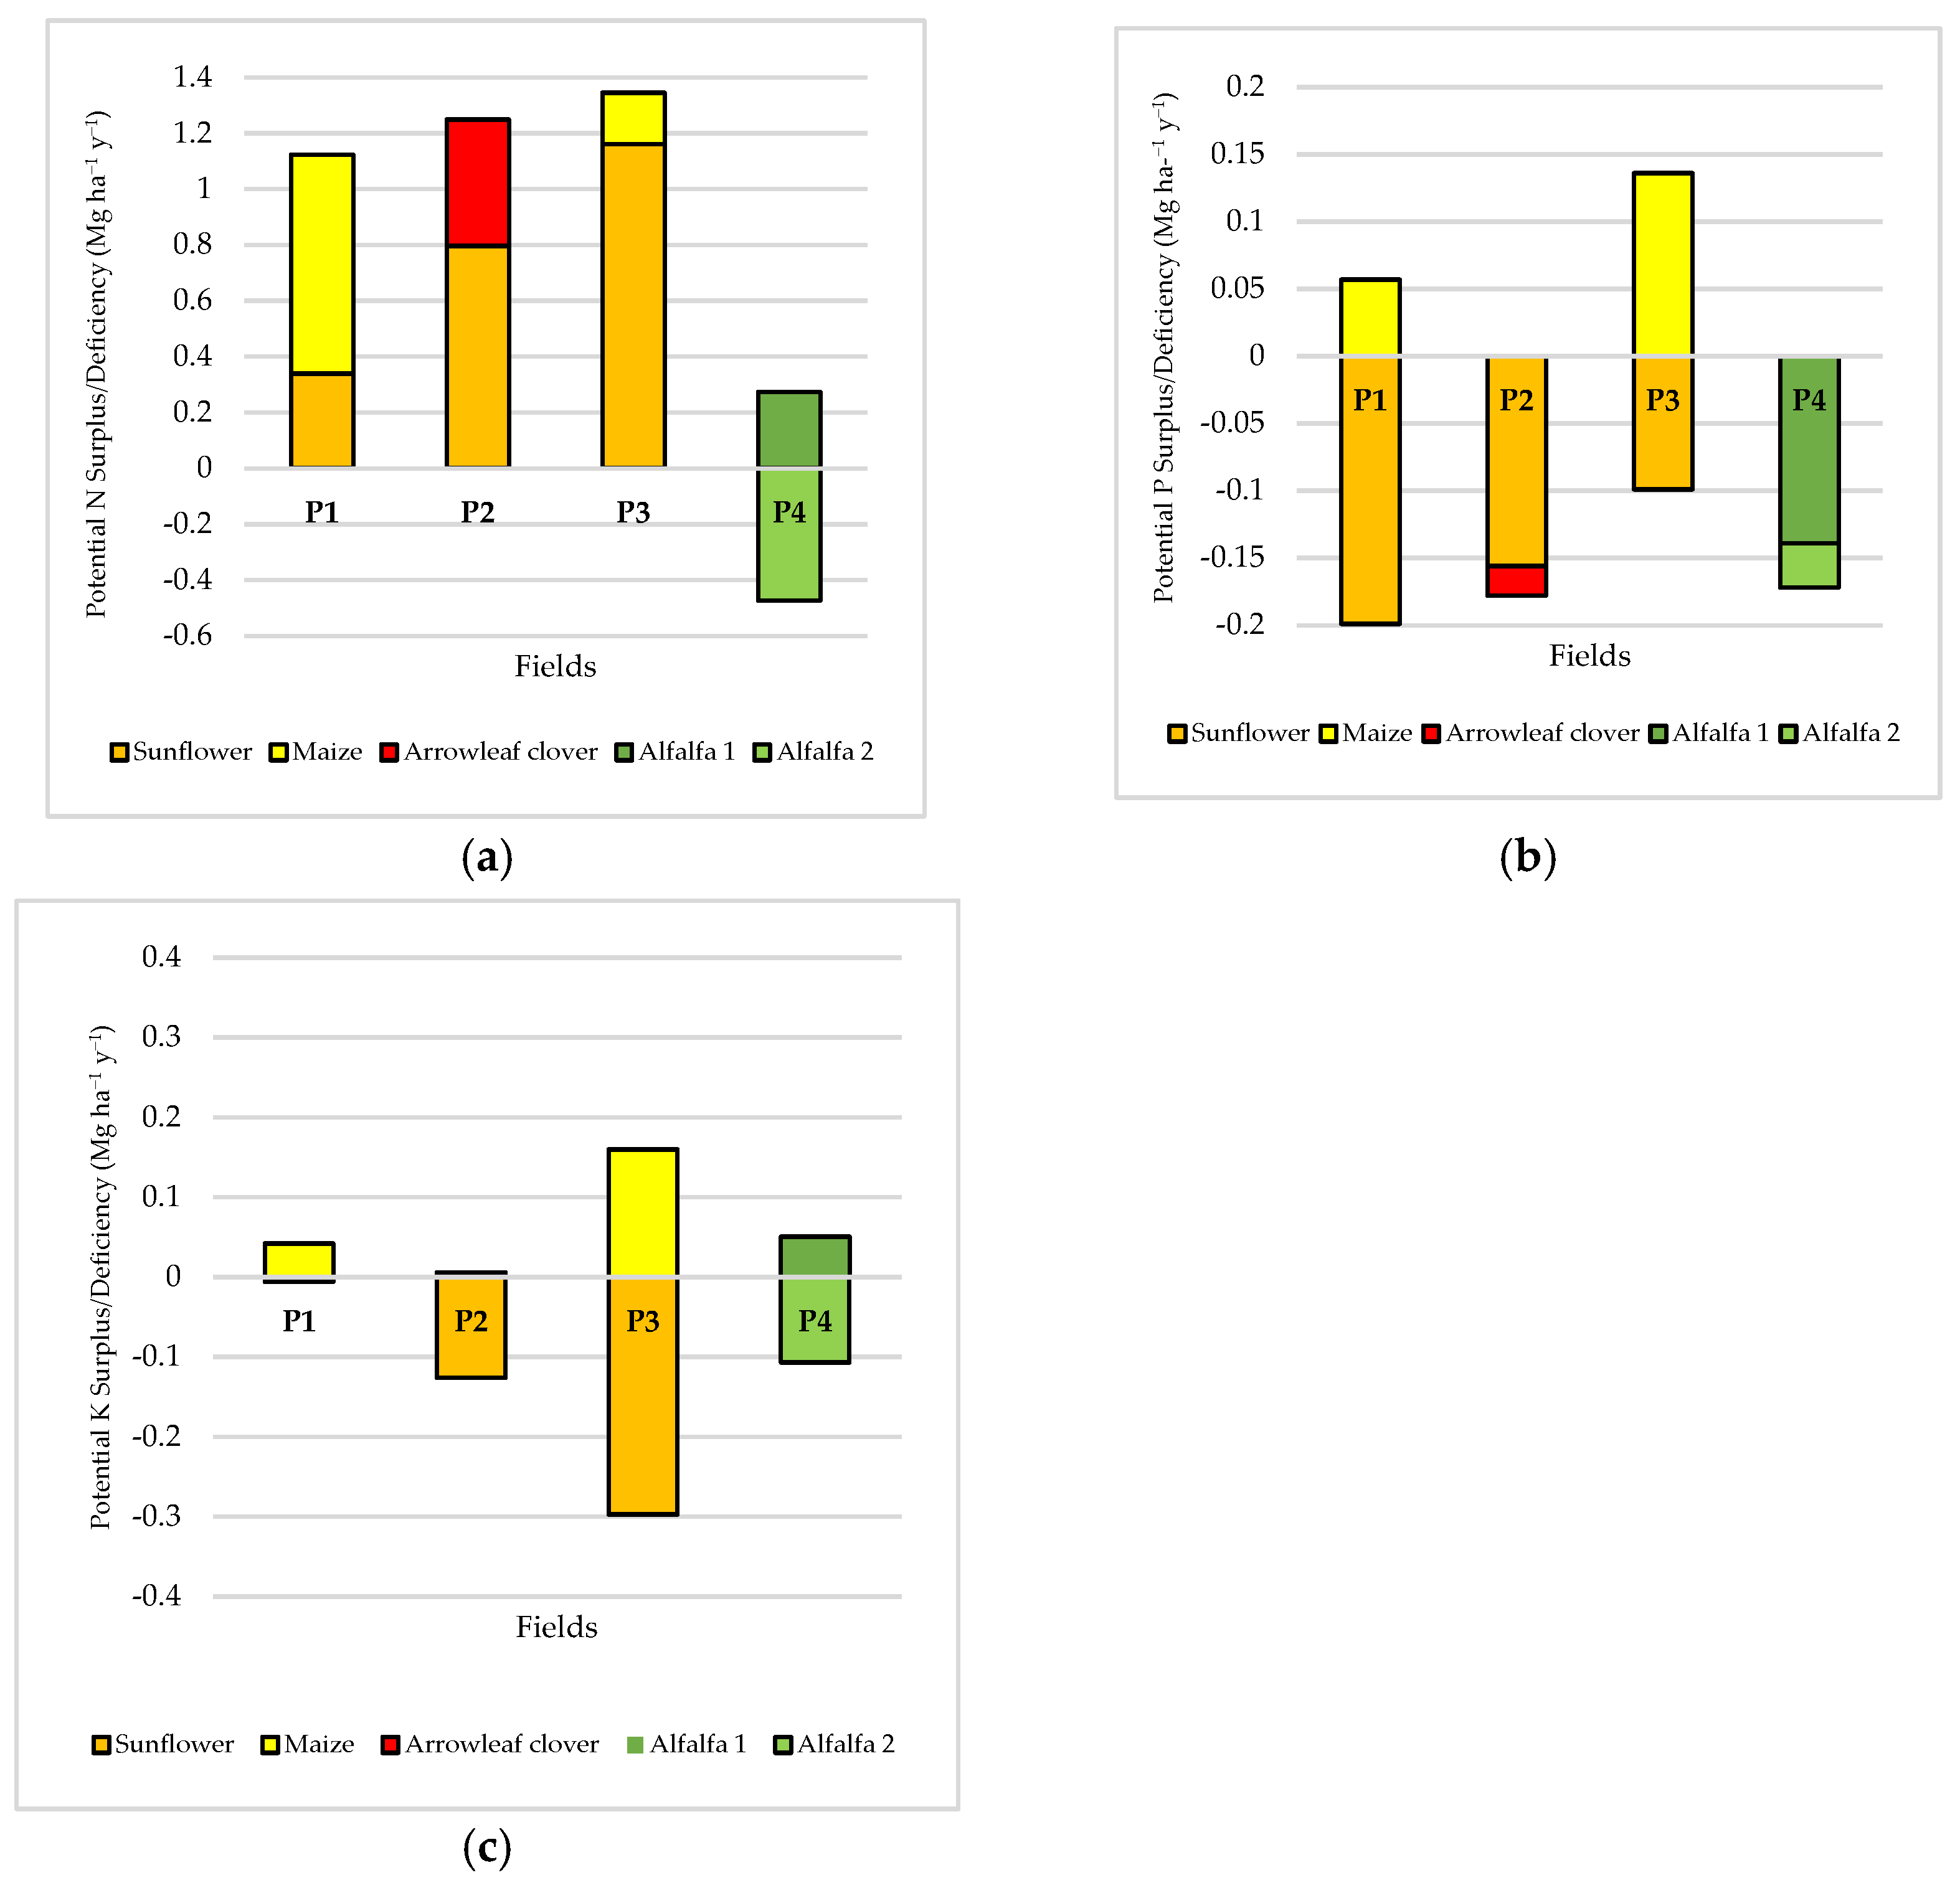
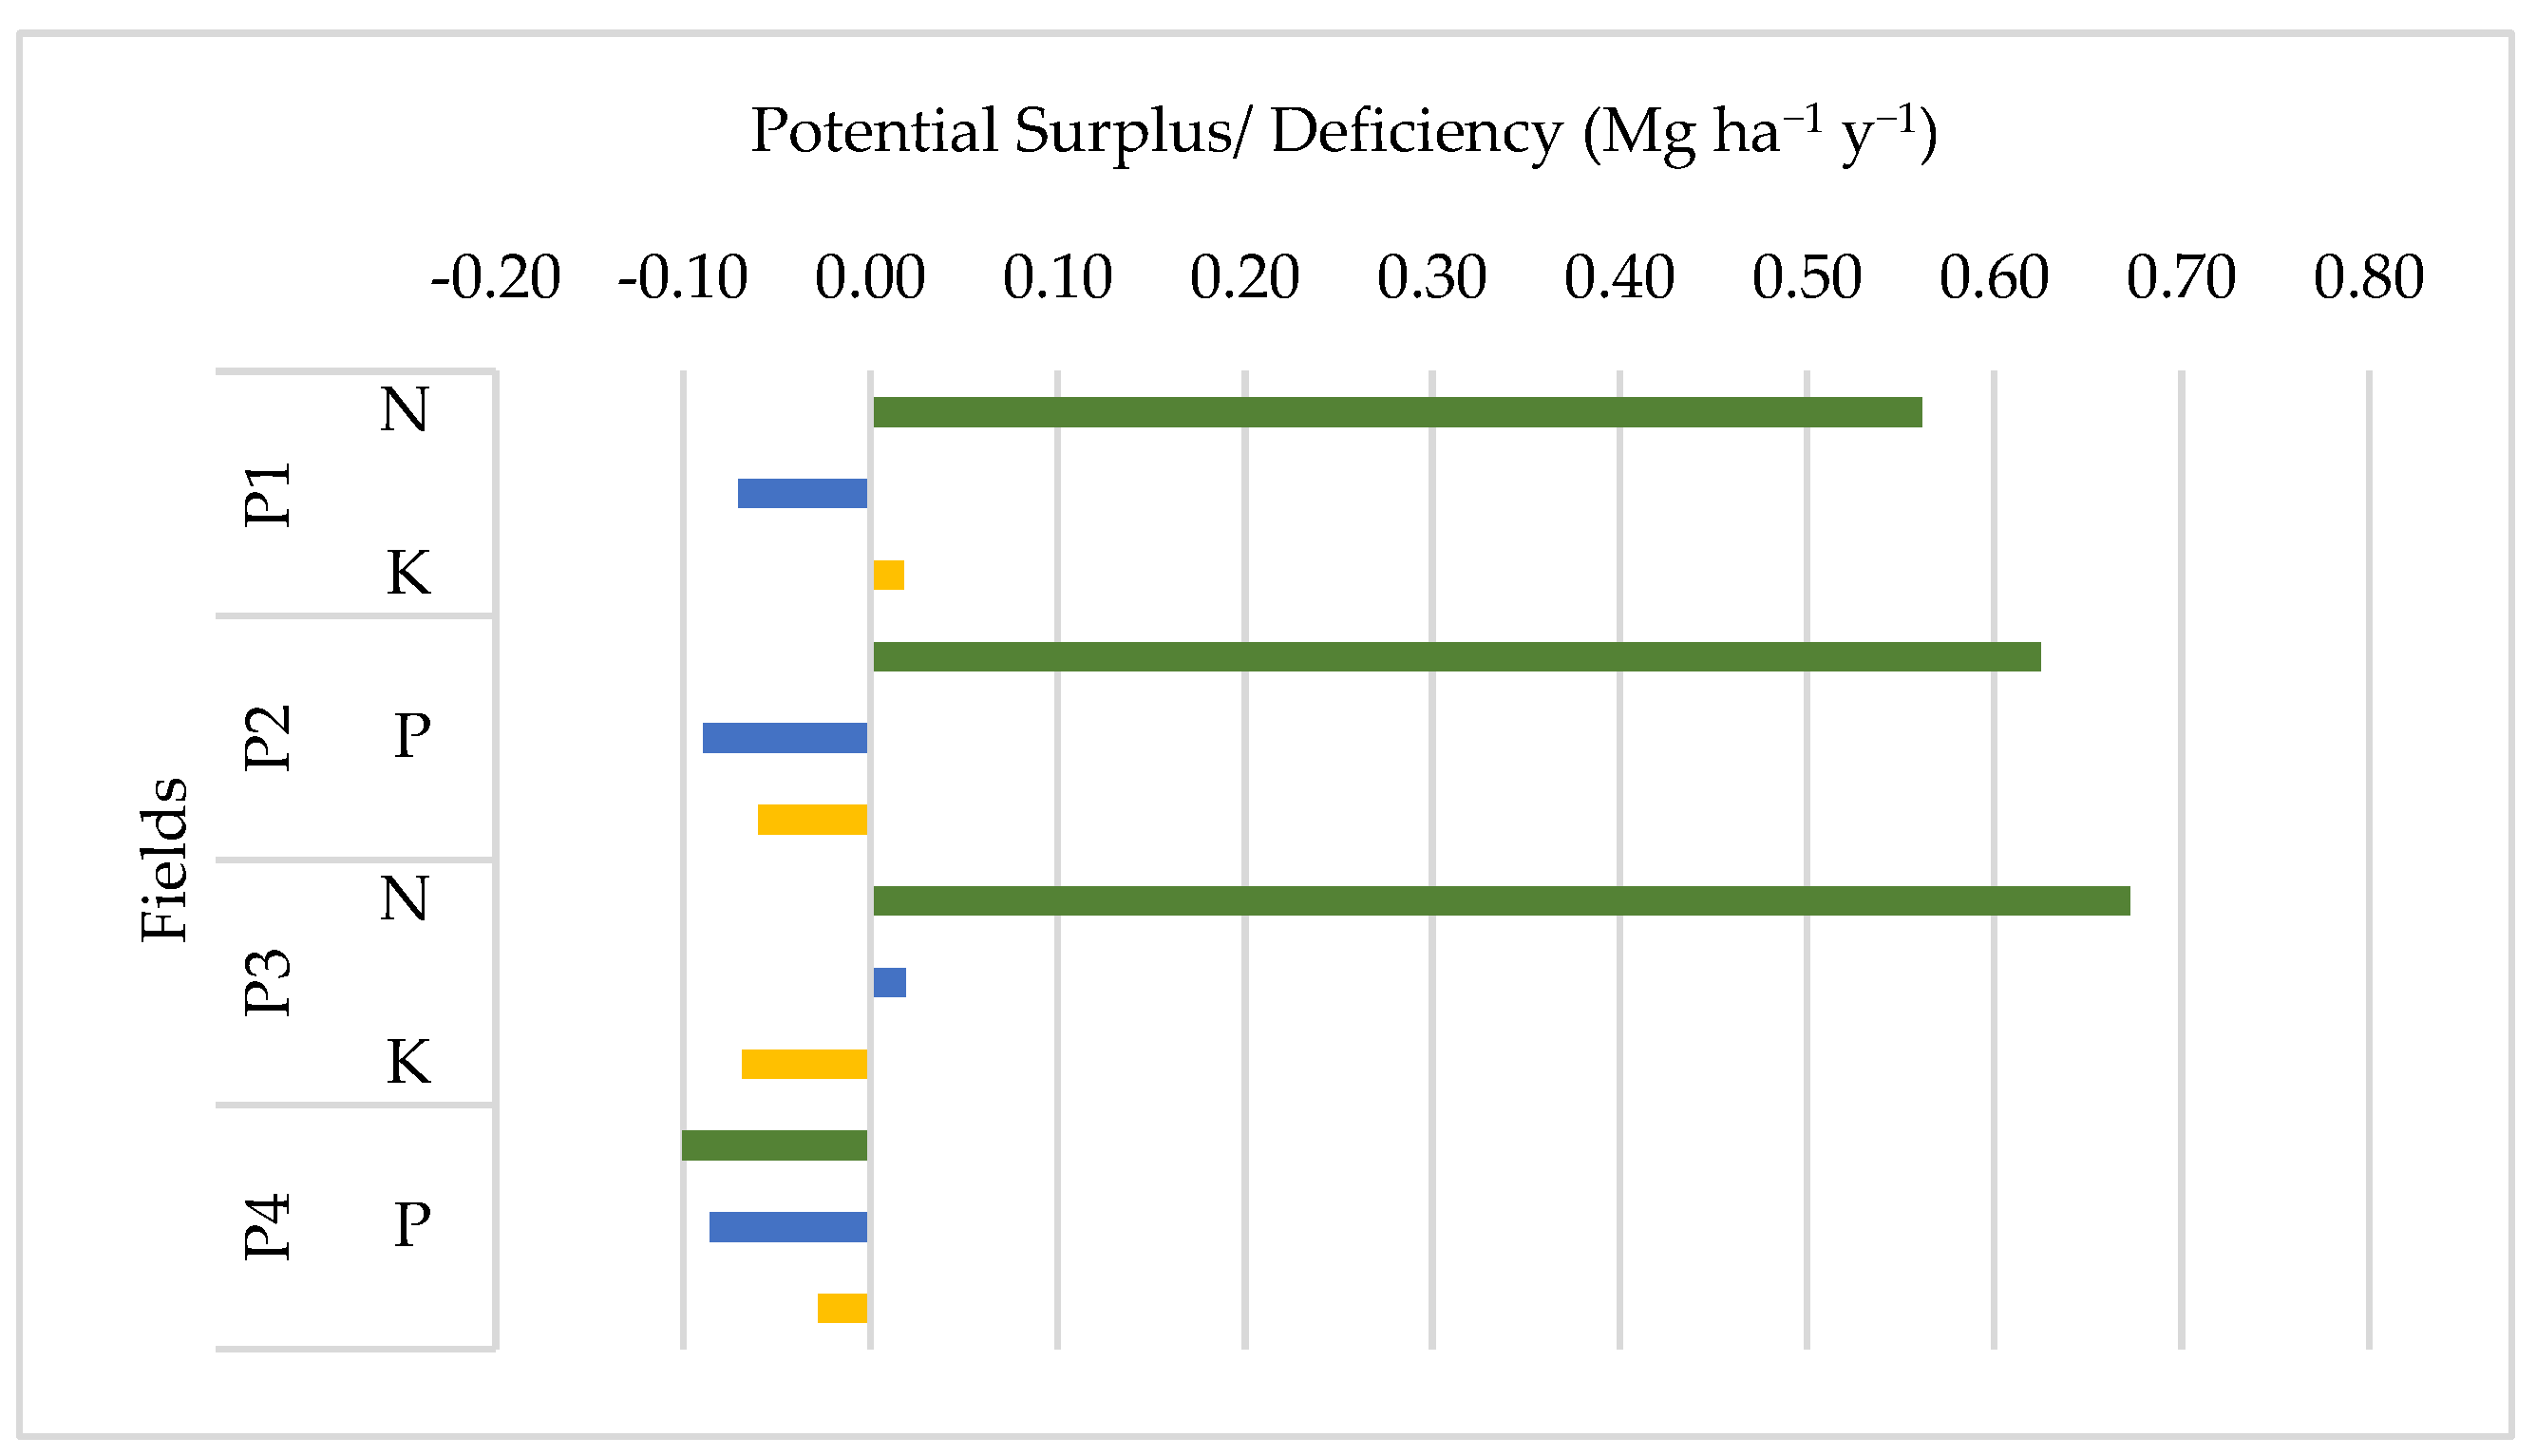
The soil organic C balance calculated for the different crop successions in the four fields of this study is presented in Figure 2.
Except for P3, all fields presented a negative SOC balance at the end of the two-year crop succession, indicating a loss of SOC from 2.84 to 4.91 Mg C ha−1 y−1 (Figure 2). Sunflower was associated with a positive SOC balance in P2, whereas P1 and P3 resulted in a negative SOC balance (Figure 2). Maize also showed opposite results in the SOC balance in P1 (second crop) and P3 (first crop). Both legumes, arrowleaf cover, and alfalfa, resulted in negative SOC balances.

3.5. NPK Balance

The NPK balance at the end of each crop succession is presented in Figure 3. A surplus of N was observed in all fields and crops, except for P4, which presented a negative N balance of 0.20 Mg N ha−1 after the second year of the alfalfa crop (Figure 3a). P deficiency was observed in all fields and crop successions, except for maize in P1 and P3, which led to a P surplus in both situations, irrespective of the sequence (Figure 3b). Finally, K presented a deficiency at the end of all crop successions, except in P1 (Figure 3c). Sunflower showed a K deficiency in P2 and P3, whereas maize presented K surplus in P1 and P3. At the end of the first year, alfalfa resulted in a K surplus, but the second year of this crop ended with a soil K deficiency. Arrowleaf clover (P2) and sunflower (P1) showed 6 kg K ha−1 y−1 difference between calculated and measured K (surplus and deficiency, respectively).
The NPK yearly surplus or deficiency in each field at the end of the two-year crop successions is presented in Figure 4. The results revealed a common pattern between fields and crop successions, with some few exceptions. The alfalfa–alfalfa succession (P4) presented an overall deficiency in all nutrients, ranging from 28 kg K ha−1 y−1, 86 kg P ha−1 y−1, and 101 kg N ha−1 y−1. The fields P1 and P3, although having the same crops (sunflower and maize), in a different sequence, showed a similar N surplus (562 and 673 kg N ha−1 y−1), but inverse behaviors in terms of P and K, Whereas in P1 (sunflower–maize) a deficiency of 71 kg P ha−1 y−1 was observed, in P3 (maize–sunflower), a surplus of 19 kg P ha−1 y−1 occurred. Conversely, P1 presented a surplus of 18 kg K ha−1 y−1, whereas in P3, a deficiency of 68 kg K ha−1 y−1 was observed (Figure 4). Finally, in P2, a surplus was observed only for N (625 kg N ha−1 y−1), whereas for P and K, both nutrients were deficient: 89 kg P ha−1 y−1 and 60 kg K ha−1 y−1, respectively. Except for N, the values of potential surplus/deficiency observed for all fields and remaining nutrients were below 89 kg ha−1 y−1, with K showing the lower values (Figure 4).

4. Discussion

Improvement in soil physical and chemical properties depends on several natural and anthropogenic factors, such as soil origin and characteristics, crops grown, agricultural practices, and residue management, as well as climatic conditions (mostly temperature and rainfall) [51]. Although this study was short term, the carbon and NPK balance results offer valuable insights for long-term management of irrigated arable crops. Similar trends were found between fields, irrespective of the crop succession and initial soil characteristics. In the present study, irrigation represented an important source of K, whereas N and P inputs were negligible.

4.1. Carbon Balance

The SOC balance obtained in this study reveals that only one of the fields (P3) presented C sequestration of about 0.14% y−1 (Table 4). This value is below the targeted yearly increase of 0.4% of SOC proposed by the “4 per 1000” initiative to mitigate CO2 emissions [52,53]. There was a decrease in soil SOC in the remaining three crop successions, ranging from 0.16 to 0.17% y−1. The decrease in SOC in all fields, except for the permanent pasture (alfalfa), could have resulted from the traditional tillage practices used, namely, deep ploughing with soil inversion. This tillage is usually performed at the onset of autumn, when the first rainfall occurs. The mean temperatures recorded at this stage, together with the soil disturbance, could have promoted the aeration of SOM and its oxidation, with the release of CO2 and leaching of soluble C. The effects on soil SOC decrease as a result of intense soil tillage were reported by several authors under Mediterranean conditions [5]. Sparse vegetation or bare soil over a period when most rainfall occurs (autumn and winter) can lead to significant soil and nutrient losses.
Management options to increase SOC in croplands include rotations, straw/stubble/residue incorporation, organic amendments, and reduced/minimum tillage [54], but the restoration of SOC level occurs much slower than its decline. Some authors demonstrated that the return of crop residues to the soil can increase soil C stocks across the soil profile, while the increase in N and P stocks was limited to topsoil (0–20 cm) [55].
When comparing cereal and oilseed crops (maize, sunflower) with legumes (alfalfa and arrow leaf clover), SOC increase was mostly related to the management practices and not to the crop species. Although legumes should provide both C and N substrate needed for C and N sequestration in the soil [16], the fact that both alfalfa and arrowleaf clover aboveground biomass were exported through the harvest, with very few inputs from mineral or organic fertilization, led to the C unbalance in the soil. On the other hand, in P2 and P3, after the first crop (sunflower and maize, respectively), the residues left after harvest from both crops (roots, stubble) showed a positive effect in C increase in the soil, which is in line with Liu et al. [56], that refers to the dependence of SOC accumulation in agroecosystems of the balance of biomass C inputs and C losses through mineralization, leaching, and erosion. In P3, the first crop (maize) remained unharvested until January 2019, which implied that the soil was covered during the heavy rainfall autumn/winter period. Therefore, it is possible that maize roots and canopy protected the soil against nutrient and soil losses from rainfall during this period. The belowground biomass and microbiome were possibly able to develop for an extended period, eventually promoting C stabilization. On top of that, the soil was ploughed in January, after maize harvest, when low temperatures may induce lower SOM mineralization, leading to potential SOC savings.

4.2. Nitrogen Balance

Except for P4 (alfalfa–alfalfa), all the fields presented a yearly N surplus after the two-year succession, which ranged from 562 to 673 kg N ha−1 y−1. The N fertilization, together with the N added through irrigation water, and soil tillage before sowing can influence the higher N availability in soil. In sunflower and maize, we should also consider the contribution of the mineralization of the crop residues, namely, the root biomass and the aboveground leaves and stalks left in the fields after harvest. In P3, a lower N surplus was observed for the first crop (maize), which can be related to the fact that harvest was carried out after the winter period, when most rainfall occurred, probably leading to an extended N consumption by the longest crop cycle and N losses by leaching.
In the legume succession (P4), a N surplus was observed after the first year, but at the end of the second year, there was a negative N balance. The establishment of the alfalfa crop in the first year (2018) was possible with a small application of N fertilizer (10 kg ha−1); nevertheless, the biomass renewal in the second season could not be supported only by the N irrigation water (3 kg N ha−1). As a result, a N deficiency at the end of the two years was observed. In the absence of N inputs by fertilizer and irrigation, the N symbiotic fixation seems to be insufficient to compensate for the N exported by the alfalfa cuts. Therefore, the results indicated that the use of symbiotic-N-fixing species in poor soils (under 1% of C) in Mediterranean conditions did not contribute to the increase in soil N fertility when managed with sequential biomass removal. Water, but especially nutrient availability, directly influenced legume growth, determining the lower amount of N2 fixed by the plants [15]. Panettieri et al. [5] did not observe an increase in soil N after crop rotation with legumes, confirming that there are several factors that influence the extent of the effects of legume crops in soil N availability. Examples are the N mobilization patterns between plant biomass and its removal at harvest, environmental factors that compromise N2 fixation, soil initial N content, crop needs, and rainfall distribution [5].
The values obtained for N surplus in the present study are much higher than those obtained by Billen et al. [57] in a three-year crop rotation under conventional tillage in the Paris basin. These authors referred to N surpluses of 40 kg N ha−1 y−1 and 100 kg N ha−1 y−1, whereas a nine-year organic rotation studied in the same region alternating cereal and legumes resulted in 21 kg N ha−1 y−1 balance. Higher N surplus was reported by Autret et al. [16] when testing several farming methods (conventional, low input, conservation agriculture and organic management), from 43 kg N ha−1 y−1 (low input) to 163 kg N ha−1 y−1 (conservation agriculture).
Some authors state that N surplus alone is not a good indicator of the N fate in agricultural systems, requiring complementary predictors of N losses and greenhouse gas emissions balance to obtain a true overview of the C and N environmental impacts of cropping systems [16]. The N surplus is considered an indicator of the N losses in arable fields [58], useful to compare management practices at annual time steps. N surplus can be a result of SOM mineralization but may also reflect a storage of soil organic N [16,33].
The high N surplus obtained in the present study raises concerns about the potential N losses, representing an economic and environmental cost. Conservation practices such as direct sowing and the application of organic or slow-release fertilizers could minimize N mineralization, increasing the C/N ratio and decreasing eventual N losses by leaching, volatilization, and ammonification. Moreover, N surplus must be calculated over a long enough period in order to properly characterize the long-term effect of a cropping system on the N fate in the soil–plant system [16].

4.3. Phosphorus Balance

The P balance was negative in all fields except for P3, which showed a P surplus of 19 kg ha−1 y−1 after maize–sunflower succession. When compared with the other fields, P3 showed both a higher initial soil P content and the highest P fertilization in the first crop (maize). At the end of the first year, there was a surplus of P (136 kg P ha−1) that was much reduced after the arrowleaf clover crop, which received very few P fertilizer. Soil P deficiency was observed in the sunflower crop, especially in the less fertile soils (with lower SOM) and with lower P fertilizer application.
With a very small application of P fertilizer, alfalfa crop succession resulted in soil P deficiency in both years, higher in the first year, when the root system developed. As a N-fixing plant, the symbiotic N fixation of alfalfa requires sufficient P supply; therefore, the improvement of soil moisture and P availability is vital for increasing alfalfa production [59]. Furthermore, the long-term application of N and P fertilizers causes soil acidification, which increases the available P level in calcareous soils [19].
Although soil P initial level was medium–high, there was an overall decrease in this nutrient after the two-year succession, beyond the estimated input–output balance. This could be a result of P fixation in soils, making it unavailable to plants, which is particularly frequent in calcareous and neutral soils [19]. In this case, agricultural practices such as reduced or no-tillage, crop rotation, stubble retention, and the use of biofertilizers could help to improve the availability of P through improvements in the phosphatase profile and activity in the soil [19].
The results obtained in this study are not totally in line with the estimated average P surplus obtained in a study conducted by Panagos et al. [32] in the EU soils including Portugal, alerting to a potential depletion of soil P in the medium term if rebalancing P fertilization strategies are not adopted in the future.

4.4. Potassium Balance

There was a yearly negative K balance for most crops, except for maize in both fields. This fact can be a consequence of the reduced or zero K inputs by mineral fertilization in the four fields, confirming the results from other studies with annual crop successions, where K fertilization counteracted soil K depletion [20,21]. Where K fertilization was performed (in maize crops), a K surplus was observed at the end of the crop cycle. Furthermore, the mineralization of sunflower residues in P1 could have provided K availability for the following crop (maize), also resulting in a K surplus. Sunflower exports about 70% of the absorbed K in the stem and capitulum [60]. Therefore, sunflower residues act as a K reservoir in the short term, quickly returning it to the soil, in a readily available form for uptake by crops [61].
Without significant K inputs, the deficiency observed at the end of the two-year succession can be a result of K fixation, since the soils in this study are of calcaric nature, thereby classified as “K-fixing soils”, according to several agronomic, mineralogical, physical, and chemical results [44]. In this case, K fertilization should consider higher application rates to compensate for soil-fixed K while facing crop needs.

4.5. Practical Implications

The lack of adoption of soil conservation practices will lead to C and nutrient soil depletion, irrespective of the crop successions. Growers should adopt soil conservation measures such as minimal tillage practices combined with interrow crops and perennial cover crops. Given the low SOM in Mediterranean soil, organic amendments are required. Forage management should include biomass retention, privileging grazing over forage harvest.

4.6. Study Limitations

This study was conducted in four different fields and soil types with different properties that might affect crop growth and nutrient dynamics differently. Regardless of this variability, the present study intended to focus on the effect of different crop successions and not to define the best succession for a specific type of soil.
Nutrient losses by volatilization, denitrification, and leaching were not quantified, which could impact the nutrient balance. Nutrient inputs from SOM are thought to be small since the studied soils presented low SOM content (<2%). Soil erosion by runoff is of particular concern in high-slope fields, which is not the case in the present study, since the topography corresponds to plains (slope < 5%).

5. Conclusions

Different crop management practices, allied to the intrinsic characteristics of the sequential crops, resulted in different SOC and NPK balances, but common trends can be drawn, namely, the overall negative impact on soil C, P, and K and the surplus of soil TN. These results seem to indicate that a shift of paradigm is needed to avoid further soil fertility degradation, minimizing environmental and economic impacts.
In Mediterranean conditions under irrigation, the maize–sunflower crop succession seems to be an interesting option. This crop succession seems to optimize the efficiency of resources (water, nutrients, carbon) and is also profitable for growers. The winter fallow period with bare soil contributes to soil and nutrient losses. Therefore, soil management practices, namely, minimal tillage, residue incorporation (stubble, straw), and permanent soil coverage with cover crops, should be adopted towards the increase in C sequestration and the improvement of soil quality.
The monitoring of soil quality should be considered when changes from rainfall-fed to irrigated crop systems occur, to assess and evaluate the impact of the strategies adopted and develop guidance and best practices to ensure agro-ecosystem management by sustainable soil use and protection.

Supplementary Materials

The following supporting information can be downloaded at: https://www.mdpi.com/article/10.3390/agriculture14111908/s1, Table S1. Dates of soil (initial and final), plant biomass, and water samplings carried out in the four fields (P1, P2, P3, and P4) and respective crops, in the 2018–2019 period; Table S2. Average values (± standard deviation) of soil physical and chemical characteristics for the topsoil (layer 0–20 cm) and sub-superficial layer (20–40 cm) in the four fields (P1, P2, P3, and P4) at the beginning of the experiment (2018): particle size fractions (coarse sand, fine sand, clay, and silt), cation exchange capacity (CEC) and pH; Table S3. Soil organic matter (g kg−1; mean ± standard deviation) in the topsoil (layer 0–20 cm) and sub-superficial layer (20–40 cm) in the four fields (P1, P2, P3, and P4) in the 2018–2019 period; Table S4. Soil nutrient content (mean ± standard deviation) in the topsoil (layer 0–20 cm) and sub-superficial layer (20–40 cm): total nitrogen (mg N h−1), phosphorus (mg P ha−1), and potassium (mg K ha−1) in the four fields (P1, P2, P3, and P4) in the 2018–2019 period. An average bulk density of 1300 kg m−3 was considered for the calculations; Table S5. Nutrient composition (mean ± standard deviation): nitrogen (N, g kg−1 DM), phosphorous (P, g kg−1 DM), and potassium (K, g kg−1 DM) of harvested biomass of crops in four fields with different crop successions (P1, P2, P3, and P4) in the period 2018–2019; Table S6. Protein (g kg−1 dry matter; mean ± standard deviation), composition of harvested crops in four fields with different crop successions (P1, P2, P3, and P4) in the period 2018–2019; Table S7. Macronutrient chemical composition of irrigation water (mean ± standard deviation): total nitrogen (TN, g m−3), phosphorus (P, g m−3), and potassium (K, g m−3) collected at the hydrants supplying the four fields from the study (P1, P2, P3, and P4) during the irrigation period of 2018 and 2019.

Author Contributions

Conceptualization, C.N. and P.P.; methodology, P.P. and A.T.; formal analysis, C.N. and J.S.; investigation, C.N., A.C., J.S., J.d.D., M.P., A.T. and P.P.; writing—original draft preparation, C.N.; writing—review and editing, C.N., J.S., A.T. and P.P.; visualization, C.N.; supervision, P.P.; project administration, P.P.; funding acquisition, P.P. All authors have read and agreed to the published version of the manuscript.

Funding

This work was cofinanced by the European Union through the European Regional Development Fund, under COMPETE 2020 (Competitiveness and Internationalization of the Operational Program) through Institute of Earth Sciences projects (ICT; UIDB/04683/2020) with the reference POCI-01-0145-FEDER-007690 and by the European Agricultural Fund for Rural Development through the FitoFarmGest Operational Group (PDR2020-101-030926). Adriana Catarino’s contributed to this work through her PhD grant 2023.04004.BD.

Institutional Review Board Statement

Not applicable.

Data Availability Statement

The original contributions presented in the study are included in the article/Supplementary Material, further inquiries can be directed to the corresponding author.

Conflicts of Interest

The authors declare no conflicts of interest.

References

  1. Adhikari, K.; Hartemink, A.E. Linking Soils to Ecosystem Services—A Global Review. Geoderma 2016, 262, 101–111. [Google Scholar] [CrossRef]
  2. Lehmann, J.; Bossio, D.A.; Kögel-Knabner, I.; Rillig, M.C. The Concept and Future Prospects of Soil Health. Nat. Rev. Earth Environ. 2020, 1, 544–553. [Google Scholar] [CrossRef] [PubMed]
  3. Olsson, L. Politics of Soils and Agriculture in a Warming World. In Regenerative Agriculture: What’s Missing? What Do We Still Need To Know? Springer: Berlin/Heidelberg, Germany, 2021; pp. 21–30. ISBN 978-3-030-72224-1. [Google Scholar]
  4. Lee, H.; Lautenbach, S.; Paula, A.; García-Nieto, A.; Bondeau, A.; Cramer, W.; Geijzendorffer, I.R. The Impact of Conservation Farming Practices on Mediterranean Agro-Ecosystem Services Provisioning-a Meta Analysis. Reg. Environ. Change 2019, 19, 2187–2202. [Google Scholar] [CrossRef]
  5. Panettieri, M.; de Sosa, L.L.; Domínguez, M.T.; Madejón, E. Long-Term Impacts of Conservation Tillage on Mediterranean Agricultural Soils: Shifts in Microbial Communities despite Limited Effects on Chemical Properties. Agric. Ecosyst. Environ. 2020, 304, 107144. [Google Scholar] [CrossRef]
  6. Stagnari, F.; Pagnani, G.; Galieni, A.; D’Egidio, S.; Matteucci, F.; Pisante, M. Effects of Conservation Agriculture Practices on Soil Quality Indicators: A Case-Study in a Wheat-Based Cropping Systems of Mediterranean Areas. Soil Sci. Plant Nutr. 2020, 66, 624–635. [Google Scholar] [CrossRef]
  7. Blanc, L.; Rezgui, F.; Hossard, L.; Lampurlanés, J.; Simon-Miquel, G.; Plaza-Bonilla, D. Performance of Co-Designed Diversified Mediterranean Cropping Systems: Hybridizing Stakeholders’ Knowledge and Modelling Data. Eur. J. Agron. 2024, 159, 127282. [Google Scholar] [CrossRef]
  8. Li, A.; Wu, Y.; Tai, X.; Cao, S.; Gao, T. Effects of Alfalfa Crop Rotation on Soil Nutrients and Loss of Soil and Nutrients in Semi-Arid Regions. Sustainability 2023, 15, 15164. [Google Scholar] [CrossRef]
  9. Cruz Colazo, J.; de Dios Herrero, J.; Sager, R.; Guzmán, M.L.; Zaman, M. Contribution of Integrated Crop Livestock Systems to Climate Smart Agriculture in Argentina. Land 2022, 11, 2060. [Google Scholar] [CrossRef]
  10. Ferreira, C.S.S.; Seifollahi-Aghmiuni, S.; Destouni, G.; Ghajarnia, N.; Kalantari, Z. Soil Degradation in the European Mediterranean Region: Processes, Status and Consequences. Sci. Total Environ. 2022, 805, 150106. [Google Scholar] [CrossRef]
  11. Crews, T.E.; Blesh, J.; Culman, S.W.; Hayes, R.C.; Jensen, E.S.; Mack, M.C.; Peoples, M.B.; Schipanski, M.E. Going Where No Grains Have Gone before: From Early to Mid-Succession. Agric. Ecosyst. Environ. 2016, 223, 223–238. [Google Scholar] [CrossRef]
  12. Harmanny, K.S.; Malek, Ž. Adaptations in Irrigated Agriculture in the Mediterranean Region: An Overview and Spatial Analysis of Implemented Strategies. Reg. Environ. Change 2019, 19, 1401–1416. [Google Scholar] [CrossRef] [PubMed]
  13. Instituto Nacional de Estatística, I.P. Estatísticas Agrícolas—2023; INE: Lisbon, Portugal, 2024; ISBN 978-989-25-0680-7. [Google Scholar]
  14. EDIA. Anuário Agrícola de Alqueva 2023; EDIA: Alqueva, Portugal, 2024. [Google Scholar]
  15. Anglade, J.; Billen, G.; Garnier, J. Relationships for Estimating N2 Fixation in Legumes: Incidence for N Balance of Legume-Based Cropping Systems in Europe. Ecosphere 2015, 6, art37. [Google Scholar] [CrossRef]
  16. Autret, B.; Beaudoin, N.; Rakotovololona, L.; Bertrand, M.; Grandeau, G.; Gréhan, E.; Ferchaud, F.; Mary, B. Can Alternative Cropping Systems Mitigate Nitrogen Losses and Improve GHG Balance? Results from a 19-Yr Experiment in Northern France. Geoderma 2019, 342, 20–33. [Google Scholar] [CrossRef]
  17. Poyda, A.; Levin, K.S.; Hülsbergen, K.-J.; Auerswald, K. Perennial Crops Can Compensate for Low Soil Carbon Inputs from Maize in Ley-Arable Systems. Plants 2023, 12, 29. [Google Scholar] [CrossRef] [PubMed]
  18. King, A.E.; Congreves, K.A.; Deen, B.; Dunfield, K.E.; Simpson, M.J.; Voroney, R.P.; Wagner-Riddle, C. Crop Rotations Differ in Soil Carbon Stabilization Efficiency, but the Response to Quality of Structural Plant Inputs Is Ambiguous. Plant Soil 2020, 457, 207–224. [Google Scholar] [CrossRef]
  19. Yang, M.; Yang, H. Utilization of Soil Residual Phosphorus and Internal Reuse of Phosphorus by Crops. PeerJ 2021, 9, e11704. [Google Scholar] [CrossRef]
  20. Zhao, S.; He, P.; Qiu, S.; Jia, L.; Liu, M.; Jin, J.; Johnston, A.M. Long-Term Effects of Potassium Fertilization and Straw Return on Soil Potassium Levels and Crop Yields in North-Central China. Field Crops Res. 2014, 169, 116–122. [Google Scholar] [CrossRef]
  21. Singh, V.K.; Dwivedi, B.S.; Yadvinder-Singh; Singh, S.K.; Mishra, R.P.; Shukla, A.K.; Rathore, S.S.; Shekhawat, K.; Majumdar, K.; Jat, M.L. Effect of Tillage and Crop Establishment, Residue Management and K Fertilization on Yield, K Use Efficiency and Apparent K Balance under Rice-Maize System in North-Western India. Field Crops Res. 2018, 224, 1–12. [Google Scholar] [CrossRef]
  22. IPMA Climate Normal—1981–2020-Beja. Available online: https://www.ipma.pt/en/oclima/normais.clima/1981-2010#562 (accessed on 30 July 2024).
  23. COTR SAGRA—Sistema Agrometeorológico Para a Gestão Da Rega No Alentejo. Available online: https://www.cotr.pt/servicos/sagra.php (accessed on 30 July 2024).
  24. IUSS Working Group. WRB World Reference Base for Soil Resources 2014; World Soil Resources Report; FAO: Rome, Italy, 2015; p. 203. [Google Scholar]
  25. Tomaz, A.; Costa, M.J.; Coutinho, J.; Dôres, J.; Catarino, A.; Martins, I.; Mourinha, C.; Guerreiro, I.; Pereira, M.M.; Fabião, M.; et al. Applying Risk Indices to Assess and Manage Soil Salinization and Sodification in Crop Fields within a Mediterranean Hydro-Agricultural Area. Water 2021, 13, 3070. [Google Scholar] [CrossRef]
  26. Varennes, A. De Produtividade Dos Solos e Ambiente (Productivity of Soils and Environment); Escolar Editora: Lisboa, Portugal, 2003; ISBN 972-592-156-9. [Google Scholar]
  27. Walkley, A.; Black, A. An Examination of the Degtjareff Method for Determining Soil Organic Matter, and a Proposed Modification of the Chromic Acid Titration Method. Soil Sci. 1934, 37, 29–38. [Google Scholar] [CrossRef]
  28. Kjeldahl, J.G.C.T. Neue Methode Zur Bestimmung Des Stickstoffs in Organischen Körpern. Z. Für Anal. Chem. 1883, 22, 366–382. [Google Scholar] [CrossRef]
  29. Egnér, H.; Riehm, H.; Domingo, W.R. Untersuchungen Über Die Chemische Bodenanalyse Als Grundlage Für Die Beurteilung Des Nährstoffzustandes Der Böden. II. Chemische Extraktionsmethoden Zur. Phosphor-Und Kaliumbestimmung. K. Lantbr. Ann. 1960, 26, 199–215. [Google Scholar]
  30. ISO 11277-2020; Soil Quality—Determination of Particle Size Distribution in Mineral Soil Material—Method by Sieving and Sedimentation. WTO: Geneva, Switzerland, 2020.
  31. ISO 11260:2018; Soil Quality – Determination of Effective Cation Exchange Capacity and Base Saturation Level Using Barium Chloride Solution. WTO: Geneva, Switzerland, 2018.
  32. APHA. Standard Methods for the Examination of Water and Wastewater; APHA: Washington, DC, USA, 1998. [Google Scholar]
  33. Pacheco, C.A.; Oliveira, A.; Tomaz, A. Effects of Mineral and Organic Fertilization on Forage Maize Yield, Soil Carbon Balance, and NPK Budgets, Under Rainfed Conditions in the Azores Islands (Portugal). Int. J. Plant Prod. 2023, 17, 463–475. [Google Scholar] [CrossRef]
  34. Pieri, L.; Ventura, F.; Vignudelli, M.; Rossi, P. Nitrogen Balance in a Hilly Semi-Agricultural Watershed in Northern Italy. Ital. J. Agron. 2011, 6, 12. [Google Scholar] [CrossRef]
  35. IBM Corp. IBM SPSS Statistics for Windows, Version 29.0.0.0 (241); IBM Corp.: Armonk, NY, USA, 2022. [Google Scholar]
  36. Tomaz, A.; Martins, I.; Catarino, A.; Mourinha, C.; Dôres, J.; Fabião, M.; Boteta, L.; Coutinho, J.; Patanita, M.; Palma, P. Insights into the Spatial and Temporal Variability of Soil Attributes in Irrigated Farm Fields and Correlations with Management Practices: A Multivariate Statistical Approach. Water 2022, 14, 3216. [Google Scholar] [CrossRef]
  37. Gomes, M.P.; Silva, A.A. Um Novo Diagrama Triangular Para a Classificação Básica Da Textura Do Solo. Garcia Da Orta 1962, 10, 171–179. [Google Scholar]
  38. Panagos, P.; De Rosa, D.; Liakos, L.; Labouyrie, M.; Borrelli, P.; Ballabio, C. Soil Bulk Density Assessment in Europe. Agric. Ecosyst. Environ. 2024, 364, 108907. [Google Scholar] [CrossRef]
  39. Van Bemmelen, J.M. Über Die Bestimmung Des Wassers, Des Humus, Des Schwefels, Der in Den Colloïdalen Silikaten Gebundenen Kieselsäure, Des Mangans u. s. w. Im Ackerboden. Die Landwirthschaftlichen Vers.-Station. 1890, 37, 279–290. [Google Scholar]
  40. Veloso, A.; Sempiterno, C.; Calouro, F.; Rebelo, F.; Pedra, F.; Castro, I.V.; Gonçalves, M.C.; Marcelo, M.E.; Pereira, P.; Fareleira, P.; et al. Manual de Fertilização das Culturas, 3rd ed.; INIAV: Lisboa, Portugal, 2022; ISBN 978-972-579-063-2. [Google Scholar]
  41. Tunesi, S.; Poggi, V.; Gessa, C. Phosphate Adsorption and Precipitation in Calcareous Soils: The Role of Calcium Ions in Solution and Carbonate Minerals. Nutr. Cycl. Agroecosyst. 1999, 53, 219–227. [Google Scholar] [CrossRef]
  42. Weil, R.R.; Brady, N.C. The Nature and Properties of Soils, 15th ed.; Prentice Hall: Upper Saddle River, NJ, USA, 2017; ISBN 978-0-13-325448-8. [Google Scholar]
  43. Chatterjee, D.; Datta, S.C.; Manjaiah, K.M. Fractions, Uptake and Fixation Capacity of Phosphorus and Potassium in Three Contrasting Soil Orders. J. Soil Sci. Plant Nutr. 2014, 14, 640–656. [Google Scholar] [CrossRef]
  44. Portela, E.; Abreu, M.M. Fixação do potássio nos solos portugueses. Rev. Ciênc. Agrárias. [CrossRef]
  45. Instituto Ricardo Jorge Tabela de Composição Dos Alimentos - INSA TCA V6.0 2023. Available online: https://portfir-insa.min-saude.pt/ (accessed on 28 May 2024).
  46. Martin, N.P.; Mertens, D.; Hatfield, R.; Jung, H. Alfalfa: Forage Crop of the Future. 2008. Available online: https://uknowledge.uky.edu/cgi/viewcontent.cgi?article=1072&context=ky_alfalfa (accessed on 28 May 2024).
  47. Lissbrant, S.; Berg, W.K.; Volenec, J.; Brouder, S.; Joern, B.; Cunningham, S.; Johnson, K. Phosphorus and Potassium Fertilization of Alfalfa. Purdue University Extension Bulletin, AY-331-W. 2009. Available online: https://www.extension.purdue.edu/extmedia/ay/ay-331-w.pdf (accessed on 10 March 2024).
  48. Pederson, G.A.; Brink, G.E.; Fairbrother, T.E. Nutrient Uptake in Plant Parts of Sixteen Forages Fertilized with Poultry Litter. Agron. J. 2002, 94, 895. [Google Scholar] [CrossRef]
  49. Moir, J.; Jordan, P.; Moot, D.; Lucas, D. Phosphorus Response and Optimum PH Ranges of Twelve Pasture Legumes Grown in an Acid Upland New Zealand Soil under Glasshouse Conditions. J. Soil Sci. Plant Nutr. 2016, 16, 438–460. [Google Scholar] [CrossRef]
  50. Diário da República 2 Série, 25. Available online: https://files.dre.pt/2s/2018/02/025000000/0413204170.pdf (accessed on 28 May 2024).
  51. Reicosky, D.C. Carbon Management in Conservation Agriculture Systems. In Regenerative Agriculture: What’s Missing? What Do We Still Need To Know? Springer: Berlin/Heidelberg, Germany, 2021; pp. 33–46. [Google Scholar]
  52. Rhodes, C.J. The 2015 Paris Climate Change Conference: Cop21. Sci. Prog. 2016, 99, 97–104. [Google Scholar] [CrossRef]
  53. Lal, R. Beyond COP 21: Potential and Challenges of the “4 per Thousand” Initiative. J. Soil Water Conserv. 2016, 71, 20A–25A. [Google Scholar] [CrossRef]
  54. Giannini, V.; Raimondi, G.; Toffanin, A.; Maucieri, C.; Borin, M. Agronomic Management Strategies to Increase Soil Organic Carbon in the Short-Term: Evidence from on-Farm Experimentation in the Veneto Region. Plant Soil 2023, 491, 561–574. [Google Scholar] [CrossRef]
  55. Liu, J.; Fang, L.; Qiu, T.; Chen, J.; Wang, H.; Liu, M.; Yi, J.; Zhang, H.; Wang, C.; Sardans, J.; et al. Crop Residue Return Achieves Environmental Mitigation and Enhances Grain Yield: A Global Meta-Analysis. Agron. Sustain. Dev. 2023, 43, 78. [Google Scholar] [CrossRef]
  56. Liu, X.; Herbert, S.J.; Hashemi, A.M.; Zhang, X.; Ding, G. Effects of Agricultural Management on Soil Organic Matter and Carbon Transformation—A Review. Plant Soil Environ. 2006, 52, 531–543. [Google Scholar] [CrossRef]
  57. Billen, G.; Garnier, J.; Benoit, M.; Juliette, A. The Nitrogen. Cascade in Arable Crop Areas of the North. of France. Cah. Agric. 2013, 22, 272–281. [Google Scholar] [CrossRef]
  58. Organisation for Economic Co-operation and Development. Environmental Indicators for Agriculture, 2nd ed.; OECD: Paris, France; Washington, DC, USA, 1997; ISBN 978-92-64-15315-8. [Google Scholar]
  59. Kong, M.; Kang, J.; Han, C.-L.; Gu, Y.-J.; Siddique, K.H.M.; Li, F.-M. Nitrogen, Phosphorus, and Potassium Resorption Responses of Alfalfa to Increasing Soil Water and P Availability in a Semi-Arid Environment. Agronomy 2020, 10, 310. [Google Scholar] [CrossRef]
  60. de Castro, C.; de Oliveira, F.A. Nutrição e Adubação do Girassol. In Girassol no Brasil; Embrapa Soja: Londrina, Brazil, 2005; pp. 317–373. [Google Scholar]
  61. Bossolani, J.W.; Meneghette, H.H.A.; Sanches, I.R.; Dos Santos, F.L.; Parra, L.F.; Lazarini, E. 5-Year Effects of Potassium Fertilization Levels on Nutrition Balance and Yield in the Maize/Soybean Succession. Commun. Soil Sci. Plant Anal. 2022, 53, 2017–2028. [Google Scholar] [CrossRef]
Figure 1. Monthly values for average temperature (Tav, °C) and precipitation (P, mm) in 2018 and 2019 [23].
Agriculture 14 01908 g001
Figure 2. Effect of crop succession on the yearly soil organic carbon balance (Mg ha−1 y−1) in the four fields (P1, P2, P3, and P4) in the period 2018–2019. An average bulk density of 1300 kg m−3 and an average layer depth of 20 cm were considered for the calculation of SOC in Mg ha−1.
Agriculture 14 01908 g002
Figure 3. Yearly nitrogen (a), phosphorus (b) and potassium (c) potential soil surplus or deficiency for the different crop successions (Mg ha−1 y−1) in the four fields (P1, P2, P3, and P4) during 2018 and 2019 in the 0–40 cm depth.
Agriculture 14 01908 g003
Figure 4. Nitrogen (N, Mg ha−1 y−1), phosphorous (P, Mg ha−1 y−1), and potassium (K, Mg ha−1 y−1) yearly potential surplus or deficiency after two years of different crop successions in four fields (P1, P2, P3, and P4).
Agriculture 14 01908 g004
Table 1. Crop successions and coordinates of the four fields (P1, P2, P3, and P4) used in the study during the 2018–2019 period.
FieldCrop 1 (2018)Crop 2 (2019)LatitudeLongitude
P1SunflowerMaize37°57′22.32″ N7°30′36.72″ W
P2SunflowerArrowleaf clover37°56′1.01″ N7°31′25.40″ W
P3MaizeSunflower37°58′22.99″ N7°33′26.61″ W
P4AlfalfaAlfalfa37°57′36.03″ N7°29′18.35″ W
Table 2. Sowing and harvest dates (dd/mm), crop cycle length (d), and yield (kg dry weight ha−1) in four fields (P1, P2, P3, and P4), in the 2018–2019 period (information provided by the farmers).
FieldYearCropSowing Date (dd/mm)Harvest (dd/mm)Cycle Length (d)Yield
(kg DW ha−1)
P12018Sunflower18/0427/081313226
2019Maize13/0617/111579853
P22018Sunflower27/0418/091433280
2019Arrowleaf clover3/0124/082331590
P32018Maize18/0717/01/191834851
2019Sunflower16/0515/091223156
P42018AlfalfaPermanent pasture3 to 4 cuts per yearPermanent pasture2376 (1)
2019Alfalfa
(1) Pluriannual forage (average cumulative DW of 4 cuts during each season).
Table 3. Irrigation period (start and end of irrigation in day/month) and volume (m3 ha−1), nitrogen (kg N ha−1), phosphorous (kg P2O5 ha−1), and potassium (kg K2O ha−1) fertilizer units applied by crop in four fields (P1, P2, P3, and P4), in the 2018–2019 period (information provided by the farmers).
FieldYearCropIrrigation Period
(dd/mm) *
Irrigation Volume
(m3 ha−1)
Fertilizer N
(kg N ha−1)
Fertilizer P
(kg P2O5 ha−1)
Fertilizer K (kg K2O ha−1)
P12018Sunflower19/04–1/082517127340
2019MaizeJune–September750025300
Total 10,017380340
P22018Sunflower28/04–26/0846061094012
2019Arrowleaf clover8/04–24/0615100880
Total 611610912812
P32018Maize18/07–4/104800202144216
2019Sunflower20/05–30/083570811920
Total 8370283163236
P42018AlfalfaMay–August400010100
2019Alfalfa4000000
Total 800010100
* When precise dates are not available for the start and end of irrigation, the irrigation period is referred to in months.
Table 4. Soil organic carbon (SOC) (g C kg−1) in the topsoil (layer 0–20 cm) and sub-superficial layer (20–40 cm) in the four fields (P1, P2, P3, and P4) and crops, in the 2018–2019 period. LS: level of significance.
Field/Crop SuccessionSoil LayerSoil Organic Carbon (g C kg−1)LS (2)
Crop1 StartCrop1 End/
Crop2 Start
Crop2 End
P1
Sunflower Maize
0–20 cm9.17 Aa6.99 Ab5.81 Ab***
20–40 cm9.91 Aa6.51 Ab5.67 Ab
LS (3)ns
P2
Sunflower Arrowleaf clover
0–20 cm7.42 Ab11.21 Aa4.09 b***
20–40 cm4.80 Ab10.72 Aa(1)
LS (3)ns
P3
Maize Sunflower
0–20 cm6.57 Ab11.08 Aa9.30 Aa***
20–40 cm4.78 Ab9.74 Aa8.74 Aa
LS (3)ns
P4
Alfalfa Alfalfa
0–20 cm8.39 Aa8.70 Aa5.15 Ab***
20–40 cm6.16 Ba5.32 Ba2.46 Bb
LS (3)***
(1) Data not collected. (2) Identical lower-case letters in the same row do not differ significantly between sampling dates for both soil depths (Bonferroni test, α = 0.05). ***: very significant (p < 0.001). (3) Identical upper-case letters in the same column do not differ significantly between soil layers for each field and sampling date (Bonferroni test, α = 0.05). ns: nonsignificant (p > 0.05); ***: highly significant (p < 0.001).
Table 5. Soil chemical composition in the topsoil (layer 0–20 cm) and sub-superficial layer (20–40 cm): total nitrogen (TN, mg kg−1), extractable phosphorous (P2O5, mg kg−1), and potassium (K2O, mg kg−1) in the four fields (P1, P2, P3, and P4), in the 2018–2019 period. LS: level of significance.
Field/Crop SuccessionNutrientSoil LayerCrop1 StartCrop1 End/
Crop2 Start
Crop2 EndLS (2)
P1
Sunflower Maize
TN
(mg kg−1)
0–20 cm789.33 Ab859.56 Ab1033.00 Aa***
20–40 cm694.56 Bb780.67 Bb988.22 Ba
LS (3)***
P2O5
(mg kg−1)
0–20 cm248.62 Aa124.45 Ab148.57 Ab***
20–40 cm144.85 Ba106.20 Ba123.12 Bans
LS (3)***
K2O
(mg kg−1)
0–20 cm115.07 Aa106.57 Aa94.98 Aans
20–40 cm94.82 Aa96.99 Aa86.27 Aa
LS (3)ns
P2
Sunflower Arrowleaf clover
TN
(g kg−1)
0–20 cm608.22 Ab731.11 Aa775.67 a***
20–40 cm489.33 Bb674.33 Ba(1)
LS (3)***
P2O5
(mg kg−1)
0–20 cm221.34 Aa143.64 Ab115.81 b***
20–40 cm131.13 Ba84.18 Bb(1)***
LS (3)***
K2O
(mg kg−1)
0–20 cm206.59 Aa149.26 Ab143.22 b***
20–40 cm140.34 Ba139.38 Aa(1)ns
LS (3)***ns
P3
Maize Sunflower
TN
(g kg−1)
0–20 cm794.25 Ab793.25 Ab1049.42 Aa***
20–40 cm571.25 Bb702.92 Bb917.50 Ba
LS (3)***
P2O5
(mg kg−1)
0–20 cm228.30 Aa335.12 Aa235.23 Aans
20–40 cm118.35 Bb186.79 Ba197.35 Ba***
LS (3)***
K2O
(mg kg−1)
0–20 cm236.78 Ab367.04 Aa226.28 Ab***
20–40 cm150.23 Ba182.76 Ba195.35 Aans
LS (3)******ns
P4
Alfalfa Alfalfa
Total N
(g kg−1)
0–20 cm908.53 Aa1001.73 Aa850.87 Aans
20–40 cm703.40 Ba682.53 Ba598.47 Ba
LS (3)***
P2O5
(mg kg−1)
0–20 cm228.81 Aa195.62 Aab162.83 Ab**
20–40 cm163.30 Ba76.50 Bb76.27 Bb***
LS (3)***
K2O
(mg kg−1)
0–20 cm161.23 Aa166.49 Aa119.73 Ab***
20–40 cm134.99 Aa116.92 Bab98.42 Bb*
LS (3)ns****
(1) Data not collected. (2) Identical lower-case letters in the same row do not differ significantly between sampling dates for each or both two soil depths (0–20 cm and 20–40 cm) (Bonferroni test, α = 0.05). ns: nonsignificant (p > 0.05); *: significant (p < 0.05); **: very significant (p < 0.01); ***: highly significant (p < 0.001). (3) Identical upper-case letters in the same column do not differ significantly between soil layers for each field and sampling date (Bonferroni test, α = 0.05). ns: nonsignificant (p > 0.05); *: significant (p < 0.05); **: very significant (p < 0.01); ***: highly significant (p < 0.001).
Table 6. C/N ratio evolution is the soil profile (0–40 cm) in the four fields (P1, P2, P3, and P4), in the 2018–2019 period. LS: level of significance.
Field/Crop SuccessionCrop1 StartCrop1 End/
Crop2 Start
Crop2 EndLS (1)
P1
Sunflower Maize
13.15 Aa8.36 Bb5.67 Bc***
P2
Sunflower Arrowleaf clover
11.38 Ab15.40 Aa5.14 Bc**
P3
Maize Sunflower
8.27 Bb13.93 Aa9.43 Ab***
P4
Alfalfa Alfalfa
8.83 Ba8.29 Ba5.71 Bb***
LS (2)*********
(1) Identical lower-case letters in the same row do not differ significantly between sampling dates for each field (Bonferroni test, α = 0.05). **: very significant (p < 0.01); ***: highly significant (p < 0.001). (2) Identical upper-case letters in the same column do not differ significantly between fields for all sampling dates (Bonferroni test, α = 0.05). ***: highly significant (p < 0.001).
Table 7. Nutrient extraction (mean ± standard deviation): nitrogen (N, kg ha−1), phosphorous (P, kg ha−1), and potassium (K, kg ha−1) extracted by harvested biomass of crops in four fields with different crops successions (P1, P2, P3, and P4), in the period 2018–2019.
FieldYearCropN (kg ha−1)P (kg ha−1)K (kg ha−1)
P12018Sunflower (1)79.27 ± 3.291.44 ± 0.1923.72 ± 3.83
2019Maize (1)53.15 ± 0.4412.13 ± 1.23137.30 ± 6.15
Total 132.4213.57161.02
P22018Sunflower (1)93.07 ± 6.552.89 ± 0.2337.34 ± 2.65
2019Arrowleaf clover (1)74.18 ± 2.558.04 ± 1.2120.53 ± 1.35
Total 167.2510.9357.87
P32018Maize (1)56.19 ± 3.341.31 ± 0.1217.28 ± 2.34
2019Sunflower (1)20.20 ± 0.0510.62 ± 1.8518.19 ± 1.68
Total 76.3911.9335.47
P42018Alfalfa (2)98.59 ± 11.780.88 ± 0.1587.93 ± 7.39
2019Alfalfa (2)70.52 ± 8.064.78 ± 0.8143.10 ± 8.46
Total 169.115.66131.03
(1) Seeds. (2) Aboveground plant: stems, leaves, and flowers.
Table 8. Quantities (mean ± standard deviation) of total nitrogen (TN, kg ha−1), phosphorous (P, kg ha−1), and potassium (K, kg ha−1) supplied by irrigation water in four fields with different crop successions (P1, P2, P3, and P4) during the global irrigation period in 2018 and 2019.
FieldYearCropTN (kg ha−1)P (kg ha−1)K (kg ha−1)
P12018Sunflower4.60 ± 0.060.26 ± 0.0215.51 ± 0.28
2019Maize12.94 ± 0.800.71 ± 0.0548.03 ± 0.43
Total 17.540.9763.54
P22018Sunflower4.93 ± 0.090.63 ± 0.0327.22 ± 0.00
2019Arrowleaf clover0.92 ± 020.05 ± 0.008.80 ± 0.09
Total 5.850.6836.02
P32018Maize6.30 ± 0.100.80 ± 0.0328.98 ± 0.53
2019Sunflower2.50 ± 0.050.11 ± 0.0020.80 ± 0.41
Total 8.800.9149.78
P42018Alfalfa1.67 ± 0.020.17 ± 0.059.31 ± 0.17
2019Alfalfa0.98 ± 0.060.05 ± 0.008.90 ± 0.09
Total 2.650.2218.21
Disclaimer/Publisher’s Note: The statements, opinions and data contained in all publications are solely those of the individual author(s) and contributor(s) and not of MDPI and/or the editor(s). MDPI and/or the editor(s) disclaim responsibility for any injury to people or property resulting from any ideas, methods, instructions or products referred to in the content.

