Article

Combining UAV Multispectral and Thermal Infrared Data for Maize Growth Parameter Estimation

1
Key Laboratory of Agricultural Soil and Water Engineering in Arid and Semiarid Areas, Ministry of Education, Northwest A&F University, Yangling 712100, China
2
College of Water Resources and Architectural Engineering, Northwest A&F University, Yangling 712100, China
*
Author to whom correspondence should be addressed.
Agriculture 2024, 14(11), 2004; https://doi.org/10.3390/agriculture14112004
Submission received: 22 October 2024 / Revised: 4 November 2024 / Accepted: 6 November 2024 / Published: 7 November 2024
(This article belongs to the Section Digital Agriculture)

Abstract

:
The leaf area index (LAI) and leaf chlorophyll content (LCC) are key indicators of crop photosynthetic efficiency and nitrogen status. This study explores the integration of UAV-based multispectral (MS) and thermal infrared (TIR) data to improve the estimation of maize LAI and LCC across different growth stages, aiming to enhance nitrogen (N) management. In field trials from 2022 to 2023, UAVs captured canopy images of maize under varied water and nitrogen treatments, while the LAI and LCC were measured. Estimation models, including partial least squares regression (PLS), convolutional neural networks (CNNs), and random forest (RF), were developed using spectral, thermal, and textural data. The results showed that MS data (spectral and textural features) had strong correlations with the LAI and LCC, and CNN models yielded accurate estimates (LAI: R2 = 0.61–0.79, RMSE = 0.02–0.38; LCC: R2 = 0.63–0.78, RMSE = 2.24–0.39 μg/cm2). Thermal data reflected maize growth but had limitations in estimating the LAI and LCC. Combining MS and TIR data significantly improved the estimation accuracy, increasing R2 values for the LAI and LCC by up to 23.06% and 19.01%, respectively. Nitrogen dilution curves using estimated LAIs effectively diagnosed crop N status. Deficit irrigation reduced the N uptake, intensifying the N deficiency, while proper water and N management enhanced the LAI and LCC.

1. Introduction

Nitrogen (N) is a major component of chlorophyll and an essential element for photosynthesis in plants, which plays a crucial role in promoting crop growth, biomass accumulation, and yield formation [1,2]. When the efficiency of N fertilizer application is low, an appropriate increase in N levels can significantly boost crop yields [3,4]. However, excessive or improper amounts of N fertilizer may not only delay crop senescence and reduce N utilization efficiency but also lead to severe environmental pollution [5,6]. Therefore, it is crucial to accurately assess the nitrogen nutritional status of crops to determine the optimal rate and timing of fertilizer application. The effective management of nitrogen levels ensures not only high crop yields but also improves the N use efficiency and promotes environmental sustainability [7,8].
Precisely evaluating the nitrogen nutritional status of maize is crucial for optimizing the nitrogen fertilizer management throughout its growth stages. Crop N status is usually diagnosed by relying on a N dilution curve (Nc = aW−b, a, b are parameters). This curve serves as a tool for analyzing the changes in nitrogen concentration during biomass accumulation, revealing the dynamic relationship between a plant’s nitrogen demand and its allocation at different growth stages. Specifically, as the biomass increases, the nitrogen concentration generally decreases. This phenomenon indicates that plants require a higher nitrogen concentration during early growth to support metabolism and cell division, but as the biomass accumulates, their relative nitrogen demand decreases, primarily because more nutrients are allocated to structural and storage tissue development. Therefore, the nitrogen dilution curve not only reflects the efficiency of the nutrient utilization during plant growth but also provides an important theoretical basis for agricultural management and plant growth regulation. Since the concept of the critical nitrogen dilution curve was introduced in 1984 [9], researchers have conducted extensive research and developed nitrogen dilution curves for major crops like wheat [3,10], rice [11,12], and maize [5,13], achieving good fitting results. Moreover, critical nitrogen dilution curves have been established based on various plant organs such as leaves, stems, and ear [14,15,16]. However, these biomasses are derived by destructive sampling from representative points, which is laborious, time consuming, and inconsistent with the spatial variability in crop N status [17]. The LAI is a critical parameter in crop growth analysis as it provides insights into the canopy structure and photosynthetic efficiency, both directly linked to biomass production. The biomass accumulation in crops occurs mainly through photosynthesis, which is significantly influenced by the canopy leaf characteristics such as leaf area and photosynthetic rate [18,19,20]. Studies have shown that in wheat and maize, leaf growth and photosynthesis are the dominant factors in biomass accumulation [13,21]. The regulatory effect of the N status on the LAI is similar to its effect on the biomass, and the process of N absorption and allocation in plants is influenced by leaf area expansion [22,23]. Therefore, the LAI can be considered as an alternative method to estimate the maize N status.
As one of the essential macronutrients for crop growth, N significantly affects the crop phenotype and physiological status at different application rates [24,25]. The traditional methods for assessing the crop N status primarily involve field surveys, sampling, and laboratory-based biochemical analysis of the collected samples. However, these methods are often lagging, destructive, and non-dynamic. Further, due to the limitations in the physical and chemical analysis conditions, only the leaves and stems of the crops can be selected for analysis, and this “point-to-surface” approach often differs considerably from the actual N nutritional status of the crops, making it challenging to accurately represent the total nitrogen levels of crops in a field. Remote sensing, as a fast, real-time, reliable, and non-destructive large-scale monitoring technology, has been widely applied to estimate the crop N status [26,27,28,29]. Furthermore, numerous studies have shown a significant correlation between the N concentration and photosynthetic activity [29,30]. For example, Gitelson et al. [31,32] reported a strong correlation between the dry matter and chlorophyll content in maize and soybean, highlighting that chlorophyll monitoring provides critical information about the crop N status. Most N in leaves is allocated to the components associated with photosynthesis, particularly in C3 plants, where 75–80% of the total N is found in chloroplast proteins [33]. Evans [34,35] demonstrated that the variations in leaf N content led to changes in thylakoid pigment–protein complexes, which are primarily composed of chlorophyll. Lu et al. [36] identified a significant relationship between the chlorophyll content and N levels in maize leaves. Furthermore, many vegetation indices (Vis) used to estimate the leaf N content operate in the visible and near-infrared regions, where chlorophyll serves as the primary absorber [37,38]. Given the close link between chlorophyll and N concentrations, indirect remote sensing methods for estimating the chlorophyll content can effectively diagnose the N status.
Numerous methods have been developed for the remote sensing estimation of the leaf chlorophyll content (LCC) [39,40]. Techniques based on crop canopy spectral information and Vis extracted from UAV imagery have gained widespread application due to their simplicity and robustness [38]. However, in the early or late stages of crop growth, spectral or Vis-based methods often become inefficient due to the substantial soil background interference or high canopy biomass [41,42]. Recent studies indicated that the integration of spectral information, textural information, and thermal features from remote sensing images has the potential to improve the crop trait estimation in agricultural applications, especially in dense and heterogeneous canopies [43,44]. Textural information can describe the structure and geometric characteristics of crop canopies, helping to suppress the effects of highly saturated canopies [45]. The fusion of canopy textural and spectral information has been reported to enhance the estimation of plant traits such as the LAI [41,46], LCC [40,47], and crop N content [16,48]. Furthermore, combining canopy thermal and spectral information has been proved to improve the accuracy of crop biomass and yield predictions [43,49]. This is because the leaf temperature not only affects the photosynthetic capacity, but also reflects the nutritional status of the leaves. However, compared to spectral information, fewer studies have explored the application of thermal information in predicting the LAI and LCC. In particular, studies combining canopy thermal, spectral, and textural information for crop N diagnosis remain limited [10,50].
The objectives of this study were as follows: (i) to compare the accuracy of estimating maize LAI and LCC at different growth stages using UAV-based MS and TIR data; (ii) to evaluate the performance of machine learning models and explore the potential of combining MS and TIR information for estimating the LAI and LCC; and (iii) to assess the effectiveness of indirectly diagnosing the crop N status based on remote-sensing-estimated LAIs and LCCs.

2. Materials and Methods

2.1. Study Area and Experimental Design

The field experiment was conducted from June 2022 to October 2023 in the Agricultural Demonstration Zone of Wugong County, Shaanxi Province, China (34°21′ N, 108°03′ E). The study area is characterized by a semi-arid to semi-humid climate typical of the northwestern region, with an average annual precipitation of approximately 635 mm, primarily occurring from July to September. During the experiment, the average temperature was about 33 °C. The soil type in the study area is clay loam, with a field capacity ranging from 23% to 26% in the 0–100 cm soil layer, and a wilting point of 8.6%. The dry bulk density of the soil is 1.44 g/cm3, with a pH value of 8.14. The groundwater table is relatively deep, with negligible upward recharge.
The experiment included 3 water treatments: rainfed (W0), deficit irrigation (W1: 60–70% field capacity), and full irrigation (W2: 90–100% field capacity). Moreover, 6 nitrogen treatments were applied: N1 (0 kg N/ha), N2 (80), N3 (160), N4 (240), N5 (320), and N6 (400 kg N/ha). Nitrogen fertilizer was applied in two equal parts during the growing season: 50% at seeding and 50% at jointing. Phosphorus and potassium fertilizers were managed according to the local standards. Each treatment was replicated three times, resulting in a total of 54 experimental plots. The layout of the experimental field is shown in Figure 1a.

2.2. Data Acquisition

2.2.1. Acquisition and Processing of UAV Images

During the 2022 and 2023 growing seasons, measurements of the LAI and LCC were conducted at various growth stages of maize, along with the collection of multispectral and thermal infrared images from UAVs. The observation dates covered the key growth stages from the seedling stage to the late grain-filling stage, primarily concentrated between July and September. The planting and sampling dates were similar across both years, providing a consistent timeframe for the experiment. Specifically, in 2022, six sampling events were conducted on 8 July, 15 July, 24 July, 1 August, 10 August, and 14 September; in 2023, six sampling events were conducted on 15 July, 28 July, 5 August, 12 August, 18 August, and 17 September. A total of 12 observations across both years covered different growth stages, providing a robust dataset for analyzing the maize growth characteristics (Figure 1b).
Multispectral images were captured using a DJI P4 Multispectral UAV (DJI Technology Company Ltd., Shenzhen, China), which is equipped with six 1/2.9-inch CMOS sensors, including one RGB sensor for visible light imaging and five monochrome sensors for multispectral imaging with central wavelengths of 450 nm (blue), 560 nm (green), 650 nm (red), 730 nm (red edge), and 840 nm (near-infrared). The altitude of the UAV was set to 20 m with head and parallax overlap rates of 75% and 80%, respectively, and the lens acquired images vertically downwards with a ground resolution of 1.1 cm/pixel.
Thermal infrared images were collected using a DJI MAVIC 3T UAV equipped with a 1/2-inch sensor and thermal imaging camera operating in the TIR wavelength range of 8 μm to 14 μm, with a temperature measurement range of −20 °C to 150 °C. The UAV was flown at an altitude of 15 m, with a heading and paracentric overlap of 70% and 80%, respectively, and the lens was oriented vertically to acquire images with a ground resolution of 1.98 cm/pixel. To prevent image drift, 8 ground control points (GCPs) were established, and their coordinates were measured using a consumer-grade global positioning system (GPS).
The collected MS images were processed using Pix4D Mapper and ENVI 5.3 software for mosaicking and radiometric correction. The digital number (DN) values of the raw images were converted to reflectance values. The reflectance was extracted by delineating the different regions of interest (ROI). Simultaneously with the TIR image acquisition, a handheld thermal infrared thermometer was used to measure the leaf temperature of maize and water temperature in the experimental plots for calibration purposes. The collected thermal infrared images were processed using Python scripts that called the TSDK program, which batch-converted R_JPEG photos into TIF files containing temperature information. This program allowed the adjustment of the parameters related to the imaging targets by inputting the temperature and humidity data from the farm’s weather station, the emissivity of the objects, and the distance to the objects. The measured water temperature and leaf temperature were used as reference temperatures to validate the TIR image temperatures.

2.2.2. Field and Experimental Data Acquisition

Ground data, including the LAI and fresh leaves, were collected while acquiring the UAV images. The LAI of the maize canopy was measured using a LAI-2200C canopy analyzer (LI-COR, Lincoln, NE, USA). To avoid direct sunlight interference, the measurements were taken in the afternoon from 4:00 PM to 6:00 PM. Five measurement points were established in each experimental plot, and the average value was used as the LAI for the plot. Meanwhile, 6 maize leaves were selected in each plot for destructive sampling and part of them was placed in sample bags and dried in an oven at 80 °C to a constant weight, then grinded and sieved for determining the N concentration of the leaves using the Kjeldahl method. Another portion of the sample was used for the measurement of the chlorophyll concentration, 1 cm2 of fresh maize leaves were punched into a test tube of 95% ethanol, decolorized under light protection until the leaf tissue turned white, filtered and fixed at 25 mL, followed by pouring the chloroplast pigment extracts into quartz cuvettes with an optical diameter of 1 cm. The absorbance was measured at the wavelengths of 665 nm and 649 nm using 95% ethanol as a blank to calculate the LCC [15,51]

2.2.3. Theoretical Framework for Constructing N Curves Based on the LAI and Biomass

The LAI is a critical parameter that influences the photosynthetic capacity and, consequently, biomass accumulation. The maize N status and LAI expansion exhibit a nearly proportional relationship [13]. Similar to the relationship between the biomass and N, the allometric relationship between the crop LAI and N under different N treatments is stable [52]. The N status of crops can be described using N dilution curves and the nitrogen nutrition index (NNI). Studies by Lemaire et al. [9] and Sheehy et al. [11] have shown that a decline in the crop N concentration is related to the biomass accumulation/LAI, regardless of the annual climate conditions, species, or genotypes. The nitrogen dilution curve represents the decreasing N concentration in plant tissues as the biomass accumulates. The NNI is calculated as the ratio of the actual N concentration to the critical N concentration, providing a measure of the N sufficiency.
Nc = aLAI−b
NNI = Na/Nc
where the LAI is the leaf area index, a is the critical N concentration when the maize LAI reaches 1, b is the coefficient, Na is the actual measured N concentration, and Nc is the critical N concentration. If the NNI = 1, the N nutritional status was considered to be optimum, while a NNI > 1 and a NNI < 1 indicated excess and deficient N nutrition, respectively.
Remote sensing estimation of the LAI is more convenient than experimental measurements, and numerous studies have demonstrated that diagnosing the crop N status through the empirical relationship between the LAI and remote sensing is feasible [6,53,54]. Therefore, this study established a NNI based on remote-sensing-estimated LAIs to diagnose the crop N status.

2.3. Information Extraction

2.3.1. Canopy Spectral Information Extraction

The normalized difference vegetation index (NDVI) was used to eliminate the influence of the soil background on the spectral information due to the different reflectance thresholds between the soil and vegetation. Matlab was then employed to extract the canopy reflectance from different treatment plots. To explore the spectral response of the maize LAI and LCC under various water and nitrogen treatments, 10 vegetation indices (VIs) were selected and calculated based on the UAV images (Table 1). In this work, Pearson’s correlation coefficient was used to assess the correlation between the different indices and the LAI and LCC. The closer the absolute value of r is to 1, the stronger the correlation. The level of significance (p-value) was judged by using the F-test, where the correlation is significant (*) at p < 0.05, highly significant (**) at p < 0.01, and particularly significant (***) at p < 0.001.

2.3.2. Canopy Temperature Information

Based on the UAV thermal infrared temperature information, the normalized relative canopy temperature (NRCT) was calculated following the methodology described by Maimaitijiang et al. [43]. The NRCT, as a thermal feature, is used to estimate the LAI and LCC, and it functions similarly to the crop water stress index (CWSI) [54]. The formula for calculating the NRCT is as follows:
N R C T = T i T min T max T min
where Ti is the temperature of the i pixel in the subsample image, Tmax is the maximum temperature in the entire field experiment, and Tmin is the minimum temperature in the entire field experiment.

2.3.3. Canopy Textural Information

The textural features of the UAV images were calculated based on the Grey Level Covariance Matrix (GLCM) to evaluate their potential in the N diagnosis. The 8 textural features were calculated using ENVI 5.3 software, including Mean (MEA), Variance (VAR), Homogeneity (HOM), Contrast (CON), Dissimilarity (DIS), Entropy (ENT), Second Moment (SEC), and Correlation (COR). The detailed methods can be accessed in Lang et al. [61]. In this study, the correlations between the textural features of MS and TIR images at all growth stages of maize and the LAI and LCC were analyzed. To minimize the impact of the angle on the textural features, a window size of 3 × 3 and an interval of 1 were used, and the average values from four directions were calculated.

2.3.4. Model Construction and Validation

A total of 12 field trials were conducted to measure the LAI and LCC of maize at different growth stages, including seedling, early jointing, late jointing, tasseling, early filling, and late filling. The results indicated that the training data range for the LAI across the 6 growth stages was from 0.11 to 5.95, with a coefficient of variation (CV) ranging from 13.41% to 24.08%. The test data ranged from 0.14 to 5.57, with a CV of 10.97% to 22.94%. Similarly, the training data range for the LCC was from 19.61 to 79.41 μg/cm2, with a CV ranging from 6.99% to 14.64%. The test data ranged from 21.55 to 79.11 μg/cm2, with a CV of 5.66% to 11.79%. For each growth stage and the combined data from all growth stages, the SK algorithm was used to partition the sample sets. The analysis of the training and test sets indicated that this experiment provided a suitable dataset with considerable variability. In this paper, three machine learning algorithms, namely PLS, CNN, and RF, are used for model training.
PLS is widely used to deal with linear relationships between crop biochemical parameters and remote sensing variables. It combines the advantages of principal component analysis (PCA), typical correlation analysis, and linear regression analysis, which can effectively attenuate the multicollinearity among independent variables and alleviate the overfitting problem in the traditional linear models [41]. The model can be used to identify the potential relationships between highly correlated predictor variables and response variables, and requires fewer independent variables to estimate the dependent variable.
Deep Learning (DL) is a subfield of machine learning that has garnered widespread attention in the scientific community. DL employs multi-layered structures to automatically learn from data, enabling the extraction of complex nonlinear functions from the hierarchical outputs of previous layers. With large amounts of data, the accuracy of DL can be further enhanced, made possible by the advancements in hardware, technology, data optimization, and collection. Due to these factors, deep learning methods such as CNNs and Recurrent Neural Networks (RNNs) have achieved higher accuracy rates in various regression and classification tasks [6,43]. In the context of data fusion applications, CNNs have demonstrated their ability to learn features across multiple modalities (such as images, text, or audio) to improve the feature learning from individual modalities.
RF is a multi-factor machine learning algorithm characterized by its simplicity in modeling and precision in regard to results, which has been widely applied in various fields. Built upon decision trees, RF enhances the model accuracy and robustness by combining multiple decision trees, thereby minimizing the impact of outliers and noise. The number of decision trees (ntree) and the number of observations per tree leaf (mtry) are two crucial parameters in the RF model. In this study, we set ntree to 600 and employed a 10-fold cross-validation method to tune the RF model, aiming to identify the combination of hyperparameters that minimizes the Root Mean Square Error (RMSE). Subsequently, we utilized the optimal hyperparameter values to train the final random forest regression model.

3. Results and Analysis

3.1. Estimation of the Maize LAI and LCC Based on UAV MS Data

The correlation between the vegetation indices extracted from the multispectral imagery data and LAI and LCC at different growth stages was analyzed (Table 2). Among the six monitored growth stages, the correlation coefficients of these vegetation indices with the LAI and LCC typically exhibited a trend of initially increasing and then decreasing. Notably, during the jointing stage, most vegetation indices showed a high correlation with the LAI and LCC, with correlation coefficients ranging from 0.53 to 0.64 and from 0.35 to 0.60, respectively. Additionally, the indices that exhibited the strongest correlations with the LAI and LCC varied across the different growth stages. Overall, the selected vegetation indices effectively assessed the LAI and LCC of maize, serving as a valuable tool for monitoring its growth conditions. Similarly, the correlation analysis and significance testing of the canopy textural features with the maize LAI and LCC were conducted (Table 3), revealing that most of the textural features exhibited a good correlation with the LAI and LCC, with the textural indices from the R and NIR bands outperforming those from other bands.
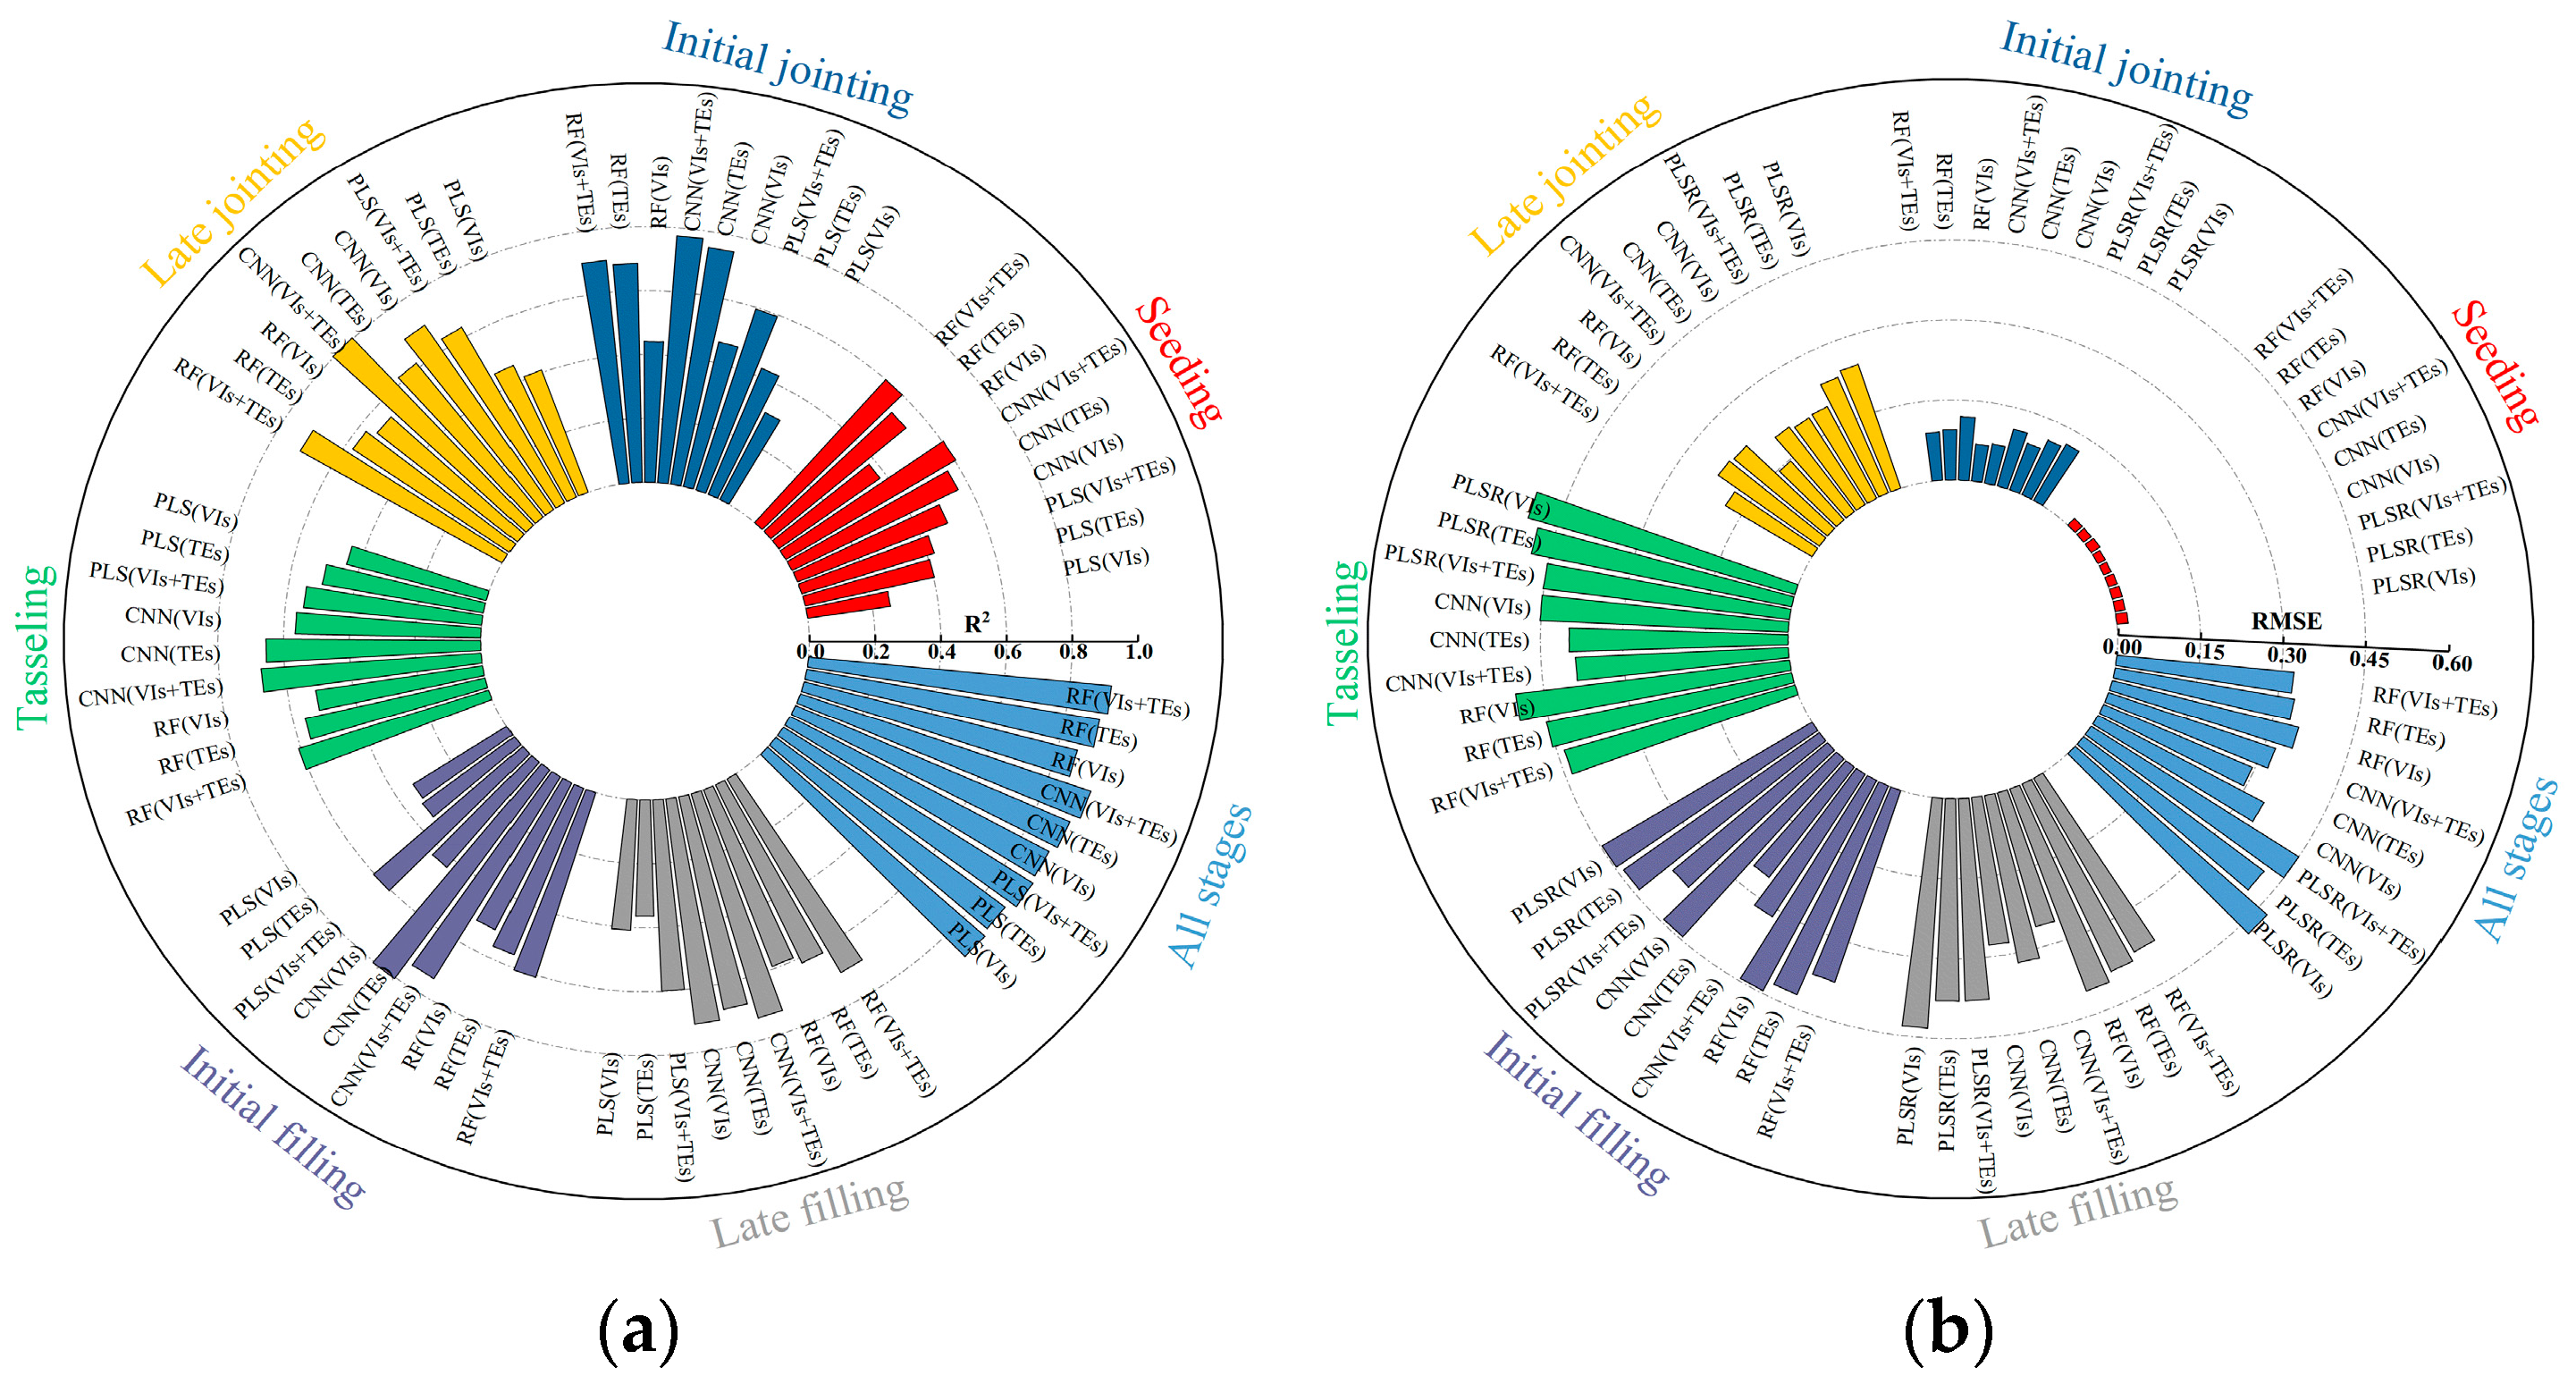
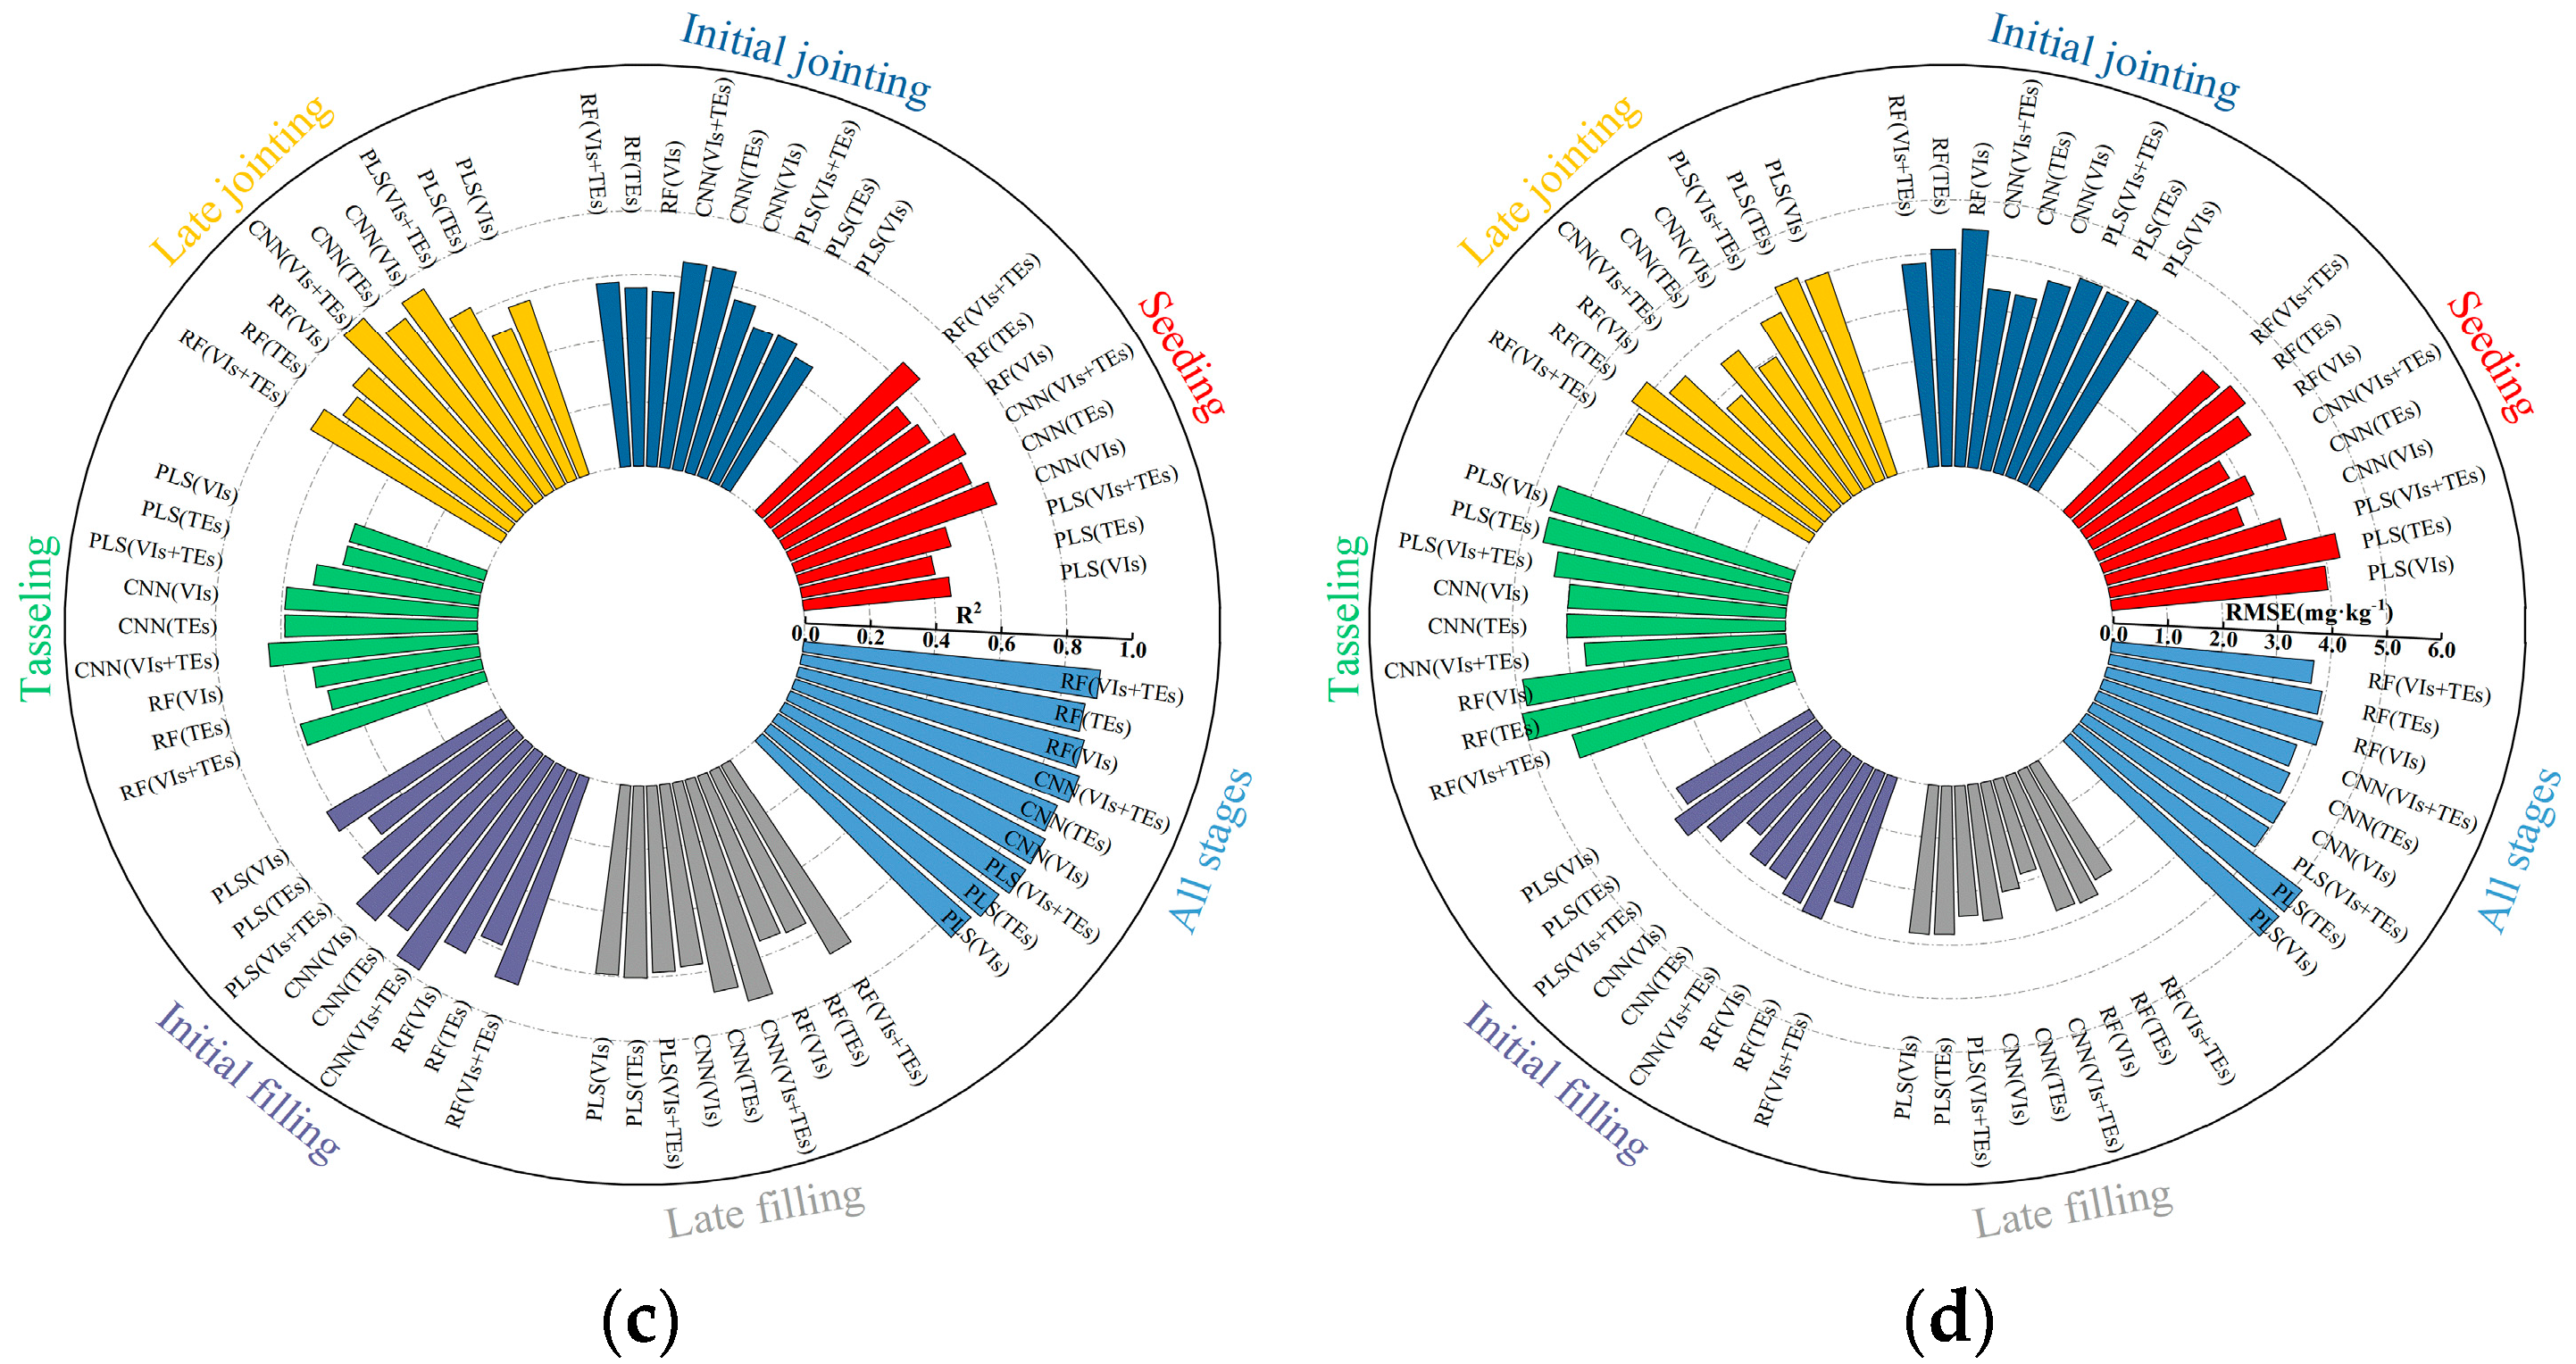
The spectral and textural information extracted from the UAV imagery was input into the partial least squares (PLS), convolutional neural networks (CNNs), and random forest (RF) models to estimate the maize LAI and LCC (Figure 2). The results indicated that for the LAI estimation, the textural information performed better than the spectral information across the multiple growth stages. However, for the LCC estimation, the model performance varied; during the seeding stage, late jointing, and initial grain filling stage, the textural information performed worse than the spectral information. Additionally, we combined spectral and textural information to build and evaluate the accuracy of these models. The results indicated that combining the spectral and textural information significantly improved the model’s accuracy compared to using either spectral or textural information alone. Among the three models, the CNN model had the highest estimation accuracy. Across the six crop growth stages, for the LAI estimation, the R2 values ranged from 0.61 to 0.79, and the RMSE values ranged from 0.02 to 0.38. For the LCC estimation, the R2 values ranged from 0.63 to 0.78, and the RMSE values ranged from 2.24 to 0.39 μg/cm2. The RF model followed, while the PLS model had the lowest accuracy.

3.2. Estimation of the Maize LAI and LCC Based on UAV TIR Data

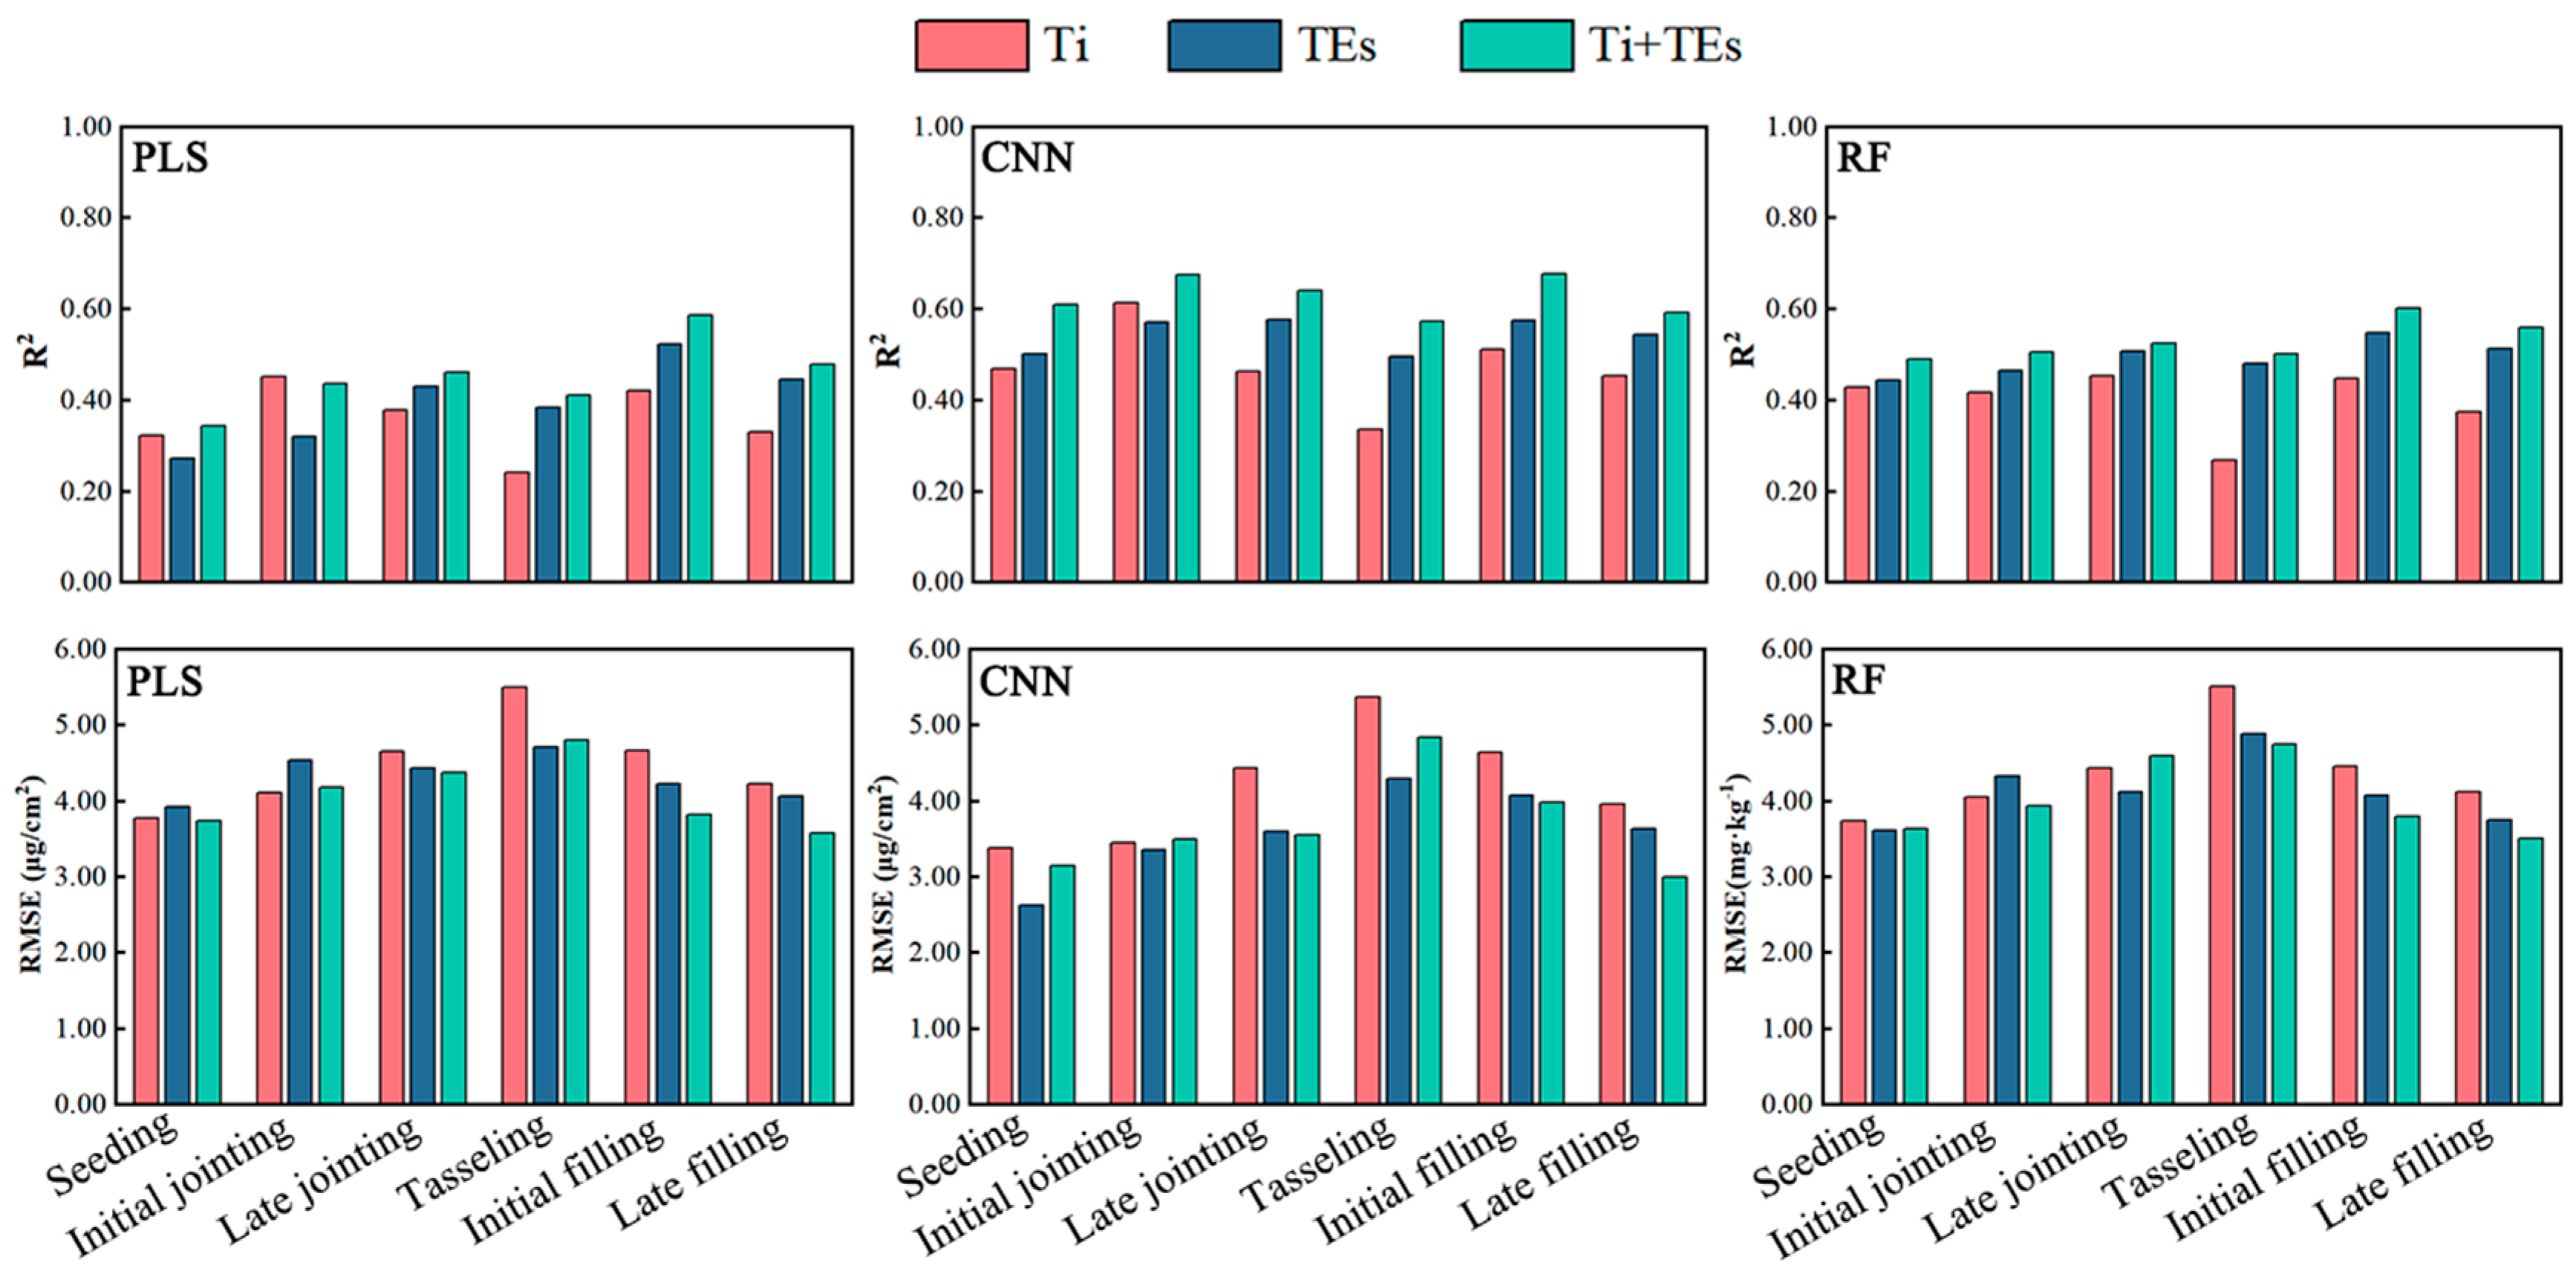
The canopy temperature (Ti) and textural information (TEs) extracted from the TIR data indirectly reflects the maize growth status, making it essential to evaluate their impact on the LAI and LCC estimation. The evaluation results of the maize LAI and LCC estimation models based on the TIR data are shown in Figure 3 and Figure 4. The estimation results for the LAI and LCC using only the normalized relative canopy temperature (NRCT) were not ideal, particularly in the later stages of crop growth. Compared to the canopy thermal information, the textural information exhibited more stable estimation performance across all the six growth stages. When combining the thermal and textural information, the model accuracy improved significantly. The LAI and LCC estimation accuracies were higher at the initial jointing (R2 = 0.32–0.68) and initial filling (R2 = 0.35–0.67) stages among the six stages of maize growth, and it is noteworthy that the accuracies of all the models were lower at the flowering stage (R2 = 0.24–0.57).
The LAI estimation model based on thermal information only has R2 = 0.31–0.54, RMSE = 0.02–0.63, and the LCC estimation model has R2 = 0.24–0.53, RMSE = 3.38–5.51 μg/cm2. The LAI estimation model based on textural information only has R2 = 0.30–0.62, RMSE = 0.02–0.61, and the LCC estimation model has R2 = 0.27–0.58, RMSE = 2.73–5.71 μg/cm2, and for the LCC estimation model, R2 = 0.27–0.58, RMSE = 2.73–5.71 μg/cm2. For the LAI estimation model based on a combination of thermal and textural information, R2 = 0.33–0.68, RMSE = 0.02–0.52. For the LCC estimation, R2 = 0.34–0.68, RMSE = 3.01–4.84 μg/cm2. These results indicate the limitations of estimating the maize LAI and LCC using only thermal infrared data.

3.3. Estimation of LAI and LCC in Maize Based on Fusion of MS and TIR Data

Three different models, namely PLS, CNN, and RF, were used to estimate the LAI and LCC by combining the MS vegetation indices and their textural features with TIR temperature information and its textural features (Table 4). The results show that the integration of MS and TIR data significantly improves the estimation accuracy of the model compared to using MS or TIR sensor data alone. In addition, we find that the MS data have greater potential compared to the TIR data in the estimation of the maize LAI and LCC. Specifically, for the LAI estimation, the combination of MS and TIR information resulted in improved R2 values of 10.63–22.44%, 7.76–23.06%, and 2.42–19.65% for the PLS, CNN, and RF models, respectively, compared to the use of MS information alone. For the LCC estimation, this combination strategy also resulted in an increase in R2 values of 3.02–18.09%, 1.03–19.01%, and 1.21–18.92%, respectively. It is noteworthy that these improvements were particularly significant in the later stages of crop growth.
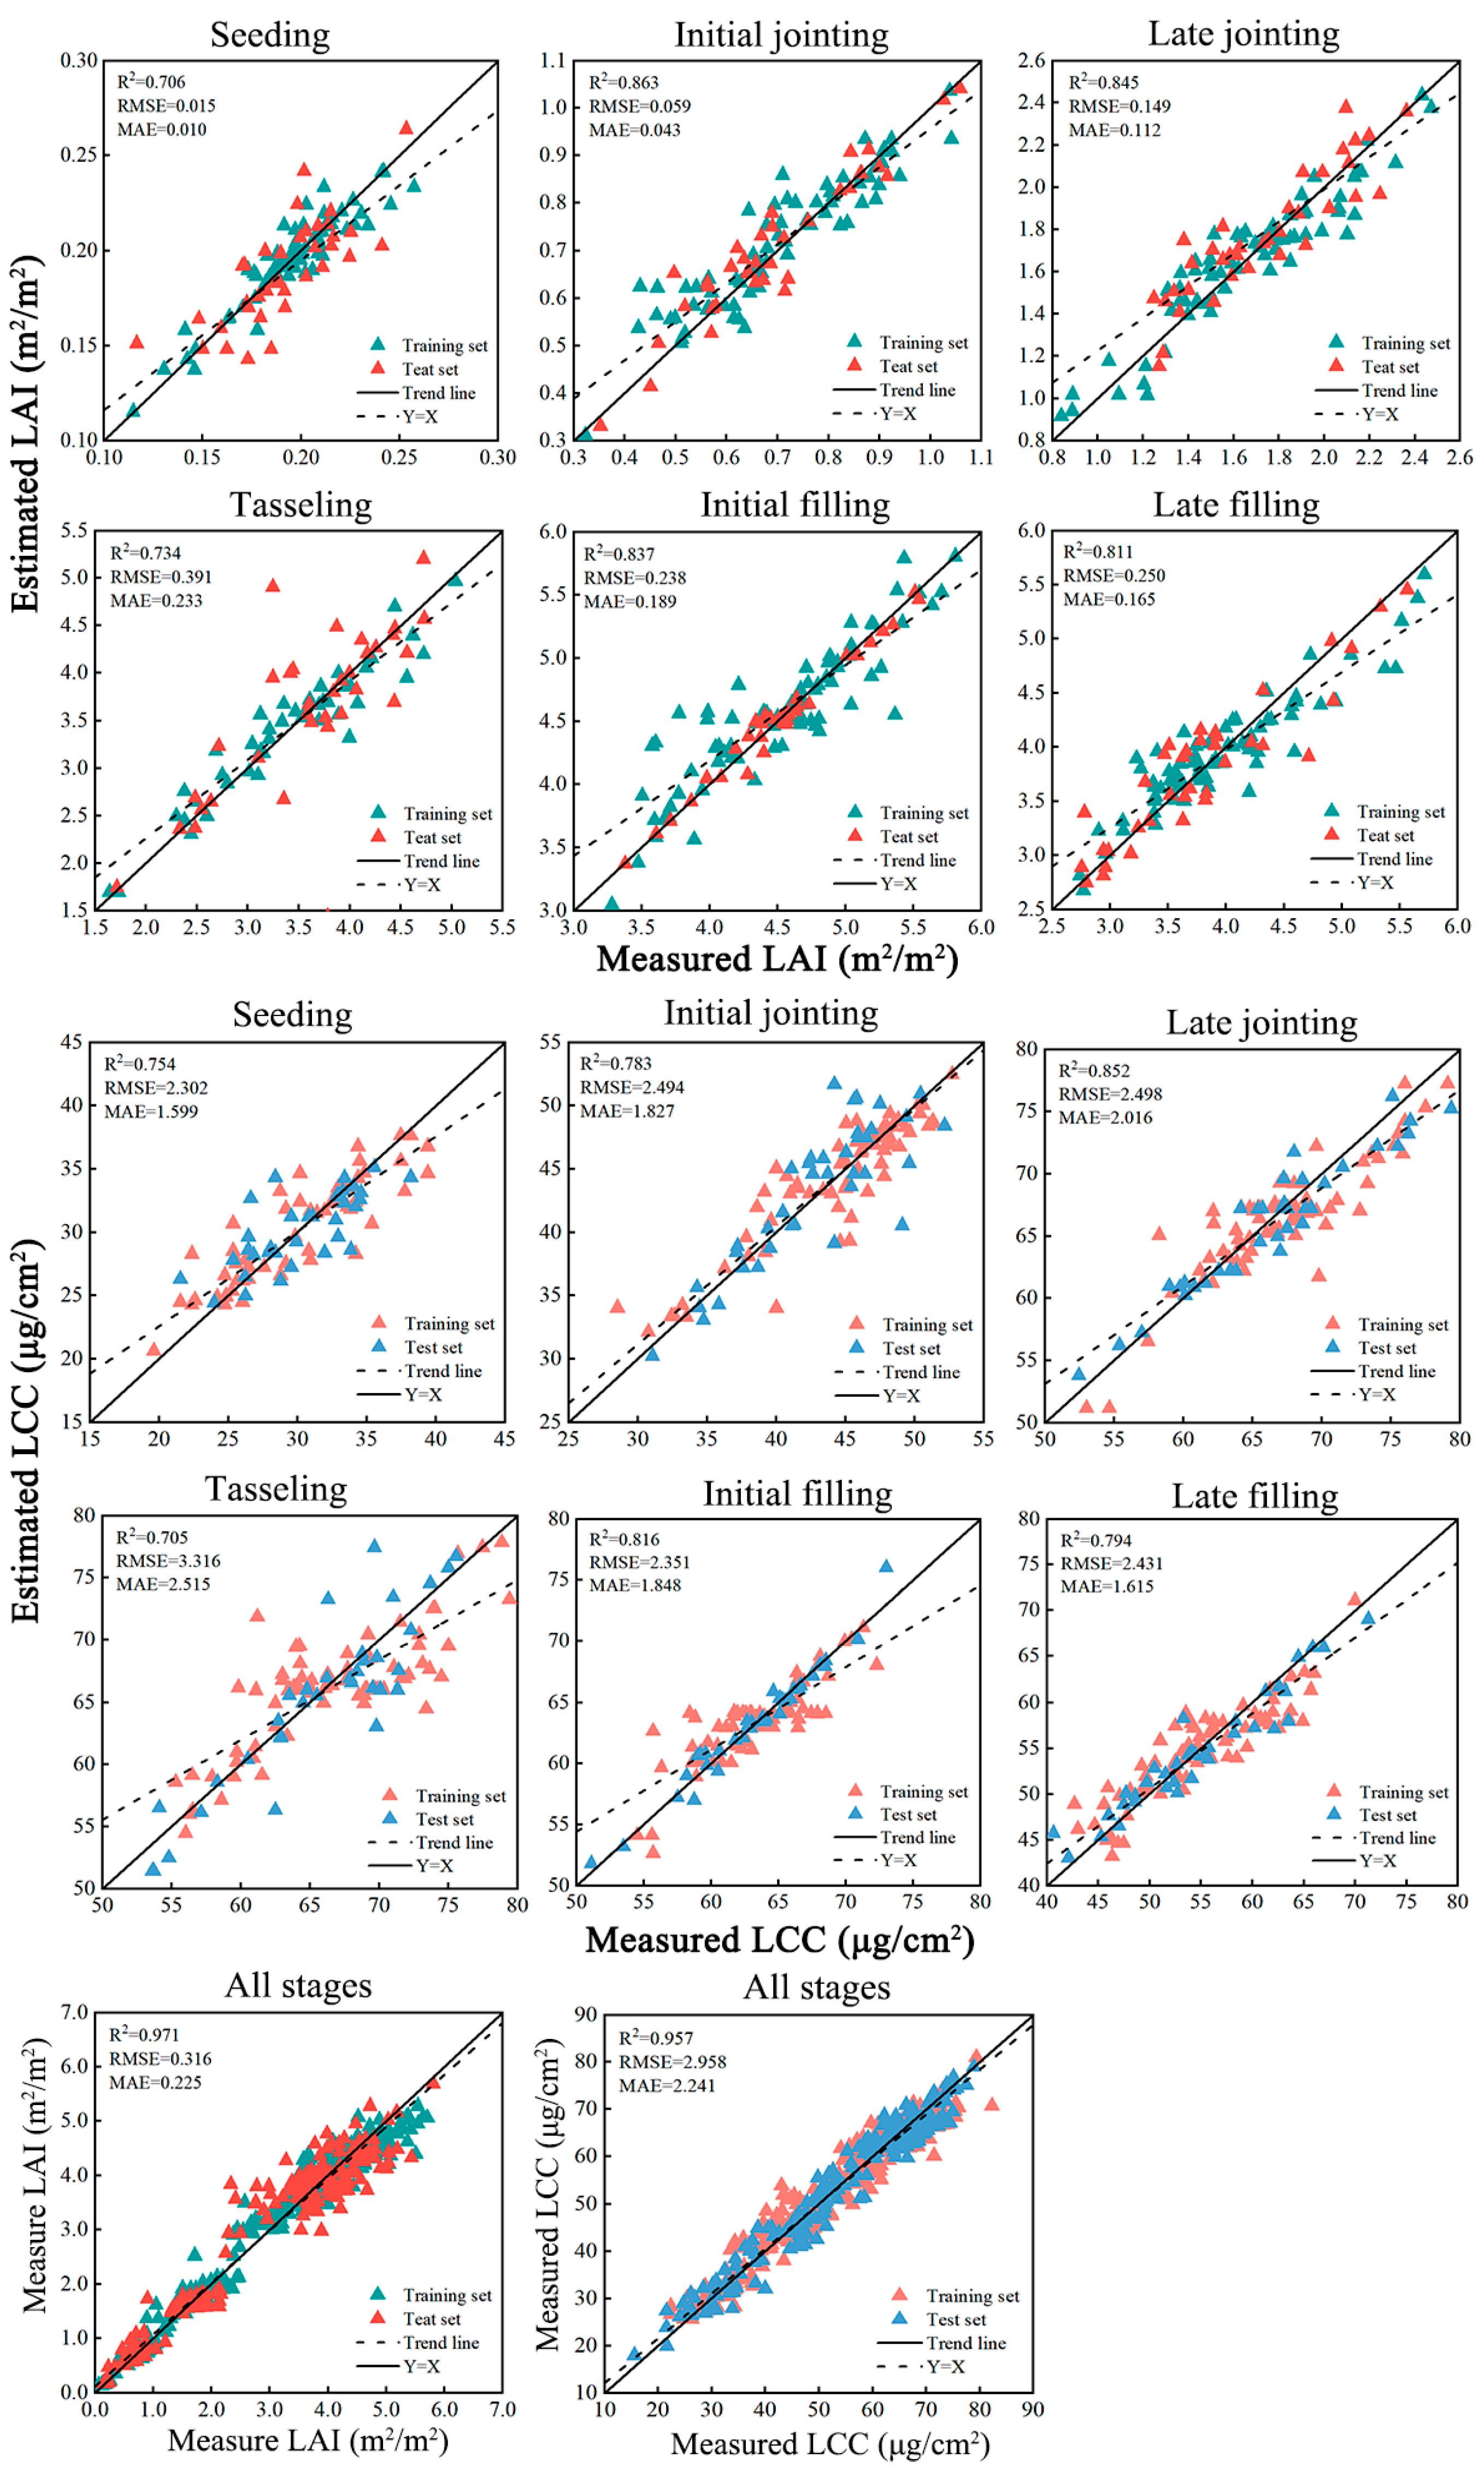
The optimal CNN model for the estimation of the LAI and LCC was selected based on the comprehensive evaluation of the above results. Figure 5 shows in detail the performance of this CNN model. The accuracy of the LAI and LCC estimates varied across the six different growth stages, showing distinct patterns in relation to model performance. At the seeding stage, the model achieved a moderate fit, with R2 values of 0.706 for the LAI and 0.754 for the LCC, and relatively low RMSE values of 0.015 for the LAI and 2.302 μg/cm2 for the LCC. As the plants progressed to the initial jointing stage, the model’s accuracy improved, yielding R2 values of 0.863 for the LAI and 0.783 for the LCC, along with RMSE values of 0.059 and 2.494 μg/cm2, respectively. This trend continued into the late jointing stage, where R2 values reached 0.845 for the LAI and 0.852 for the LCC, although RMSE values slightly increased to 0.149 for the LAI and remained stable at 2.498 μg/cm2 for the LCC.
During the tasseling stage, however, there was a slight drop in accuracy, with R2 values decreasing to 0.734 for the LAI and 0.705 for the LCC, with RMSE values rising to 0.391 and 3.316 μg/cm2, respectively. The model’s performance rebounded in the initial filling stage, achieving R2 values of 0.837 for the LAI and 0.816 for the LCC, and RMSE values of 0.238 and 2.351 μg/cm2. Finally, at the late filling stage, the model maintained a strong performance, with R2 values of 0.811 for the LAI and 0.794 for the LCC, and RMSE values of 0.250 and 2.431 μg/cm2. Overall, these results highlight that the model’s accuracy tended to improve during the jointing and filling stages, while the tasseling stage presented more challenges for accurate estimation.

3.4. Remote Sensing Monitoring of the LAI, LCC, and Nitrogen Diagnosis

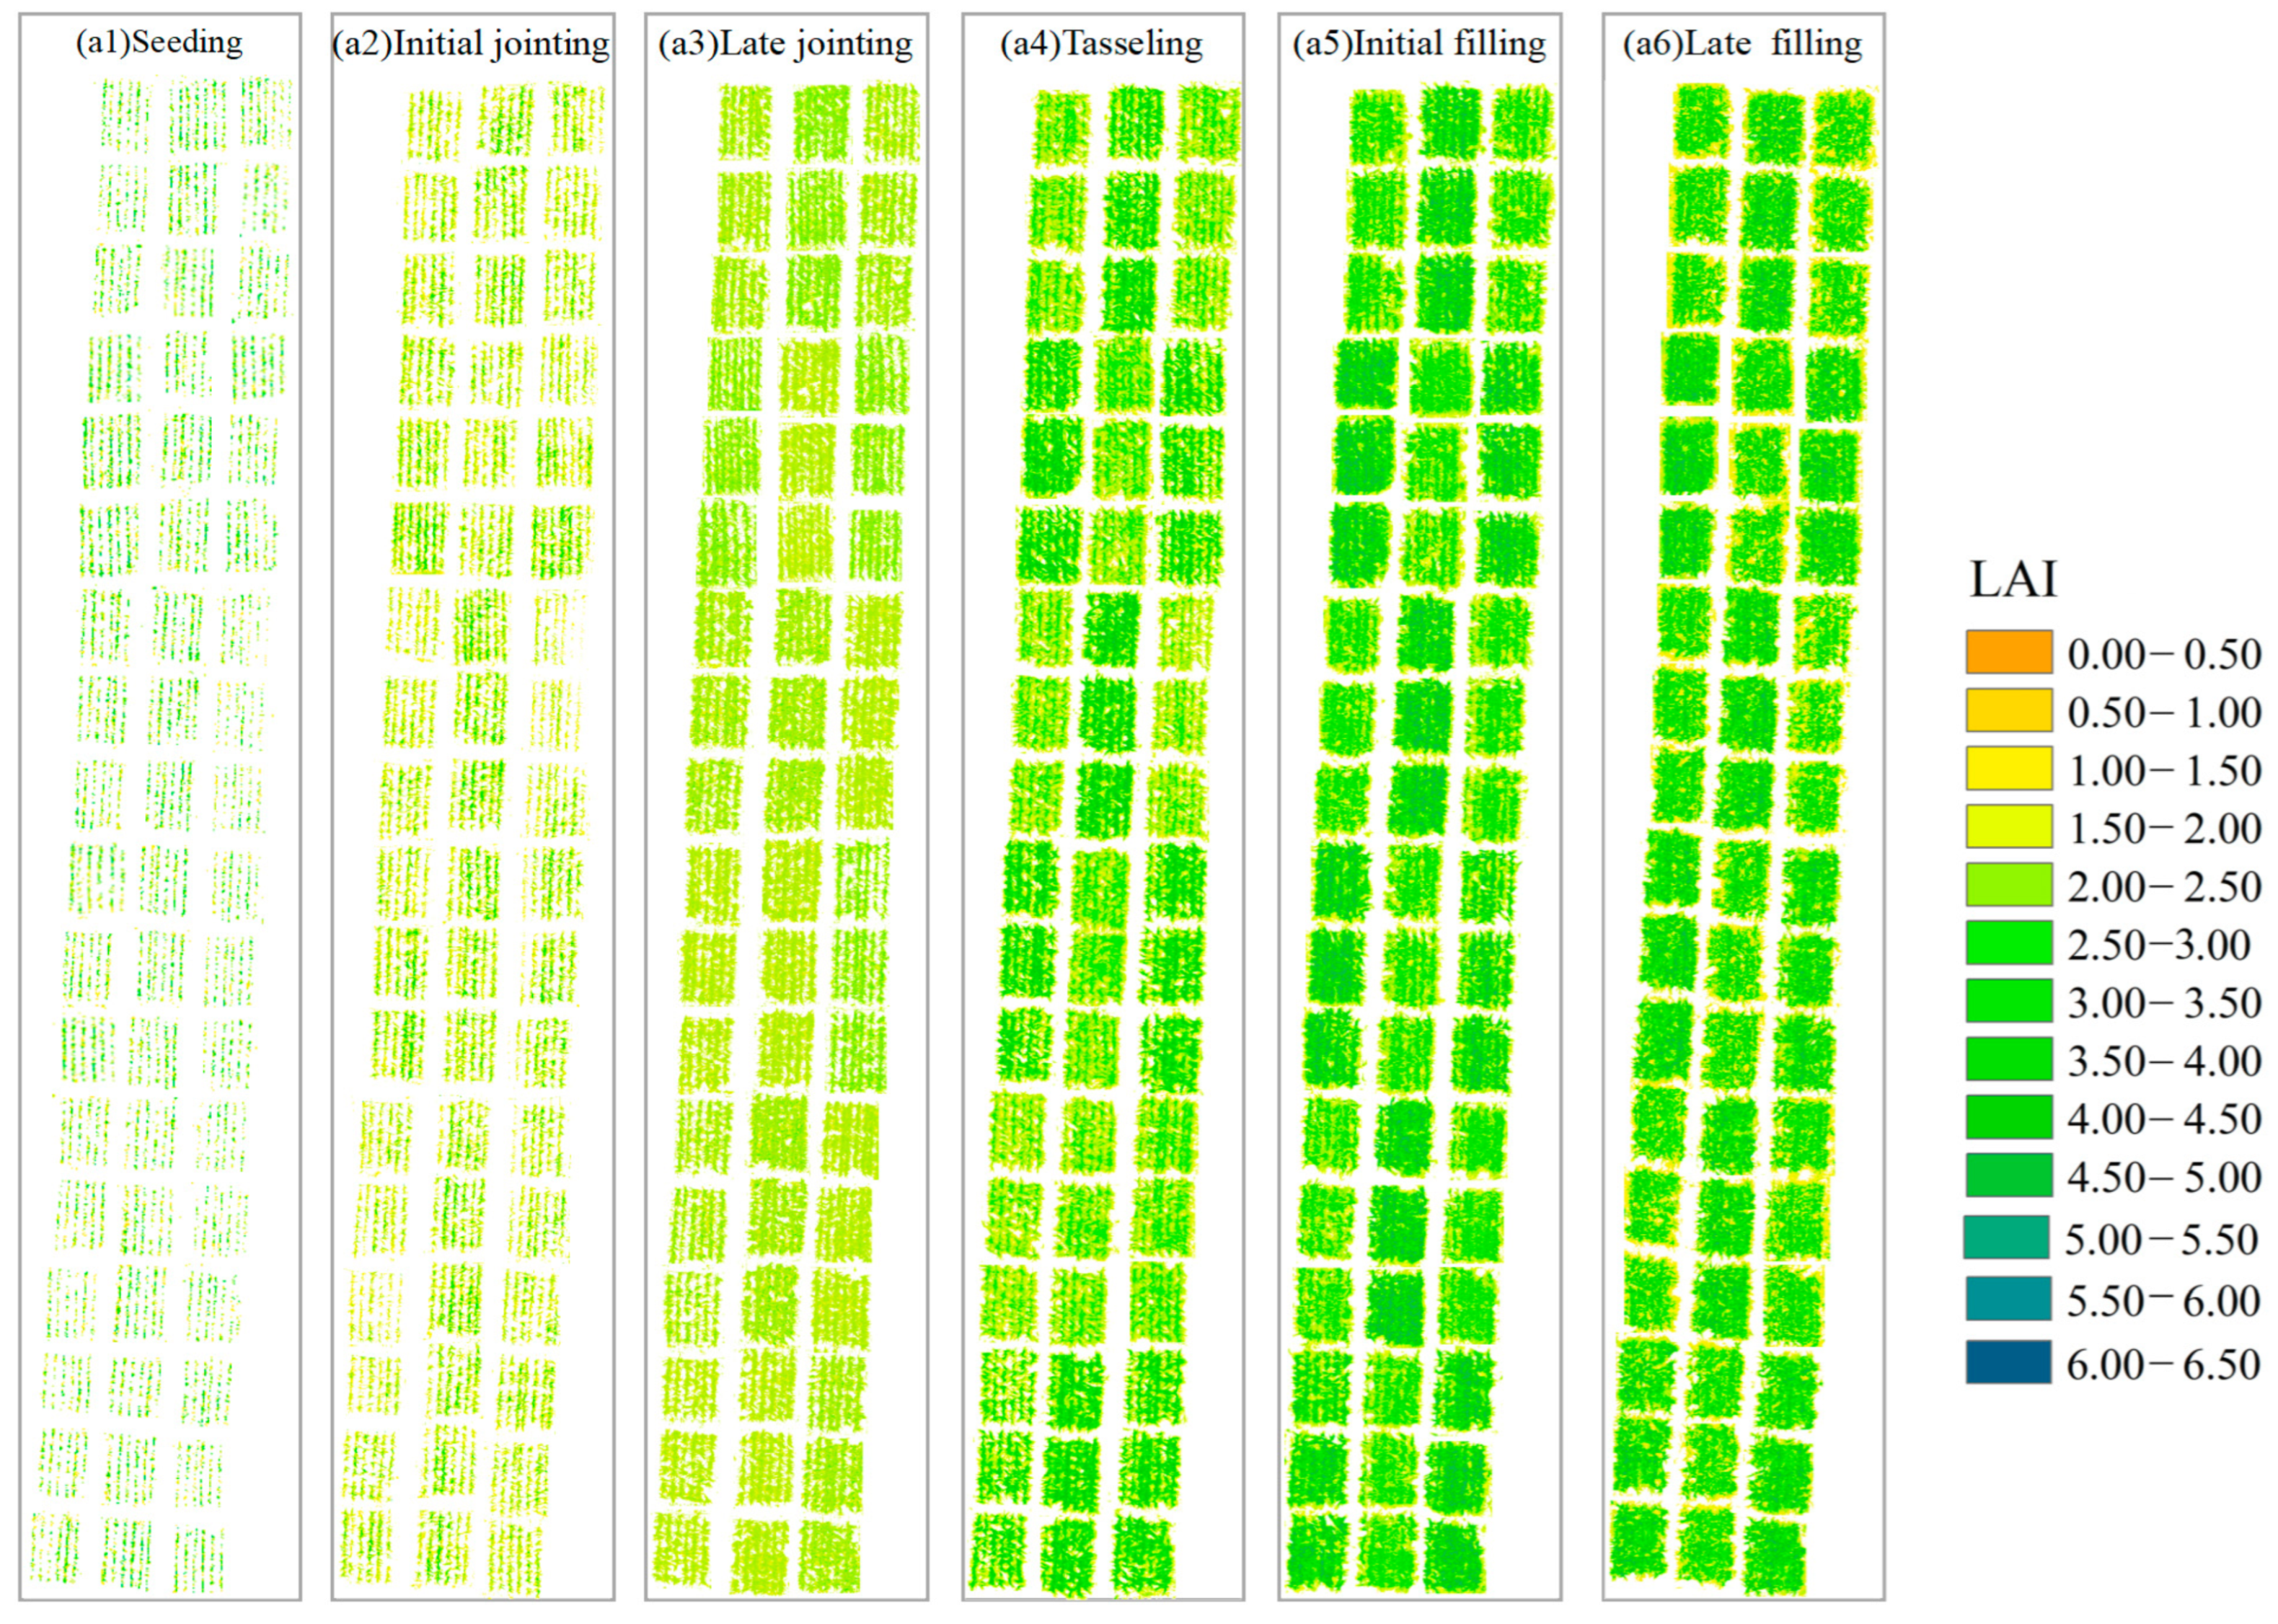
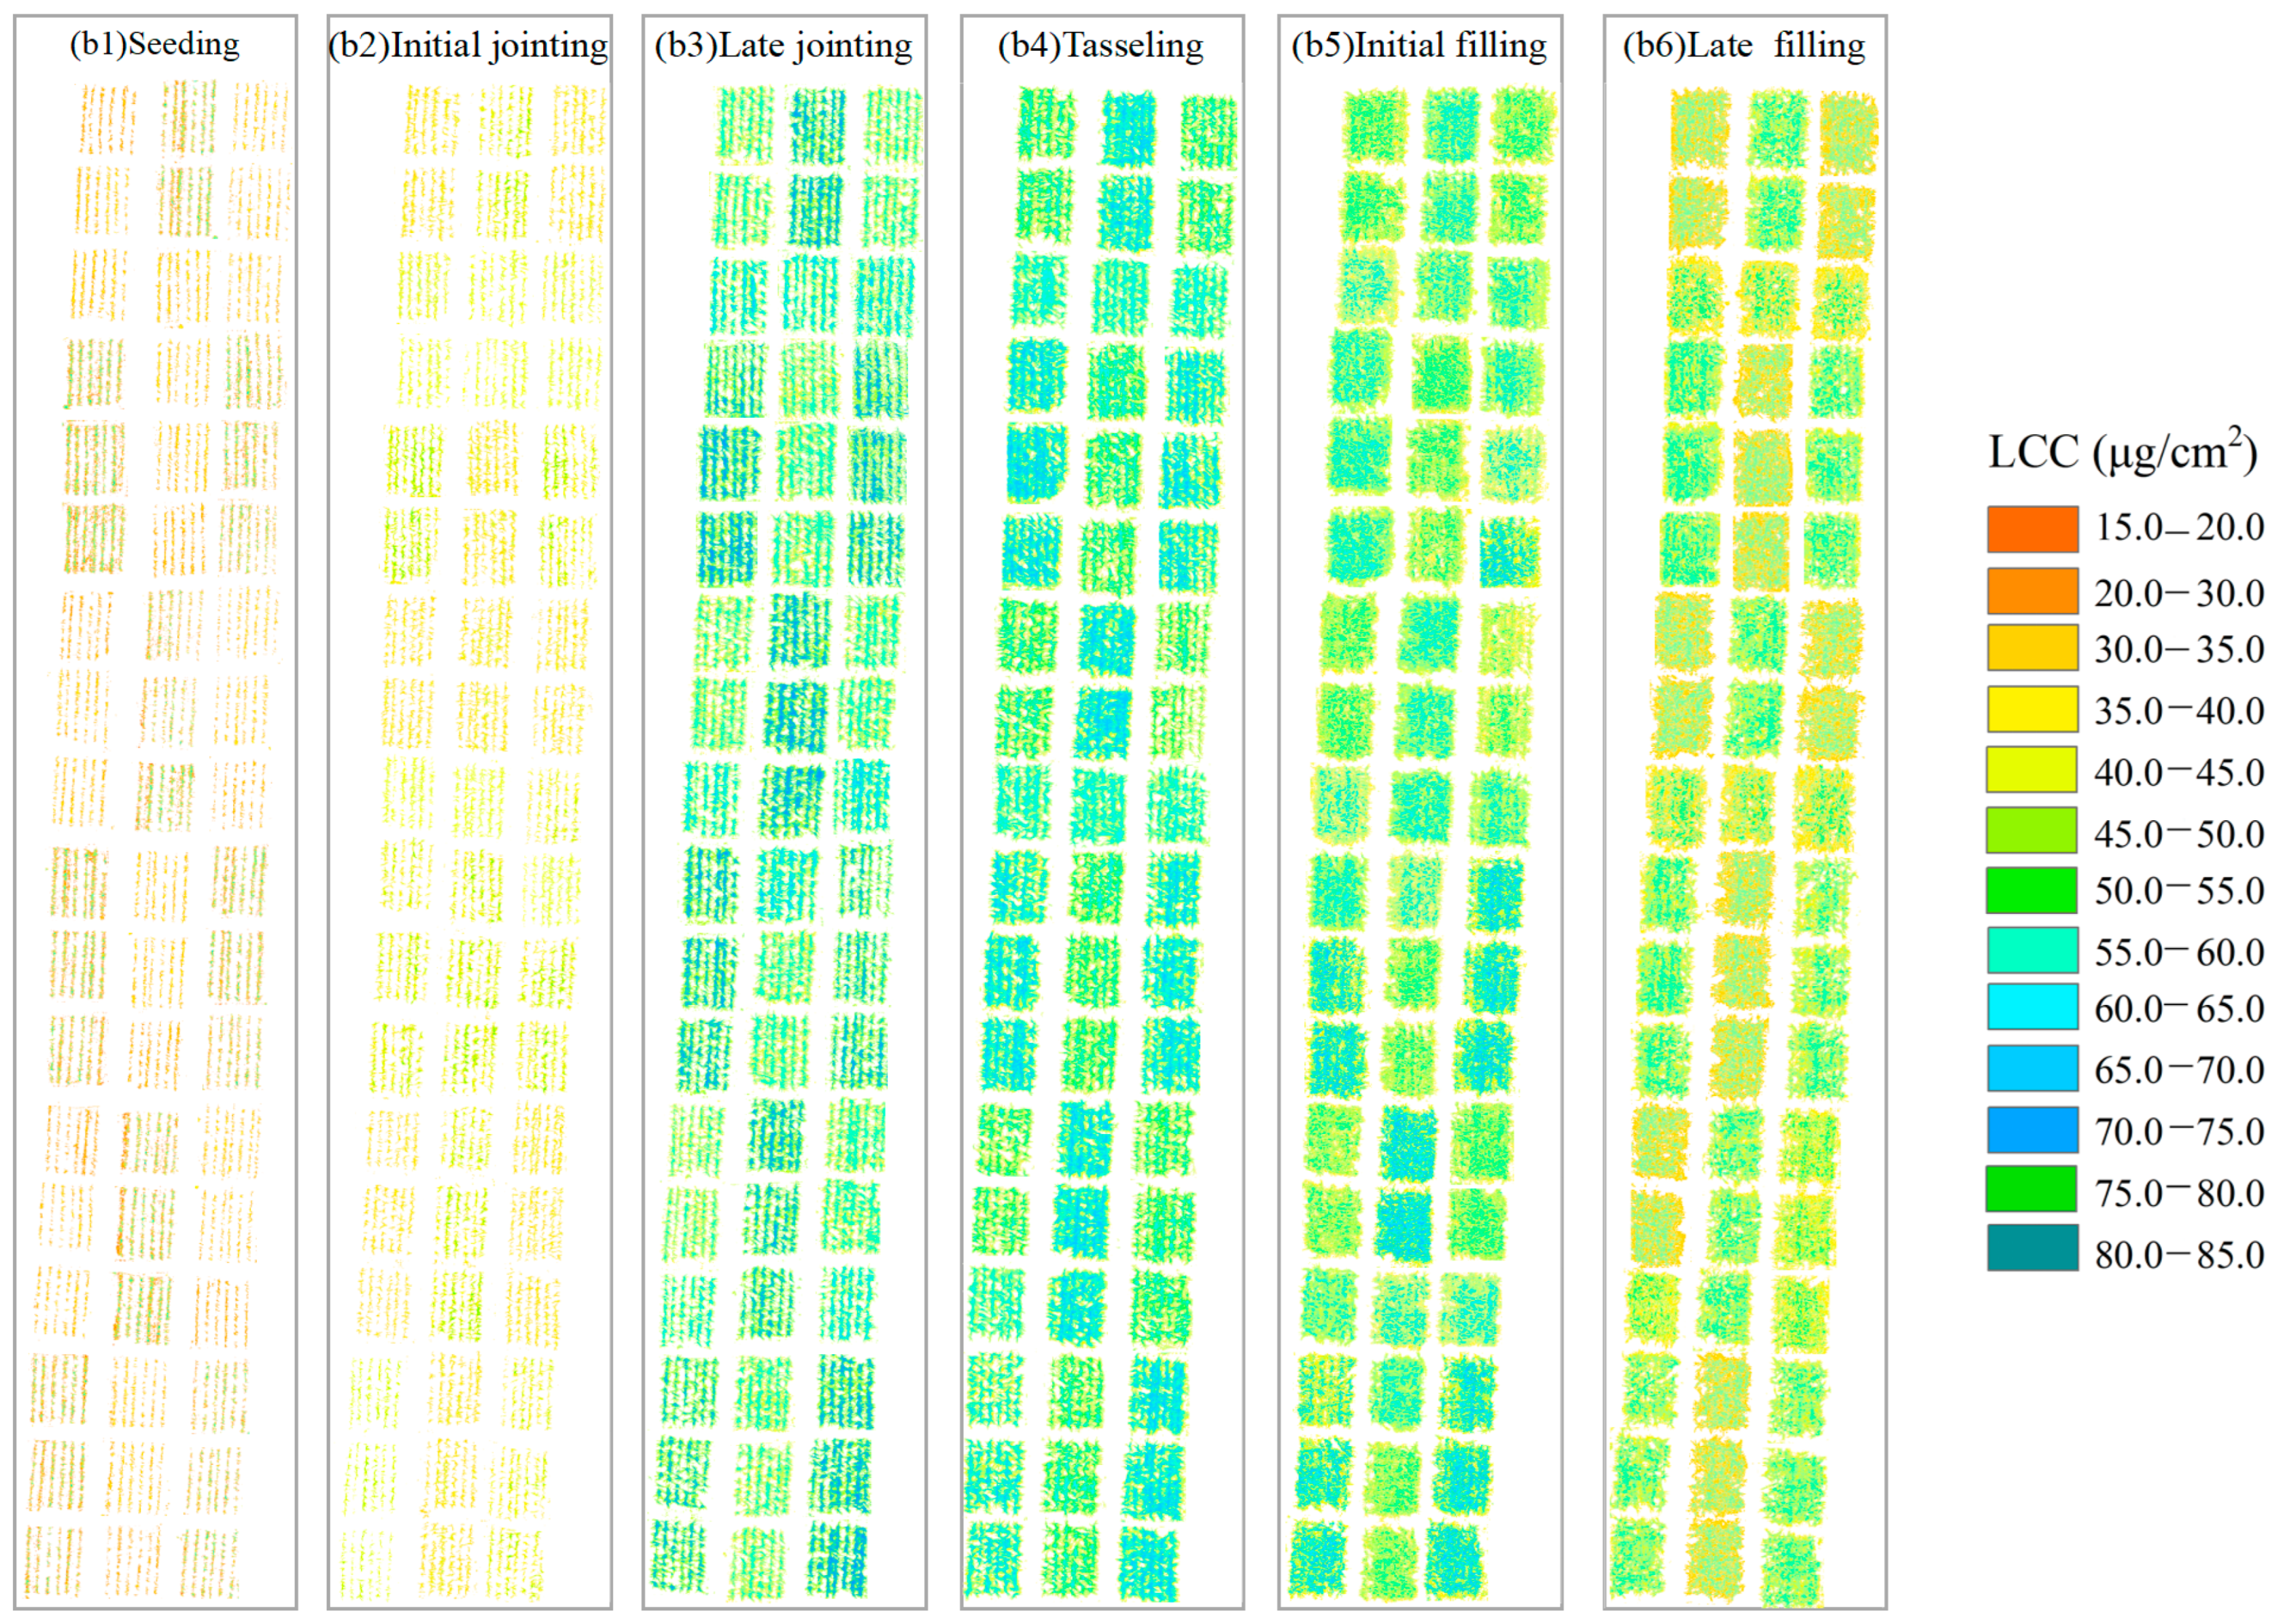
The estimation results for the LAI and LCC using the CNN model with combined UAV multispectral and thermal infrared data are shown in Figure 6. The LAI continued to increase throughout the growing season, accumulating dry matter through photosynthesis until the filling stage, after which it slightly decreased. The LCC showed an increasing trend from seedling to initial jointing stage and a decreasing trend from the late jointing stage. The LAI and LCC showed spatial variability, and this difference indicates the crop response to different water and nitrogen treatments. For example, the range of the LAI at different growth stages under N1 treatment was: 0.14–0.26, 0.35–0.79, 1.51–2.19, 3.36–5.08, 4.58–5.72, 3.69–5.08, and the range of the LAI under N6 treatment was: 0.23–0.29, 0.52–0.91, 1.85–2.73, 4.43–5.26, 5.06–6.19, 4.54–5.52. Soil moisture also affects the LAI and LCC. For the W0 treatment, the LAI ranged from 0.11 to 4.58 and the LCC ranged from 21.06 to 67.25 μg/cm2. For the W3 treatment, the LAI ranged from 0.17 to 5.95, and the LCC ranged from 26.02 to 72.15 μg/cm2.
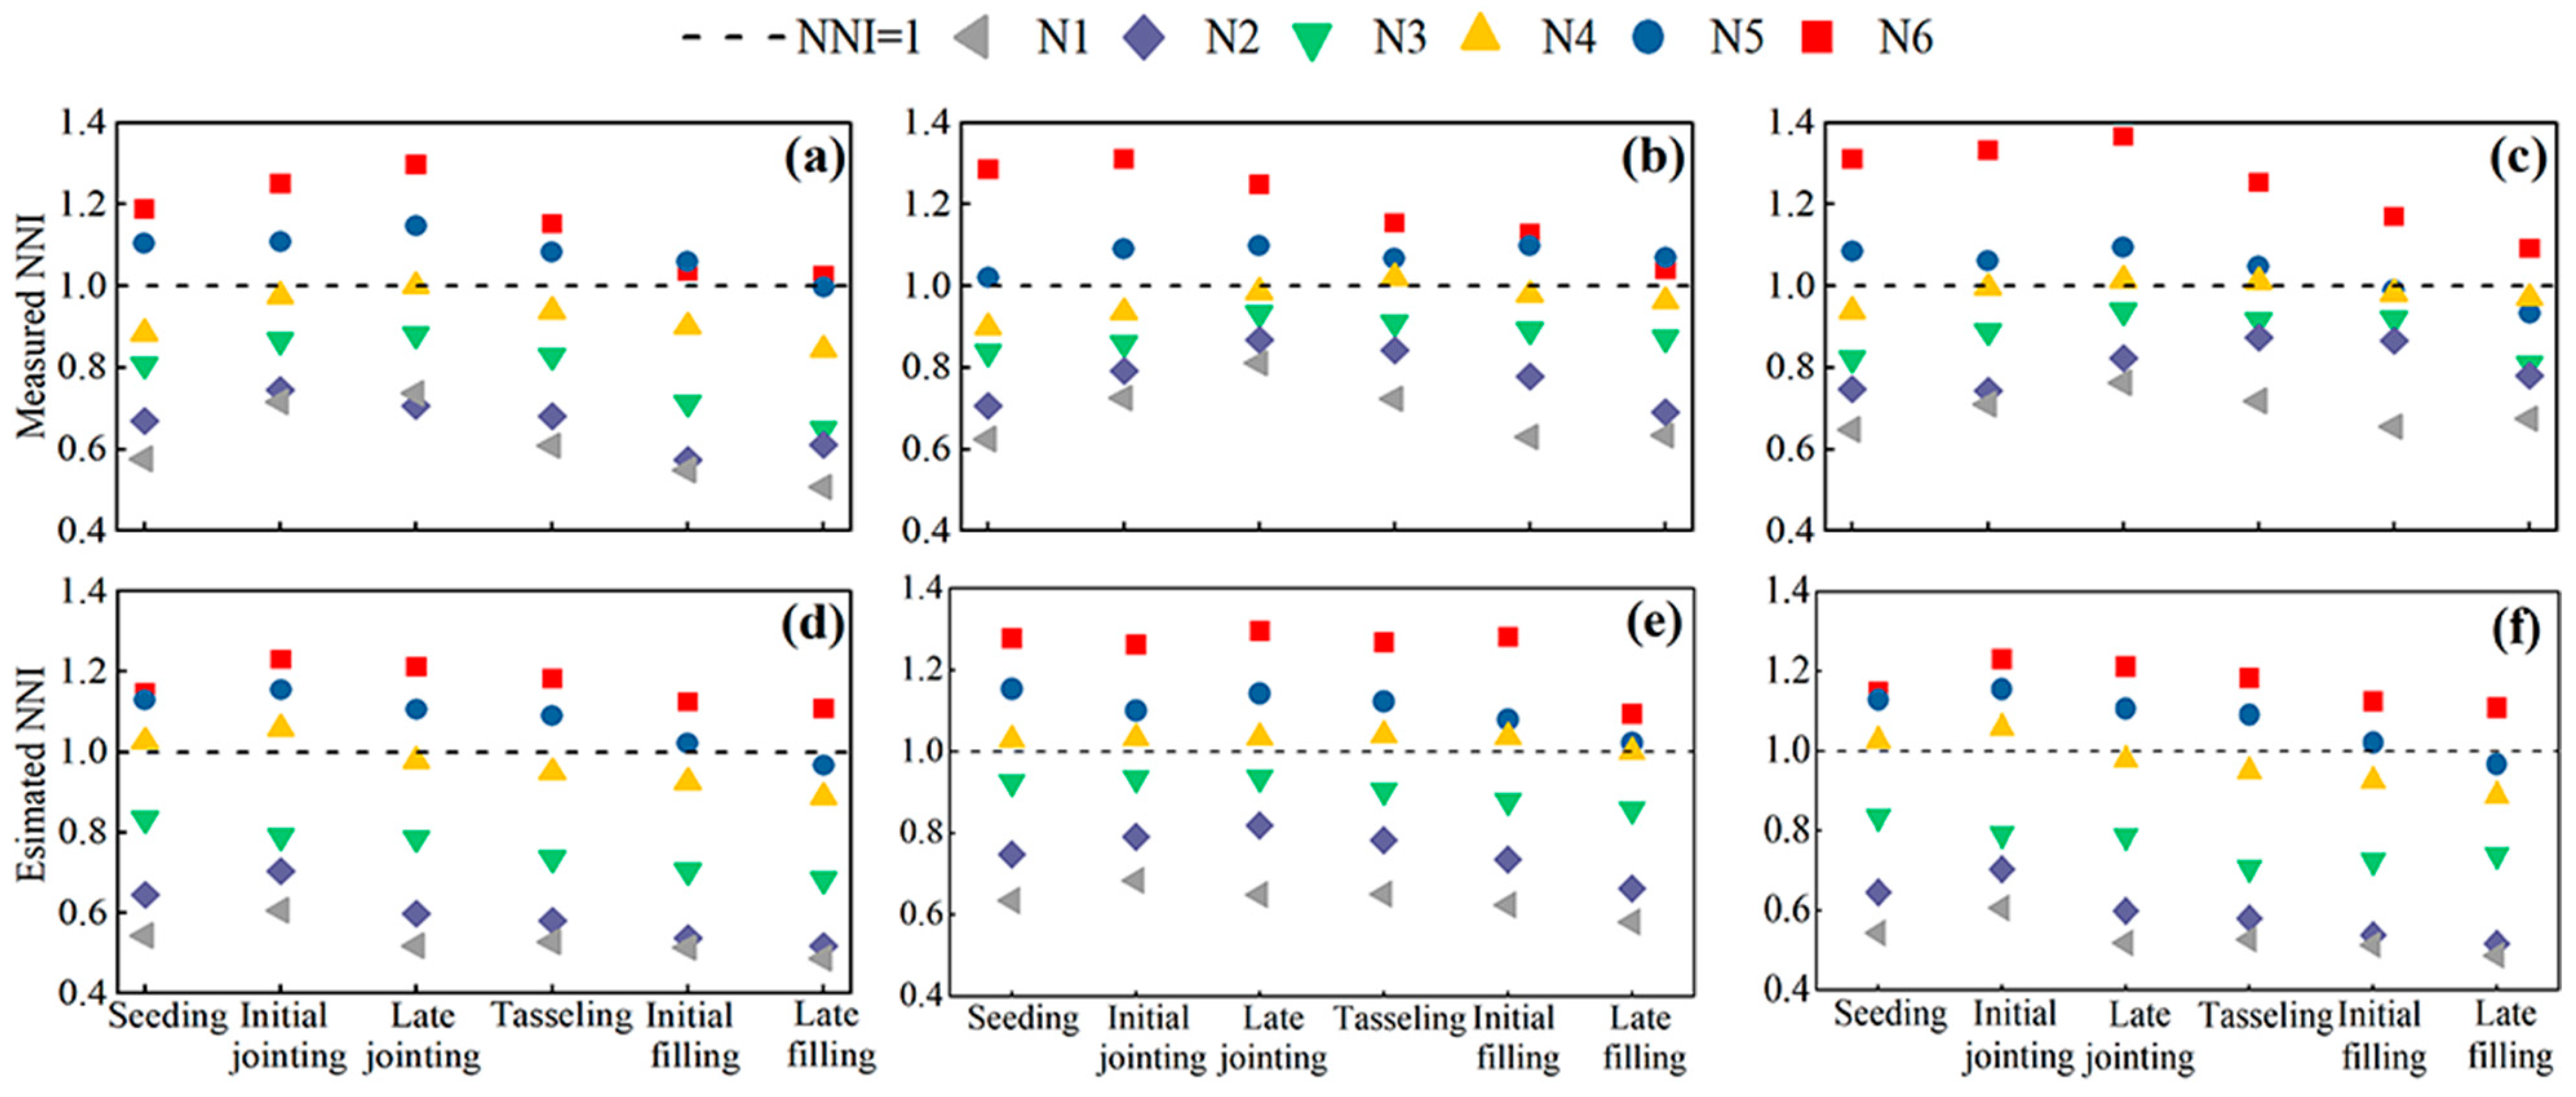
Based on the stable linear relationship between the remotely sensed LAI and measured LAI, nitrogen dilution curves were constructed using both the measured and remotely estimated LAI. The nitrogen nutrition index (NNI) for both the measured and estimated LAI were calculated (Figure 7). The measured NNI values for N1, N2 treatments were 0.51–0.74, 0.57–0.87, and the estimated NNI values were 0.49–0.67, 0.52–0.81, which indicates that the crop under the N1 and N2 treatment were N limited throughout the reproductive period. The measured NNI values for N5 and N6 treatments were 0.93–1.15, 1.03–1.37, and the estimated NNI values were 0.97–1.16, 1.09–1.28, respectively, indicating that there was excess N in the crop. Compared with W1 and W2, the W0 treatment reduced the N uptake in wheat, exacerbating the N deficiency, especially in the later stages of crop growth. The appropriate water and nitrogen management (W2N3) enhanced the N use efficiency, with the NNI value approaching 1, indicating the optimal conditions for maize growth. These results highlight the importance of integrating water and N management to optimize the crop performance and resource use efficiency.

4. Discussion

4.1. Advantages of MS and TIR Information in the LAI and LCC Dynamic Monitoring

This study highlights the significant value of canopy spectral information in estimating the crop LAI and LCC. The response of different spectral information extracted by multispectral sensors to the LAI and LCC varies, and they determine the canopy’s absorption of photosynthetically active radiation [52,62]. Consequently, the VIs constructed from spectral bands are significantly correlated with the LAI and LCC. However, the sensitivity of the VIs decreases under conditions of high vegetation cover (late filling stage) or high interference (tasseling stage), leading to a reduced estimation accuracy for the LAI and LCC (Figure 2).
The canopy thermal information extracted from the TIR images is sensitive to the leaf water content, leaf N content, and canopy characteristics [16,50]. This is due to the fact that water and N stress affect the leaf stomatal conductance and chlorophyll content. Previous studies have recognized the use of canopy thermal information as a tool for monitoring the crop growth and N status [49,54,59]. However, the single thermal information in TIR images restricts its application in the LAI and LCC estimation (Figure 3 and Figure 4).
Modeling combining canopy spectral, textural, and thermal information from MS and TIR found that the estimation accuracies of all the models improved, suggesting that these three types of information are unique and complementary [42,43]. Especially at the later stage of the crop growth, fusing these information types helps the LAI and LCC estimation. The CNN-based estimation model performed the best among the three models in this study, with R2 ranging from 0.706 to 0.863 and RMSE ranging from 0.015 to 0.391 for the LAI estimation, and R2 ranging from 0.754 to 0.852 and RMSE ranging from 2.302 to 2.498 μg/cm2 for the LCC estimation. More indicators of canopy thermal information need to be explored in future studies as a way to improve the monitoring and management of the crop growth.

4.2. Application of Remote Sensing Technology in the Crop Nitrogen Status Diagnosis

The rapid development of remote sensing technology and crop N status diagnosis using data collected by sensors on different platforms (e.g., ground, UAVs, and satellites) has become a hotspot in the current agricultural research [31,32]. By establishing the empirical relationships between the remotely sensed VIs and nitrogen nutrient index (NNI), the crop N status can be effectively assessed. As an active canopy sensor, GreenSkeer can provide canopy spectral reflectance in the red (650 nm) and near-infrared (NIR, 770 nm) bands for the calculation of the NDVI and OSAVI. These indexes are highly sensitive to the crop N content [63,64]. Previous studies have also shown that the chlorophyll index green (CIgreen) and chlorophyll index red edge (CIred-edge) are stable indexes for estimating the canopy N content [65].
The study results indicate that the nitrogen dilution curves established based on the remotely estimated LAI are highly effective in diagnosing the crop N status. The evidence shows a high consistency between the experimentally measured NNI and remotely estimated NNI (Figure 7). This consistency is attributed to the fact that N is a key component in the synthesis of leaf chlorophyll and proteins, directly participating in crop photosynthesis, and consequently affecting the LAI and biomass accumulation [21,27,32]. In this field experiment, the optimal water and nitrogen treatment for summer maize was W2N4, under which the NNI value approached 1, indicating that this treatment effectively meets the nitrogen requirements of the crop. However, water treatments can lead to discrepancies between remotely calculated NNI and experimentally measured NNI [66,67]. For instance, under the W0 and W1 conditions, the ability to diagnose the N status for the N3 and N4 treatments is limited. This limitation suggests that future research should focus on refining the dilution curve method to improve its applicability under various water treatment conditions, thereby enhancing the accuracy of the crop N status diagnosis. Overall, remote sensing technology, combined with data from different sensor platforms, provides an efficient and non-destructive method for diagnosing the crop N status. By further optimizing and developing new technologies and methods, it is possible to achieve more precise N status monitoring and management across different environmental conditions and crop growth stages, thereby enhancing the precision of agricultural production.

4.3. Comparison of the Performance of the Different Models

The LAI and LCC are important indicators for evaluating vegetation growth and health. In this study, two machine learning algorithms and one deep learning algorithm were used to predict these parameters. The results show that for single-sensor data, both RF and CNNs performed well in predicting the LAI and LCC, whereas the PLS model exhibited a relatively weaker predictive ability. When using multi-sensor data fusion, CNNs achieved the highest prediction accuracy (Table 4).
This outcome may be due to the fact that PLS is a linear regression method, which is suitable for high-dimensional datasets with strong multicollinearity. By maximizing the covariance between independent and dependent variables, PLS can extract latent features, making it somewhat effective for processing spectral data [28,36]. However, because PLS relies on linear assumptions, it has a limited ability to capture nonlinear relationships, especially in complex remote sensing data, and thus may underperform compared to nonlinear models [44]. In contrast, RF, an ensemble learning method based on decision trees, is highly robust and resistant to noise, and can handle high-dimensional data effectively. Unlike PLS, RF is capable of fitting nonlinear relationships, which contributes to its strong performance in predicting the LAI and LCC [10,12,16]. Moreover, RF’s ability to evaluate feature importance can help identify the most relevant spectral bands for prediction. However, while RF may not capture complex nonlinear patterns as effectively as CNNs, it offers advantages in terms of computational efficiency and model interpretability [33,40]. As a deep learning approach, CNNs can automatically extract multi-level spatial features, making it especially suitable for remote sensing image analysis where spatial and spectral information is crucial. Research has shown that CNNs perform exceptionally well when processing large, complex datasets, particularly in scenarios with prominent nonlinear relationships [6,43,46]. In predicting the LAI and LCC, CNNs can capture complex patterns in leaf reflectance spectra, significantly enhancing the prediction accuracy.

5. Conclusions

Monitoring crop growth parameters using remote sensing is crucial for efficient and precise agricultural management. This study compares the performance of canopy spectral, thermal, and textural information from UAV-based MS and TIR data for the LAI and LCC estimation. Additionally, we propose an indirect crop N status diagnosis method using a CNN model combined with MS and TIR data, with the main conclusions as follows:
The combination of canopy spectral information and textural features improved the dynamic estimation performance of the LAI and LCC. For the LAI estimation, textural information outperformed spectral information, while for the LCC estimation, spectral information outperformed textural information during the seeding, late jointing, and initial filling growth stages. Thermal information fusion can further improve the estimation performance of the maize LAI and LCC. Particularly, the fusion of multi-source data (canopy spectral information, textural, and thermal information) mitigated the underestimation of the LAI and LCC observed in the later growth stages.
The CNN model based on multi-feature fusion accurately reflected the impact of water and nitrogen treatments on the crop growth, and nitrogen dilution curves established using the remotely estimated LAI proved effective in diagnosing the crop N status. Moreover, deficit irrigation reduced the N uptake efficiency, leading to more severe N deficiency in the later stages of crop growth. Proper water and nitrogen management promotes the growth of the LAI, the accumulation of the LCC, and the increase in yield.

Author Contributions

Conceptualization, X.Y. (Xingjiao Yu) and L.Q.; Methodology, X.H. (Xuefei Huo) and L.Q.; Software, X.Y. (Xingjiao Yu), L.Q., Y.D., D.L. and X.Y. (Xiaofei Yang); Validation, X.Y. (Xingjiao Yu); Formal analysis, X.Y. (Xingjiao Yu) and X.H. (Xuefei Huo); Investigation, W.W.; Data curation, X.Y. (Xingjiao Yu), L.Q., Y.D., Q.C., X.Y. (Xiaofei Yang) and S.F.; Writing—original draft, X.Y. (Xingjiao Yu); Visualization, X.Y. (Xingjiao Yu) and L.Q.; Project administration, W.W.; Funding acquisition, W.W. and X.H. (Xiaotao Hu). All authors have read and agreed to the published version of the manuscript.

Funding

This research was funded by Key R&D Program of Shaanxi Province, China (2024NC-ZDCYL-02-08), the National Natural Science Foundation of China for the projects (52079113 and U2243235), and the National Key Research and Development Program of China (2022YFD1900404-01).

Institutional Review Board Statement

Not applicable.

Data Availability Statement

The data presented in this study are available on request from the corresponding author. The data are not publicly available due to our collaborating institutions still utilizing part of the data.

Conflicts of Interest

The authors declare no conflicts of interest.

References

  1. Mueller, N.D.; Gerber, J.S.; Johnston, M.; Ray, D.K.; Ramankutty, N.; Foley, J.A. Closing yield gaps through nutrient and water management. Nature 2012, 490, 254–257. [Google Scholar] [CrossRef] [PubMed]
  2. Croft, H.; Chen, J.M.; Luo, X.; Bartlett, P.; Chen, B.; Staebler, R.M. Leaf chlorophyll content as a proxy for leaf photosynthetic capacity. Glob. Chang. Biol. 2017, 23, 3513–3524. [Google Scholar] [CrossRef] [PubMed]
  3. Justes, E.; Mary, B.; Meynard, H.M.; Machet, J.M.; Thelier-Huche, L. Determination of a critical nitrogen dilution curve for winter wheat crops. Ann. Bot. 1994, 74, 397–407. [Google Scholar] [CrossRef]
  4. Zhu, Z.L.; Chen, D.L. Nitrogen fertilizer use in China—Contributions to food production, impacts on the environment and best management strategies. Nutr. Cycl. Agroecosyst. 2002, 63, 117–127. [Google Scholar] [CrossRef]
  5. Zhao, B.; Ata-Ul-Karim, S.T.; Duan, A.; Liu, Z.; Wang, X.; Xiao, J.; Liu, Z.; Qin, A.; Ning, D.; Zhang, W.; et al. Determination of critical nitrogen concentration and dilution curve based on leaf area index for summer maize. Field Crops Res. 2018, 228, 195–203. [Google Scholar] [CrossRef]
  6. Du, R.; Chen, J.; Xiang, Y.; Zhang, Z.; Yang, N.; Yang, X.; Tang, Z.; Wang, H.; Wang, X.; Shi, H.; et al. Incremental learning for crop growth parameters estimation and nitrogen diagnosis from hyperspectral data. Comput. Electron. Agric. 2023, 215, 108356. [Google Scholar] [CrossRef]
  7. Hedley, C. The role of precision agriculture for improved nutrient management on farms. J. Sci. Food Agric. 2015, 95, 12–19. [Google Scholar] [CrossRef]
  8. Wang, Y.; Shi, P.; Ji, R.; Min, J.; Shi, W.; Wang, D. Development of a model using the nitrogen nutrition index to estimate in-season rice nitrogen requirement. Field Crops Res. 2020, 245, 107664. [Google Scholar] [CrossRef]
  9. Lemaire, G.; Salette, J.; Sigogne, M.; Terrasson, J. Relation entre dynamique de croissance et dynamique de prélèvement d’azote pour un peuplement de graminées fourragères. I.—Etude de l’effet du milieu. Agronomie 1984, 4, 423–430. [Google Scholar] [CrossRef]
  10. Cao, Q.; Miao, Y.; Feng, G.; Gao, X.; Li, F.; Liu, B.; Yue, S.; Cheng, S.; Ustin, S.L.; Khosla, R. Active canopy sensing of winter wheat nitrogen status: An evaluation of two sensor systems. Comput. Electron. Agric. 2015, 112, 54–67. [Google Scholar] [CrossRef]
  11. Sheehy, J.E.; Dionora, M.; Mitchell, P.L.; Peng, S.; Cassman, K.G.; Lemaire, G.; Williams, R. Critical nitrogen concentrations: Implications for high-yielding rice (Oryza sativa L.) cultivars in the tropics. Field Crops Res. 1998, 59, 31–41. [Google Scholar] [CrossRef]
  12. Shi, P.; Wang, Y.; Xu, J.; Zhao, Y.; Yang, B.; Yuan, Z.; Sun, Q. Rice nitrogen nutrition estimation with RGB images and machine learning methods. Comput. Electron. Agric. 2020, 180, 105860. [Google Scholar] [CrossRef]
  13. Plénet, D.; Lemaire, G. Relationships between dynamics of nitrogen uptake and dry matter accumulation in maize crops. Determination of critical N concentration. Plant Soil. 2000, 216, 65–82. [Google Scholar] [CrossRef]
  14. Zhao, B.; Tahir, A.; Yao, X.; Tian, Y.C.; Cao, W.X.; Zhu, Y.; Liu, X.; Manuel, R. A new curve of critical nitrogen concentration based on spike dry matter for winter wheat in eastern china. PLoS ONE 2016, 11, 0164545. [Google Scholar] [CrossRef] [PubMed]
  15. Li, D.; Chen, J.M.; Yan, Y.; Zheng, H.; Yao, X.; Zhu, Y.; Cao, W.; Cheng, T. Estimating leaf nitrogen content by coupling a nitrogen allocation model with canopy reflectance. Rem. Sens. Environ. 2022, 283, 113314. [Google Scholar] [CrossRef]
  16. Li, R.; Wang, D.; Zhu, B.; Liu, T.; Sun, C.; Zhang, Z. Estimation of nitrogen content in wheat using indices derived from RGB and thermal infrared imaging. Field Crops Res. 2022, 289, 108735. [Google Scholar] [CrossRef]
  17. Fitzgerald, G.J.; Rodríguez, D.; O’Leary, G. Measuring and predicting canopy nitrogen nutrition in wheat using a spectral index—The canopy chlorophyll content index (CCCI). Field Crops Res. 2010, 116, 318–324. [Google Scholar] [CrossRef]
  18. Niinemets, Ü. Variation in leaf photosynthetic capacity within plant canopies: Optimization, structural, and physiological constraints and inefficiencies. Photosynth Res. 2023, 158, 131–149. [Google Scholar] [CrossRef]
  19. Parker, G.G. Tamm review: Leaf Area Index (LAI) is both a determinant and a consequence of important processes in vegetation canopies. Forest Ecol. Manag. 2020, 31, 118–128. [Google Scholar] [CrossRef]
  20. Wei, H.; Geng, X.; Xiang, Z.; Wang, Z.; Xubin, Z.; Chen, Y.; Huo, Z.; Zhou, G.; Meng, T.; Qigen, D. Grain Yield, Biomass Accumulation, and Leaf Photosynthetic Characteristics of Rice under Combined Salinity-Drought Stress. Rice Sci. 2023, 1, 118–128. [Google Scholar]
  21. Jeuffroy, M.H.; Ney, B.; and Oury, A. Integrated physiological and agronomic modeling of N capture and use within the plant. J. Exp. Bot. 2002, 53, 809–823. [Google Scholar] [CrossRef] [PubMed]
  22. Lemaire, G.; van Oosterom, E.; Sheehy, J.; Jeuffroy, M.H.; Massignam, A.; Rossato, L. Is crop demand more closely related to dry matter accumulation or leaf area expansion during vegetative growth? Field Crops Res. 2007, 100, 91–106. [Google Scholar] [CrossRef]
  23. Xu, H.; He, H.; Yang, K.; Ren, H.; Zhu, T.; Ke, J.; You, C.; Guo, S.; Wu, L. Application of the nitrogen nutrition index to estimate the yield of indica hybrid rice grown from machine-transplanted bowl seedlings. Agronomy 2022, 12, 742. [Google Scholar] [CrossRef]
  24. Eickhout, B.; Bouwman, A.F.; and Zeijts, H.V. The role of nitrogen in world food production and environmental sustainability. Agric. Ecosys. Environ. 2006, 116, 4–14. [Google Scholar] [CrossRef]
  25. Moharana, S.; Dutta, S. Spatial variability of chlorophyll and nitrogen content of rice from hyperspectral imagery. ISPRS J. Photogramm. Rem. Sens. 2016, 122, 17–29. [Google Scholar] [CrossRef]
  26. Fourty, T.; Baret, F.; Jacquemoud, S.; Schmuck, G.; Verdebout, J. Leaf optical properties with explicit description of its biochemical composition: Direct and inverse problems. Remote Sens. Environ. 1996, 56, 104–117. [Google Scholar] [CrossRef]
  27. Gianquinto, G.; Orsini, F.; Fecondini, M.; Mezzetti, M.; Sambo, P.; Bona, S. A methodological approach for defining spectral indices for assessing tomato nitrogen status and yield. Eur. J. Agron. 2011, 35, 135–143. [Google Scholar] [CrossRef]
  28. Nguyen, H.T.; Lee, B. Assessment of rice leaf growth and nitrogen status by hyperspectral canopy reflectance and partial least square regression. Eur. J. Agron. 2006, 24, 349–356. [Google Scholar] [CrossRef]
  29. Cui, H.; Luo, Y.; Li, C.; Chang, Y.; Jin, M.; Li, Y.; Wang, Z. Effects of nitrogen forms on nitrogen utilization, yield, and quality of two wheat varieties with different gluten characteristics. Eur. J. Agron. 2023, 149, 126919. [Google Scholar] [CrossRef]
  30. Field, C.B.; Mooney, H.A. The photosynthesisp–nitrogen relationship in wild plants. In On the eEconomy of Plant Form and Function; Givnish, T.J., Ed.; Cambridge University Press: Cambridge, UK, 1986; pp. 25–55. [Google Scholar]
  31. Gitelson, A.A.; Keydan, G.P.; Merzlyak, M.N. Three-band model for noninvasive estimation of chlorophyll, carotenoids, and anthocyanin contents in higher plant leaves. Geophys. Res. Lett. 2006, 33, L11402. [Google Scholar] [CrossRef]
  32. Gitelson, A.A.; Viña, A.; Arkebauer, T.J.; Rundquist, D.C.; Keydan, G.; Leavitt, B. Estimation of Leaf Area Index and Green Leaf Biomass in Maize Canopies. Geophys. Res. Lett. 2003, 30, 1248. [Google Scholar] [CrossRef]
  33. Berger, K.; Verrelst, J.; Féret, J.; Wang, Z.; Wocher, M.; Strathmann, M.; Danner, M.; Mauser, W.; Hank, T.B. Crop nitrogen monitoring: Recent progress and principal developments in the context of imaging spectroscopy missions. Remote Sens. Environ. 2020, 242, 111758. [Google Scholar] [CrossRef] [PubMed]
  34. Evans, J.R. Nitrogen and photosynthesis in the flag leaf of wheat (Triticum aestivum L.). Plant Physiol. 1983, 72, 297–302. [Google Scholar] [CrossRef] [PubMed]
  35. Evans, J.R. Photosynthesis and nitrogen relationships in leaves of C3 plants. Oecologia 1989, 78, 9–19. [Google Scholar] [CrossRef] [PubMed]
  36. Lu, Y.; Zhang, X.; Cui, Y.; Chao, Y.; Song, G.; Nie, C.; Wang, L. Response of different varieties of maize to nitrogen stress and diagnosis of leaf nitrogen using hyperspectral data. Sci. Rep. 2023, 13, 5890. [Google Scholar] [CrossRef]
  37. Homolová, L.; Malenovský, Z.; Clevers, J.G.P.W.; García-Santos, G.; Schaepman, M.E. Review of optical-based remote sensing for plant trait mapping. Ecol. Complex. 2013, 15, 1–16. [Google Scholar] [CrossRef]
  38. Féret, J.-B.; Gitelson, A.A.; Noble, S.D.; Jacquemoud, S. PROSPECT-D: Towards modeling leaf optical properties through a complete lifecycle. Remote Sens. Environ. 2017, 193, 204–215. [Google Scholar] [CrossRef]
  39. Daughtry, C.S.T.; Walthall, C.L.; Kim, M.S.; de Colstoun, E.B.; McMurtrey, J.E. Estimating corn leaf chlorophyll concentration from leaf and canopy reflectance. Remote Sens. Environ. 2000, 74, 229–239. [Google Scholar] [CrossRef]
  40. Zhu, W.; Sun, Z.; Yang, T.; Li, J.; Peng, J.; Zhu, K.; Li, S.; Gong, H.; Lyu, Y.; Li, B.; et al. Estimating leaf chlorophyll content of crops via optimal unmanned aerial vehicle hyperspectral data at multi-scales. Comput. Electron. Agric. 2020, 178, 105786. [Google Scholar] [CrossRef]
  41. Wang, X.; Yan, S.; Wang, W.; Yin, L.; Li, M.; Yu, Z.; Chang, S.; Hou, F. Monitoring leaf area index of the sown mixture pasture through UAV multispectral image and texture characteristics. Comput. Electron. Agric. 2023, 214, 108333. [Google Scholar] [CrossRef]
  42. Zhang, J.; Qiu, X.; Wu, Y.; Zhu, Y.; Cao, Q.; Liu, X.; Cao, W. Combining texture, color, and vegetation indices from fixed-wing UAS imagery to estimate wheat growth parameters using multivariate regression methods. Comput. Electron. Agric. 2021, 185, 106138. [Google Scholar] [CrossRef]
  43. Maimaitijiang, M.; Sagan, V.; Sidike, P.; Hartling, S.; Esposito, F.; Fritschi, F.B. Soybean yield prediction from UAV using multimodal data fusion and deep learning. Remote Sens. Environ. 2020, 237, 111599. [Google Scholar] [CrossRef]
  44. Sibanda, M.; Mutanga, O.; Rouget, M.; Kumar, L. Estimating Biomass of Native Grass Grown under Complex Management Treatments Using WorldView-3 Spectral Derivatives. Remote Sens. 2017, 9, 55. [Google Scholar] [CrossRef]
  45. Yang, M.-D.; Huang, K.-S.; Kuo, Y.-H.; Tsai, H.; Lin, L.-M. Spatial and Spectral Hybrid Image Classification for Rice Lodging Assessment through UAV Imagery. Remote Sens. 2017, 9, 583. [Google Scholar] [CrossRef]
  46. Qiao, L.; Zhao, R.; Tang, W.; An, L.; Sun, H.; Li, M.; Wang, N.; Liu, Y.; Liu, G. Estimating maize LAI by exploring deep features of vegetation index map from UAV multispectral images. Field Crops Res. 2022, 289, 108739. [Google Scholar] [CrossRef]
  47. Zhang, C.; Yi, Y.; Wang, L.; Zhang, X.; Chen, S.; Su, Z.; Zhang, S.; Xue, Y. Estimation of the Bio-Parameters of Winter Wheat by Combining Feature Selection with Machine Learning Using Multi-Temporal Unmanned Aerial Vehicle Multispectral Images. Remote. Sens. 2024, 16, 469. [Google Scholar] [CrossRef]
  48. Chen, L.; Lin, L.; Cai, G.; Sun, Y.; Huang, T.; Wang, K.; Deng, J. Identification of nitrogen, phosphorus, and potassium deficiencies in rice based on static scanning technology and hierarchical identification method. PLoS ONE 2014, 9, e113200. [Google Scholar] [CrossRef]
  49. Rischbeck, P.; Elsayed, S.; Mistele, B.; Barmeier, G.; Heil, K.; Schmidhalter, U. Data fusion of spectral, thermal and canopy height parameters for improved yield prediction of drought stressed spring barley. Eur. J. Agron. 2016, 78, 44–59. [Google Scholar] [CrossRef]
  50. Guo, J.X.; Tian, G.L.; Zhou, Y.; Wang, M.; Ling, N.; Shen, Q.R.; Guo, S.W. Evaluation of the grain yield and nitrogen nutrient status of wheat (Triticum aestivum L.) using thermal imaging. Field Crop Res. 2016, 196, 463–472. [Google Scholar] [CrossRef]
  51. Makino, A.; Osmond, B. Effects of nitrogen nutrition on nitrogen partitioning between chloroplasts and mitochondria in pea and wheat. Plant Physiol. 1991, 96, 355–362. [Google Scholar] [CrossRef]
  52. Lemaire, G.; Jeuffroy, M.-H.; Gastal, F. Diagnosis tool for plant and crop N status in vegetative stage: Theory and practices for crop N management. Eur. J. Agron. 2008, 28, 614–624. [Google Scholar] [CrossRef]
  53. Li, F.; Miao, Y.; Feng, G.; Yuan, F.; Yue, S.; Gao, X.; Liu, Y.; Liu, B.; Ustin, S.L.; Chen, X. Improving estimation of summer maize nitrogen status with red edge-based spectral vegetation indices. Field Crops Res. 2014, 157, 111–123. [Google Scholar] [CrossRef]
  54. Yang, N.; Zhang, Z.; Zhang, J.; Guo, Y.; Yang, X.; Yu, G.; Bai, X.; Chen, J.; Chen, Y.; Shi, L.; et al. Improving estimation of maize leaf area index by combining of UAV-based multispectral and thermal infrared data: The potential of new texture index. Comput. Electron. Agric. 2023, 214, 108294. [Google Scholar] [CrossRef]
  55. Rondeaux, G.; Steven, M.; Baret, F. Optimization of soil-adjusted vegetation indices. Remote Sens. Environ. 1996, 55, 95–107. [Google Scholar] [CrossRef]
  56. Haboudane, D.; Miller, J.R.; Tremblay, N.; Zarco-Tejada, P.J.; Dextraze, L. Integrated narrow-band vegetation indices for prediction of crop chlorophyll content for application to precision agriculture. Remote Sens. Environ. 2002, 81, 416–426. [Google Scholar] [CrossRef]
  57. Bendig, J.; Yu, K.; Aasen, H.; Bolten, A.; Bennertz, S.; Broscheit, J.; Gnyp, M.L.; Bareth, G. Combining UAV-based plant height from crop surface models, visible, and near infrared vegetation indices for biomass monitoring in barley. Int. J. Appl. Earth Observ. Geoinformation. 2015, 39, 79–87. [Google Scholar] [CrossRef]
  58. Louhaichi, M.; Borman, M.M.; Johnson, D.E. Spatially located platform and aerial photography for documentation of grazing impacts on wheat. Geocarto Int. 2008, 16, 65–70. [Google Scholar] [CrossRef]
  59. Elsayed, S.; Rischbeck, P.; Schmidhalter, U. Comparing the performance of active and passive reflectance sensors to assess the normalized relative canopy temperature and grain yield of drought-stressed barley cultivars. Field Crop Res. 2015, 177, 148–160. [Google Scholar] [CrossRef]
  60. Haralick, R.M.; Shanmugam, K.S.; Dinstein, I. Textural Features for Image Classification. IEEE Trans. Syst. Man Cybern. 1973, 3, 610–621. [Google Scholar] [CrossRef]
  61. Lang, Q.; Dehua, G.; Junyi, Z.; Minzan, L.; Hong, S.; Junyong, M. Dynamic influence elimination and chlorophyll content diagnosis of maize using UAV spectral imagery. Remote Sens. 2020, 12, 162650. [Google Scholar] [CrossRef]
  62. Ali, A.; Imran, M.M. Evaluating the potential of red edge position (REP) of hyperspectral remote sensing data for real time estimation of LAI and chlorophyll content of kinnow mandarin (Citrus reticulata) fruit orchards. Sci. Hortic. 2020, 267, 109326. [Google Scholar] [CrossRef]
  63. Kipp, S.; Mistele, B.; Schmidhalter, U. The performance of active spectral reflectance sensors as influenced by measuring distance, device temperature and light intensity. Comput. Electron. Agric. 2014, 100, 24–33. [Google Scholar] [CrossRef]
  64. Huang, S.; Miao, Y.; Zhao, G.; Yuan, F.; Ma, X.; Tan, C.; Yu, W.; Gnyp, M.; Lenz Wiedemann, V.; Rascher, U.; et al. Satellite remote sensing-based inseason diagnosis of rice nitrogen status in Northeast China. Rem. Sens. 2015, 7, 10646–10667. [Google Scholar] [CrossRef]
  65. Clevers, J.G.P.W.; Kooistra, L. Using hyperspectral remote sensing data for retrieving canopy chlorophyll and nitrogen content. IEEE JSTARS 2012, 5, 574–583. [Google Scholar] [CrossRef]
  66. Mulero, G.; Bacher, H.; Kleiner, U.; Peleg, Z.; Herrmann, I. Spectral estimation of in vivo wheat chlorophyll a/b ratio under contrasting water availabilities. Rem. Sens. 2022, 14, 2585. [Google Scholar] [CrossRef]
  67. Li, X.; Ata-UI-Karim, S.T.; Li, Y.; Yuan, F.; Miao, Y.; Yoichiro, K.; Cheng, T.; Tang, L.; Tian, X.; Liu, X.; et al. Advances in the estimations and applications of critical nitrogen dilution curve and nitrogen nutrition index of major cereal crops. A review. Comput. Electron. Agric. 2022, 197, 106998. [Google Scholar] [CrossRef]
Figure 1. Maize experiment conducted in the Agricultural Demonstration Zone of Wugong County, Shaanxi Province, China. Planting zoning map (a) and morphological characteristics of summer maize throughout the growth period (b).
Agriculture 14 02004 g001
Figure 2. Evaluation of maize LAI and LCC estimation models based on multispectral data. (a,b) represent the evaluation metrics of different models for estimating LAI performance (R2 and RMSE, respectively); (c,d) represent the evaluation metrics of different models for estimating LCC performance (R2 and RMSE, respectively).
Agriculture 14 02004 g002aAgriculture 14 02004 g002b
Figure 3. The R2 and RMSE in the estimation of LAI using machine learning algorithms.
Agriculture 14 02004 g003
Figure 4. The R2 and RMSE in the estimation of LCC using machine learning algorithms.
Agriculture 14 02004 g004
Figure 5. Dynamic estimation of LAI and LCC using CNN model based on the fusion of MS and TIR data.
Agriculture 14 02004 g005
Figure 6. Spatial distribution maps of LAI and LCC estimated based on UAV multispectral and thermal infrared information across six growth stages.
Agriculture 14 02004 g006aAgriculture 14 02004 g006b
Figure 7. Dynamic changes in nitrogen nutrition index (NNI) under different nitrogen application rates across various water treatments for 2022–2023. (ac) are calculated NNIs based on experimental measurements under W0, W1, and W2 treatments; (df) are calculated NNIs based on remote sensing estimation under W0, W1, and W2 treatments.
Agriculture 14 02004 g007
Table 1. Summary of features extracted from multispectral and thermal infrared imagery.
ImagesFeaturesFormulationReferences
MS
(spectral information)
Green, Red, Blue, Red-edge, Near-infraredRaw reflectance of each band/
Normalized difference vegetation indexNDVI = (NIR − R)/(NIR + R)[49]
Normalized difference red-edgeNDRE = (NIR − RE)/(NIR + RE)[32]
Optimized soil-adjusted vegetation indexOSAVI = (NIR − R)/(NIR − R + L) (L = 0.16)[55]
Modified chlorophyll absorption in the reflectance indexMCARI = [(RE − R) − 0.2(RE − G)](RE/R)[39]
Red edge chlorophyll indexCIred edge = (NIR/Red Edge) − 1[32]
Transformed chlorophyll absorption in the reflectance indexTCARI = 3[(RE − R) − 0.2(RE − G)(RE/R)][56]
Green chlorophyll indexCIgreen = (NIR/G) − 1[32]
Red green blue vegetation indexRGBVI = (G2 − B × R2)/(G2 + B × R2)[57]
Green leaf indexGLI = (2G − R + B)/(2G + R + B)[58]
Green leaf algorithmGLA = (2G − R − B)/(2G + R + B)[58]
TIR information)Normalized relative canopy temperatureNRCT = (Ti − Tmin)/(Ti − Tmax)[59]
MS and TIRGray-level co-occurrence matrixCON, ENT, VAR, MEA, HOM, DIS, SEM, COR[60]
Table 2. Summary of the features extracted from multispectral and thermal infrared imagery.
StagesSeedingInitial JointingLate JointingTasselingInitial FillingLate Filling
VIsLAILCCLAILCCLAILCCLAILCCLAILCCLAILCC
NDVI0.230.43 **0.42 **0.53 ***0.64 ***0.57 ***0.45 ***0.49 ***0.45 ***0.36 **0.29 *0.34 *
NDRE0.35 *0.44 ***0.47 ***0.61 ***0.60 ***0.59 ***0.50 ***0.57 ***0.50 ***0.44 ***0.230.45 ***
OSAVI0.230.42 **0.42 **0.53 ***0.63 ***0.57 ***0.43 **0.51 ***0.46 ***0.37 **0.260.35 **
MCRAI0.190.31 *0.37 **0.46 ***0.59 ***0.52 ***0.27 *0.31 *0.38 **0.29 *0.240.28 *
CIred-edge0.32 *0.49 ***0.51 ***0.60 ***0.59 ***0.58 ***0.49 ***0.54 **0.48 ***0.46 ***0.240.46 ***
TCARI0.180.30 *0.38 **0.47 ***0.53 ***0.45 ***0.120.230.39 **0.240.32 *0.21
CIgreen0.29 *0.48 ***0.46 ***0.57 ***0.63 ***0.59 ***0.48 ***0.47 ***0.51 ***0.41 **0.260.38 **
RGBVI0.170.4 **0.38 **0.47 ***0.64 ***0.49 ***0.39 **0.53 ***0.34 *0.28 *0.240.16
GLI0.110.33 *0.30 *0.35 *0.56 ***0.34 *0.170.29 **0.270.190.180.11
GI0.120.31 *0.31 *0.39 **0.58 ***0.46 ***0.36 **0.51 ***0.35 **0.270.28 *0.21
Notes: * represents p < 0.05, ** represents p < 0.01, *** represents p < 0.001.
Table 3. Correlation between the textural information from the UAV MS and TIR and maize LAI and LCC at all growth stages.
NumberTextureCorrelation CoefficientNumberTextureCorrelation Coefficient
LAILCC LAILCC
1MEAB−0.60 ***−0.57 ***25DISB−0.57 ***−0.44 ***
2MEAG−0.58 ***−0.55 ***26DISG−0.47 ***−0.31 ***
3MEAR−0.61 ***−0.57 ***27DISR−0.66 ***−0.53 ***
4MEARE−0.52 ***−0.53 ***28DISRE0.51 ***0.50 ***
5MEANIR0.41 ***0.35 ***29DISNIR0.62 ***0.63 ***
6MEATIR−0.56 ***−0.52 ***30DISTIR−0.72 ***−0.62 ***
7VARB−0.53 ***−0.36 ***31ENTB−0.73 ***−0.63 ***
8VARG−0.34 ***−0.18 **32ENTG−0.65 ***−0.53 ***
9VARR−0.67 ***−0.48 ***33ENTR−0.76 ***−0.68 ***
10VARRE0.58 ***0.55 ***34ENTRE0.100.14 *
11VARNIR0.65 ***0.61 ***35ENTNIR0.53 ***0.62 ***
12VARTIR−0.68 ***−0.55 ***36ENTTIR−0.60 ***−0.58 ***
13HOMB0.69 ***0.57 ***37SECB0.74 ***0.64 ***
14HOMG0.56 ***0.44 ***38SECG0.68 ***0.55 ***
15HOMR0.74 ***0.64 ***39SECR0.75 ***0.68 ***
16HOMRE−0.34 ***−0.37 ***40SECRE0.040.07
17HOMNIR−0.54 ***−0.60 ***41SECNIR−0.50 ***−0.59 ***
18HOMTIR0.69 ***0.64 ***42SECTIR0.680.66
19CONB−0.48 ***−0.31 ***43CORB−0.30 ***−0.09
20CONG−0.27 ***−0.13 *44CORG−0.17 **0.07
21CONR−0.53 ***−0.37 ***45CORR−0.58 ***−0.36 ***
22CONRE0.51 ***0.47 ***46CORRE0.120.20 ***
23CONNIR0.66 ***0.59 ***47CORNIR0.090.30 ***
24CONTIR−0.69 ***−0.58 ***48CORTIR−0.61 ***−0.43 ***
Notes: * represents p < 0.05, ** represents p < 0.01, *** represents p < 0.001.
Table 4. Evaluation of the maize LAI and LCC estimation models based on the fusion of UAV MS and TIR data.
Growth StagesSeedingInitial JointingLate JointingTasselingInitial FillingLate FillingAll Stages
LAIPLSR20.5780.6650.6990.6320.6930.6840.918
RMSE0.0190.0910.2040.4500.3260.3190.489
CNNR20.7060.8630.8450.7340.8370.8110.971
RMSE0.0150.0590.1490.3910.2380.2500.316
RFR20.6650.7480.7260.7150.7320.7330.922
RMSE0.0170.0780.2060.4060.3100.2940.483
LCC
(μg/cm2)
PLSR20.5430.6130.6890.6050.6700.7290.893
RMSE3.1363.3823.5713.7792.9232.9754.713
CNNR20.7540.7830.8520.7050.8160.7940.957
RMSE2.3022.4942.4983.3162.3512.4312.958
RFR20.6810.7040.7750.6650.7480.7740.935
RMSE2.8033.2643.0453.5032.5382.7633.659
Disclaimer/Publisher’s Note: The statements, opinions and data contained in all publications are solely those of the individual author(s) and contributor(s) and not of MDPI and/or the editor(s). MDPI and/or the editor(s) disclaim responsibility for any injury to people or property resulting from any ideas, methods, instructions or products referred to in the content.