Article

Enhancing Phenolic Profiles in ‘Cabernet Franc’ Grapes Through Chitooligosaccharide Treatments: Impacts on Phenolic Compounds Accumulation Across Developmental Stages

1
Gansu Key Laboratory of Viticulture and Enology, College of Food Science and Engineering, Gansu Agricultural University, Lanzhou 730070, China
2
Lanzhou Customs Integrated Technology Center, Lanzhou 730030, China
*
Author to whom correspondence should be addressed.
Agriculture 2024, 14(11), 2039; https://doi.org/10.3390/agriculture14112039
Submission received: 5 October 2024 / Revised: 8 November 2024 / Accepted: 11 November 2024 / Published: 12 November 2024
(This article belongs to the Section Agricultural Product Quality and Safety)

Abstract

:
High-quality grape raw materials are fundamental for producing premium wine. Ensuring the quality of grape raw materials, particularly enhancing their phenolic profiles, significantly improves wine flavor. Therefore, this study focused on ‘Cabernet Franc’ grapes, where a 0.1% chitooligosaccharide (COS) solution was foliar sprayed during the green pea stage, the onset of veraison stage, and the mid-ripening stage to investigate the impact of exogenous COS treatment on the accumulation of phenolic compounds in grape berries. The results revealed that COS treatment during the green pea and the onset of veraison stages significantly increased the levels of total phenolic, total flavonoid, and total anthocyanin in grapes, with distinct effects on flavanols, phenolic acids, flavonols, and stilbenes, respectively. Eight key compounds most significantly influenced by the treatment were identified through orthogonal partial least squares discriminant analysis (OPLS-DA) and machine learning screening. Specifically, treatment during the green pea stage had a significant impact on total soluble solids, proanthocyanidin B1, catechin, and vanillic acid, while veraison treatment notably affected petunidin-3-O-(6″-O-p-coumaryl)-glucoside, cyanidin-3-O-(6″-O-p-coumaryl)-glucoside, cyanidin-3-O-glucoside and isorhamnetin. This study could provide valuable data references and theoretical support for applying COS in wine grapes and regulating high-quality raw materials.

1. Introduction

Premium grape raw materials constitute the foundation for the production of exceptional wines. Among these, phenolic compounds—essential constituents of grapes and wine—play a critical role in imparting diverse colors, flavors, and aromatic characteristics [1]. Consequently, they are regarded as preferred indicators for evaluating the quality of grape raw materials. However, the intensifying challenge posed by climate change, characterized by rising global temperatures, profoundly influences viticultural ecosystems and the availability of premium grape raw materials. Research published in Nature [2] indicates that severe drought and heat conditions harm grapes’ production of phenolic compounds. The outcome mentioned above is particularly evident in the arid regions of western China, including Xinjiang and Gansu provinces, which play a crucial role in the nation’s rapidly expanding wine industry. To tackle these challenges, viticulturists and researchers are meticulously choosing grape cultivars [3], implementing fruit bagging techniques [4], and adjusting agricultural practices to optimize yields—such as load management [5] and deficit irrigation [6]—while actively exploring the application of bioinducers [7] to enhance the phenolic profile of grapes. Among these solutions, the application of bioinducers emerges as a particularly promising strategy, distinguished by their ability to confer enhanced disease resistance in plants while concurrently improving fruit sensory quality.
Bioinducers, which encompass a diverse array of chemical and biological agents, are recognized for their ability to induce physiological adaptations in organisms. Bioinducers include abiotic inducers, such as metal ions and inorganic molecules, as well as biotic elicitors derived from microorganisms—including fungi, bacteria, and viruses—and plant-derived substances, such as cell wall components (e.g., exopolysaccharides, chitosan, COS) [8]. Additionally, bioinducers refer to phytochemicals released by plants at the sites of pathogen or herbivore attacks, such as salicylic acid and jasmonic acid, which play a crucial role in the plant’s defense mechanisms. In grapevines, bioinducers not only enhance the concentration of defense-related stilbenes but also stimulate anthocyanin synthesis, thereby improving fruit pigmentation and the quality of wine color [9,10]. Pre-harvest treatments utilizing methyl jasmonate (MeJA) and benzothiadiazole (BTH) have been demonstrated to significantly enhance the levels of 3-O-glucoside anthocyanins, including malvidin, cyanidin, petunidin, and peonidin, thereby preserving pigment stability in both the fruit and the resultant wine [11]. Furthermore, bioinducers can modulate flavanol synthesis and promote the biosynthesis of aromatic compounds, contributing to wine color stabilization and enhancing overall sensory quality [12,13,14]. For example, the application of gibberellin, abscisic acid, and chitosan has been demonstrated to improve the concentrations of compounds such as ethyl acetate, ethyl butyrate, 2-hexen-1-ol, 2-hexenal, terpenes, and limonene in grapes. This result increases the catechin, epicatechin, and proanthocyanidin B2 levels while amplifying their floral and fruity aromas in the grapes and the resulting wines [14,15].
The synthesis of phenolic compounds is influenced by the type of bioinducers applied and the application timing during different stages of grape development. For example, research by Sáenz [16] has indicated that the application of MeJA during the veraison and mid-ripening stages of grape development leads to a more effective increase in the content of hydroxycinnamic acid derivatives in grape berries when applied at mid-ripening as opposed to veraison. In contrast, Miliordos’ [17] findings suggest that the application of abscisic acid and chitosan during veraison can positively regulate the expression of genes in the phenylpropanoid pathway in grapes, thereby promoting the accumulation of anthocyanins, flavonols, and stilbenoids. Furthermore, Gomes [18] has discovered that the use of salicylic acid during the green pea stage and veraison significantly enhances the accumulation of chlorogenic and gallic acids in grapes, which may conjecturally have a positive impact on the antioxidant capacity and sensory quality of the resulting wine.
Chitooligosaccharides (COS), widely studied as bioinducers, can be obtained through the deacetylation of chitosan under specific conditions. Generally, COS consists of 2 to 10 units of N-acetylglucosamine or glucosamine linked by β-1,4-glycosidic bonds and are known for their safety, environmental friendliness, water solubility, affordability, and high biological activity [19]. Previous studies have demonstrated that the pre-harvest spraying of COS on strawberries significantly boosts the levels of total anthocyanin and flavonoid [20]; in the case of apricots during the end of storage, the application of COS is associated with an increase in the concentration of flavonoid substances such as catechin, epicatechin, quercetin-3-O-glucoside, and rutin [21]. Additionally, during the ripening process of pears, COS treatment has been found to enhance the synthesis of phenolic acids like cinnamic acid, p-coumaric acid, caffeic acid, and ferulic acid within the phenylpropanoid metabolism pathway [22]. Extensive research has elucidated the role of COS in bolstering stress resistance and modulating the synthesis of phenolic compounds across various plants. However, exploring COS applications in viticulture, specifically regarding wine grapes, is still in its infancy. To the best of our knowledge, research on the influence of pre-harvest COS treatments on the phenolic profiles of wine grape berries, and specifically the effects of applying COS at various grape developmental stages, has not yet been reported.
The Hexi Corridor region in Gansu Province, located in the warm climate of northwestern China, serves as a crucial transportation hub along the Belt and Road Initiative. This region is considered ideal for grape cultivation, boasting at least a two-thousand-year viticulture and wine production history. However, the rising temperatures and intense sunlight are increasingly preventing the phenolic compounds in grapes from reaching optimal maturity at harvest, thereby limiting the final quality of the local grapes and wines. Therefore, in this study, ‘Cabernet Franc’ grapes from the Hexi Corridor region were chosen as experimental material. Treatments were administered using COS solutions of specified concentrations at key phenological stages, including the green pea stage, the onset of veraison, and the mid-ripening period. Spectrophotometric analysis and high-performance liquid chromatography-mass spectrometry were employed to conduct comparative analyses of phenolic content in grapes during ripening. This study preliminarily investigates the effects of COS treatment at different developmental stages on grape berry quality and the accumulation of phenolic metabolites, aiming to provide theoretical reference and data support for using COS in enhancing grape fruit quality and regulating high-quality wine raw materials.

2. Materials and Methods

2.1. Grape Samples Plant Material and Open-Field Treatments

COS (molecular weight ≤ 3000 Da, degree of deacetylation > 85% DD, degree of polymerization 2–20, Hailongyuan Biotechnology Co., Ltd., Weifang, China).
The experiment was carried out in 2022 at a commercial vineyard of Gansu Huangtai Wine-Marketing Industry Co., Ltd., located in Wuwei, Gansu, China (102°90′46′′ N, 37°85′05′′ E, with an arid and semi-arid continental climate), Vines of ‘Cabernet Franc’ (Vitis vinifera L., self-rooted) were planted at a level of 5000 vines/ha, with a spacing of 1.0 m between the vines and 3.0 m between rows. Standard vineyard management practices were applied throughout the growing season, including pruning, irrigation, fertilization, pesticide application, and nutrient management.
The experiment used a completely randomized block system comprising three replicates of 30 grapevines each. We applied a 0.1% COS solution (with 0.1% Tween 80 as a wetting agent) to the entire canopy of grapevines using an electric sprayer during the green pea stage (GC, EL-32), the onset of veraison (VC, EL-35), and the mid-ripening stage (RC, EL-37), by the EL system of grape growth stages as modified by Coomber [23]. Water containing Tween 80 served as the control treatment (CK). All treated grapevines were harvested at technological ripeness (EL-38). Grape clusters were selected based on uniformity of size, shape, and color, as well as the absence of blemishes; subsequently, samples were collected, rapidly frozen in liquid nitrogen, and stored at −80 °C for subsequent analysis.

2.2. Physicochemical Parameters Measurements

Grape samples of 100 berries each were representatively collected from the 10 kg sample and weighed; then, crushed berries by hand and grape juice were collected to analyze the physicochemical. The determination of total acid (TA, g/L, tartaric acid) and reducing sugars (RS, g/L, glucose) was conducted following the procedures outlined in GB/T 15038-2006 [24], which provides a general analysis method for wine and fruit wine; pH measured by a digital pH meter (PHS-3C; INESA Scientific Instrument Co., Ltd., Shanghai, China); And a digital refractometer (PAL-1; Atago Co. Ltd., Tokyo, Japan) was used to determine the total soluble solids (TSS). The sugar–acid ratio (S/A) is calculated as the ratio of reducing sugars to total acid.

2.3. Colour Indexes Measurements

The CIELAB parameters for the grape juices were measured using D65 illumination and a 10° observer. Deionized water was used as a reference. All the wine samples were filtered through 0.45 µm filters. A glass cuvette with a path length of 2 mm was selected, and a Cary 60 ultraviolet–visible spectrophotometer from Agilent Technologies (Santa Clara, CA, USA) was used to scan the visible light absorption spectrum of the samples from 400 to 780 nm, with a 1 nm scanning interval. The color parameters L*, a*, b*, C*ab, and hab of the wine were determined by calculating the absorbances at 450, 520, 570, and 630 nm. Then, the color difference ΔE*ab was calculated according to the following Formula (1) [25]:
Δ E * a b = ( Δ L * ) 2 + ( Δ a * ) 2 + ( Δ b * ) 2

2.4. UV–Vis Analysis of Phenolic Compounds

Approximately 0.8 g of grape skin and 0.4 g of seed were weighed separately and immersed in 8 mL of a formic acid/methanol/water mixture (1:80:19, v/v/v). The mixture was macerated using an ultrasonic cleaner (KQ-100E, Ultrasonic Instrument Co., Ltd., Kunshan, China) at 300 W for 30 min and then centrifuged at 10,000× g for 10 min. The supernatant was separated, and the pellet was extracted up to three times using the same solvent mixture (8 mL). The supernatants were then combined, and the volume was recorded. Samples were transferred to vials and stored at −20 °C until use.
Total flavonoid (TFD) and total phenolic (TP) contents in grape berries were measured as described by Mhetre and Asghari [26,27], respectively. The total tannin (TT) content of the samples was calculated using the vanillin assay at a wavelength of 510 nm, the absorbance of the samples was recorded, and the content was determined using the standard curve that was developed using diluted (+)-catechin and total flavonol (TFA) content was measured by the method of p-DMACA at 640 nm [25]. The pH-differential method [28] was used to estimate berries’ total anthocyanin (ANT).

2.5. UHPLC-QqQ-MS/MS Analysis of Phenolic Compounds

2.5.1. Extraction of Phenolic Compounds

For the analysis of monomeric anthocyanins, the extraction was performed according to Tian [29] with some modifications. The samples were extracted in KQ-100E ultrasonic cleaning equipment (Ultrasonic Instrument Co., Ltd., Kunshan, China) at 300 W for 10 min and vortexed extraction for 10 min at a Vortex mixer (Ebenson Scientific Instrument Co., Ltd., Hefei, China) after addition of 10 mL of a solution of MeOH/formic acid (98:2) 0.5 g of sample. Then, samples were macerated in an ultrasonic bath (Thermo Fisher Scientific, Waltham, MA, USA) for 10 min and were centrifuged at 10,000× g for 10 min. A second and third extraction of the resulting pellets was completed with the same volume of the solvent mixture (10 mL). The supernatants were combined and evaporated to dryness, then diluted to 10 mL with a constant volume agent. The extraction of non-anthocyanin phenolics, including flavonols, flavanols, phenolic acids, and stilbenes, was conducted following the methods described by Portu [13] and Tian [29], with some modifications. Samples (2.5 g) were immersed in an ethyl acetate aqueous solution (25 mL) in hermetically closed tubes, placed on a Vortex mixer for 10 min, and centrifuged at 4500× g for 10 min. The second and third extraction of the resulting pellets was completed with the same volume of the solvent mixture (10 mL). The non-anthocyanin phenolic compound fraction was dried in a rotary evaporator (30 °C) and resolved in a 10 mL constant volume agent. Each sample was transferred to vials and stored at −20 °C until HPLC analyses were carried out. Before HPLC measurement, the wines were filtered with 0.22 μm ultrafiltration membrane (organic).

2.5.2. UHPLC-QqQ-MS/MS Analysis of Anthocyanins

Non-anthocyanin phenolic compounds were determined and analyzed using a previously described method [17]. Twenty microliters of every sample were injected for HPLC analysis using an Agilent 1290 and triple quadrupole mass spectrometer 6460 (Agilent Technologies, Santa Clara, CA, USA), employing a reversed-phase column Poroshell 120 EC-C18 column (Merck, Darmstadt, Germany) (150 × 2.1 mm, 2.7 μm particle size). The solvent A (formic acid: water = 0.2:100, v/v) or solvent B (formic acid: methanol: Acetonitrile =0.2:50:50, v/v) as solvents at a flow rate of 1 mL/min and the column temperature was set at 30 °C. The mobile phase elution procedures were as follows: 0–18 min, 10–25% B; 18–20 min, 25% B; 20–30 min, 25–40% B; 30–35 min, 40–70% B; and 35–40 min, 70–100% B. MS analyses used Electrospray ionization (ESI), positive ion model, 35 psi nebulizer pressure, 10 mL/min dry gas flow rate, 350 °C dry gas temperature, and 100–1000 m/z scan range. Anthocyanins were quantified using malvidin-3-O-glucoside as standard (Table S1, Supplementary Materials). Concentrations were expressed as mg/kg.

2.5.3. UHPLC-QqQ-MS/MS Analysis of Non-Anthocyanins

Non-anthocyanin phenolic compounds were determined and analyzed using a previously described method [17]. Ten microliters of every sample were injected for HPLC analysis using an Agilent 1290 and triple quadrupole mass spectrometer 6460 (Agilent Technologies, Santa Clara, CA, USA), employing a Zorbax SB-C1 column (Merck, Darmstadt, Germany) (150 × 2.1 mm, 3.5 μm particle size). Solvent A (acetic acid: water = 0.2:100, v/v) or solvent B (acetonitrile) as solvents at a flow rate of 0.2 mL/min, and the column temperature was set at 30 °C. The mobile phase elution procedures were as follows: 0–5 min: 2–7% B; 5–45 min: 7–30% B; 45–46 min: 30–65% B; 46–47 min: 65–95% B; 47–50 min: 95–2% B. MS analyses were used Electrospray ionization (ESI), negative ion model, 30 psi nebulizer pressure, 10 mL/min dry gas flow rate, 350 °C dry gas temperature, and 50–1500 m/z scan range. The quantification of non-anthocyanin phenolic compound was according to the corresponding external standards (Table S2), as described by Wang [30]. The concentrations of those compounds without corresponding standards were estimated using equations of standards with the same functional group and similar numbers of carbon atoms. The concentrations were expressed as mg/kg.

2.6. Statistical Analysis

Statistical procedures were performed with SPSS version 26.0 statistical package (IBM SPSS Inc., Armonk, NY, USA). Data for the different determinations were processed by analysis of variance (ANOVA). Significant differences between means were determined by using Duncan’s test at p < 0.05. Histogram graphics were performed with Origin 9.0 (Microsoft, Redmond, WA, USA). Support Vector Machine-Recursive Feature Elimination and Random Forest were completed using the Wekemo Bioincloud (https://www.bioincloud.tech, accessed on 25 September 2024) [31]. Orthogonal Partial Least Squares-Discriminant Analysis (OPLS-DA) was performed using the Simca 14.1 software program (Umetrics, Umeaa, Sweden). All the experiments were performed using three replicates from the field (biological replicates) and three technical replicates from the lab and expressed as mean ± standard deviation.

3. Results and Discussion

3.1. Effects of COS Treatment on the Physicochemical Parameters

According to Table 1, upon reaching maturity, the average 100-berry weight (100-BW) from grapes subjected to COS treatment during the GC exhibited a substantial increase of 10.84% relative to the untreated control (CK), a contrast to the negligible effects observed in the remaining samples (grapes subjected to COS treatment during the VC and RC, respectively). During the early phase of berry expansion, COS treatment was found to expedite cellular division and foster cell enlargement, culminating in a notable augmentation in berry size [32]. The benefits of COS treatment extend beyond a mere enhancement in yield; it also improves fruit quality. Both RS and TSS—parameters integral to the sensory profile and qualitative attributes of wine grapes [15]—were elevated in fruit after COS treatment across all three developmental stages (although the TSS after VC treatment did not show a statistically significant difference (p > 0.05), it still increased by 7.56% compared to the CK group). Yue [33] has shown that exogenous sugars can be converted into hexoses by specific cell wall enzymes and metabolized, augmenting the sugar concentration within the fruit. In comparison to the CK, the RS following GC and RC samples increased significantly by 12.74% and 10.18%, respectively (p < 0.05), while the VC grapes did not result in a significant change (p > 0.05). This result could be due to glucose signaling’s primary role in regulating anthocyanin biosynthesis and sugar transport, coupled with the grape’s growth dynamics during the veraison period, characterized by rapid pigmentation. It may impede sugar translocation [34]. Additionally, the TA in berries rose post-treatment, with the CK grape showing the lowest acid level at 4.53 g/L, which correlated with a higher pH. The most pronounced acidity was recorded in the GC sample (5.37 g/L); however, high acidity is not synonymous with inferior grape quality, as the optimal grape quality depends on a delicate sugar–acid balance, ideally ranging between 35 and 45 [35]. Therefore, the VC sample (47) achieved a S/A that closely approximated the ideal standard for premium wine grapes, which indicates a more harmonious balance, while the GC grapes (48) also demonstrated similar outcomes. In contrast, the CK (50) and RC (52) treatments exhibited elevated S/A, potentially compromising the flavor profile and color stability of both grapes and wine [36].

3.2. Effects of COS Treatment on the Color Indexes

According to Table 2, pre-harvest application of COS can diminish the L* of Cabernet Franc grape berries. During the GC and VC stages, there was a statistically significant reduction in L* values compared with the CK, averaging around a 3% decline (p < 0.05). In contrast, in berries treated at the RC stage, which did not significantly alter L* values compared to the CK, a trend toward diminished L* was noted (a decrease of 0.38 a.u., p > 0.05). Concomitantly, the treatments altered the chromaticity coordinates a* and b*. Specifically, grapes treated during GC displayed a 26.01% increase in a* values (p < 0.05) and a 16.60% reduction in b* values (p < 0.05) relative to the CK counterparts. VC-treated grapes showed even more pronounced changes, with a* values rising by 30.22% and b* values decreasing by 30.95% (p < 0.05). RC treatment resulted in a significant 9.33% increase in a* values (p < 0.05), with no substantial change in b* values (p > 0.05). Generally, elevated a* values suggest a shift towards red hues, while reduced b* values indicate a tendency towards blue-purple tones [37]. Thus, the pre-harvest treatment of grape berries at three distinct developmental stages led to a more pronounced red-purple coloration, with VC treatment having the most substantial effect. This phenomenon may be linked to the significant accumulation of anthocyanins, which typically increase color change but can be partially degraded by glycosidase and peroxidase in the later stages of berry maturation [38]. Consequently, treatment applied in the RC stage did not significantly enhance coloration.
The hab and C*ab values also suggest that pre-harvest COS treatments stimulate the berries to develop a more uniform and intense red-purple color. VC-treated berries exhibited the lowest hab value and a C*ab value of 6.15% greater than the CK grapes (p < 0.05), indicating higher color saturation and more uniform coloration. Berries treated with GC had similar saturation levels to those treated with VC, albeit with a lighter red-purple hue (a significant decrease of 26.67% in hab value compared to the CK and an increase of 19.57% compared to VC treatment, p < 0.05). The hab of RC-treated berries was slightly higher than the CK ones, with no significant change in C*ab. The value of ∆E*ab revealed pronounced color differentiation in grapes treated during GC and VC (>3 CIELab units) [39], while RC-treated grapes did not exhibit such differentiation (<3). This disparity may be attributable to the diminished efficacy of the bioinducers when applied later in the grape developmental stages. For example, Koyama [40] reported that the application of abscisic acid in the later stages of ‘BRS Melodia’ seedless grape berry development attenuated the expression of VvMYBA1 and VvMYBA2, key transcription factors in anthocyanin biosynthesis, culminating in delayed grape maturation and sluggish color development.

3.3. Effects of COS Treatment on the Total Phenolic, Tannin, Flavonoid, Flavonol, and Anthocyanin

As Figure 1A illustrates, COS treatment led to increased total phenolic (TP) content in both grape skins and seeds, suggesting that COS treatment can promote the accumulation of phenolic compounds. This effect may be attributed to the activation of phenylalanine ammonia-lyase (PAL), a key enzyme in the phenylpropanoid pathway responsible for phenolic biosynthesis [41]. For example, during the GC and VC stages, COS treatment resulted in a significant increase in TP in grape skins (skin-TP) by 33.47% and 36.28%, respectively, compared to the CK samples (p < 0.05). Although the increase during the RC stage was not statistically significant (p > 0.05), there was still a 13.24% increase compared to the CK counterpart. As for the TP in grape seeds (seed-TP), a similar pattern was observed, with significant increases during the GC and VC stages (15.98% and 24.41%, respectively, p < 0.05) compared to the CK grapes, while the increase during the RC stage was more modest (1.40%, p > 0.05). This result suggests that both GC and VC stage treatments outperform RC stage treatments in terms of phenolic accumulation. During the green pea stage of grape development, the synthesis of phenolic compounds is predominantly marked by the accumulation of phenolic acids and flavanols. This process spans from the flowering period to the later stages of fruit maturation [42]. Studies indicate that applying salicylic acid during the green pea stage may enhance chlorogenic and gallic acid accumulation [43]. Experimental data support this hypothesis; specifically, as illustrated in Figure S1, the application of COS during the green pea stage significantly elevated the concentration of phenolic acids. This observation may account for the significant increase in total phenolic content associated with COS treatment. Furthermore, the experimental results indicate that COS treatment significantly enhances flavanol content, and research has identified that the key transcription factor VviMYBPA1, which regulates flavanol synthesis, is expressed during the initial stages of grape development [18]. Consequently, COS treatment may stimulate the specific expression of VviMYBPA1, thereby facilitating the increase of flavonols, which, in turn, supports the enhancement of total phenolic content. As grapes transition into the veraison stage, synthesizing stilbenes and anthocyanins is vital. The previous research indicates that MeJA and stevioside substantially increase stilbene production in grape cell cultures. MeJA has also been shown to activate the expression of the VvSTS gene [42]. Our experimental results (Figure S1) further indicate that COS treatment significantly enhances the synthesis of proanthocyanidins and anthocyanins. Moreover, skin-TP accumulation is 17.49% and 11.87% higher for GC and VC treatments than in seeds, respectively, indicating a more effective accumulation in the skin than in the seeds. The accumulation effect of COS treatment in the fruit skin surpasses that observed in the seeds, potentially due to the direct exposure of the fruit skin to the external environment, rendering it more susceptible to external stimuli, thereby activating defense responses and enhancing the synthesis and accumulation of phenolic compounds. Xu [44] demonstrated that the accumulation of flavanols in the fruit skin following exogenous spraying of 24-epibrassinolide (EBR) is greater than in the seeds. Furthermore, studies have revealed that the transcription levels of key genes VvC4H, VvCHS, and VvGST that regulate the synthesis of phenolic compounds are relatively elevated in the fruit skin [45]. Jiang [46] demonstrated that exogenous application of benzothiadiazole (BTH) can enhance the expression of the VvGST4 gene in grapes. Moreover, additional studies have shown that exogenous BTH treatment upregulates the expression of VvC4H, thereby contributing to the enhanced synthesis of phenolic compounds [47].
Similarly, COS treatments also influence the total flavonoid (TFD) content at different stages (Figure 1B), particularly the VC stage treatment, which shows the highest accumulation in grape skins (skin-TFD: 20.23 g/kg) and seeds (seed-TFD: 74.36 g/kg) among all treatment stages, followed by the GC stage treatment (skin-TFD: 17.52 g/kg, seed-TFD: 69.36 g/kg). The RC stage treatment, on the other hand, does not exhibit a significant difference in the TFD content in the skins and seeds compared to the CK grapes (p > 0.05). In addition, the study found that COS treatments at different stages have varying effects on the accumulation of phenolic compounds with various structures, such as tannins, flavonols, and anthocyanins. Specifically, following the GC stage treatment, the contents of total tannin (TT) and total flavonol (TFA) in the grape skins (skin-TT and skin-TFA) are higher than those in samples from other stages (Figure 1C,D). In contrast, the variation of TT and TFA in the seed (seed-TT and seed-TFA) does not present a significant difference compared to the CK (p > 0.05). The synthesis of tannins and flavonols in grapes commences at the fruit set stage (14 days post-flowering), reaches its zenith at veraison, and subsequently diminishes [48]. Deluc [49] identified that the transcription factors VvMYB5a and VvMYB5b modulate the synthesis of proanthocyanidins (PAs) in grape skin, pulp, and seeds during the initial stages of fruit development. During the veraison stage of grapes, following the application of chitosan oligosaccharides (COS), the synthesis of tannins and flavanols is largely complete, resulting in a diminished expression of associated genes and a reduced regulatory role of transcription factors. Consequently, this may render VC treatment ineffective in significantly affecting the accumulation of tannins and flavanols. However, the veraison is a critical period for the extensive synthesis and accumulation of grape anthocyanins [50]. Therefore, this study found that treatment during the VC stage could induce a significant increase in total anthocyanin (ANT) content (1.64-fold higher than the CK), followed by the GC and RC stage treatments (1.53-fold and 1.41-fold higher than the CK, respectively) (Figure 1E). The VC stage treatment was significantly higher than the other treatments (p < 0.05), indicating that treatment during the VC stage is more beneficial for the accumulation of anthocyanins. Similar results were also observed in the study by Conde [51]. By applying polyol (e.g., sorbitol and mannitol) treatments to ‘Touriga Nacional’ grapes during the veraison and mid-ripening stages, they found that veraison stage treatment was more conducive to the accumulation of anthocyanin content in grape berries. This enhancement is likely attributable to the significant upregulation of genes involved in anthocyanin biosyntheses—such as dihydroflavonol-4-reductase (DFR), leucoanthocyanidin dioxygenase (LDOX), and UDP-glucose: flavonoid 3-O-glucosyltransferase (UFGT)—triggered by the application of exogenous bioinducers at the onset of berry color change [52].

3.4. Effects of COS Treatment on Anthocyanins and Non-Anthocyanins

To investigate the impact of COS treatments at different developmental stages on the content and composition of phenolic compounds in grapes, we employed UHPLC-QqQ-MS/MS to determine individual phenolic monomers in grape berry skins. The results identified 34 phenolic compounds, including 15 anthocyanins, 4 flavanols, 7 flavonols, 6 phenolic acids, and 2 stilbenoids (Figure 2 and Figure 3 and Table S3).

3.4.1. Effects of COS Treatment on Anthocyanins

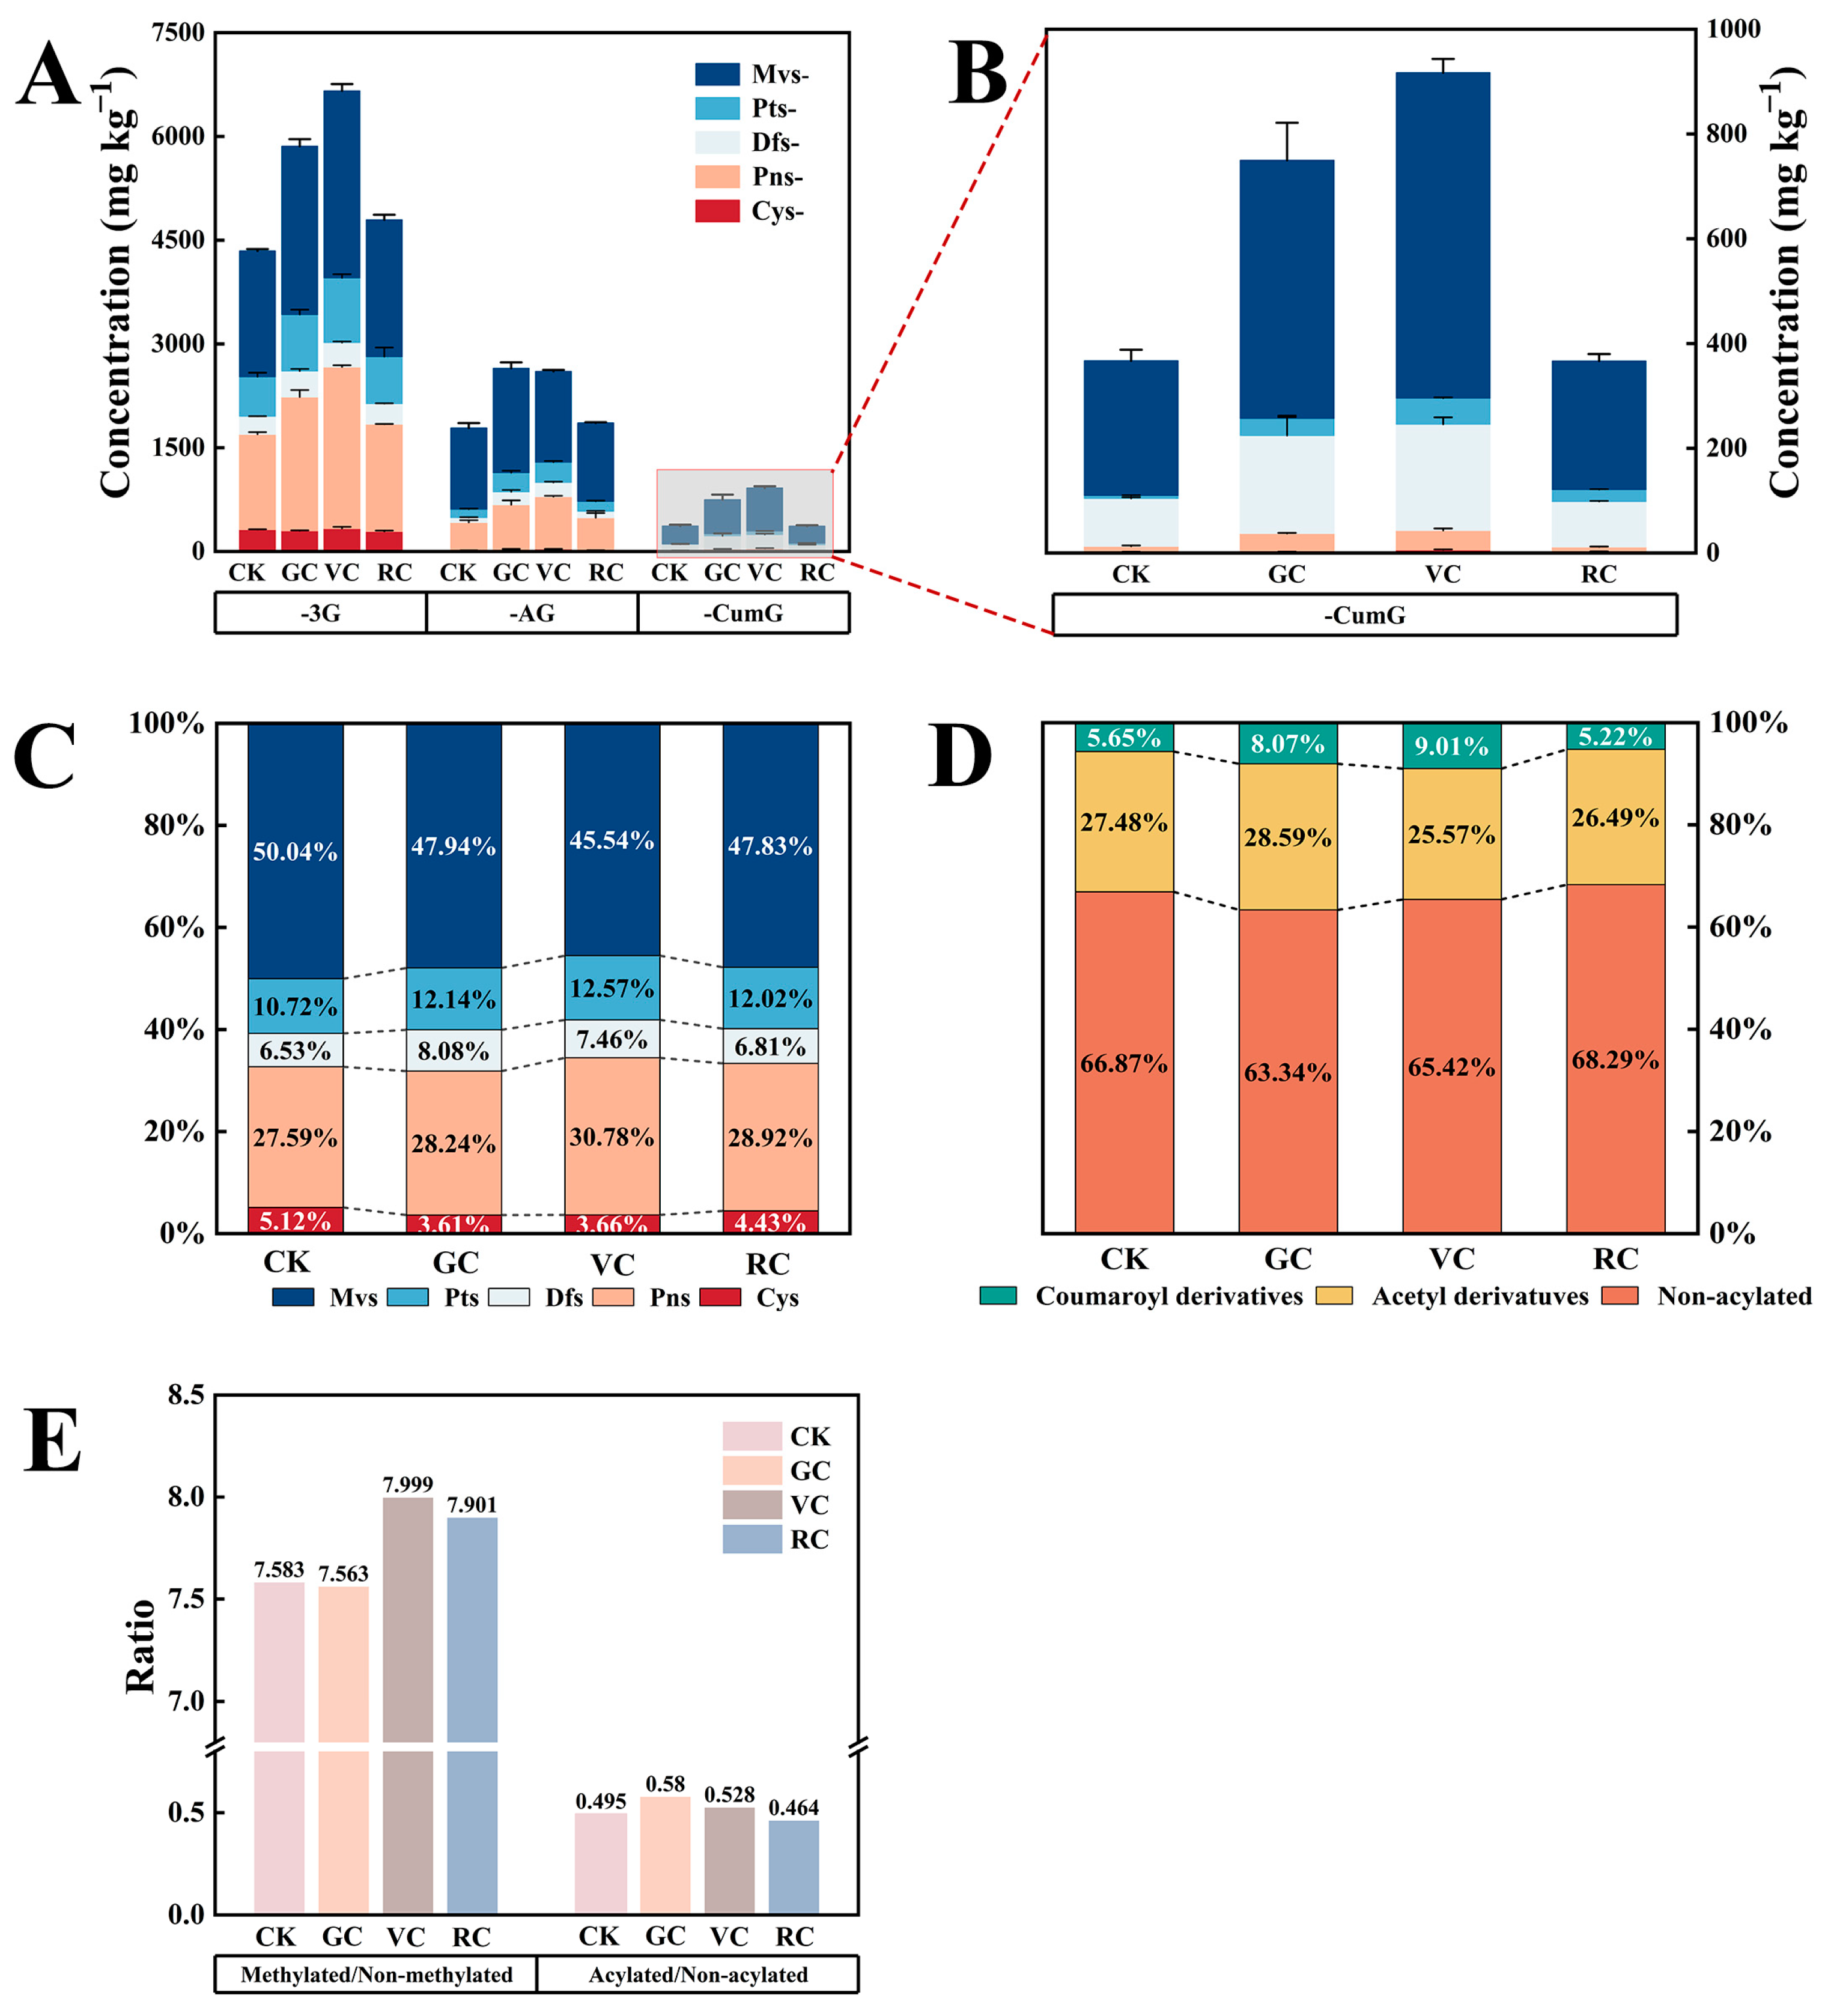
As shown in Figure 2 and Table S3, five types of monoglucoside (3G) anthocyanin compounds, including delphinidin (Dfs), cyanidin (Cys), petunidin (Pts), peonidin (Pns), and malvidin (Mvs), were detected in grape samples subjected to different treatments. These included acetylated (AG) and coumaroylated (CumG) forms, suggesting that COS treatment did not affect the structural composition of anthocyanins. Similar observations were reported in ‘Monastrell’, ‘Merlot’, and ‘Syrah’ grapes treated with MeJA and BTH [53]. However, the total amount of anthocyanins after treatment at all three stages was significantly higher than the CK, which is consistent with the results of the UV–vis spectrophotometric method. Among them, the total amount of anthocyanins (10,177.57 mg/kg and individual anthocyanin concentrations (Figure 2A and Table S3) were higher in the VC-treated samples, especially peonidin-3-O-(6″-O-p-coumaryl)-glucoside and petunidin-3-O-(6″-O-p-coumaryl)-glucoside (Figure 2B and Table S3), which were 3.44 and 9.03 times higher than the CK (p < 0.05), respectively. This result demonstrates the positive effect of treatment at the VC stage on enhancing the color of grape samples. Although the total amounts of anthocyanins in GC and RC treatments also showed an upward trend (increases of 42.46% and 8.03% compared to the CK for GC and VC treatments, respectively, p < 0.05), their cyanidin-3-O-glucoside concentrations showed a certain decrease (for example, cyanidin-3-O-glucoside in the berry skins of GC and RC treatments decreased by 4.57% and 7.87% compared to the CK, respectively, p > 0.05). Therefore, further analysis is needed to understand the effects of different treatments on the content of different structural anthocyanins.
Figure 2C illustrates the proportions of different structural anthocyanins in grape berries treated under various conditions. Overall, the COS treatments did not significantly alter the ratios of other anthocyanins across different stages. The Mvs type had the highest relative proportion among the treatments (ranging from 45.54% to 50.04%), followed by the Pns type (27.59% to 30.78%), while the Cys type consistently had the lowest relative content (3.61% to 5.12%). This pattern may be attributed to the Mvs being terminal products in the anthocyanin synthesis pathway [54]. Although the proportion of Mvs, a type of methylated anthocyanin, decreased after treatment in all three stages (declines of 2.10% in GC, 4.50% in VC, and 2.21% in RC compared to the CK, p < 0.05), the other two types of methylated anthocyanins (Pts and Pns) showed an upward trend. Specifically, Pts type increased by 1.42% (GC), 1.85% (VC), and 1.30% (RC) in the three stages, respectively (VC, p < 0.05), and type of Pns increased by 0.65% (GC), 3.19% (VC), and 1.33% (RC), respectively (VC, p < 0.05).
Previous research has demonstrated that the methylation of anthocyanins can enhance the stability of anthocyanin compounds, resulting in a bathochromic shift in the absorption spectrum [55]. A further comparison between methylated and non-methylated anthocyanins (Figure 2E) revealed that grapes treated with VC stage exhibited the highest ratio of methylated to non-methylated anthocyanins (8.0), followed by those treated with RC stage at 7.9. In contrast, the proportion of methylated anthocyanins in berries treated with the GC stage slightly decreased compared to the CK (by 0.02). This result indicates that VC and RC treatments can promote the methylation of anthocyanins, thereby enhancing the red hue of the berries through shifts in the anthocyanin absorption spectrum. However, GC treatment does not significantly promote the methylation of anthocyanins. This result could be due to the expression levels of the anthocyanin O-methyltransferase (AOMT) gene, which affects the substitution of methoxy groups on the B ring of anthocyanins. The expression of this gene typically increases after grapes change color [56]. Moreover, research by Fang48 has shown that acylated anthocyanins can also enhance the diversity and stability of anthocyanin structures, with coumaroylated anthocyanins having a greater effect than acetylated anthocyanins. Our results show (Figure 2D) that coumaroylated anthocyanins increased significantly under the GC stage treatment and VC stage treatments by 2.42% and 3.36%, respectively (p < 0.05). In comparison, acetylated anthocyanins only slightly increased under the GC stage treatment (by 1.11%, p > 0.05). Further analysis demonstrates that acylated anthocyanins were most abundant under the GC stage treatment (0.58), followed by the VC stage (0.53), indicating a more pronounced effect of the GC stage treatment on anthocyanin acylation (Figure 2E). Sun and coworkers found that methylation primarily affects the hab value. In contrast, acylation can boost the C*ab value [57]. The genes promoting methylation and acylation of anthocyanins in berries are anthocyanin acyltransferases (AAT) and AOMT, respectively. This result indicates that both GC and VC stage treatments could enhance the coloration of berries by promoting the expression of these two genes.

3.4.2. Effects of COS Treatment on Non-Anthocyanins

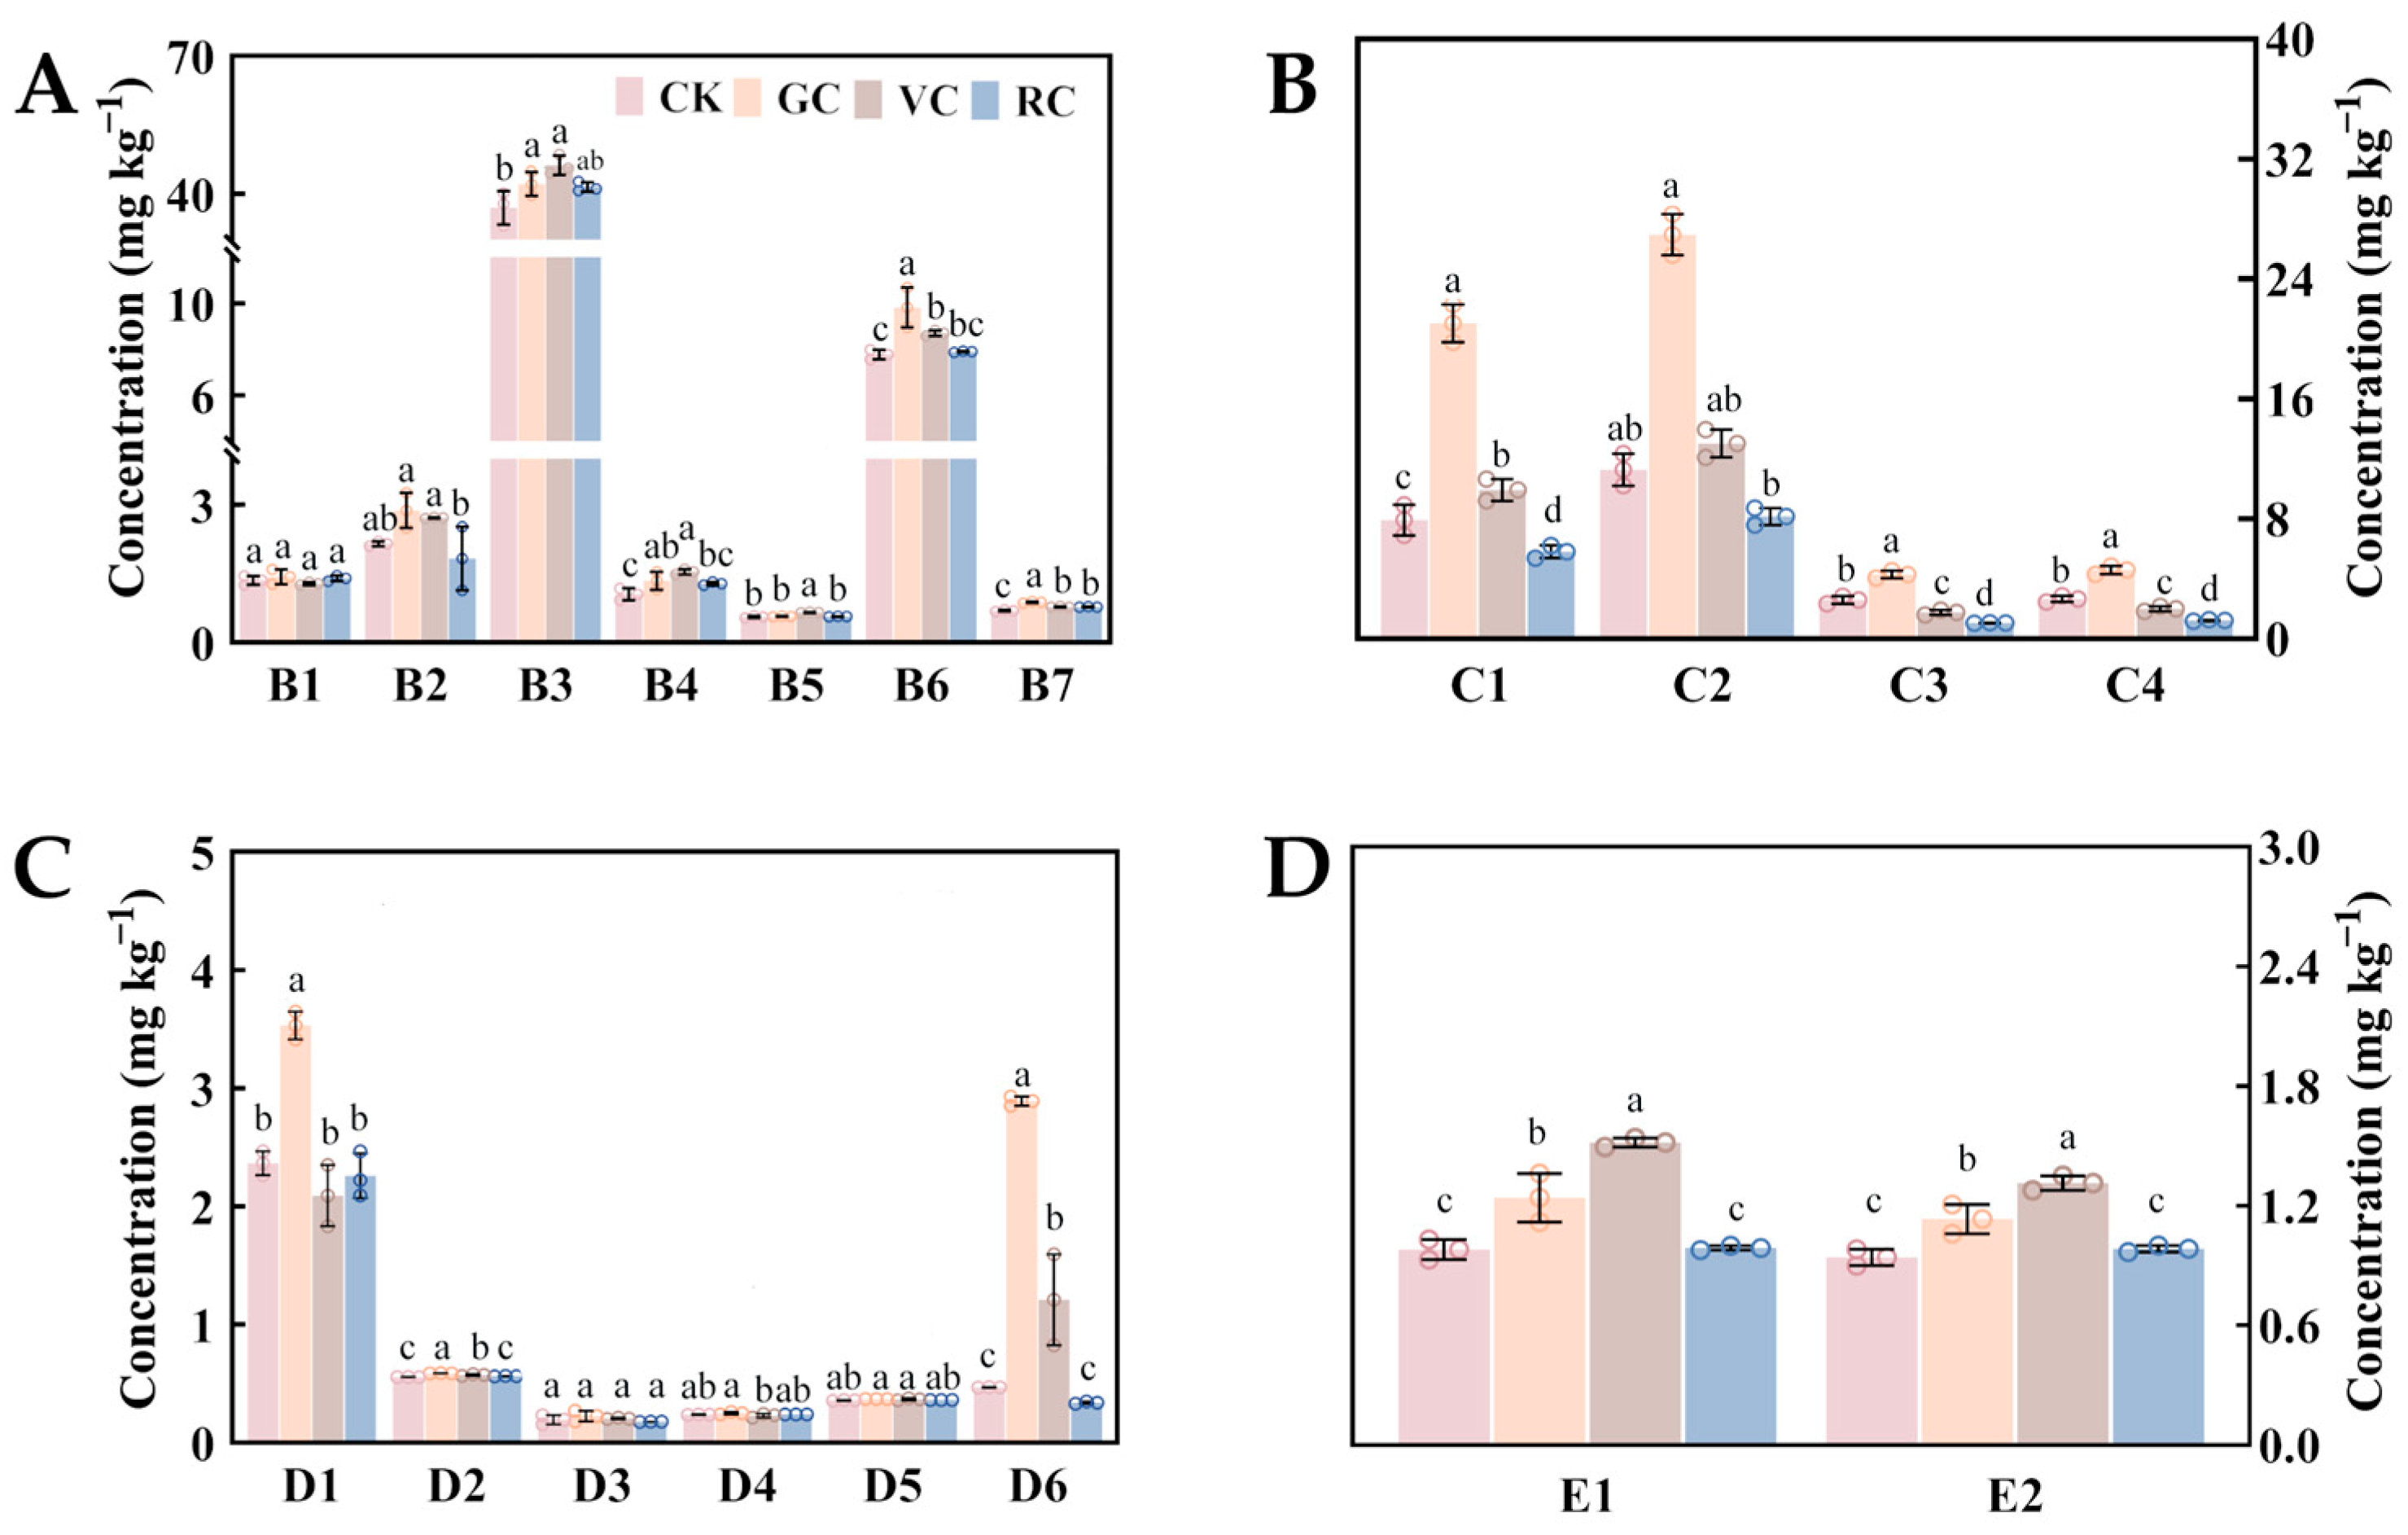
Flavonols, including quercetin, myricetin, kaempferol, and their derivatives, are significant phenolic constituents in grapes and wines. As indicated in Figure 3, there were significant differences in flavonol (quercetin, B1; myricetin, B2; quercetin-3-O-glucoside, B3; rutin, B4; isorhamnetin, B5; isorhamnetin-3-O-glucoside, B6; astilbin, B7) content between the CK and treatment groups, particularly with the VC treatment, which significantly increased by 22.32% compared to the CK (p < 0.05), followed by the GC treatment with a significant increase of 16.82% (p < 0.05). The RC treatment also increased by 9.17% compared to the CK, but the difference was insignificant (p > 0.05). This result may be attributed to the proximity of flavonol and anthocyanin biosynthetic pathways, with most identical synthesis pathways [53]. Thus, the effects of COS treatment on flavonols and anthocyanins appear similar. Portu [58] observed that applying MeJA during the veraison stage resulted in an approximate increase of 11.75% in anthocyanin content in grapes and a concurrent increase of about 10.04% in the closely related flavonols. For example, the concentration of quercetin-3-O-glucoside (B3) was significantly elevated in grapes after GC and VC treatments, increasing by 13.91% and 24.82%, respectively, compared to the CK (p < 0.05). Although the RC treatment did not show a significant difference from the CK, a numerical increase was still observed (an increase of 12.05% compared to the CK, p > 0.05). Similar effects were noted for rutin (B4), isorhamnetin-3-O-glucoside (B6), and astilbin (B7). These findings were similar to previous observations when BTH was sprayed on ‘Monastrell’ vines [59]. Isorhamnetin (B5) only exhibited a significant increase in the VC treatment group (16.07% increase compared to the CK, p < 0.05). However, Paladines-Quezada [60] found that applying BTH and MeJA during the veraison stage on ‘Monastrell’ did not produce a significant effect.
Flavanol compounds, associated with the bitterness of wine, originate from the skins and seeds of grapes. They are present primarily in monomeric or polymeric forms and are one of the precursors for tannin synthesis in winemaking. As shown in Figure 3B, four flavanol compounds, namely procyanidin B1 (C1), procyanidin B2 (C2), catechin (C3), and epicatechin (C4), have been detected in grape skins. The total flavanol content varied with different treatments, in the order of GC (56.85 mg/kg) > VC (26.69 mg/kg) > CK (24.43 mg/kg) > RC (16.23 mg/kg). All four flavanols were significantly higher in the GC treatment than the CK. For example, procyanidin B1 (C1), procyanidin B2 (C2), catechin (C3), and epicatechin (C4) increased by 165.53%, 138.92%, 66.28%, and 72.18% respectively (p < 0.05). All four flavanols were significantly higher in the GC treatment than the CK. For example, procyanidin B1 (C1), procyanidin B2 (C2), catechin (C3), and epicatechin (C4) decreased by 26.77%, 27.75%, 59.30%, and 53.76% respectively (p < 0.05). This result may be because COS treatment can enhance the expression of transcription factors VvMYB5a, VvMYB5b, and VvMYBPA1, which are closely related to flavanol metabolism, particularly VvMYB5a, which is primarily expressed in the early stages of berry development [61]. In contrast, the total flavanol content following VC treatment did not significantly differ from the CK (p > 0.05). Previous studies have indicated that applying MeJA, chitosan, and yeast extract during the veraison phase does not significantly affect flavanol compounds [58]. However, the composition of the flavanol compounds underwent certain changes after VC treatment. However, the composition of the flavanols underwent certain changes after VC treatment. Specifically, the level of procyanidin B1 (C1) was significantly higher than that of the CK by 25.38% (p < 0.05), while catechin (C3) and epicatechin (C4) were reduced by 32.17% (p < 0.05) and 25.19% (p < 0.05), respectively. These results suggest that the VC treatment may enhance the polymerization of flavanol monomers (catechin and epicatechin) into procyanidin B1 [44].

3.4.3. Non-Anthocyanins

As shown in Figure 3C, following GC treatment, phenolic acid compounds (gallic acid, D1; protocatechuic acid, D2; syringic acid, D3; ferulic acid, D4; p-coumaric acid, D5; vanillic acid, D6) exhibited a pronounced increase in activity, with an 87.80% increase relative to the CK (p < 0.05). Gomes [18] found that applying salicylic acid twice during the green pea stage and veraison period significantly promoted the accumulation of phenolic compounds, a similar finding to this study. Gallic acid (D1), one of the most abundant phenolic compounds in grapes, also showed enhanced efficacy following GC treatment. Additionally, p-coumaric acid (D5), a key phenolic compound in grapes and a precursor of flavonoid and coumarin metabolism, showed significantly higher levels following both GC and VC treatments, exceeding the CK by 2.78%. This result could be attributed to the fact that COS treatment may enhance the activity of the key enzyme PAL in the phenylpropanoid metabolic pathway, thereby promoting the accumulation of phenolic compounds. However, some studies have found that the application of MeJA and chitosan during the grape veraison stage did not significantly affect phenolic acids [14], so further research is needed.
In addition, stilbenoids synthesized through the phenylpropanoid pathway showed significant changes in concentration after both VC and GC treatments (increased by 23.44% and 47.40% compared to the CK, respectively, p < 0.05) (Figure 3D). Specifically, post-VC treatment, the concentration of trans-resveratrol (E1) in grapes significantly increased by 55.10% (p < 0.05) compared to the CK. In comparison, GC treatment resulted in a significant increase of 26.53% (p < 0.05). Following both treatments, the levels of cis-resveratrol (E2) increased by 20.21% and 39.36%, respectively, compared to the CK (p < 0.05). These changes may be attributed to a significant increase in the metabolic precursor (p-coumaric acid) induced by the VC and GC treatments. Additionally, it has been reported that exogenous elicitors can stimulate the expression of enzyme-encoding genes. For example, Lucini [62] found that pre-harvest application of chitosan can stimulate the biosynthesis of stilbenoid through the phenylpropanoid pathway by enhancing the activity of stilbenoid synthase.

3.4.4. Correlation Analysis of Anthocyanins and Non-Anthocyanins

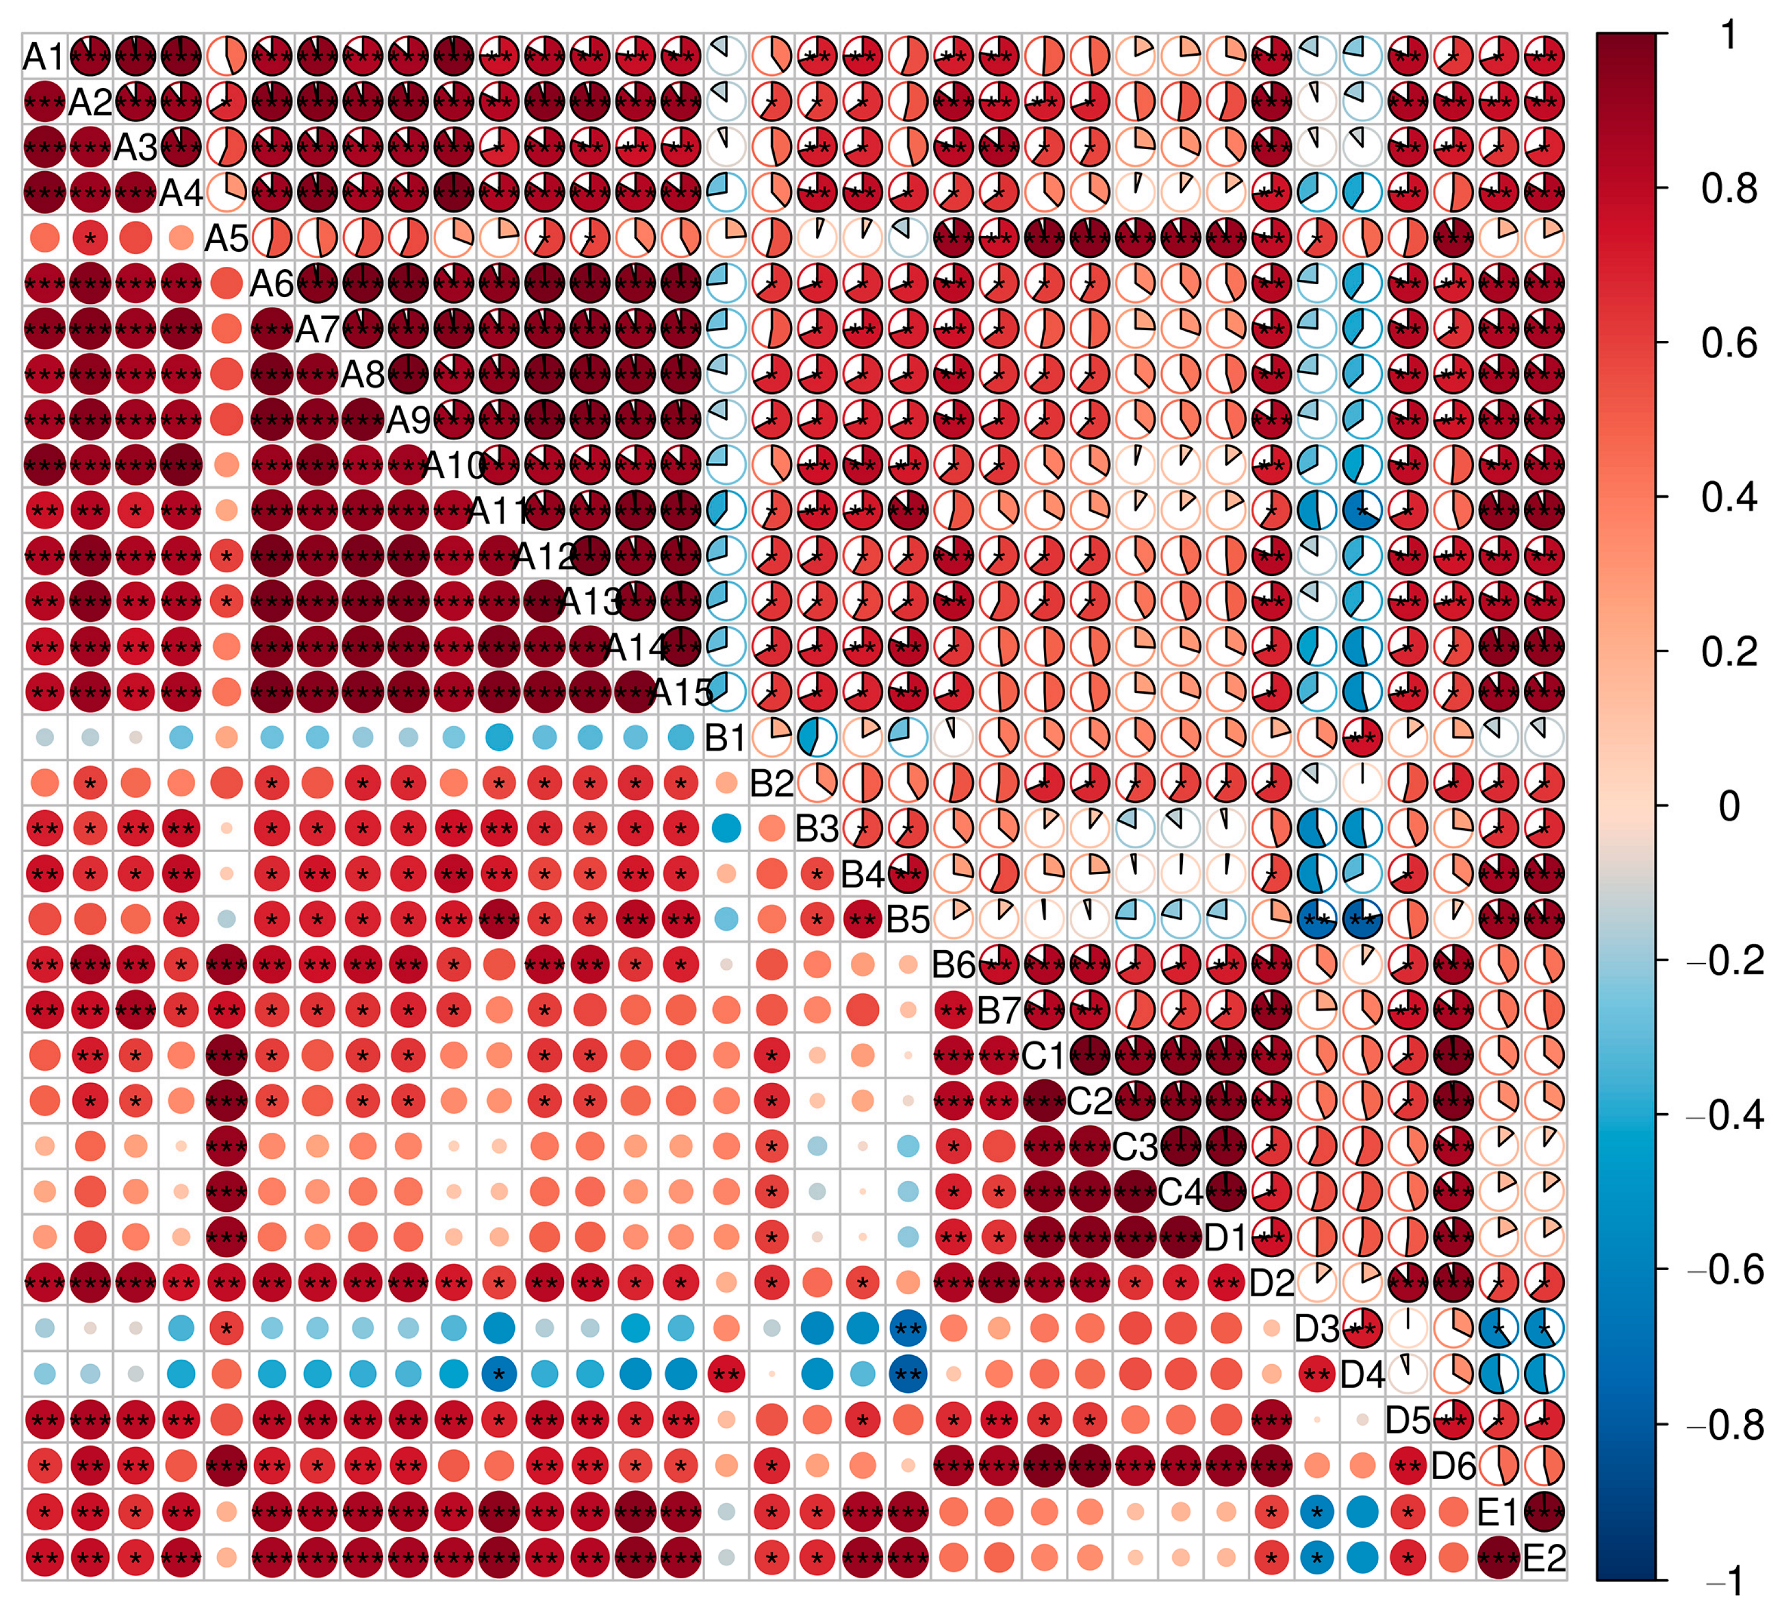
Figure 4 shows a noteworthy positive correlation among the 15 types of anthocyanins and flavanols, particularly with B3, B4, B6, and B7. Flavanols are integral to the biosynthetic pathway of anthocyanins [53]. As depicted in Figure S1, both anthocyanins and flavanols originate from phenylalanine, undergoing conversion into dihydroflavonols through the catalysis of a series of enzymes and subsequently yielding flavanols via flavonol synthase (FLS). An alternative pathway facilitates the synthesis of anthocyanins through DFR. This process may be influenced by the competitive dynamics between FLS and DFR, which correlate negatively with quercetin; however, this difference is not statistically significant [63].
A noteworthy positive correlation is observed between A2, A3, A5, A6, A8, A9, A12, A13, and C1, C2, particularly a pronounced correlation between A5 and flavanols. Research indicates that the leucoanthocyanidin reductase (LAR) and anthocyanidin reductase (ANR) genes are pivotal in the biosynthesis of catechins [64]. Nevertheless, even when the expression of LAR1 and LAR2 genes is nearly absent, elevated levels of proanthocyanidins and their precursors remain detectable, indicating that flavanol synthesis is regulated by additional genes, with LAR and ANR not being the sole influencing factors [65]. As natural antioxidants, both anthocyanins (A1–A15) and phenolic acids (D1–D6) exhibit elevated levels following COS treatment, thereby serving a protective function for plants subjected to environmental stressors (such as high temperatures and drought), which may explain the observed positive correlations between anthocyanins (A1–A15) and some phenolic acids (D1, D2, and D5) [66,67,68]. In contrast, a negative correlation was found between all anthocyanins (A1–A15) and some phenolic acids (D3–D4), which may be due to the competition in biosynthesis between anthocyanins (A1–A15) and syringic acid (D3), ferulic acid (D4). Among them, A11 and D4 were particularly characterized by a significant negative correlation. Flavonoids share a common upstream phenylpropanoid pathway with anthocyanins, facilitating their interrelated biosynthesis [69]. As illustrated in Figure S1, nearly all anthocyanins demonstrate a noteworthy positive correlation with both structural forms of resveratrol.

3.5. Multivariate Data Analysis of Grape Specimen Dataset

3.5.1. OPLS-DA Analysis of the Whole-Sample Dataset

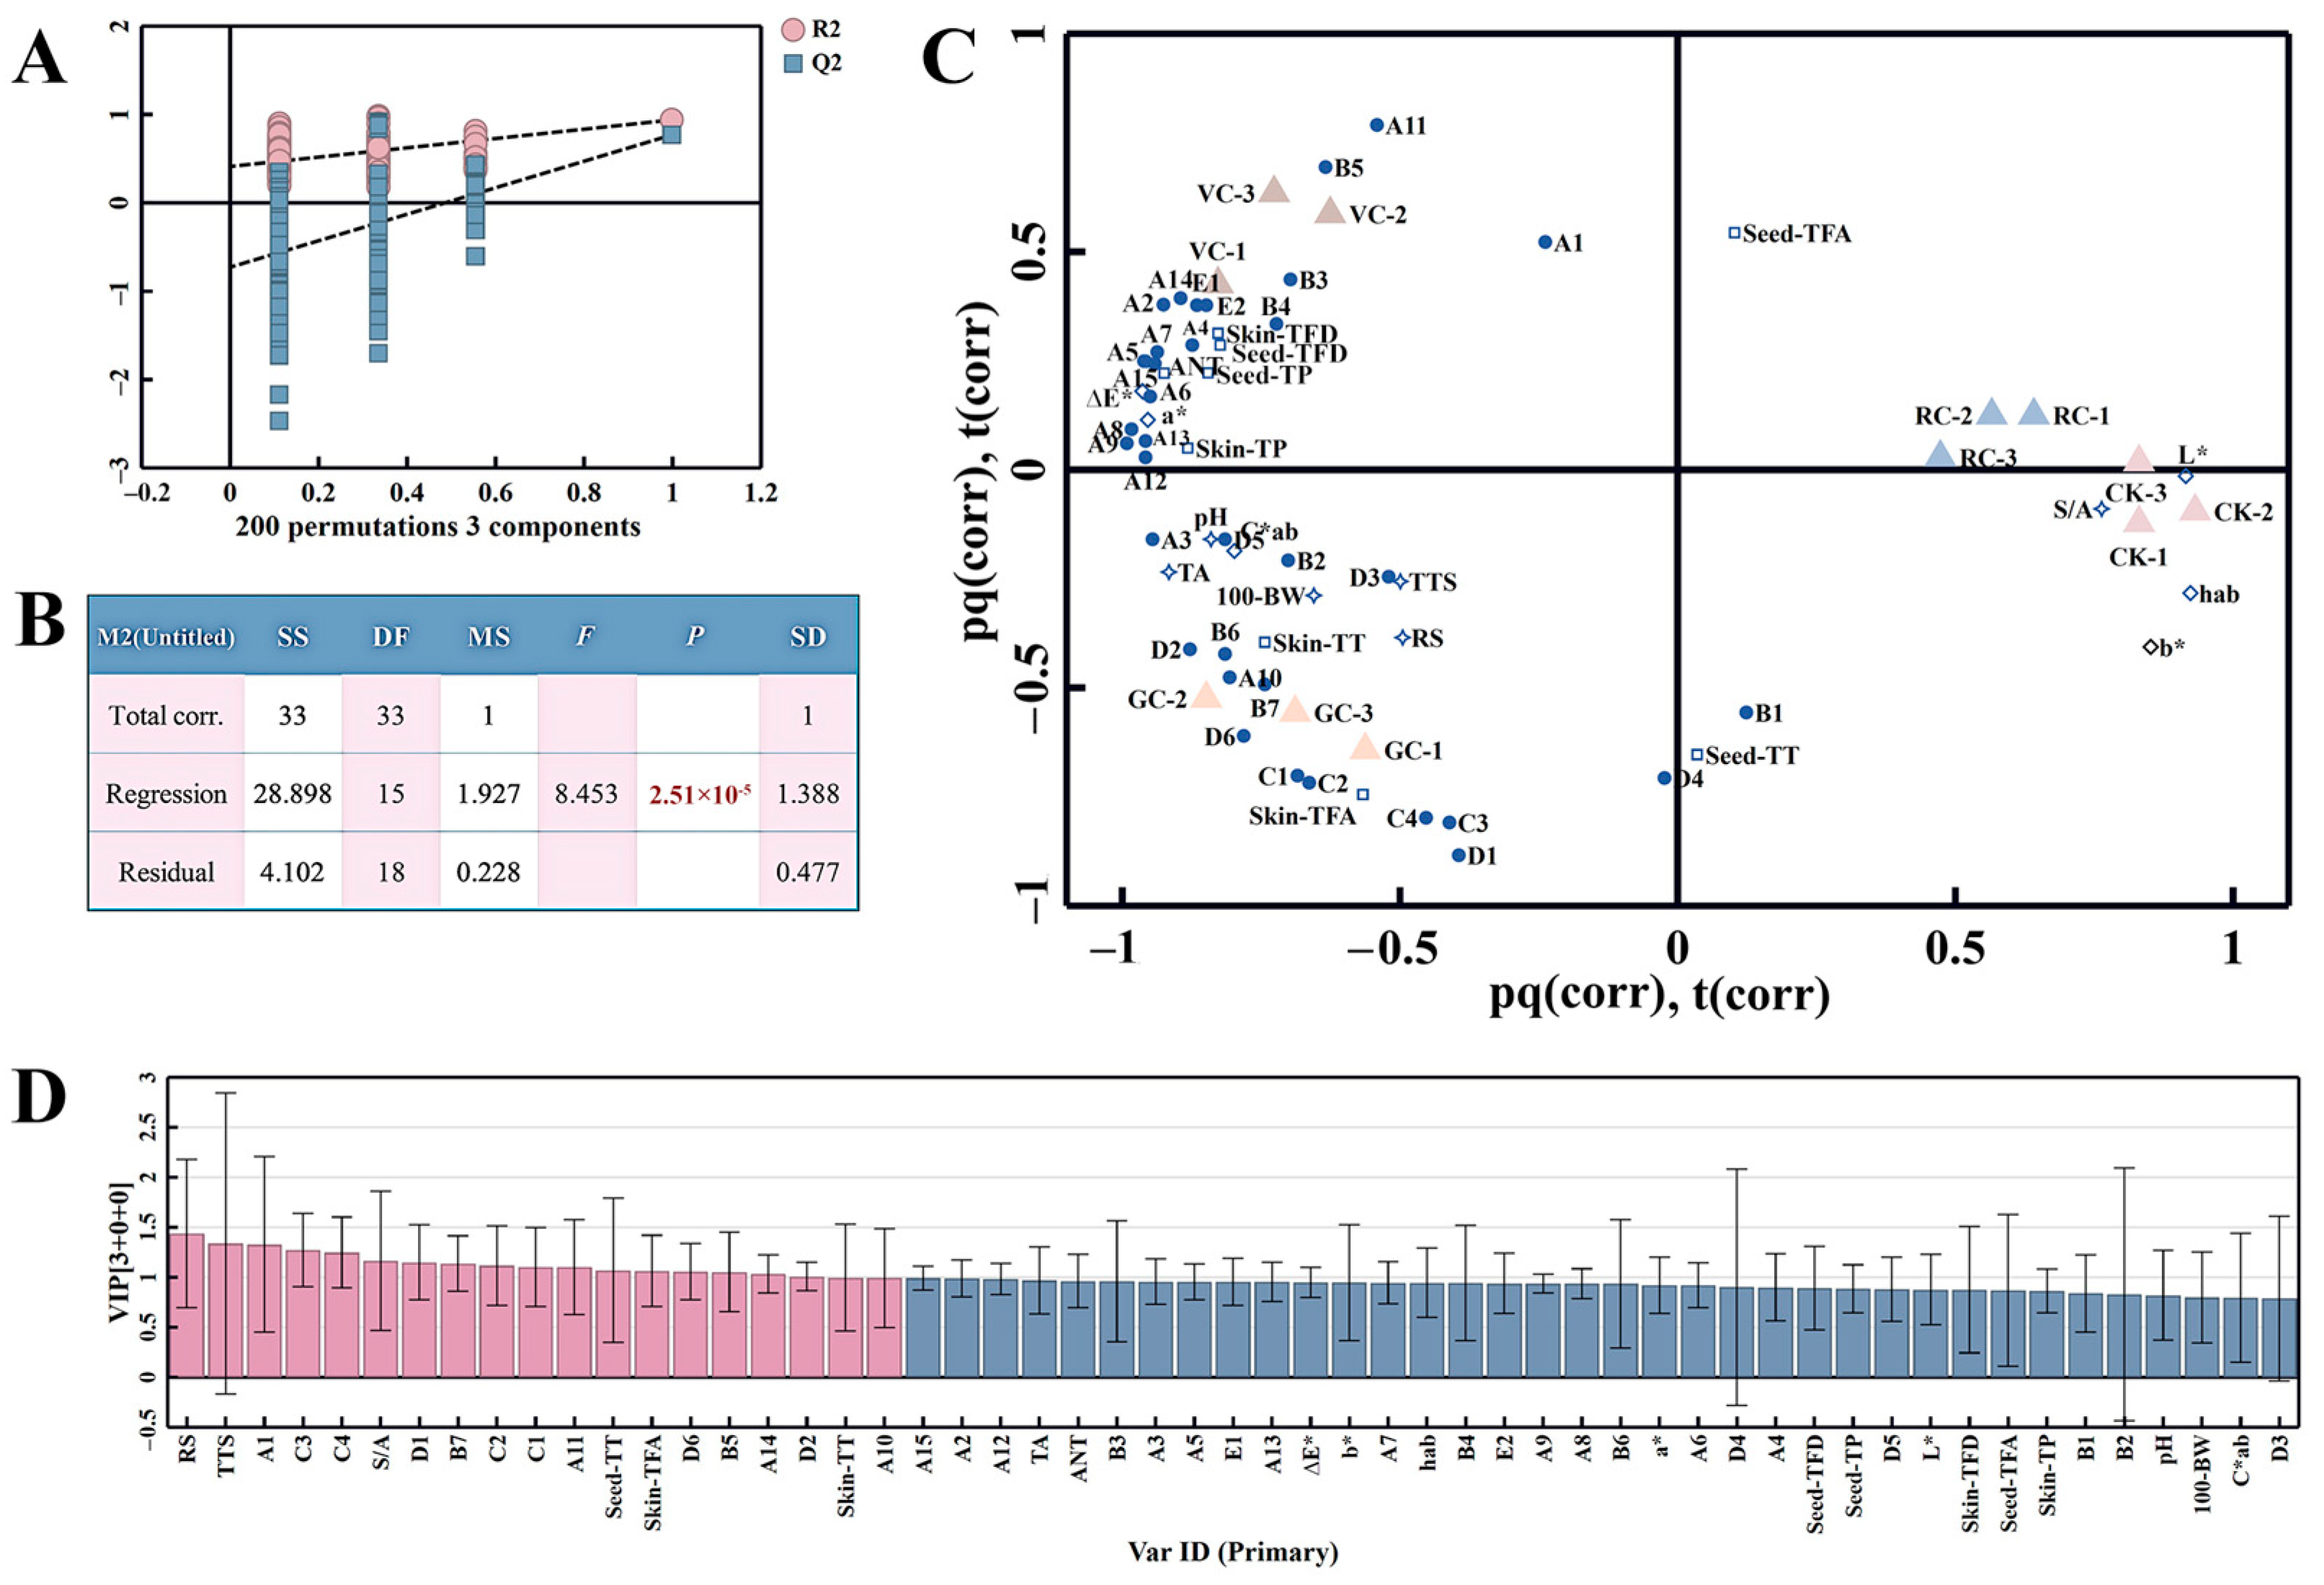
To fully understand the differences between treatments at various stages, 55 parameters (including physicochemical parameters: 100-BW, TSS, RS, TA, pH, and S/A; color indexes: L*, a*, b*, C*ab, hab and ΔE*ab; phenolic compounds data: skin-TP, skin-TT, skin-TFA, skin-TFD, skin-ANT, seed-TP, seed-TT, seed-TFA, seed-TFD, A1–A15, B1–B7, C1–C4, D1–D6 and E1–E2, as shown in Table S4) of grape berries were analyzed. These parameters served as dependent variables, with grapes from different treatment stages as independent variables in an OPLS-DA (Figure 5). The explained variation (R2Y) and discriminant predictive ability (Q2) were both above 0.5, indicating acceptable model fit and no overfitting, as evidenced by permutation testing (200 iterations) (Figure 5A). Cross-validation yielded statistically significant results (p < 0.05), underscoring the model’s reliability (Figure 5B). As shown in Figure 5C, CK and RC samples are distributed along the positive half of Principal Component 1 (PC1). They correlate highly with S/A, L*, b*, and hab. In contrast, GC and VC samples are located on the negative half of PC1 and distributed on opposite sides of Principal Component 2 (PC2), highlighting distinct treatment differences. The GC-treated grapes predominantly relate to sugars (TSS and RS), acids (TA), skin-TT, flavonols (B6 and B7), flavanols (C1–C4), and phenolic acids (D2 and D6), while VC-treated berries are mainly associated with skin-TFD, seed-TFD, seed- TP, anthocyanins (ANT, A1, A2, A4, A7, A11, and A14), flavonols (B3–B5), and coumarins (E1 and E2). Important discriminators between treatments, identified through VIP scores (>1) in the OPLS-DA model (Figure 5D), include RS, TSS, S/A, seed-TT, skin-TFA, A1, A11, A14, B5, B7, C1–C4, D1, D2, and D6, indicating these 17 parameters as important variables influencing grape samples

3.5.2. Uses of Machine Learning Method in Discriminating Key Variables

In recent years, machine learning methods have shown excellent performance in detecting human and plant metabolite markers. Currently, algorithms such as Extreme Gradient Boosting (XGBoost), Least Absolute Shrinkage and Selection Operator (LASSO) regression model, Random Forest (RF), and Support Vector Machine-Recursive Feature Elimination (SVM-RFE) are commonly used for the screening of characteristic substances. Among them, SVM-RFE is favored for its wide application in feature selection and high-throughput data classification [70]. RF is renowned for its superior accuracy and interpretability, outperforming logistic regression in about 69% of datasets, and has gained a prominent position in the predictive modeling of feature biomarkers [71,72]. XGBoost uses a gradient-boosting decision tree algorithm that can quickly train large-scale data but does not include feature engineering. It cannot directly capture the deeper relationships between features. The LASSO method achieves feature selection by effectively shrinking feature weights to zero, thereby improving the interpretability and generalization capability of the model. However, it is important to note that LASSO can be sensitive to data distribution and may introduce bias when dealing with non-normally distributed data [73]. Research has found that combining RF and SVM is more accurate in identifying metabolite markers [74]. Therefore, we have chosen these two machine-learning algorithms to identify metabolite markers.
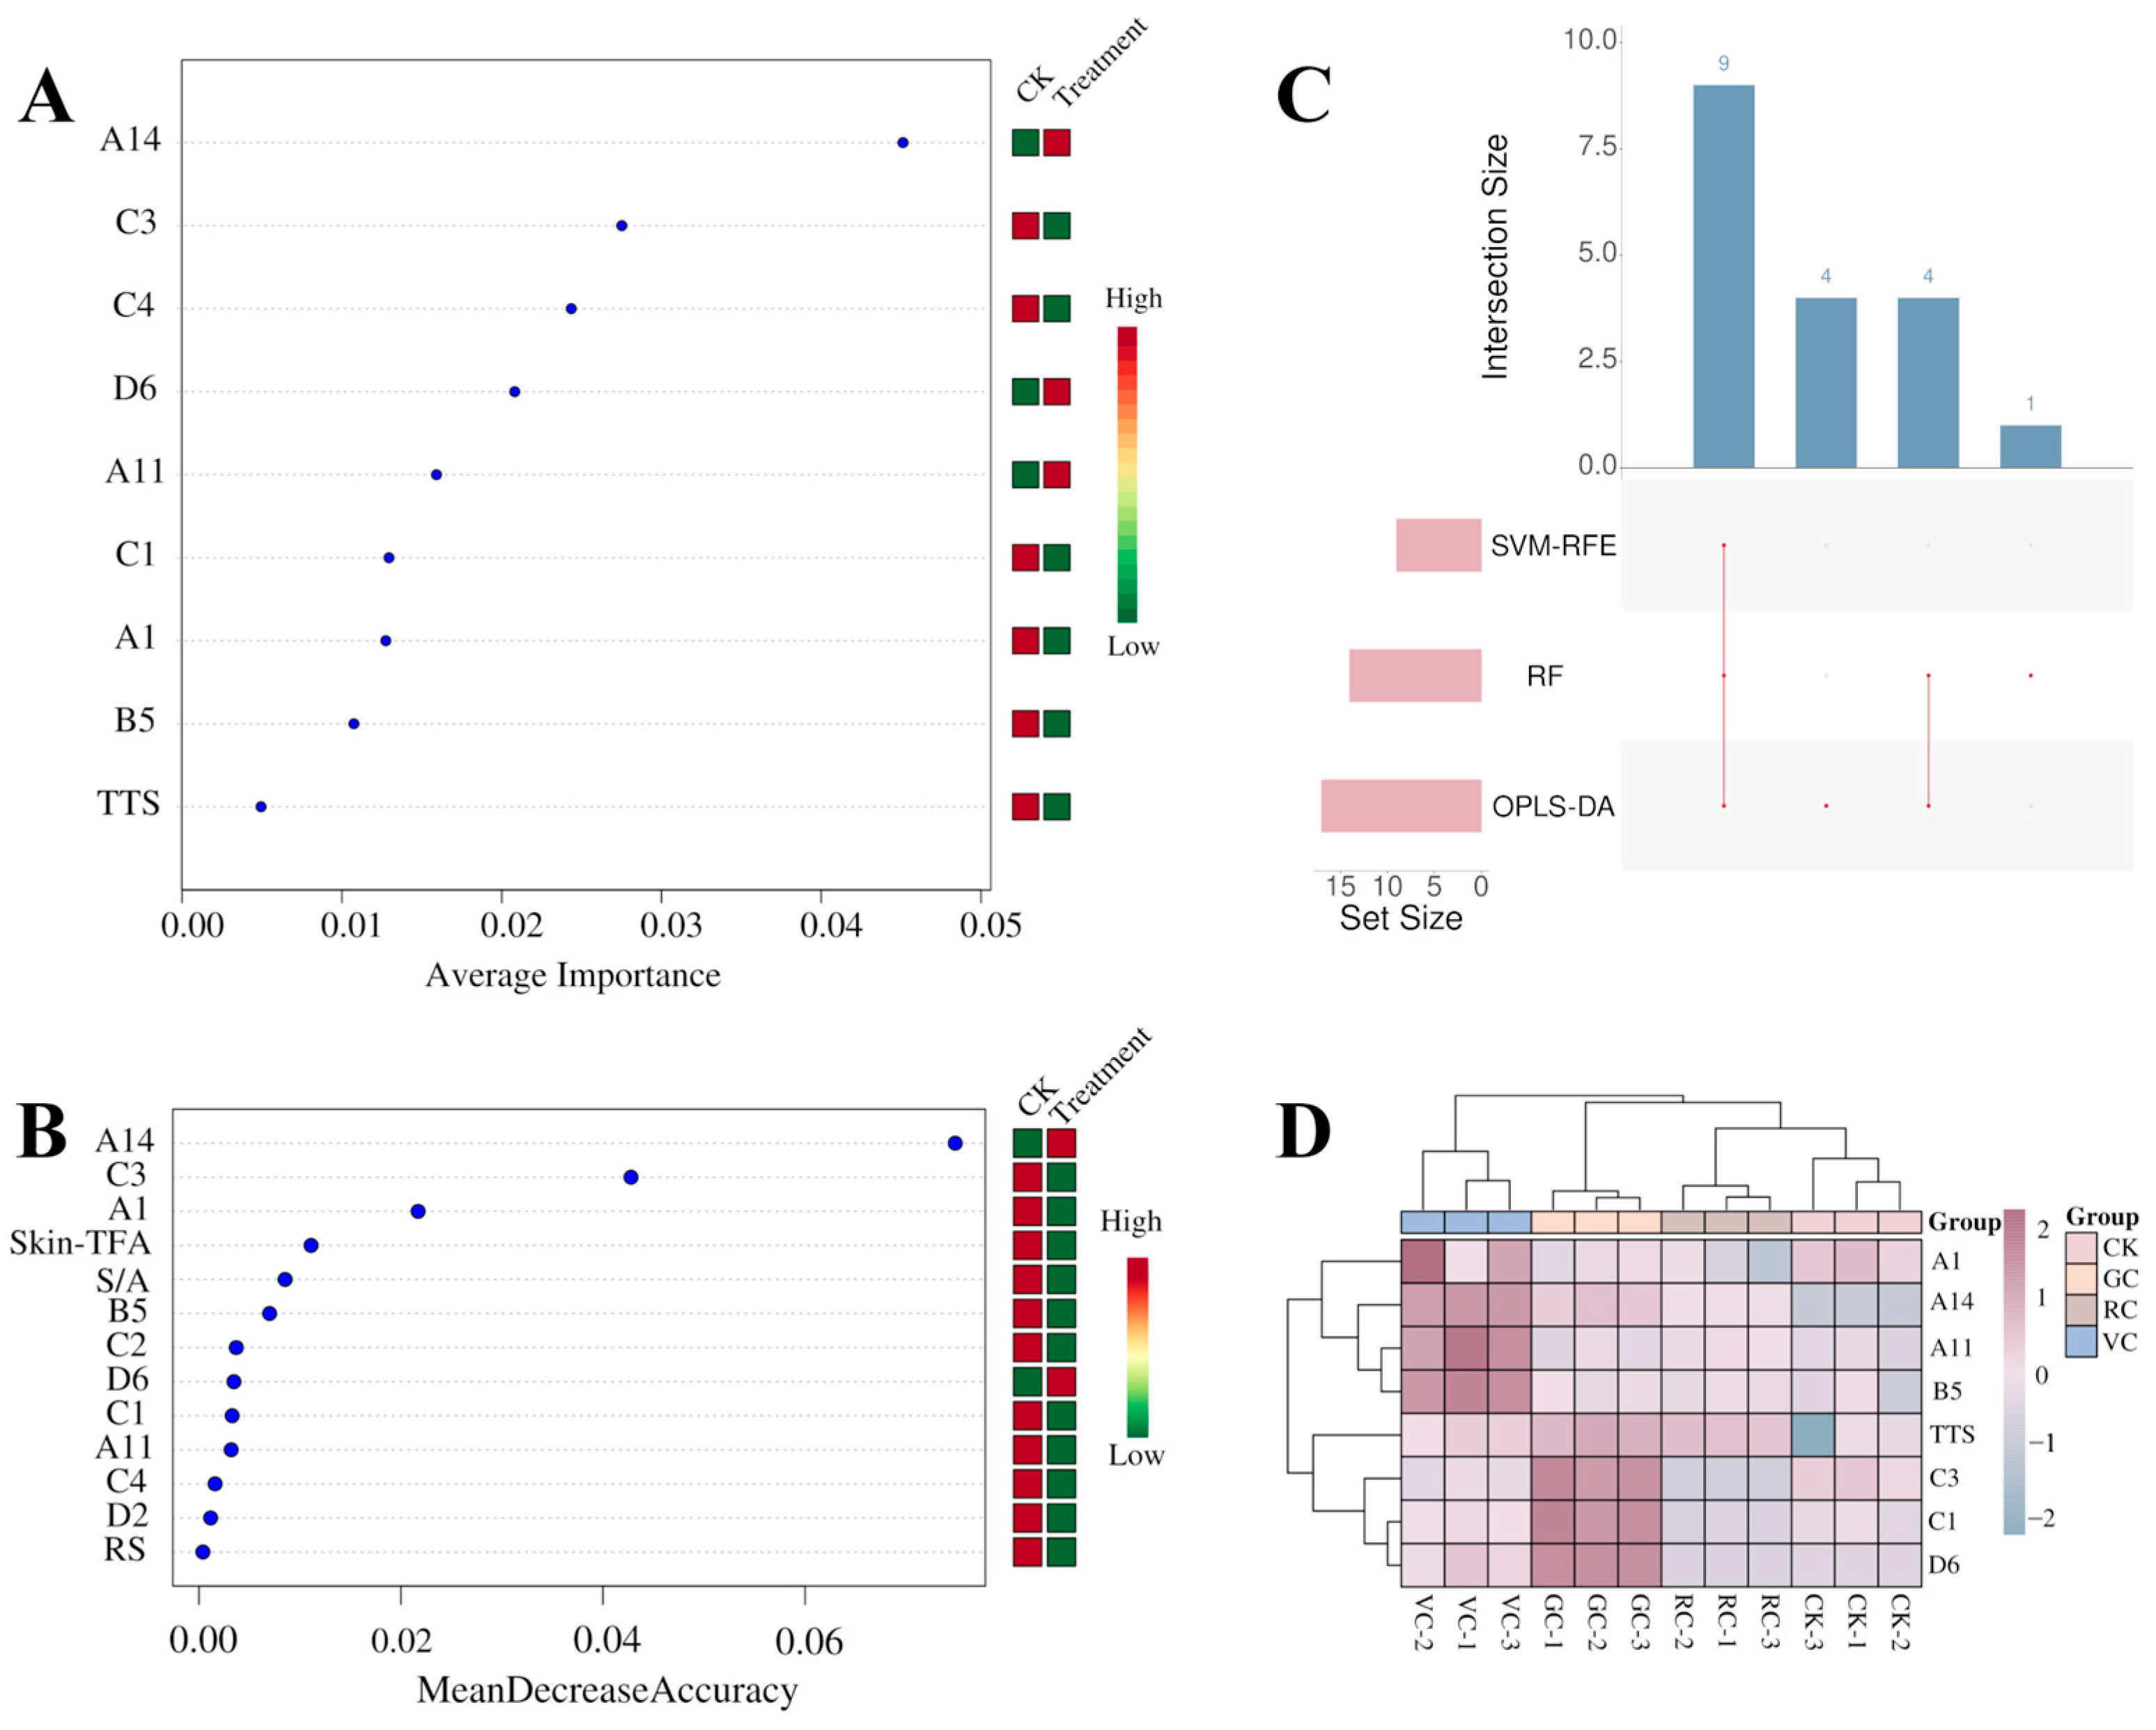
Although the OPLS-DA model results facilitate the identification of important variables that differentiate treatments, relying on a single analytical approach alone does not fully capture the key characteristic variables in grapes treated at different stages. To address this limitation, we employed advanced machine learning techniques (SVM-RFE and RF) to refine further the analysis of 17 important variables that affect grape quality. Results from Figure 6A indicate that the SVM-RFE method identified, such as TSS, A1, A11, A14, B5, C1, C3, C4, and D6 as contributing to classification differences, with A11, A14 and D6 significantly distinguishing CK and treated samples. Moreover, further analysis using the RF suggested that variables such as TSS, S/A, skin-TFA, seed-TT, A1, A11, A14, B5, C2, C3, C4, D2, and D6 significantly enhance the accuracy of sample group predictions (Figure 6B). Finally, by integrating results from OPLS-DA, SVM-RFE, and RF models and employing an UpSet plot comparison (Figure 6C), we ultimately identified eight variables—TSS, A1, A11, A14, B5, C1, C3, and D6—as key characteristic compounds for distinguishing differences samples.
Furthermore, to intuitively compare the variance of the same variables under different treatments, we utilized a clustered heatmap to analyze eight key characteristic compounds in grapes at various treatment stages. In the heatmap (Figure 6D), red and green signify high and low compound contents, respectively, with darker shades indicating higher (pink) or lower (blue) concentrations. Row clustering analysis categorized the different treatment stages into three main groups: CK and RC treatments were classified together due to their lower concentrations of the eight key characteristic compounds. In contrast, GC and VC treatments each formed distinct groups, signifying notable differences in the relative concentrations of the key characteristic compounds between these two treatment groups. Column clustering divided the eight compounds into two groups.
Group I consists of A1, A11, A14, and B5, which are present in higher concentrations in grapes under VC treatment. According to the research by Singh [75], applying chitosan during the color transition period significantly promotes the synthesis of anthocyanins in the skin of ‘Tinto Cão’ grapes. This result is primarily attributed to the induction of key genes involved in anthocyanin biosynthesis (UFGT) and transport (ABCC1, MATE1, and GST) by chitosan.
Group II primarily encompasses TSS, C1, C3, and D6. These four key compounds are relatively more abundant in grape berries under GC treatment, while the concentration of anthocyanins is comparatively lower. Generally, both anthocyanins and phenolic acids originate from the phenylpropanoid pathway. An upregulation in the production of phenolic acids may lead to a downregulation in the biosynthesis of anthocyanins. It has been reported that caffeoyl-CoA-O-methyltransferase can control the balance between these two types of compounds [76]. Although flavanols and anthocyanins share the same origin in synthesis, the balance between these two types of compounds is controlled by anthocyanidin reductase [77]. Therefore, GC treatment may enhance these enzymes’ activity and gene expression. Nonetheless, further investigation is required to discern how the concentration of these compounds can be manipulated via diverse treatment durations. This result will contribute to a more profound comprehension of the regulatory mechanisms implicated in the alterations of substances across different stages of treatment.

4. Conclusions

This experiment investigated the impact of foliar application of a 0.1% COS solution on the quality of ‘Cabernet Franc’ grape berries during the green pea stage (GC), the onset of veraison (VC), and the mid-ripening period (RC), particularly focusing on phenolic compounds. The results revealed that exogenous COS treatment at all three stages significantly increased the levels of total soluble solids (TSS), reducing sugars (RS), total acid (TA), a*, total phenolic (TP), total flavonoid (TFD), and total anthocyanin (ANT) in grape berries. UHPLC-QqQ-MS/MS analysis showed that COS treatment during the green pea stage increased flavonols and phenolic acids in grapes by 132.71% and 87.80%, respectively. In comparison, veraison-stage COS treatment led to an 18.28% and 47.40% increase in flavonols and stilbenes, respectively. Through OPLS-DA combined with machine learning screening, eight key compounds were identified, with significant effects of the green pea stage treatment observed on TSS, proanthocyanidin B1 (C1), catechin (C3), and vanillic acid (D6), while veraison treatment notably affected cyanidin-3-O-glucoside (A1), cyanidin-3-O-(6″-O-p-coumaryl)-glucoside (A11), petunidin-3-O-(6″-O-p-coumaryl)-glucoside (A14), and isorhamnetin (B5).

Supplementary Materials

The following supporting information can be downloaded at https://www.mdpi.com/article/10.3390/agriculture14112039/s1, Table S1: Chromatographic and mass spectrometric information of anthocyanins detected in grape samples; Table S2: Chromatographic and mass spectrometric information of non-anthocyanins detected in grape samples; Table S3: Effects of COS treatment at different stages on anthocyanins (mg/kg); Table S4: Name of phenolic compounds and corresponding numbers (No.); Figure S1: Biosynthetic framework of phenolic compounds in grape berry.

Author Contributions

Conceptualization, W.Q. and B.Z.; data curation, H.W. and K.L.; formal analysis, W.Q.; funding acquisition, B.Z.; methodology, T.M. (Tongwei Ma); writing—original draft preparation, W.Q.; writing—review and editing, W.Q. and B.Z.; supervision, B.W., Y.J. and T.M. (Tengzhen Ma). All authors have read and agreed to the published version of the manuscript.

Funding

This research was funded by the Longyuan Young Talents Program of Gansu Province (grant number LYYC-2024-03), the Wine Industry Development Project of the Department of Commerce of Gansu Province (grant number GSPTJZX-2020-4 and 2017010), the Gansu Province Modern Fruit Industry System Project (grant number GARS-SG-7), and the Fu Xi Talents Program of Gansu Agricultural University (grant number Gaufx-02Y06).

Institutional Review Board Statement

Not applicable.

Data Availability Statement

The original contributions presented in the study are included in the article and the Supplementary Materials.

Acknowledgments

The authors gratefully acknowledge the Gansu Huangtai Wine-Marketing Industry Co., Ltd. for their generous support in supplying grapes.

Conflicts of Interest

The authors declare that they have no known competing financial interests or personal relationships that could have appeared to influence the work reported in this paper.

References

  1. El Rayess, Y.; Nehme, N.; Azzi-Achkouty, S.; Julien, S.G. Wine Phenolic Compounds: Chemistry, Functionality and Health Benefits. Antioxidants 2024, 13, 1312. [Google Scholar] [CrossRef]
  2. Nuwer, R. Changing Old Viticulture for All the Right Rieslings. Nature 2023. ahead of print. [Google Scholar] [CrossRef] [PubMed]
  3. Urcan, D.E.; Lung, M.-L.; Giacosa, S.; Torchio, F.; Ferrandino, A.; Vincenzi, S.; Río Segade, S.; Pop, N.; Rolle, L. Phenolic Substances, Flavor Compounds, and Textural Properties of Three Native Romanian Wine Grape Varieties. Int. J. Food Prop. 2016, 19, 76–98. [Google Scholar] [CrossRef]
  4. Sun, R.-Z.; Cheng, G.; Li, Q.; Zhu, Y.-R.; Zhang, X.; Wang, Y.; He, Y.-N.; Li, S.-Y.; He, L.; Chen, W.; et al. Comparative Physiological, Metabolomic, and Transcriptomic Analyses Reveal Developmental Stage-Dependent Effects of Cluster Bagging on Phenolic Metabolism in Cabernet Sauvignon Grape Berries. BMC Plant Biol. 2019, 19, 583. [Google Scholar] [CrossRef]
  5. Sivilotti, P.; Falchi, R.; Vanderweide, J.; Sabbatini, P.; Bubola, M.; Vanzo, A.; Lisjak, K.; Peterlunger, E.; Herrera, J.C. Yield Reduction through Cluster or Selective Berry Thinning Similarly Modulates Anthocyanins and Proanthocyanidins Composition in Refosco Dal Peduncolo Rosso (Vitis vinifera L.) Grapes. Sci. Hortic. 2020, 264, 109166. [Google Scholar] [CrossRef]
  6. Hochberg, U.; Degu, A.; Cramer, G.R.; Rachmilevitch, S.; Fait, A. Cultivar Specific Metabolic Changes in Grapevines Berry Skins in Relation to Deficit Irrigation and Hydraulic Behavior. Plant Physiol. Biochem. 2015, 88, 42–52. [Google Scholar] [CrossRef]
  7. Gutiérrez-Gamboa, G.; Romanazzi, G.; Garde-Cerdán, T.; Pérez-Álvarez, E.P. A Review of the Use of Biostimulants in the Vineyard for Improved Grape and Wine Quality: Effects on Prevention of Grapevine Diseases. J. Sci. Food Agric. 2019, 99, 1001–1009. [Google Scholar] [CrossRef]
  8. Świeca, M.; Sęczyk, Ł.; Gawlik-Dziki, U. Elicitation and Precursor Feeding as Tools for the Improvement of the Phenolic Content and Antioxidant Activity of Lentil Sprouts. Food Chem. 2014, 161, 288–295. [Google Scholar] [CrossRef] [PubMed]
  9. Santamaria, A.R.; Mulinacci, N.; Valletta, A.; Innocenti, M.; Pasqua, G. Effects of Elicitors on the Production of Resveratrol and Viniferins in Cell Cultures of Vitis vinifera L. cv Italia. J. Agric. Food Chem. 2011, 59, 9094–9101. [Google Scholar] [CrossRef]
  10. Portu, J.; López, R.; Santamaría, P.; Garde-Cerdán, T. Methyl Jasmonate Treatment to Increase Grape and Wine Phenolic Content in Tempranillo and Graciano Varieties During Two Growing Seasons. Sci. Hortic. 2018, 240, 378–386. [Google Scholar] [CrossRef]
  11. Paladines-Quezada, D.F.; Fernández-Fernández, J.I.; Moreno-Olivares, J.D.; Bleda-Sánchez, J.A.; Gómez-Martínez, J.C.; Martínez-Jiménez, J.A.; Gil-Muñoz, R. Application of Elicitors in Two Ripening Periods of Vitis vinifera L. cv Monastrell: Influence on Anthocyanin Concentration of Grapes and Wines. Molecules 2021, 26, 1689. [Google Scholar] [CrossRef] [PubMed]
  12. Ju, Y.-L.; Liu, M.; Zhao, H.; Meng, J.-F.; Fang, Y.-L. Effect of Exogenous Abscisic Acid and Methyl Jasmonate on Anthocyanin Composition, Fatty Acids, and Volatile Compounds of Cabernet Sauvignon (Vitis vinifera L.) Grape Berries. Molecules 2016, 21, 1354. [Google Scholar] [CrossRef] [PubMed]
  13. Portu, J.; Santamaría, P.; López-Alfaro, I.; López, R.; Garde-Cerdán, T. Methyl Jasmonate Foliar Application to Tempranillo Vineyard Improved Grape and Wine Phenolic Content. J. Agric. Food Chem. 2015, 63, 2328–2337. [Google Scholar] [CrossRef] [PubMed]
  14. Tessarin, P.; Chinnici, F.; Donnini, S.; Liquori, E.; Riponi, C.; Rombolà, A.D. Influence of Canopy-Applied Chitosan on the Composition of Organic Cv. Sangiovese and Cabernet Sauvignon Berries and Wines. Food Chem. 2016, 210, 512–519. [Google Scholar] [CrossRef] [PubMed]
  15. Xue, H.; Sekozawa, Y.; Sugaya, S. Effects of Gibberellin and Abscisic Acid on Fruit Quality and Aromatic Compound Formation During Fruit Development in ‘Kyoho’ Grapes (Vitis vinifera L. × Vitis labrusca L.). Environ. Control Biol. 2022, 60, 67–78. [Google Scholar] [CrossRef]
  16. Sáenz de Urturi, I.; Ribeiro-Gomes, F.M.; Marín-San Román, S.; Murillo-Peña, R.; Torres-Díaz, L.; González-Lázaro, M.; Pérez-Álvarez, E.P.; Garde-Cerdán, T. Vine Foliar Treatments at Veraison and Post-Veraison with Methyl Jasmonate Enhanced Aromatic, Phenolic and Nitrogen Composition of Tempranillo Blanco Grapes. Foods 2023, 12, 1142. [Google Scholar] [CrossRef]
  17. Miliordos, D.E.; Alatzas, A.; Kontoudakis, N.; Kouki, A.; Unlubayir, M.; Gémin, M.-P.; Tako, A.; Hatzopoulos, P.; Lanoue, A.; Kotseridis, Y. Abscisic Acid and Chitosan Modulate Polyphenol Metabolism and Berry Qualities in the Domestic White-Colored Cultivar Savvatiano. Plants 2022, 11, 1648. [Google Scholar] [CrossRef]
  18. Gomes, E.P.; Vanz Borges, C.; Monteiro, G.C.; Filiol Belin, M.A.; Minatel, I.O.; Pimentel Junior, A.; Tecchio, M.A.; Lima, G.P.P. Preharvest Salicylic Acid Treatments Improve Phenolic Compounds and Biogenic Amines in ‘Niagara Rosada’ Table Grape. Postharvest Biol. Technol. 2021, 176, 111505. [Google Scholar] [CrossRef]
  19. Wang, S.; Zhou, Y.; Luo, W.; Deng, L.; Yao, S.; Zeng, K. Primary Metabolites Analysis of Induced Citrus Fruit Disease Resistance Upon Treatment with Oligochitosan, Salicylic Acid and Pichia Membranaefaciens. Biol. Control 2020, 148, 104289. [Google Scholar] [CrossRef]
  20. He, Y.; Bose, S.K.; Wang, W.; Jia, X.; Lu, H.; Yin, H. Pre-Harvest Treatment of Chitosan Oligosaccharides Improved Strawberry Fruit Quality. Int. J. Mol. Sci. 2018, 19, 2194. [Google Scholar] [CrossRef]
  21. Cui, K.; Shu, C.; Zhao, H.; Fan, X.; Cao, J.; Jiang, W. Preharvest Chitosan Oligochitosan and Salicylic Acid Treatments Enhance Phenol Metabolism and Maintain the Postharvest Quality of Apricots (Prunus armeniaca L.). Sci. Hortic. 2020, 267, 109334. [Google Scholar] [CrossRef]
  22. Yu, L.; Zong, Y.; Han, Y.; Zhang, X.; Zhu, Y.; Oyom, W.; Gong, D.; Prusky, D.; Bi, Y. Both Chitosan and Chitooligosaccharide Treatments Accelerate Wound Healing of Pear Fruit by Activating Phenylpropanoid Metabolism. Int. J. Biol. Macromol. 2022, 205, 483–490. [Google Scholar] [CrossRef] [PubMed]
  23. Coombe, B.G. Growth Stages of the Grapevine: Adoption of a System for Identifying Grapevine Growth Stages. Aust. J. Grape Wine Res. 2008, 1, 104–110. [Google Scholar] [CrossRef]
  24. GB/T 15038-2006; Analytical Methods of Wine and Fruit Wine. Standards Press of China: Beijing, China, 2008; pp. 56–58.
  25. Liu, C.; Wu, L.; Fan, S.; Tao, Y.; Li, Y. The Protective Effect of Cyclodextrin on the Color Quality and Stability of Cabernet Sauvignon Red Wine. J. Integr. Agric. 2024, 23, 310–323. [Google Scholar] [CrossRef]
  26. Mhetre, V.B.; Patel, V.B.; Singh, S.K.; Mishra, G.P.; Verma, M.K.; Kumar, C.; Dahuja, A.; Kumar, S.; Singh, R.; Wasim Siddiqui, M. Unraveling the Pathways Influencing the Berry Color and Firmness of Grapevine Cv. Flame Seedless Treated with Bioregulators Using Biochemical and RNA-Seq Analysis Under Semi-Arid Subtropics. Food Chem. Mol. Sci. 2022, 5, 100116. [Google Scholar] [CrossRef]
  27. Asghari, M. 24-Epibrassinolide Enhanced the Quality Parameters and Phytochemical Contents of Table Grape. J. Appl. Bot. Food Qual. 2018, 91, 226–231. [Google Scholar] [CrossRef]
  28. Lv, X.; Li, L.; Lu, X.; Wang, W.; Sun, J.; Liu, Y.; Mu, J.; Ma, Q.; Wang, J. Effects of Organic Acids on Color Intensification, Thermodynamics, and Copigmentation Interactions with Anthocyanins. Food Chem. 2022, 396, 133691. [Google Scholar] [CrossRef]
  29. Tian, M.-B.; Ma, W.-H.; Xia, N.-Y.; Peng, J.; Hu, R.-Q.; Duan, C.-Q.; He, F. Soil Variables and Reflected Light Revealed the Plasticity of Grape and Wine Composition: Regulation of the Flavoromics under Inner Row Gravel Covering. Food Chem. 2023, 414, 135659. [Google Scholar] [CrossRef]
  30. Wang, Y.; Gao, X.-T.; Li, H.-Q.; Lu, H.-C.; He, L.; Peng, W.-T.; Chen, W.; Li, S.-D.; Li, S.-P.; Duan, C.-Q.; et al. Microclimate Changes Caused by Black Inter-Row Mulch Decrease Flavonoids Concentrations in Grapes and Wines under Semi-Arid Climate. Food Chem. 2021, 361, 130064. [Google Scholar] [CrossRef]
  31. Gao, Y.; Zhang, G.; Jiang, S.; Liu, Y.X. Wekemo Bioincloud: A User-Friendly Platform for Meta-Omics Data Analyses. Imeta 2024, 3, e175. [Google Scholar] [CrossRef]
  32. Bredun, M.A.; Gomes, T.M.; Assumpção, T.I.; Brighenti, A.F.; Chaves, E.S.; Panceri, C.P.; Burin, V.M. Statement of Boron Application Impact on Yield, Composition and Structural Properties in Merlot Grapes. Sci. Hortic. 2021, 288, 110364. [Google Scholar] [CrossRef]
  33. Yue, X.; Liu, S.; Wei, S.; Fang, Y.; Zhang, Z.; Ju, Y. Transcriptomic and Metabolic Analyses Provide New Insights into the Effects of Exogenous Sucrose on Monoterpene Synthesis in “Muscat Hamburg” Grapes. J. Agric. Food Chem. 2021, 69, 4164–4176. [Google Scholar] [CrossRef] [PubMed]
  34. Lecourieux, F.; Kappel, C.; Lecourieux, D.; Serrano, A.; Torres, E.; Arce-Johnson, P.; Delrot, S. An Update on Sugar Transport and Signalling in Grapevine. J. Exp. Bot. 2013, 65, 821–832. [Google Scholar] [CrossRef]
  35. Jiang, Y.; Fang, Y.; Wang, H.; Yang, X.; Zhu, X. Effects of exogenous brassinolide on flavor quality of Chardonnay and Pinot Noir grape. J. Fruit. Sci. 2023, 40, 2574–2590. [Google Scholar] [CrossRef]
  36. Lee, S.-Y.; Heo, J.-Y. Combined Treatment with Gibberellic Acid and Thidiazuron Improves Fruit Quality of ‘Red Dream’ Grape Cultivar. Not. Sci. Biol. 2023, 15, 11499. [Google Scholar] [CrossRef]
  37. İşçi, B.; Kacar, E.; Altındişli, A. The Effects of Some Exogenous Applications on Quality in ‘Crimson Seedless’ Grape. Erwerbs-Obstbau 2020, 62, 87–100. [Google Scholar] [CrossRef]
  38. Shahab, M.; Roberto, S.R.; Ahmed, S.; Colombo, R.C.; Silvestre, J.P.; Koyama, R.; de Souza, R.T. Anthocyanin Accumulation and Color Development of ‘Benitaka’ Table Grape Subjected to Exogenous Abscisic Acid Application at Different Timings of Ripening. Agronomy 2019, 9, 164. [Google Scholar] [CrossRef]
  39. Alcalde-Eon, C.; Pérez-Mestre, C.; Ferreras-Charro, R.; Rivero, F.J.; Heredia, F.J.; Escribano-Bailón, M.T. Addition of Mannoproteins and/or Seeds During Winemaking and Their Effects on Pigment Composition and Color Stability. J. Agric. Food Chem. 2019, 67, 4031–4042. [Google Scholar] [CrossRef] [PubMed]
  40. Koyama, R.; Colombo, R.C.; Silva Borges, W.F.; Silvestre, J.P.; Hussain, I.; Shahab, M.; Ahmed, S.; Prudencio, S.H.; Teodoro de Souza, R.; Roberto, S.R. Abscisic Acid Application Affects Color and Acceptance of the New Hybrid ‘Brs Melodia’ Seedless Grape Grown in a Subtropical Region. HortSci. Horts 2019, 54, 1055–1060. [Google Scholar] [CrossRef]
  41. Silva, V.; Singh, R.K.; Gomes, N.; Soares, B.G.; Silva, A.; Falco, V.; Capita, R.; Alonso-Calleja, C.; Pereira, J.E.; Amaral, J.S.; et al. Comparative Insight Upon Chitosan Solution and Chitosan Nanoparticles Application on the Phenolic Content, Antioxidant and Antimicrobial Activities of Individual Grape Components of Sousão Variety. Antioxidants 2020, 9, 178. [Google Scholar] [CrossRef]
  42. Jeong, Y.J.; Park, S.H.; Park, S.-C.; Kim, S.; Kim, T.H.; Lee, J.; Kim, S.W.; Ryu, Y.B.; Jeong, J.C.; Kim, C.Y. Induced Extracellular Production of Stilbenes in Grapevine Cell Culture Medium by Elicitation with Methyl Jasmonate and Stevioside. Bioresour. Bioprocess. 2020, 7, 38. [Google Scholar] [CrossRef]
  43. Rienth, M.; Vigneron, N.; Darriet, P.; Sweetman, C.; Burbidge, C.; Bonghi, C.; Walker, R.P.; Famiani, F.; Castellarin, S.D. Grape Berry Secondary Metabolites and Their Modulation by Abiotic Factors in a Climate Change Scenario—A Review. Front. Plant Sci. 2021, 12, 643258. [Google Scholar] [CrossRef] [PubMed]
  44. Xu, F.; Gao, X.; Xi, Z.-M.; Zhang, H.; Peng, X.-Q.; Wang, Z.-Z.; Wang, T.-M.; Meng, Y. Application of Exogenous 24-Epibrassinolide Enhances Proanthocyanidin Biosynthesis in Vitis vinifera ‘Cabernet Sauvignon’ Berry Skin. Plant Growth Regul. 2015, 75, 741–750. [Google Scholar] [CrossRef]
  45. Ju, Y.; Wang, W.; Yue, X.; Xue, W.; Zhang, Y.; Fang, Y. Integrated Metabolomic and Transcriptomic Analysis Reveals the Mechanism Underlying the Accumulation of Anthocyanins and Other Flavonoids in the Flesh and Skin of Teinturier Grapes. Plant Physiol. Biochem. 2023, 197, 107667. [Google Scholar] [CrossRef]
  46. Jiang, Y.; Wang, J.; Han, Y.; Wang, B.; Lei, C.; Sam, F.E.; Li, J.; Ma, T.; Zhang, B.; Feng, L. Transcriptome and Metabolite Profiles Reveal the Role of Benzothiadiazole in Controlling Isoprenoid Synthesis and Berry Ripening in Chardonnay Grapes. Pestic. Biochem. Physiol. 2024, 204, 106041. [Google Scholar] [CrossRef]
  47. Jiang, H.; Wang, B.; Ma, L.; Zheng, X.; Gong, D.; Xue, H.; Bi, Y.; Wang, Y.; Zhang, Z.; Prusky, D. Benzo-(1, 2, 3)-Thiadiazole-7-Carbothioic Acid S-Methyl Ester (Bth) Promotes Tuber Wound Healing of Potato by Elevation of Phenylpropanoid Metabolism. Postharvest Biol. Technol. 2019, 153, 125–132. [Google Scholar] [CrossRef]
  48. Wang, J.; Yao, X.; Xia, N.; Sun, Q.; Duan, C.; Pan, Q. Evolution of Seed-Soluble and Insoluble Tannins During Grape Berry Maturation. Molecules 2023, 28, 3050. [Google Scholar] [CrossRef] [PubMed]
  49. Deluc, L.; Bogs, J.; Walker, A.R.; Ferrier, T.; Decendit, A.; Merillon, J.M.; Robinson, S.P.; Barrieu, F. The Transcription Factor Vvmyb5b Contributes to the Regulation of Anthocyanin and Proanthocyanidin Biosynthesis in Developing Grape Berries. Plant Physiol. 2008, 147, 2041–2053. [Google Scholar] [CrossRef]
  50. Zerbib, M.; Cazals, G.; Enjalbal, C.; Saucier, C. Identification and Quantification of Flavanol Glycosides in Vitis vinifera Grape Seeds and Skins During Ripening. Molecules 2018, 23, 2745. [Google Scholar] [CrossRef]
  51. Conde, A.; Badim, H.; Dinis, L.-T.; Moutinho-Pereira, J.; Ferrier, M.; Unlubayir, M.; Lanoue, A.; Gerós, H. Stimulation of Secondary Metabolism in Grape Berry Exocarps by a Nature-Based Strategy of Foliar Application of Polyols. OENO One 2024, 58, 7537. [Google Scholar] [CrossRef]
  52. Sun, H.-L.; Wang, X.-Y.; Shang, Y.; Wang, X.-Q.; Du, G.-D.; LÜ, D.-G. Preharvest Application of Melatonin Induces Anthocyanin Accumulation and Related Gene Upregulation in Red Pear (Pyrus ussuriensis). J. Integr. Agric. 2021, 20, 2126–2137. [Google Scholar] [CrossRef]
  53. Gil, R. Improving Phenolic and Chromatic Characteristics of Monastrell, Merlot and Syrah Wines by Using Methyl Jasmonate and Benzothiadiazole. OENO One 2017, 51, 17–27. [Google Scholar] [CrossRef]
  54. Dimitrovska, M.; Bocevska, M.; Dimitrovski, D.; Murkovic, M. Anthocyanin Composition of Vranec, Cabernet Sauvignon, Merlot and Pinot Noir Grapes as Indicator of Their Varietal Differentiation. Eur. Food Res. Technol. 2011, 232, 591–600. [Google Scholar] [CrossRef]
  55. Fang, J.; Jogaiah, S.; Guan, L.; Sun, X.; Abdelrahman, M. Coloring Biology in Grape Skin: A Prospective Strategy for Molecular Farming. Physiol. Plant. 2018, 164, 429–441. [Google Scholar] [CrossRef]
  56. Azuma, A. Genetic and Environmental Impacts on the Biosynthesis of Anthocyanins in Grapes. Hortic. J. 2018, 87, 1–17. [Google Scholar] [CrossRef]
  57. Sun, L.; Fan, X.; Zhang, Y.; Jiang, J.; Sun, H.; Liu, C. Transcriptome Analysis of Genes Involved in Anthocyanins Biosynthesis and Transport in Berries of Black and White Spine Grapes (Vitis davidii). Hereditas 2016, 153, 17. [Google Scholar] [CrossRef]
  58. Portu, J.; López, R.; Baroja, E.; Santamaría, P.; Garde-Cerdán, T. Improvement of Grape and Wine Phenolic Content by Foliar Application to Grapevine of Three Different Elicitors: Methyl Jasmonate, Chitosan, and Yeast Extract. Food Chem. 2016, 201, 213–221. [Google Scholar] [CrossRef]
  59. Gómez-Plaza, E.; Bautista-Ortín, A.B.; Ruiz-García, Y.; Fernández-Fernández, J.I.; Gil-Muñoz, R. Effect of Elicitors on the Evolution of Grape Phenolic Compounds During the Ripening Period. J. Sci. Food Agric. 2017, 97, 977–983. [Google Scholar] [CrossRef]
  60. Paladines-Quezada, D.F.; Moreno-Olivares, J.D.; Fernández-Fernández, J.I.; Bleda-Sánchez, J.A.; Martínez-Moreno, A.; Gil-Muñoz, R. Elicitors and Pre-Fermentative Cold Maceration: Effects on Polyphenol Concentration in Monastrell Grapes and Wines. Biomolecules 2019, 9, 671. [Google Scholar] [CrossRef]
  61. Zhou, Y.; Yuan, C.; Ruan, S.; Zhang, Z.; Meng, J.; Xi, Z. Exogenous 24-Epibrassinolide Interacts with Light to Regulate Anthocyanin and Proanthocyanidin Biosynthesis in Cabernet Sauvignon (Vitis vinifera L.). Molecules 2018, 23, 93. [Google Scholar] [CrossRef]
  62. Lucini, L.; Baccolo, G.; Rouphael, Y.; Colla, G.; Bavaresco, L.; Trevisan, M. Chitosan Treatment Elicited Defence Mechanisms, Pentacyclic Triterpenoids and Stilbene Accumulation in Grape (Vitis vinifera L.) Bunches. Phytochemistry 2018, 156, 1–8. [Google Scholar] [CrossRef] [PubMed]
  63. Shen, N.; Wang, T.; Gan, Q.; Liu, S.; Wang, L.; Jin, B. Plant Flavonoids: Classification, Distribution, Biosynthesis, and Antioxidant Activity. Food Chem. 2022, 383, 132531. [Google Scholar] [CrossRef] [PubMed]
  64. Yu, K.; Dixon, R.A.; Duan, C. A Role for Ascorbate Conjugates of (+)-Catechin in Proanthocyanidin Polymerization. Nat. Commun. 2022, 13, 3425. [Google Scholar] [CrossRef]
  65. Yu, K.; Song, Y.; Lin, J.; Dixon, R.A. The Complexities of Proanthocyanidin Biosynthesis and Its Regulation in Plants. Plant Commun. 2023, 4, 100498. [Google Scholar] [CrossRef]
  66. Li, J.; Han, A.; Zhang, L.; Meng, Y.; Xu, L.; Ma, F.; Liu, R. Chitosan Oligosaccharide Alleviates the Growth Inhibition Caused by Physcion and Synergistically Enhances Resilience in Maize Seedlings. Sci. Rep. 2022, 12, 162. [Google Scholar] [CrossRef]
  67. Li, J.; Tian, Z.; Li, J.; Askari, K.; Han, A.; Ma, J.; Liu, R. Physcion and Chitosan-Oligosaccharide (Cos) Synergistically Improve the Yield by Enhancing Photosynthetic Efficiency and Resilience in Wheat (Triticum aestivum L.). Plant Physiol. Biochem. 2023, 203, 107993. [Google Scholar] [CrossRef] [PubMed]
  68. Mukarram, M.; Khan, M.M.A.; Kurjak, D.; Corpas, F.J. Chitosan Oligomers (Cos) Trigger a Coordinated Biochemical Response of Lemongrass (Cymbopogon flexuosus) Plants to Palliate Salinity-Induced Oxidative Stress. Sci. Rep. 2023, 13, 8636. [Google Scholar] [CrossRef]
  69. Berli, F.J.; Fanzone, M.; Piccoli, P.; Bottini, R. Solar UV-B and ABA Are Involved in Phenol Metabolism of Vitis vinifera L. Increasing Biosynthesis of Berry Skin Polyphenols. J. Agric. Food Chem. 2011, 59, 4874–4884. [Google Scholar] [CrossRef] [PubMed]
  70. Zhang, X.; Lu, X.; Shi, Q.; Xu, X.-Q.; Leung, H.-C.E.; Harris, L.N.; Iglehart, J.D.; Miron, A.; Liu, J.S.; Wong, W.H. Recursive SVM Feature Selection and Sample Classification for Mass-Spectrometry and Microarray Data. BMC Bioinform. 2006, 7, 197. [Google Scholar] [CrossRef]
  71. Gong, Q.; Yu, J.; Guo, Z.; Fu, K.; Xu, Y.; Zou, H.; Li, C.; Si, J.; Cai, S.; Chen, D.; et al. Accumulation Mechanism of Metabolite Markers Identified by Machine Learning between Qingyuan and Xiushui Counties in Polygonatum Cyrtonema Hua. BMC Plant Biol. 2024, 24, 173. [Google Scholar] [CrossRef]
  72. Wang, H.; Yang, F.; Luo, Z. An Experimental Study of the Intrinsic Stability of Random Forest Variable Importance Measures. BMC Bioinform. 2016, 17, 60. [Google Scholar] [CrossRef] [PubMed]
  73. Statnikov, A.; Wang, L.; Aliferis, C.F. A Comprehensive Comparison of Random Forests and Support Vector Machines for Microarray-Based Cancer Classification. BMC Bioinform. 2008, 9, 319. [Google Scholar] [CrossRef] [PubMed]
  74. Zagajewski, B.; Kluczek, M.; Raczko, E.; Njegovec, A.; Anca, D.; Kycko, M. Comparison of Random Forest, Support Vector Machines, and Neural Networks for Post-Disaster Forest Species Mapping of the Krkonoše/Karkonosze Transboundary Biosphere Reserve. Remote Sens. 2021, 13, 2581. [Google Scholar] [CrossRef]
  75. Singh, R.K.; Martins, V.; Soares, B.; Castro, I.; Falco, V. Chitosan Application in Vineyards (Vitis vinifera L. Cv. Tinto Cão) Induces Accumulation of Anthocyanins and Other Phenolics in Berries, Mediated by Modifications in the Transcription of Secondary Metabolism Genes. Int. J. Mol. Sci. 2020, 21, 306. [Google Scholar] [CrossRef]
  76. Shi, J.; Simal-Gandara, J.; Mei, J.; Ma, W.; Peng, Q.; Shi, Y.; Xu, Q.; Lin, Z.; Lv, H. Insight into the Pigmented Anthocyanins and the Major Potential Co-Pigmented Flavonoids in Purple-Coloured Leaf Teas. Food Chem. 2021, 363, 130278. [Google Scholar] [CrossRef]
  77. Wang, H.; Wang, W.; Huang, W.; Xu, H. Effect of Salicylic Acid on the Gene Transcript and Protein Accumulation of Flavonoid Biosynthesis-related Enzymes in Vitis vinifera Cell Suspension Cultures. HortScience 2017, 52, 1772–1779. [Google Scholar] [CrossRef]
Figure 1. Effects of COS treatment at different stages on the concentration of phenolic compounds in grapes. (A) the concentration of the skin and seed total phenolic (Skin-TP, Seed-TP); (B) the concentration of the skin and seed total flavonoid (Skin-TFD, Seed-TFD); (C) the concentration of the skin and seed total tannin (Skin-TT, Seed-TT); (D) the concentration of the skin and seed total flavanol (Skin-TFA, Seed-TFA); (E) the concentration of the skin and seed total anthocyanidin (ANT). Results are expressed as fold changes of the mean ± SD values obtained for COS treatment relative to control, and different letters in the same column indicate significant differences according to Duncan’s test (p < 0.05).
Agriculture 14 02039 g001
Figure 2. Effects of COS treatment at different stages on monomeric anthocyanins in grapes. (A) the concentration of the 15 monomeric anthocyanins (Nomenclature abbreviations: Dp, delphinidin; Cn, cyanidin; Pt, petunidin; Pn, peonidin; Mv, malvidin; 3G, glucoside; AG, acetyl-glucoside; CumG, coumaroyl-glucoside); (B) enlarged view of coumarylated anthocyanin content; (C) the proportion of 5 types of monoglucoside anthocyanin compounds; (D) the proportion of anthocyanins of 3 different acylation types; (E) the ratio of methylated to non-methylated anthocyanins and acylated to non-acylated anthocyanins.
Agriculture 14 02039 g002
Figure 3. Effects of COS treatment at different stages on the concentration of non-anthocyanin compounds in grapes. (A) the concentration of flavonol compounds; (B) the concentration of flavanol compounds; (C) the concentration of phenolic acid compounds; (D) the concentration of stilbene compounds. Results are expressed as fold changes of the mean ± SD values obtained for COS treatment relative to control, and different letters in the same column indicate significant differences according to Duncan’s test (p < 0.05).
Agriculture 14 02039 g003
Figure 4. Correlation coefficient matrix of anthocyanin phenol content and non-anthocyanin phenol content in grape akin. Asterisks indicate the significance of the correlations: * p ≤ 0.05; ** p ≤ 0.01; *** p ≤ 0.001. Colors approaching positive indicate a positive correlation, while those approaching negative indicate a negative correlation. The larger the circle, the stronger the correlation.
Agriculture 14 02039 g004
Figure 5. OPLS-DA analyses of compounds in grape. (A) model validation, 200 times of randomization of the permutation test; (B) model validation, CV-ANOVA; (C) biplot of the OPLS-DA model (the triangle represents the treatment group, the blue circle represents the monomer phenolic compound, the box shape represents the total phenolic substances, the four-point star represents the physical and chemical indexes, and the diamond represents the color parameters); (D) VIP value.
Agriculture 14 02039 g005
Figure 6. Machine learning method to identify characteristic substances and statistical analysis. (A) Support Vector Machine-Recursive Feature Elimination; (B) Random Forest; (C) Upset diagram; (D) Cluster heatmap.
Agriculture 14 02039 g006
Table 1. Physicochemical parameters of grapes treated with COS at different stages.
Sample100-BW (g)TSS (°Brix)RS (g/L)TA (g/L)pHS/A
CK108.99 ± 1.98 b21.57 ± 1.79 b227.80 ± 10.17 c4.53 ± 0.15 c3.78 ± 0.04 a50.26 ± 1.94 ab
GC120.80 ± 3.16 a24.27 ± 0.25 a256.83 ± 3.48 a5.37 ± 0.15 a3.67 ± 0.04 c47.87 ± 0.73 bc
VC116.43 ± 3.75 ab23.20 ± 0.26 ab241.73 ± 9.76 bc5.13 ± 0.06 a3.70 ± 0.01 bc47.08 ± 1.35 c
RC112.93 ± 8.65 ab23.80 ± 0.10 a251.00 ± 1.44 ab4.80 ± 0.10 b3.75 ± 0.03 ab52.31 ± 1.20 a
Data are means ± SD; different letters in the same column indicate significant differences according to Duncan’s test (p < 0.05). The abbreviations used are 100-BW (Average 100-berry weight), TA (total acid), RS (reducing sugars), TSS (total soluble solids), and S/A (sugar–acid ratio).
Table 2. Color indexes of grapes treated with COS at different stages.
SampleL*a*b*C*abhabΔE*ab
CK81.57 ± 0.78 a16.61 ± 0.95 c15.54 ± 1.11 a22.76 ± 0.99 c0.75 ± 0.05 a-
GC79.15 ± 0.77 b20.93 ± 0.73 a12.96 ± 0.20 b24.62 ± 0.52 a0.55 ± 0.02 c5.64 ± 0.85 a
VC79.14 ± 0.28 b21.63 ± 0.47 a10.73 ± 1.19 c24.16 ± 0.10 ab0.46 ± 0.05 d6.82 ± 0.16 a
RC81.19 ± 0.65 a18.16 ± 0.50 b14.27 ± 0.72 ab23.10 ± 0.48 bc0.67 ± 0.03 b1.94 ± 0.53 b
Data are means ± SD; different letters in the same column indicate significant differences according to Duncan’s test (p < 0.05).
Disclaimer/Publisher’s Note: The statements, opinions and data contained in all publications are solely those of the individual author(s) and contributor(s) and not of MDPI and/or the editor(s). MDPI and/or the editor(s) disclaim responsibility for any injury to people or property resulting from any ideas, methods, instructions or products referred to in the content.