Abstract
This paper aimed to investigate the amino acid, fatty acid, proximate composition, total phenolic content (TPC), texture, color, and sensory properties of an Emmental type cheese from Ţara Dornelor, Romania as influenced by the processing technology (CA sample made in a stainless steel tank, with spontaneous microflora and ripening of 70 days, and TC sample made in a copper tank, with standard culture and 90 days ripening) and season (winter or summer). The results revealed that the winter samples had higher dry matter content, and were richer in some fatty acids such as palmitoleic acid, isooleic acid, 13-octadecenoic acid, and linoleic acid compared to summer. The season factor influenced significantly (p < 0.05) the amino acid profile, while the processing technology did not have a major impact. The TPC was affected by the processing technology, with the TC sample being the richest. The texture and sensory properties showed significant differences (p < 0.05) depending on the processing conditions and season. TC samples showed lower luminosity, greener, and less yellow nuance compared to CA. A reduction in the color parameters was observed in summer compared to winter. The global acceptance was correlated with the white index, the most appreciated sample obtained in summer, in a stainless steel tank.
1. Introduction
Cheese is an important fount of nutrients for human nutrition, among them being proteins, bioactive peptides, amino acids, lipids, fatty acids, vitamins, etc. [1]. Cheese products can also be consumed by persons with intolerance to lactose since about 94% of the lactose is drained with the serum in the manufacturing process and the remaining amount is fermented by the lactic bacteria [2]. Emmental cheese is a hard type of cheese that is ripened for a long time and it has a long history, starting from the 12th century in Switzerland [3]. Currently, this product is manufactured in European countries, including Romania, and the Swiss Emmental cheese obtained from raw milk is labeled as PDO (protected denomination origin) [4]. The bioactive peptides generated during cheese ripening exert various health benefits, including cardiovascular, nervous, digestive, and immunological effects [5]. With a fat content between 20 and 35% that gives the texture and aroma of the final products, cheese contains important healthy fatty acids such as n-3 polyunsaturated fatty acids (PUFA) with anti-inflammatory effects, specific individual saturated fatty acids with an important role in cell regulation, gene expression, and bioavailability of PUFA, and conjugated linoleic acids [2,5].
Many factors influence the final product quality, including milk microflora and chemical composition, the processing technology, the ripening period, production environmental conditions, etc. For example, it has been demonstrated that the fatty acid profile of cheese is affected by pasteurization because of the proteolysis and lipolysis induced by the enzymes [1]. During ripening, the protein and lipid content increase due to the dehydration process [5]. The use of a traditional copper tank for Emmental cheese production could have a major impact on the final product quality since copper can influence lactic and propionic bacteria activity and proteolytic enzyme activity [6]. The ripening time and conditions have a major impact on the development of the sensory characteristics and the chemical composition of the cheese due to the various biochemical reactions that happen in this processing step (proteolysis, glycolysis, and lipolysis) [7]. Proteolysis releases small peptides and amino acids during ripening, and the decomposition of the amino acids generates flavor compounds, while the break of the protein network leads to changes in the final product texture [8]. Lipolysis leads to the formation of free fatty acids after the hydrolysis of triglycerides [8]. Lactose is decomposed by the lactic bacteria mostly at the beginning of the ripening process since salting affects lactic bacteria activity, generating compounds like diacetyl, acetic, and propionic acids with a major impact on final product texture and aroma [9].
The chemical composition of milk and cheese is affected by seasonal variations of the pasture, the amount and chemical constituents of the plants consumed by the cows, and the stage of vegetation of the grass [10]. During the summer, in general, the grassland fatty acid composition changes [11]. Lopez et al. [12] revealed similar values for winter and summer milk branched-chain fatty acids, while the amount of rumenic acid and other healthy fatty acids was greater in summer which demonstrated that summer milk presents a better lipid. Heat stress has a major impact on animal welfare and consequently on milk quality because it causes lower bloodstream in the mammary gland due to the reduced feed intake and the diminishing of glucose uptake caused by the decrease in trans-mammary processing of glucose [13]. Milk raw material microbiota is also affected by the season [14], which will generate differences in cheese final product quality, especially when no starter cultures are added.
To our knowledge, there is no research focused on the impact of the combined effect of season and processing technology particularities on the Swiss Emmental cheese type characteristics. Furthermore, the Emmental Swiss cheese produced in the Dorna area—a location with a tradition in the production of Swiss cheese-type products, was not explored for its chemical profile until the date. In this context, this work aimed to highlight the impact of season and production technology on the quality parameters of some Emmental cheeses produced in the Ţara Dornelor area, Romania. For this purpose, the fatty acid, amino acid, proximate composition, total polyphenols, color, texture, and sensory properties were assessed.
2. Materials and Methods
2.1. Materials
Dorna Emmental cheese samples made from cow milk were collected in 2022 from two producers from the Dorna basin area, Romania, at the beginning of different seasons (winter and summer). Producer 1 technology uses a double-walled stainless-steel boiler with water for cheese manufacture, while Producer 2 uses a copper boiler and wood heating. Another difference between the processing technologies is related to the addition of standard lactic culture by producer 2. Producer 1 mixes 60% raw milk with 40% pasteurized milk in the manufacturing process, while Producer 2 uses a ratio of 70:30 raw milk/pasteurized milk. The ripening period is also distinct; Producer 1 samples were kept for 70 days, while Producer 2 samples were kept for 90 days in special controlled conditions rooms. Details about the processing technologies are given in our previous published papers: Necula, Tamas-Krumpe et al. [15] for Producer 1 technology and Necula, Tamas-Krumpe, et al. [14] for Producer 2 technology.
Samples codification is the following: CAW—winter sample from Producer 1, CAS—summer sample from Producer 1, TCW—winter sample from Producer 2, TCS—summer sample from Producer 2.
Winter season means temperature values in 2022 in the studied area were comprised between 1.5 and −2.15 °C, the humidity between 87.50 and 89.00%, the rain between 60.10 and 74.45 L/m2, and the air pressure between 857.45 and 850.60 mb. In the summer season, the mean values of the temperature were 12.55–14.50 °C, the humidity of 82.00–86.00%, rain of 61.15–127.85 L/m2, and air pressure of 850.35–855.60 mb [16].
Dorna Emmental cheese processing in both factories comprises milk slow pasteurization, the mix of various proportions (depending on the producer) of pasteurized and unpasteurized milk, the addition of lactic culture (this step is carried out only in Producer 2 factory), coagulation, curd manipulation, curd scalding and draining, cheese formation in matrices, pressing, brining, drying and maturation.
2.2. Methods
2.2.1. Proximate Composition Analysis
The proximate composition was determined according to the AOAC standard methods: 933.05 for fat analysis [17], 969.19–1974 for moisture and dry matter content determination [18], 935.4 for ash measurement [19], and 920.123–1920 for protein [20] analysis. The total carbohydrate content was calculated by difference.
2.2.2. Fatty Acid Profile Analysis
Cheese samples were derivatized before fatty acids analysis to obtain methyl esters, according to a previously reported method [21]. An amount of 0.1 g of the cheese was mixed with 3 mL of 20% boron trifluoride methanolic solution. The mixture was ultrasonicated for one hour at 80 °C to allow derivatization. Then, it was cooled at room temperature and mixed with 2.5 mL of NaCl 10%. The methyl esters were separated into 2 mL of hexane; the organic part was extracted by centrifugation at 3000 rpm for 15 min and the esters present in the hexane part (1 μL) were analyzed by GCMS-QP2010 PLUS (Shimadzu, Kyoto, Japan) on an AT-WAX column (30 m × 0.32 mm × 1 μm). The flow rate of the carrier gas (helium) was set to 1 mL/min. The separation steps were the following: initial column temperature, 140 °C for 10 min, then a gradient of 7 °C/min was set to 250 °C, and the temperature was kept for 10 min. The temperature of the ion source and the GC–MS interface was 210 °C and 255 °C, respectively [21]. Methyl esters were pointed out using the NIST 05 spectrum library, and the amount was determined by the area standardization protocol. The proportion of the different fatty acids was calculated by relating the peak area specific for a certain compound to the total area of all peaks in the chromatogram. The analysis was performed five times for each sample.
2.2.3. Amino Acid Analysis
The amino acids were determined according to a previous method described by Aleya et al. [22], by using a Dionex Ultimate 3000RS ultrahigh pressure liquid chromatography (UHPLC) system. The device was equipped with a Thermo Scientific Accucore C18 column (Thermo Scientific; San Jose, CA, USA), with L./I.D. of 100/2.1 mm (particle size of 2.6 µm), that was coupled to a Thermo Q Exactive Orbitrap mass spectrometer (MS) combined with an electrospray ionization source (ESI), having an accuracy of 5 ppm.
2.2.4. Total Phenolic Content
An amount of 5 g of cheese was extracted with 80% methanol. An aliquot of 0.5 mL of extract was mixed with 2.5 mL of 0.2 N Folin-Ciocalteu reagent. After 5 min, 2 mL of 75 g/L Na2CO3 solution was added and the samples were kept in the darkness for 2 h. The absorbance at 760 nm using a spectrophotometer. A gallic acid curve (0; 5; 10; 20; 50; 100; 200 mg/L) was made (R2 = 0.99, y = 0.011x + 0.0041).
2.3. Texture Parameters Analysis
2.3.1. Compression
A single-cycle compression test was performed on a cubic piece of Dorna Emmental cheese with a 10 mm side by using a cylinder probe with a 25 mm diameter of the Perten TVT 6700 texturometer. The compression was made to 7.5 mm of the sample height at an initial speed of 3 mm/s, a test speed of 2 mm/s, and a trigger force of 10 g. The data obtained for firmness, stickiness, and adhesiveness were processed by using TexCalc software (version 5). The measurements were repeated 7 times for each sample.
2.3.2. Cutting Force
The cheese sample cutting force was determined by using the Perten TVT 6700 texturometer equipped with a cutting wire of 0.4 mm. The sample cube (10 mm side) was cut at an initial and test speed of 0.5 mm/s, and a trigger force of 50 g. The determination was repeated 7 times for each sample.
2.3.3. Color Determination
The color parameters of Dorna Emmental cheese were evaluated by using a KonCAWMinolta colorimeter (CR-400 model, Tokyo, Japan). The luminosity (L*), red-green intensity (a*), and yellow-blue intensity (b*) were evaluated in the CIE-Lab system by reflectance Chroma (Equation (1)), hue angle (Equation (2)), yellow index (Equation (3)), white index (Equation (4)) and brown index (Equation (5)) were calculated using the data measured and according to the equations previously reported [23].
where C—chroma, a*—red-green intensity, b*—yellow-blue intensity.
where H—hue angle, 180° is used because a* < 0 and b* > 0.
where YI—yellow index, L*—luminosity.
where WI—white index.
where BI—brown index, X—constant and .
At least three measurements were performed for each sample.
2.3.4. Sensory Properties
The sensory properties of Dorna Emmental cheese were evaluated according to the SR 6345:1995 standard [24]. A number of 25 semi-trained panelists evaluated the cheese samples voluntarily, in one session. The characteristics considered were aspect and form, color, consistency, smell, taste, and global acceptance which were scored on a 5-point scale. Mouth cleaning before sample testing was carried out with water. The panelists participated voluntarily and verbal informed consent was obtained from each judge.
2.3.5. Statistics
The results were reported as a mean of at least 3 repetitions ± standard deviation. Analysis of variance (ANOVA) with two factors was applied to evaluate the effects of factors (season and production technology) and their interaction on the studied variables. The significance level was considered to be 5%. To highlight the relationships between the characteristics studied and the cheese samples, Principal Component Analysis (PCA) was performed based on Pearson’s correlations (significant at p < 0.05). XL STAT 2023.2.1 version and SPSS (trial version) were used for data processing.
3. Results
3.1. Proximate Composition
The proximate composition of the Emmental cheese samples is presented in Figure 1. Significant differences (p < 0.05) were observed between the dry matter content, with the winter samples exhibiting higher values compared to summer ones. The winter sample made in a stainless steel tank (CAW) showed lower protein and ash content, while TCS presented the highest fat content. No significant differences (p > 0.05) were obtained for the total carbohydrate content.
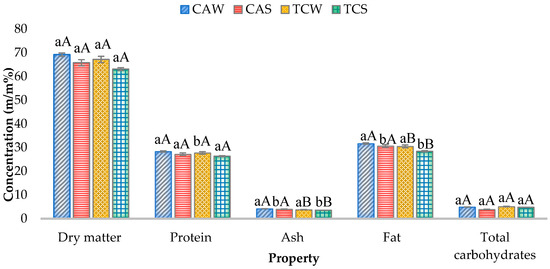
Figure 1.
Proximate composition of cheese: a,b (for season) and A,B (for producers) mean values followed by different letters are significantly different (p < 0.05), CAS—summer sample from Producer 1, CAW—winter sample from Producer 1, TCW—winter sample from Producer 2, TCS—summer sample from Producer 2.
The season and production technology significantly influenced (p < 0.05) the fat, ash, and dry matter content, while the interaction between factors only affected the ash and dry matter content in a significant way.
3.2. Fatty Acid Profile
The content of fatty acids in Emmental cheese samples is displayed in Table 1. In the summer season, the Emmental cheese was richer in 13-methyl palmitic acid, vaccenic acid, stearic acid, arachidic acid, and 11,14-octadecadienoic acid compared to the winter samples. The samples obtained in stainless steel and with spontaneous flora (CAW and CAS) are richer in pentadecanoic acid, 15-methyl palmitic acid, margaric acid, stearic acid, arachidic acid, and linoleic acid content, while the other studied fatty acids were more abundant in the TC samples produced in a copper tank and with standard lactic acid bacteria.

Table 1.
Fatty acid profile of cheese samples.
The season factor significantly affected (p < 0.05) the profile of fatty acids, except the capric acid, isomargaric acid, linolenic acid, oleic acid, 13-octadecenoic acid, 1-methylbutyl hexadecanoate, and CLA content. On the other hand, the processing technology had significant effects (p < 0.05) only on linoleic acid, 11,14-octadecadienoic acid, 1-Methylbutyl hexadecanoate, capric acid, lauric acid, tetradecenoic acid, and myristic acid content, while the interaction between factors had a significant influence (p < 0.05) only on 11,14-octadecadienoic acid content (Table S1, Supplementary Material).
3.3. Amino Acid Profile
Small differences were observed between samples regarding the amino acid profile. Summer samples were richer in leucine and lysine, with the highest values observed for the CAS cheese sample (Table 2). The production technology had no significant effects (p < 0.05) on the amino acid profile, except on the glycine content, while the interaction between factors affected significantly only the glycine and glutamine content. The season presented a significant influence (p < 0.05) on the content of the amino acid, except on the proline, cysteine, valine, methionine, and isoleucine content (Table S1, Supplementary Material).
Table 2.
Amino acid profile of cheese samples.
3.4. Total Phenolic Content (TPC)
The TPC of cheese samples showed higher values in the TC samples compared to CA in both seasons. The highest value was obtained for the winter sample produced in the copper tank and with a standard bacteria culture (TCW), while the lowest TCP content was observed in the summer sample manufactured in a stainless tank (CAS) (Figure 2).
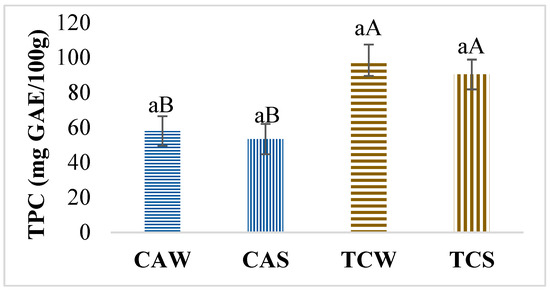
Figure 2.
Total phenolic content (TPC): a,b (for season) and A,B (for producers) mean values followed by different letters are significantly different (p < 0.05), CAW—winter sample from Producer 1, CAS—summer sample from Producer 1, TCW—winter sample from Producer 2, TCS—summer sample from Producer 2.
The production technology significantly affected the TPC content (Table S1, Supplementary Material), while the season and the interaction between factors exhibited no significant influence.
3.5. Texture Parameters
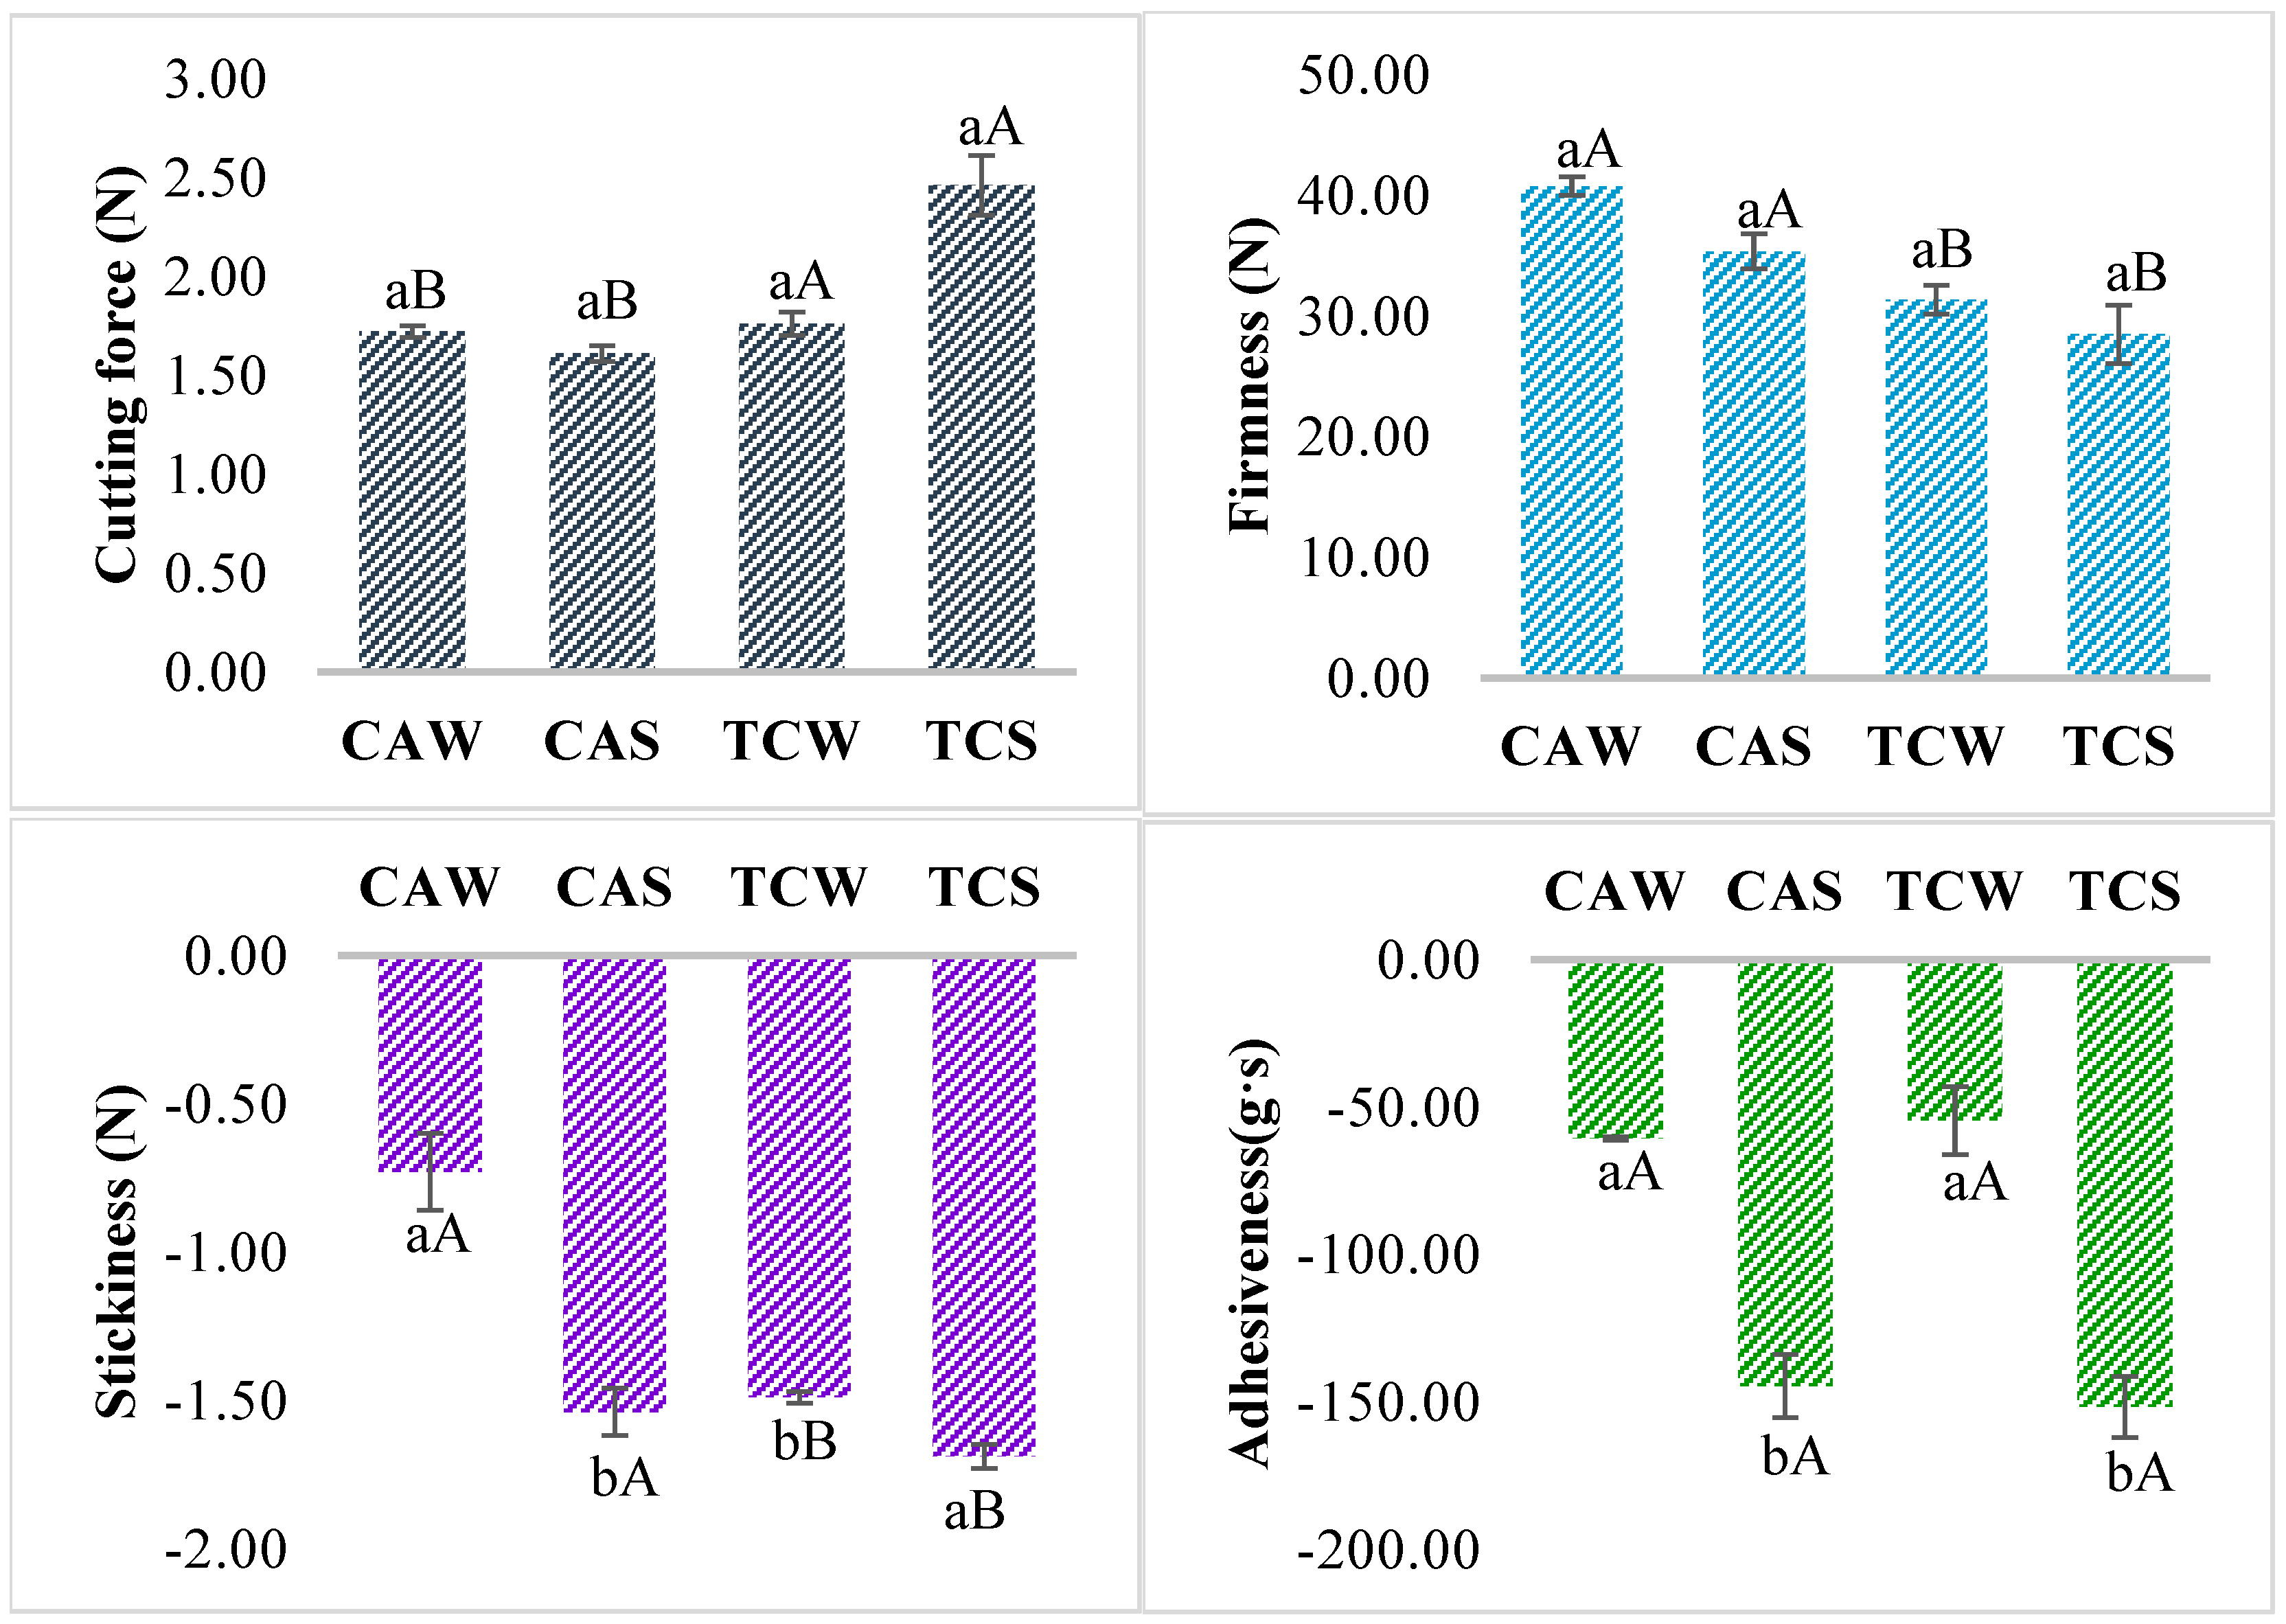
The texture features of the Emmental cheese samples are displayed in Figure 3. TC samples presented higher cutting force compared with CA cheese, with the highest cutting force being observed for the TCS sample. Firmness decreased during the summer season and the CA samples were firmer compared to the TC ones. The cheese obtained in summer was more sticky and more adhesive compared to winter samples, while the TC samples presented higher values for these parameters compared to the CA ones.

Figure 3.
Texture parameters of cheese samples: a,b (for season) and A,B (for producers) mean values followed by different letters are significantly different (p < 0.05), CAW—winter sample from Producer 1, CAS—summer sample from Producer 1, TCW—winter sample from Producer 2, TCS—summer sample from Producer 2.
Season factor significantly affected (p < 0.05) the texture parameters, while the processing technology had a significant effect only on adhesiveness (Table S1, Supplementary Material). The interaction factors significantly influenced (p < 0.05) the cutting force and the stickiness.
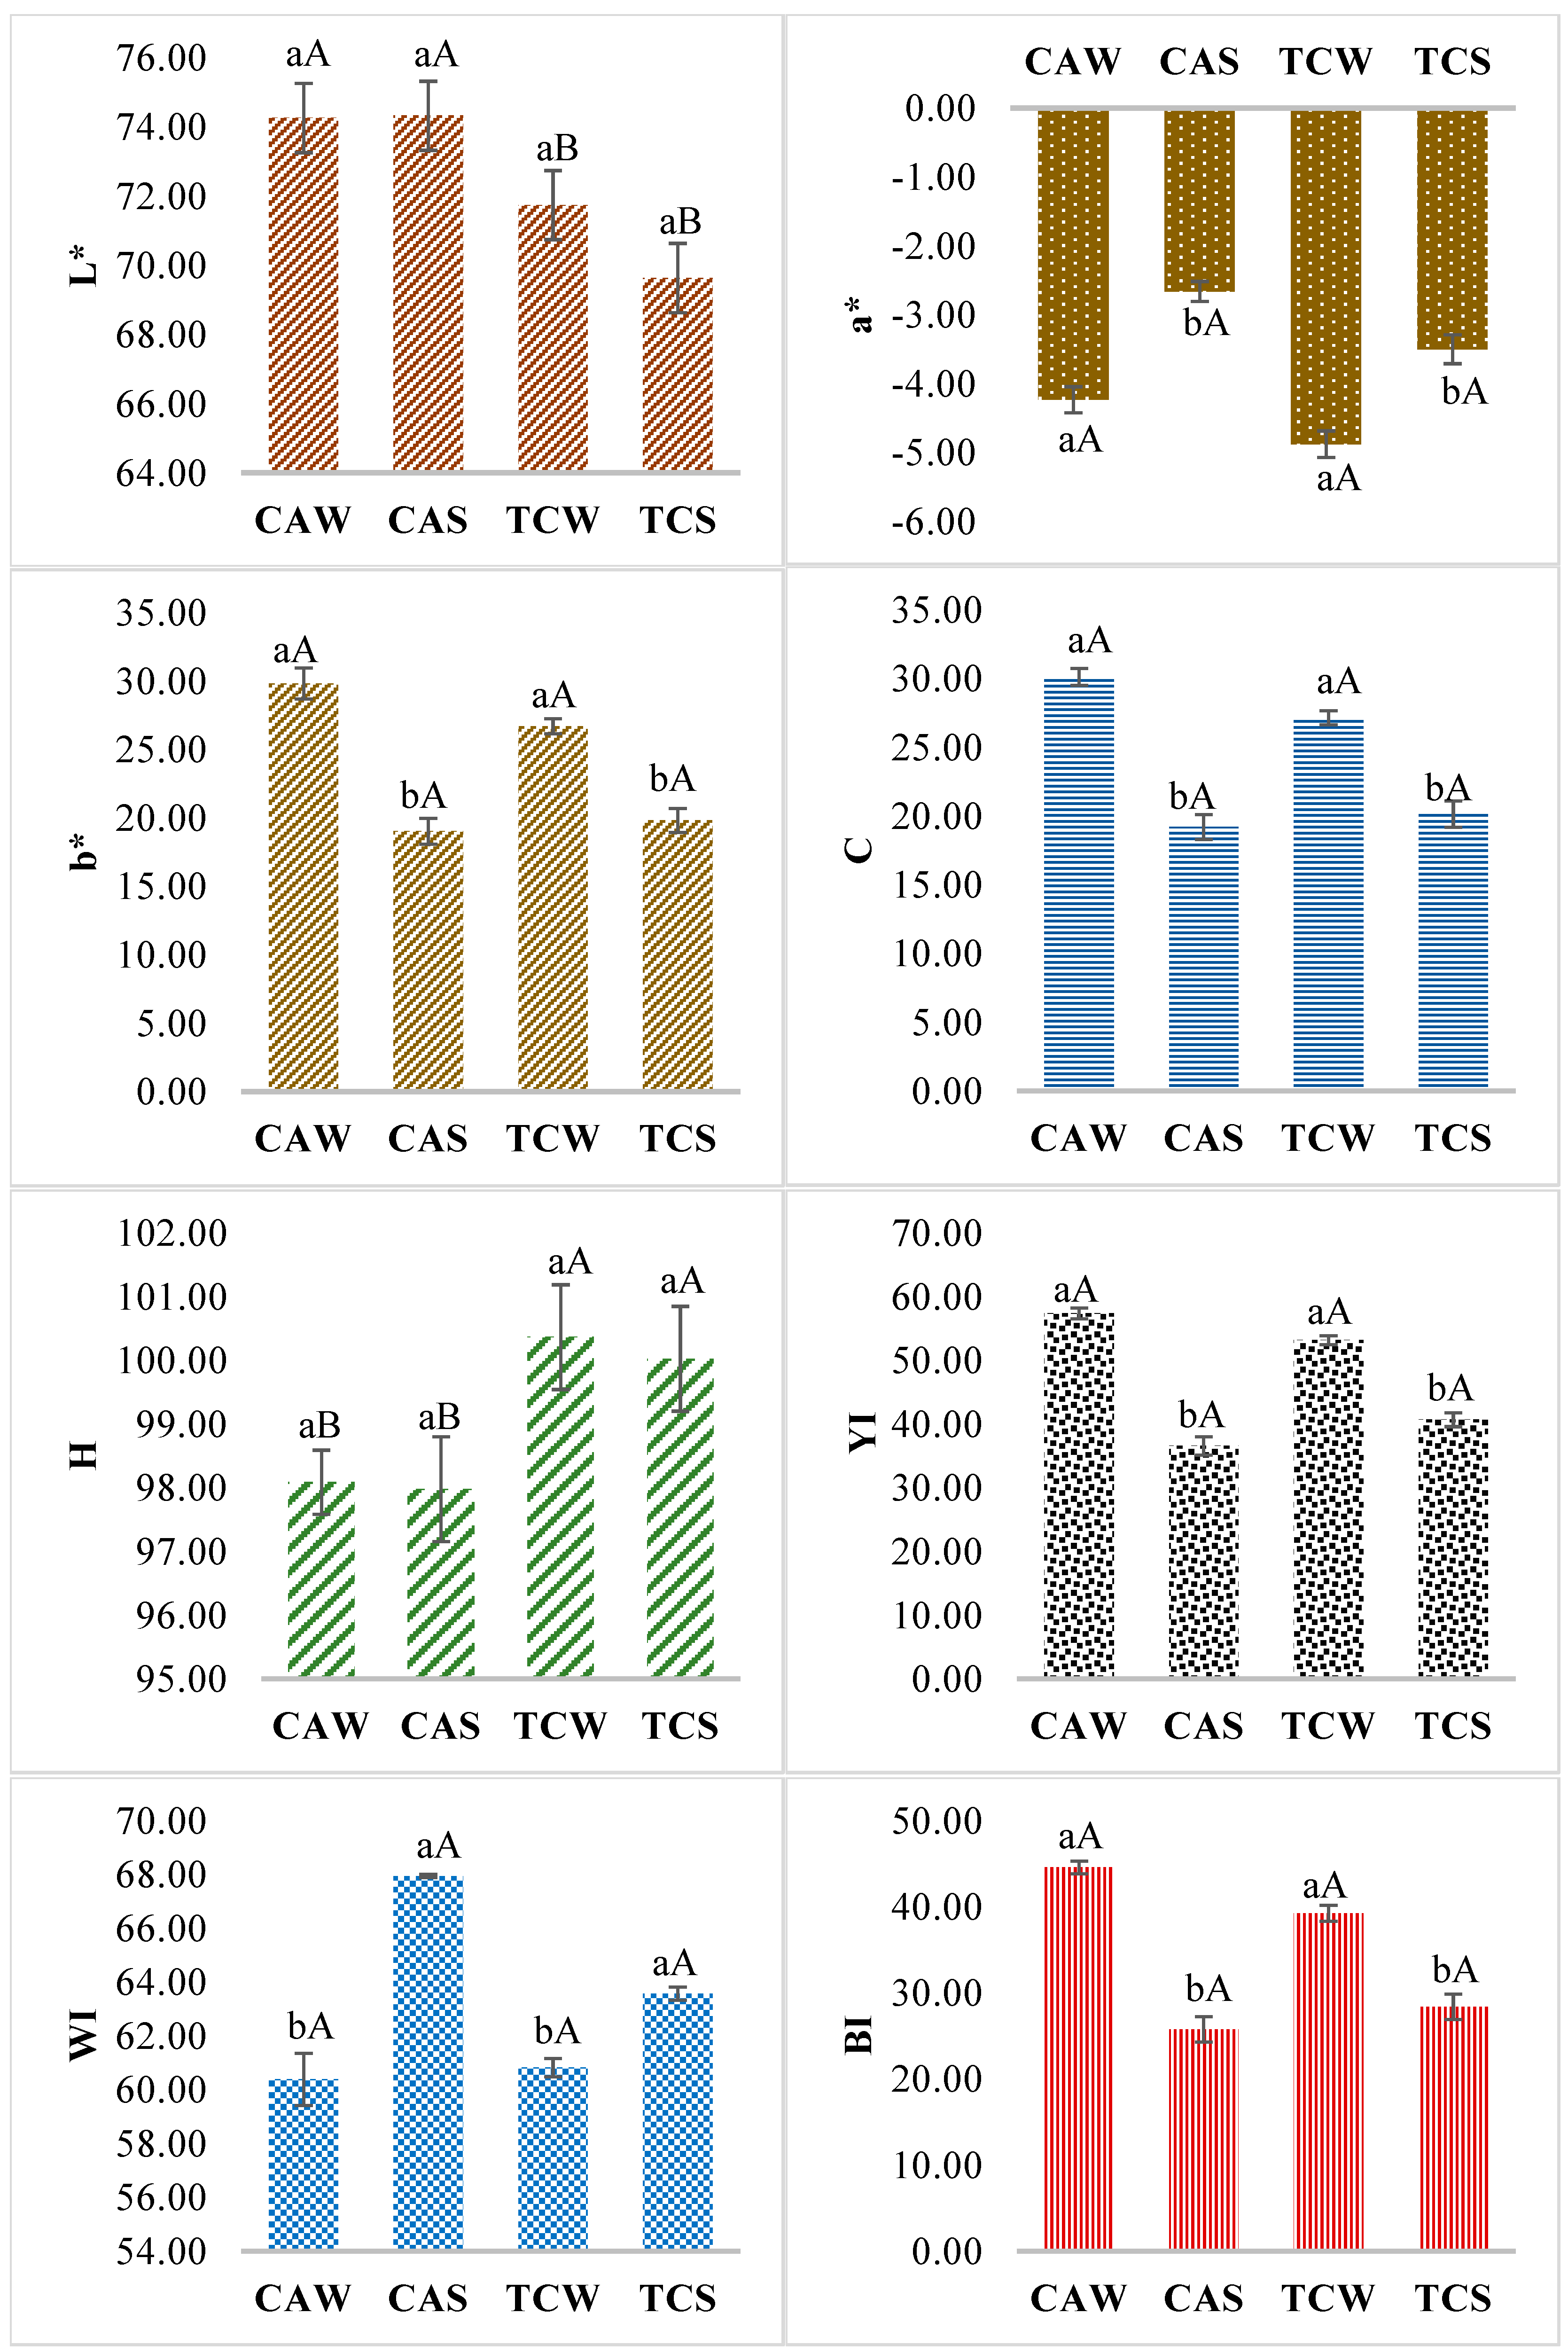
3.6. Color
Winter samples exhibited greater luminosity compared to the summer ones, while the cheese made in a copper tank (TC) showed lower values compared to CA (Figure 4). The green nuance given by the values of a* indicated more intense nuance in winter samples compared to summer and in TC ones compared to CA. The yellow color was more pronounced in winter compared to summer, while the CA samples were yellowish compared to TC, with the highest value observed for ICA. Summer samples exhibited lower Chroma (C), hue angle (H), yellow index (YI), and brown index (BI), while the white index (WI) was higher compared to winter. CA cheese showed greater C, YI, WI, and BI, except in the summer season, while the H values were higher than those of TC samples.

Figure 4.
Color parameters of cheese: a,b (for season) and A,B (for producers) mean values followed by different letters are significantly different (p < 0.05), H—hue angle, C—Chroma, YI—yellow index, BI—brown index, WI—white index, CAW—winter sample from Producer 1, CAS—summer sample from Producer 1, TCW—winter sample from Producer 2, TCS—summer sample from Producer 2.
Season factor had significant (p < 0.05) effects on the color parameters, except for the L* and H values (Table S1, Supplementary Material). The production technology also influenced significantly (p < 0.05) the color features, except the YI. The interaction between factors affected significantly (p < 0.05) the b*, C, YI, WI, and BI variables.
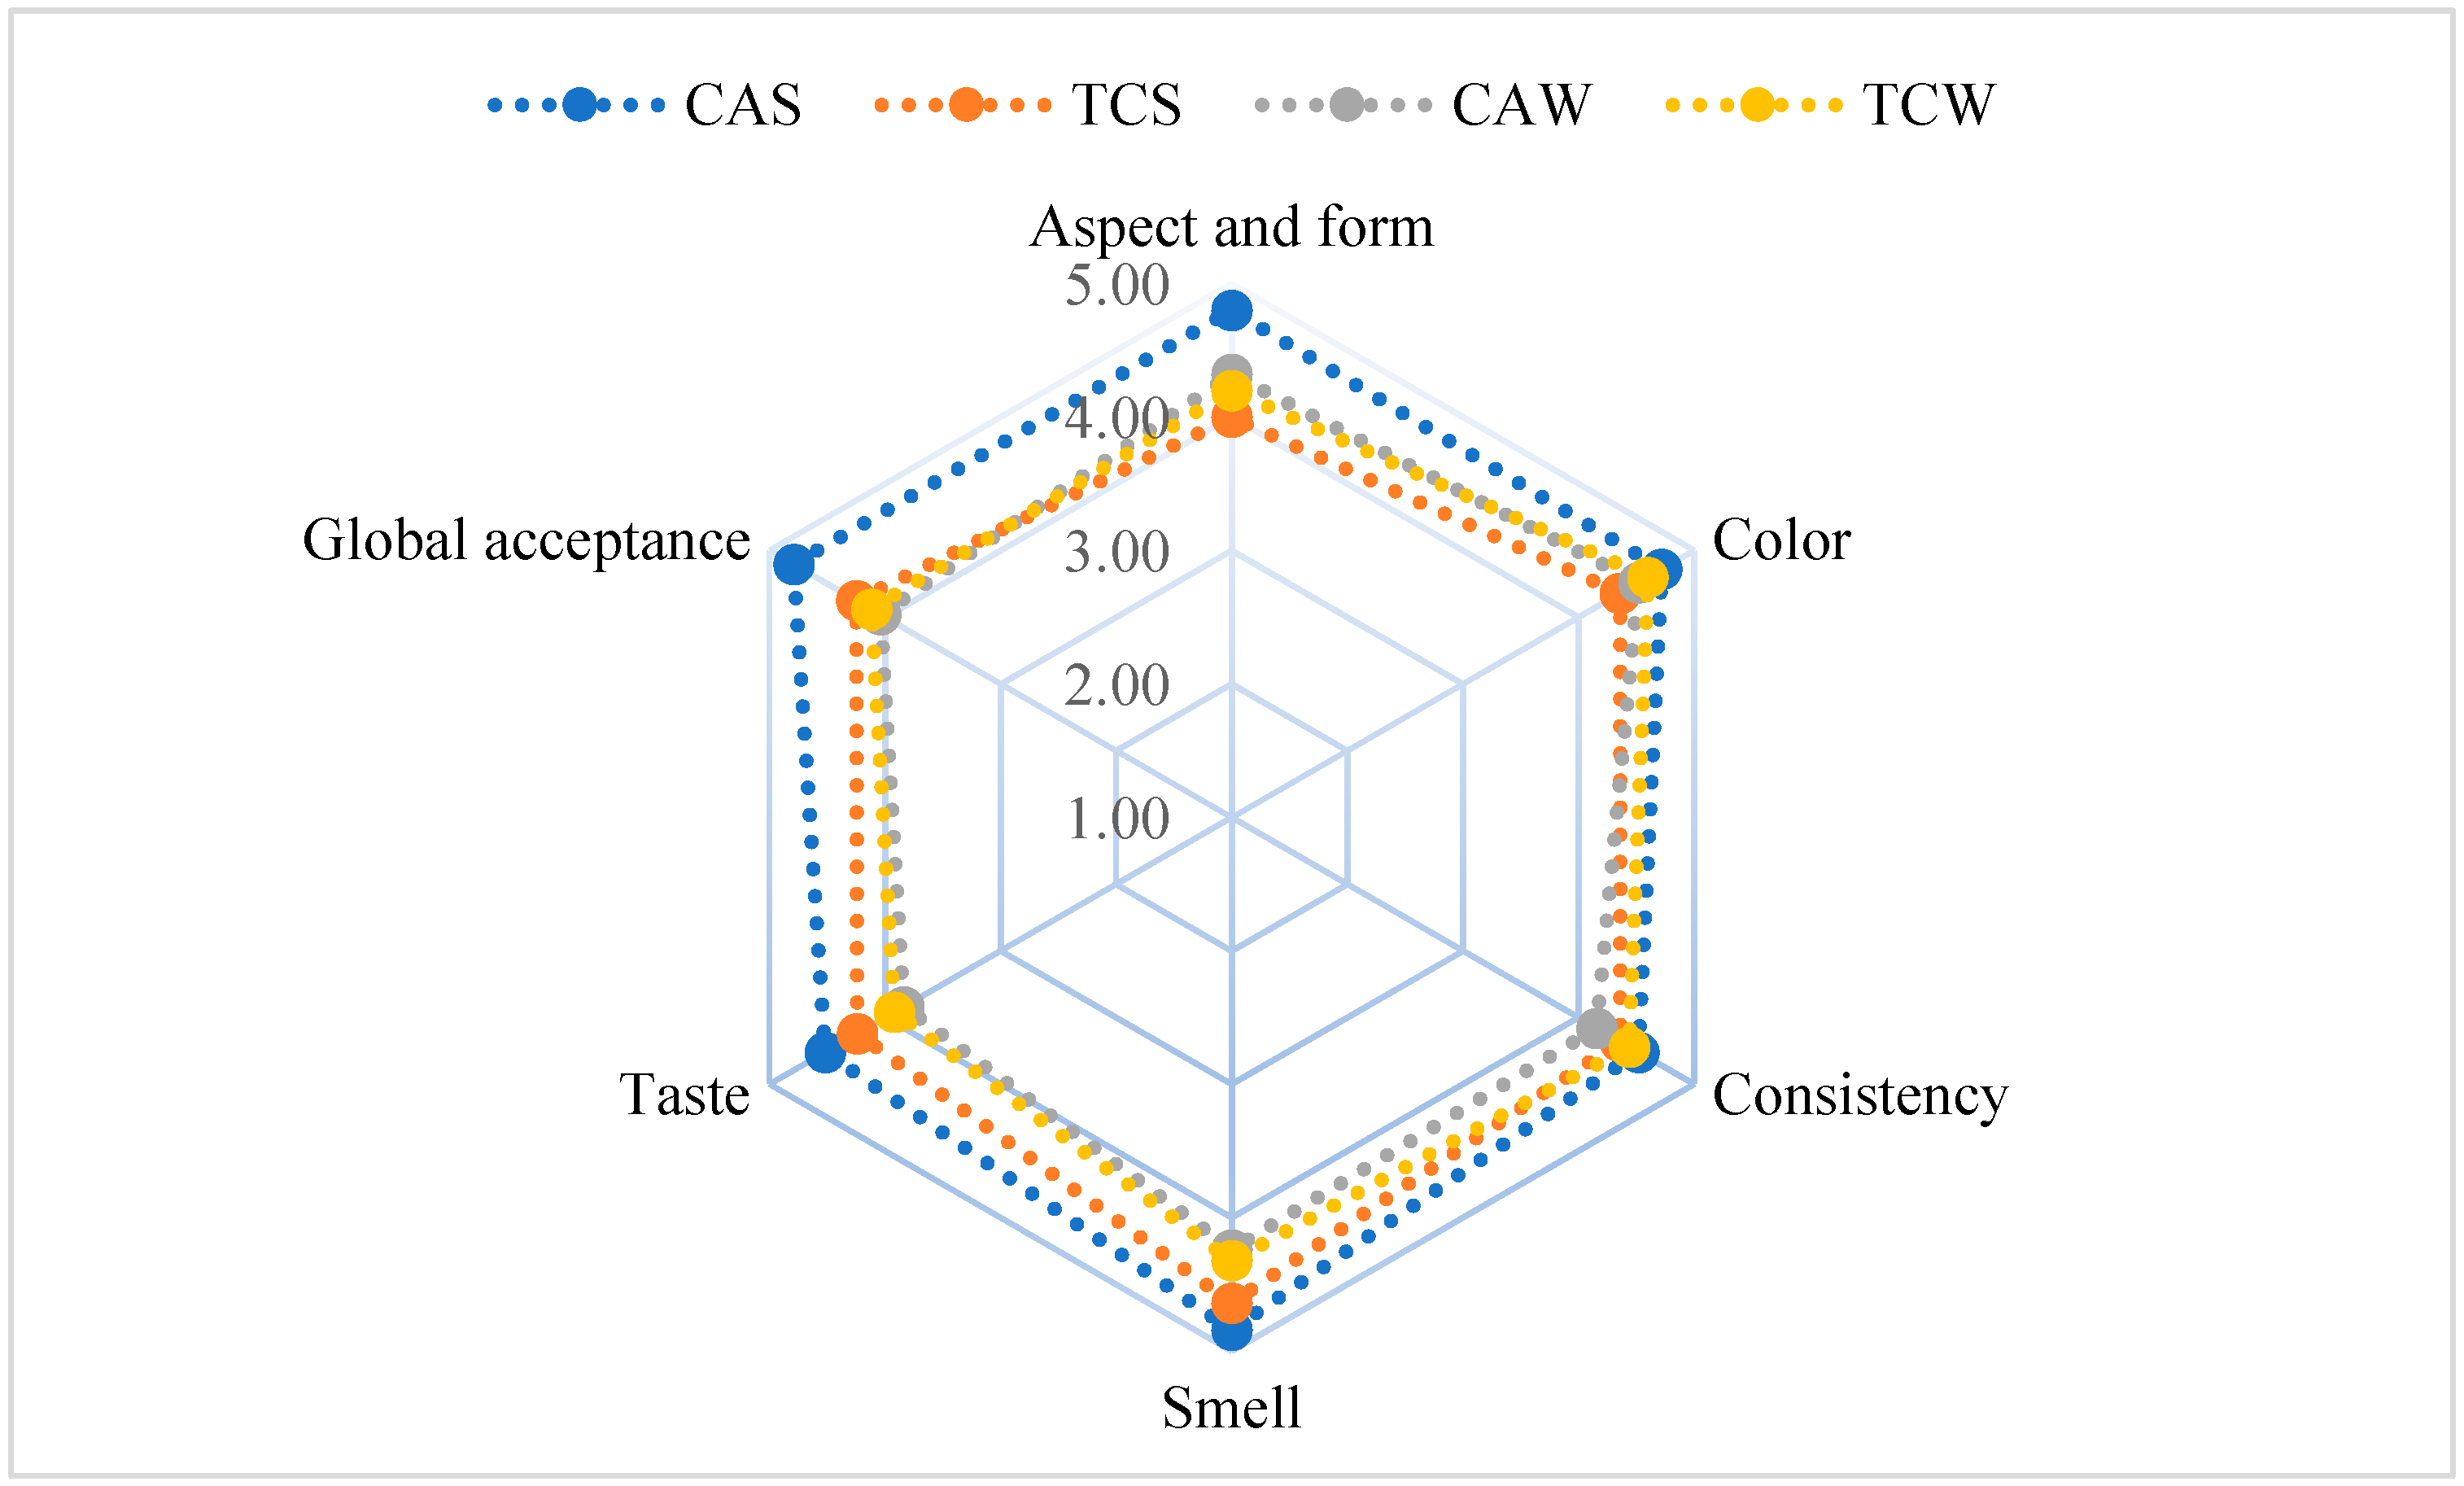
3.7. Sensory Characteristics
The sensory properties of the Emmental cheese samples are displayed in Figure 5. Summer samples received higher scores for almost all the sensory attributes considered, except for color and aspect and form of the TCS sample. Season factor had a significant (p < 0.05) effect on cheese aspect and form, consistency, smell, taste, and global acceptance (Table S1, Supplementary Material). The production technology significantly (p < 0.05) affected the aspect and form, color, consistency, taste and global acceptance. The interaction between factors had a significant effect (p < 0.05) for all the sensory characteristics evaluated.

Figure 5.
Sensory characteristics of cheese samples, CAW—winter sample from Producer 1, CAS—summer sample from Producer 1, TCW—winter sample from Producer 2, TCS—summer sample from Producer 2.
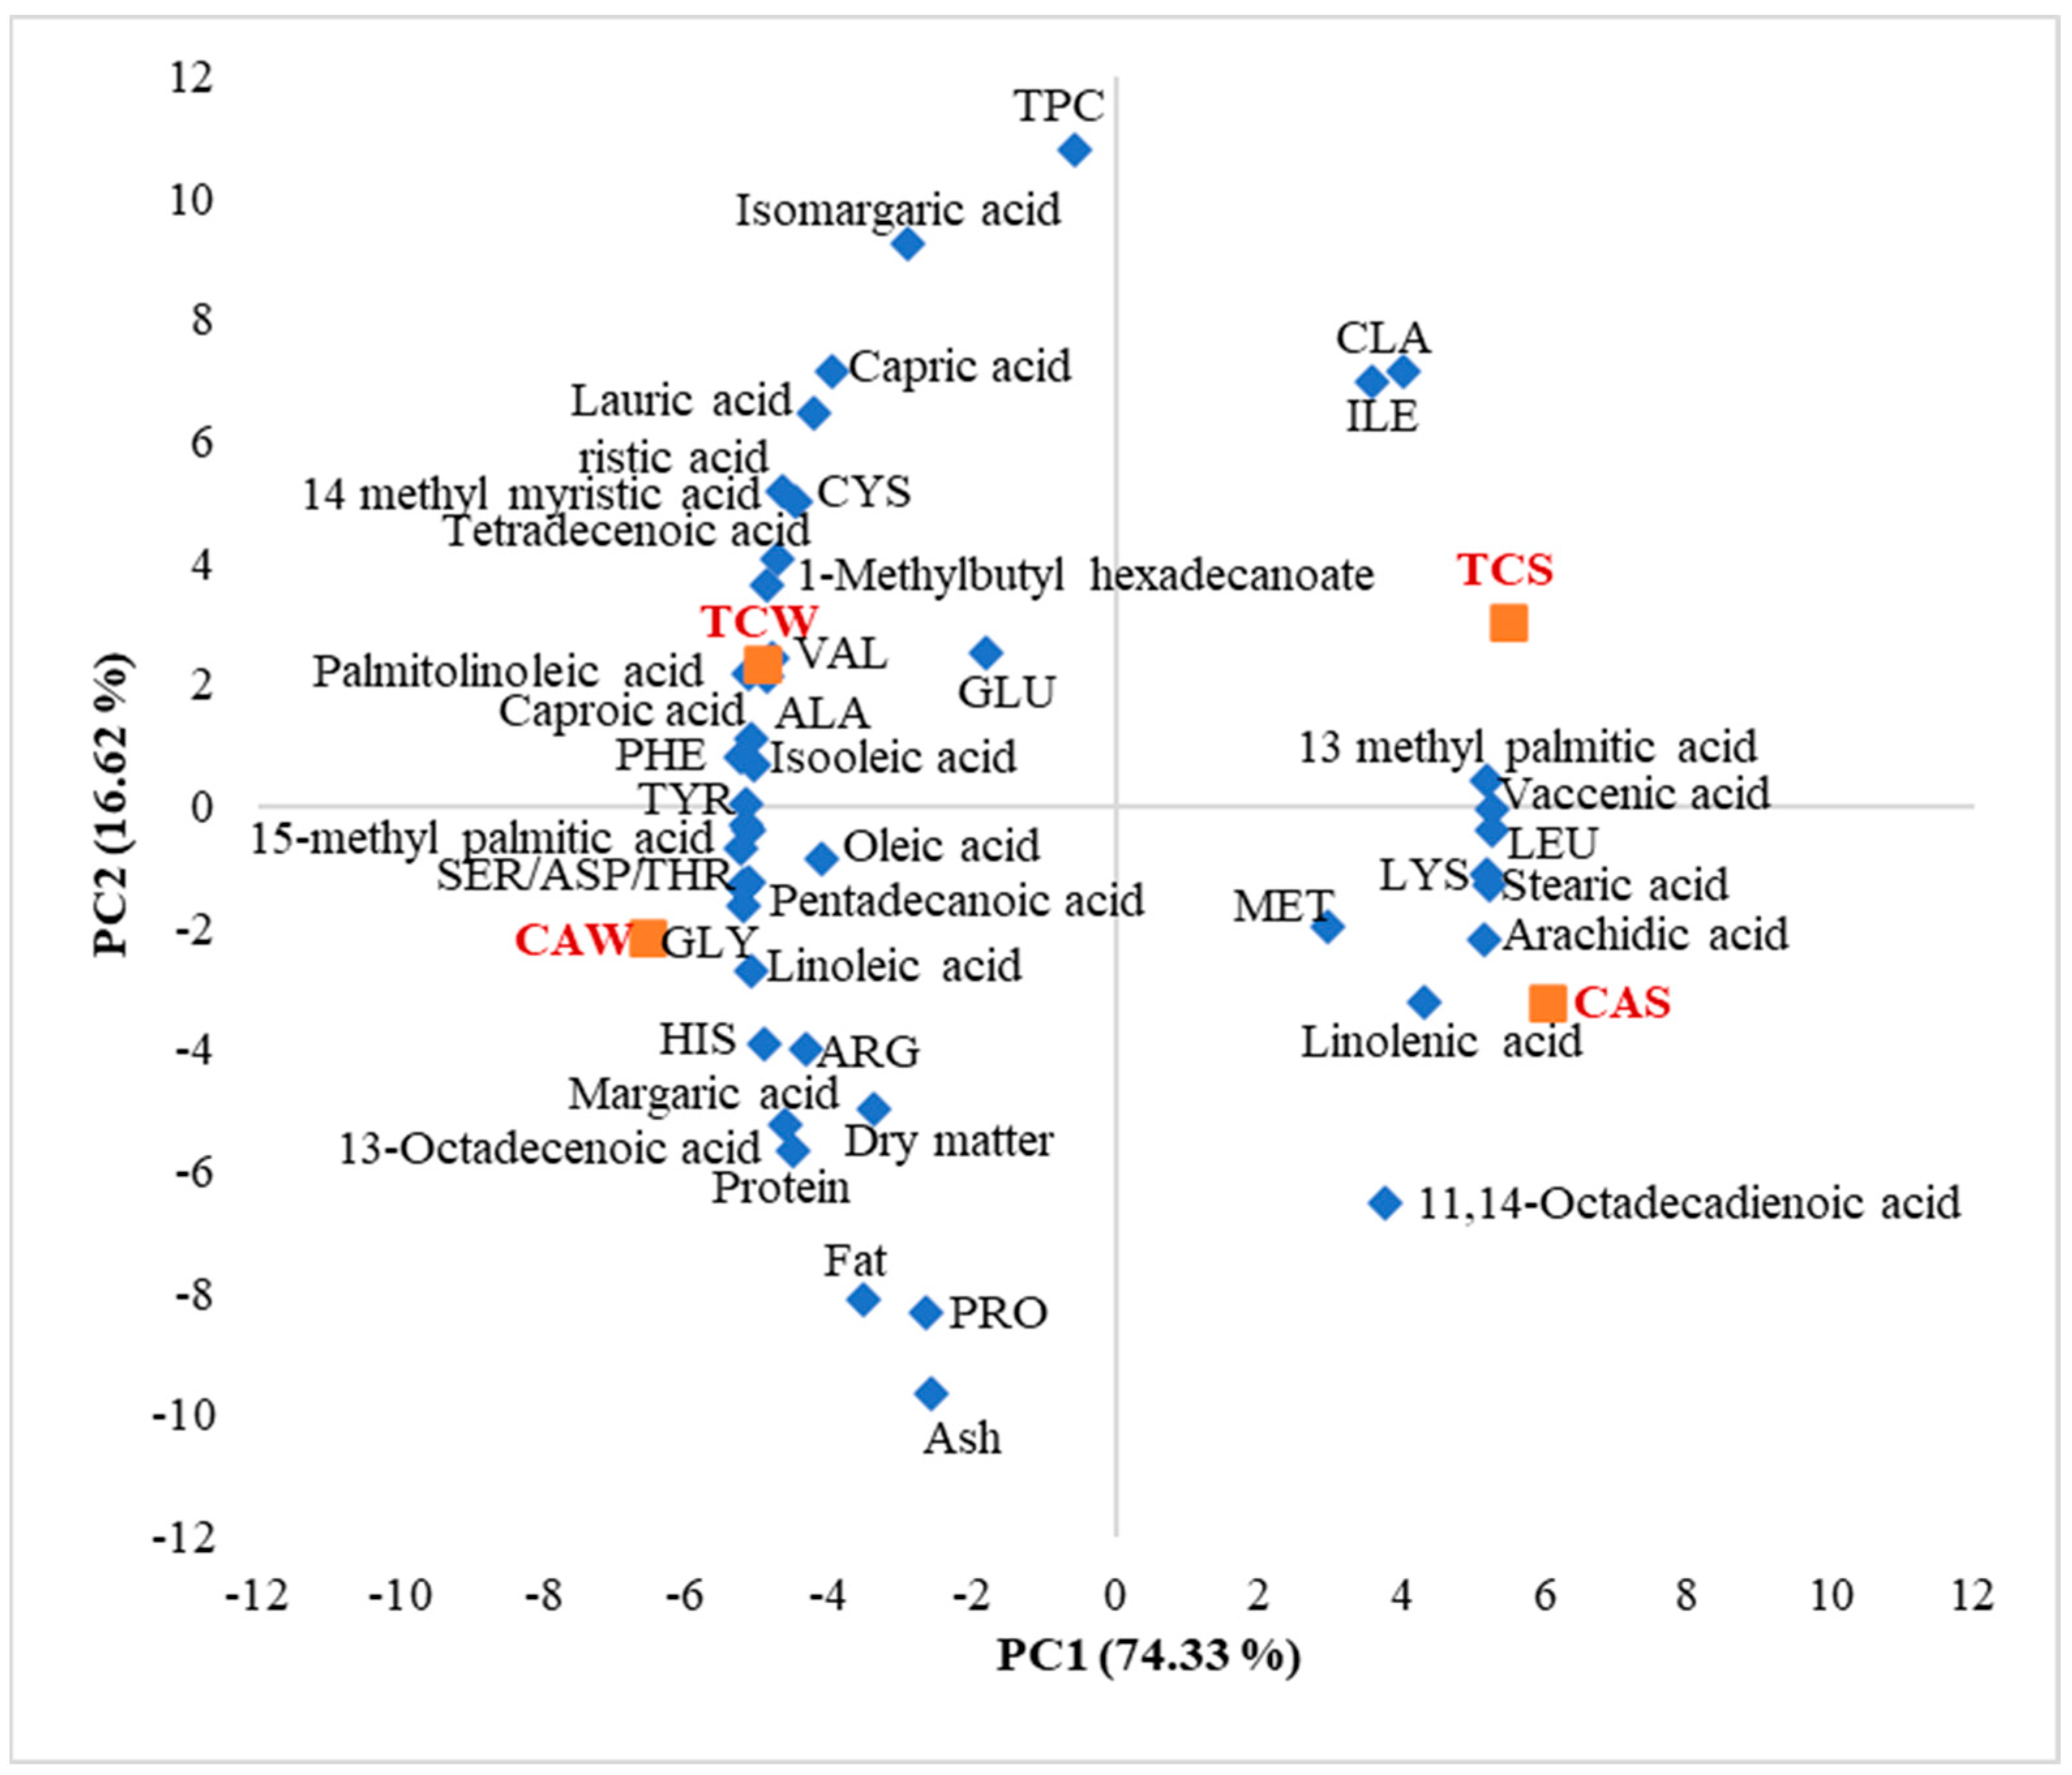
3.8. Relationships Among the Chemical Properties and Samples
The relationships between the chemical features and the cheese samples were highlighted by Principal Component Analysis (PCA). The first component (PC1) explained 74.33% of data variability, while the second one (PC2) explained 16.62% of data variance. The winter samples were located in the left part of the graphic, while the summer ones were positioned in the positive right quadrants (Figure 6). TC samples were positioned in the upper part of the graphic, while the CA samples’ position was in the lower quadrants. PC1 was associated with palmitoleic acid, VAL, ALA, PHE, TYR, THR, GLY, SER, ASP, isooleic acid, oleic acid, pentadecanoic acid, 15-metil palmitic acid, linoleic acid, 13-methyl palmitic acid, vaccenic acid, LEU, LYS, MET, stearic acid, and arachidic acid, while PC2 was associated with TPC, isomargaric acid, capric acid, CLA, ILE, fat, PRO, ash, and 11,14-Octadecadienoic acid.
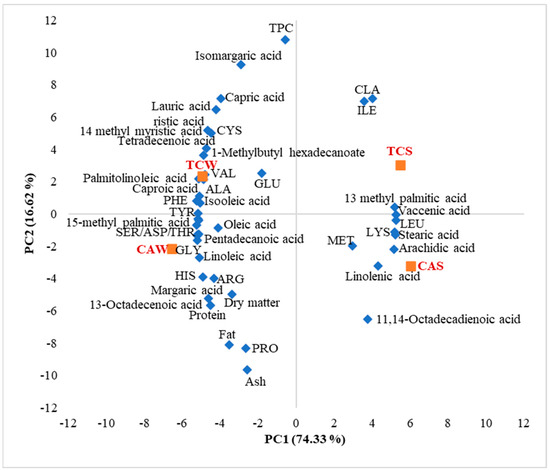
Figure 6.
Principal Component Analysis bi-plot for the chemical composition: CAW—winter sample from Producer 1, CAS—summer sample from Producer 1, TCW—winter sample from Producer 2, TCS—summer sample from Producer 2.
Significant strong correlations (p < 0.05, r > 0.90) were observed between some of the fatty acids and amino acids (supplementary material matrix). The protein and dry matter content was strongly correlated with the margaric acid content (p < 0.05, r > 0.98).
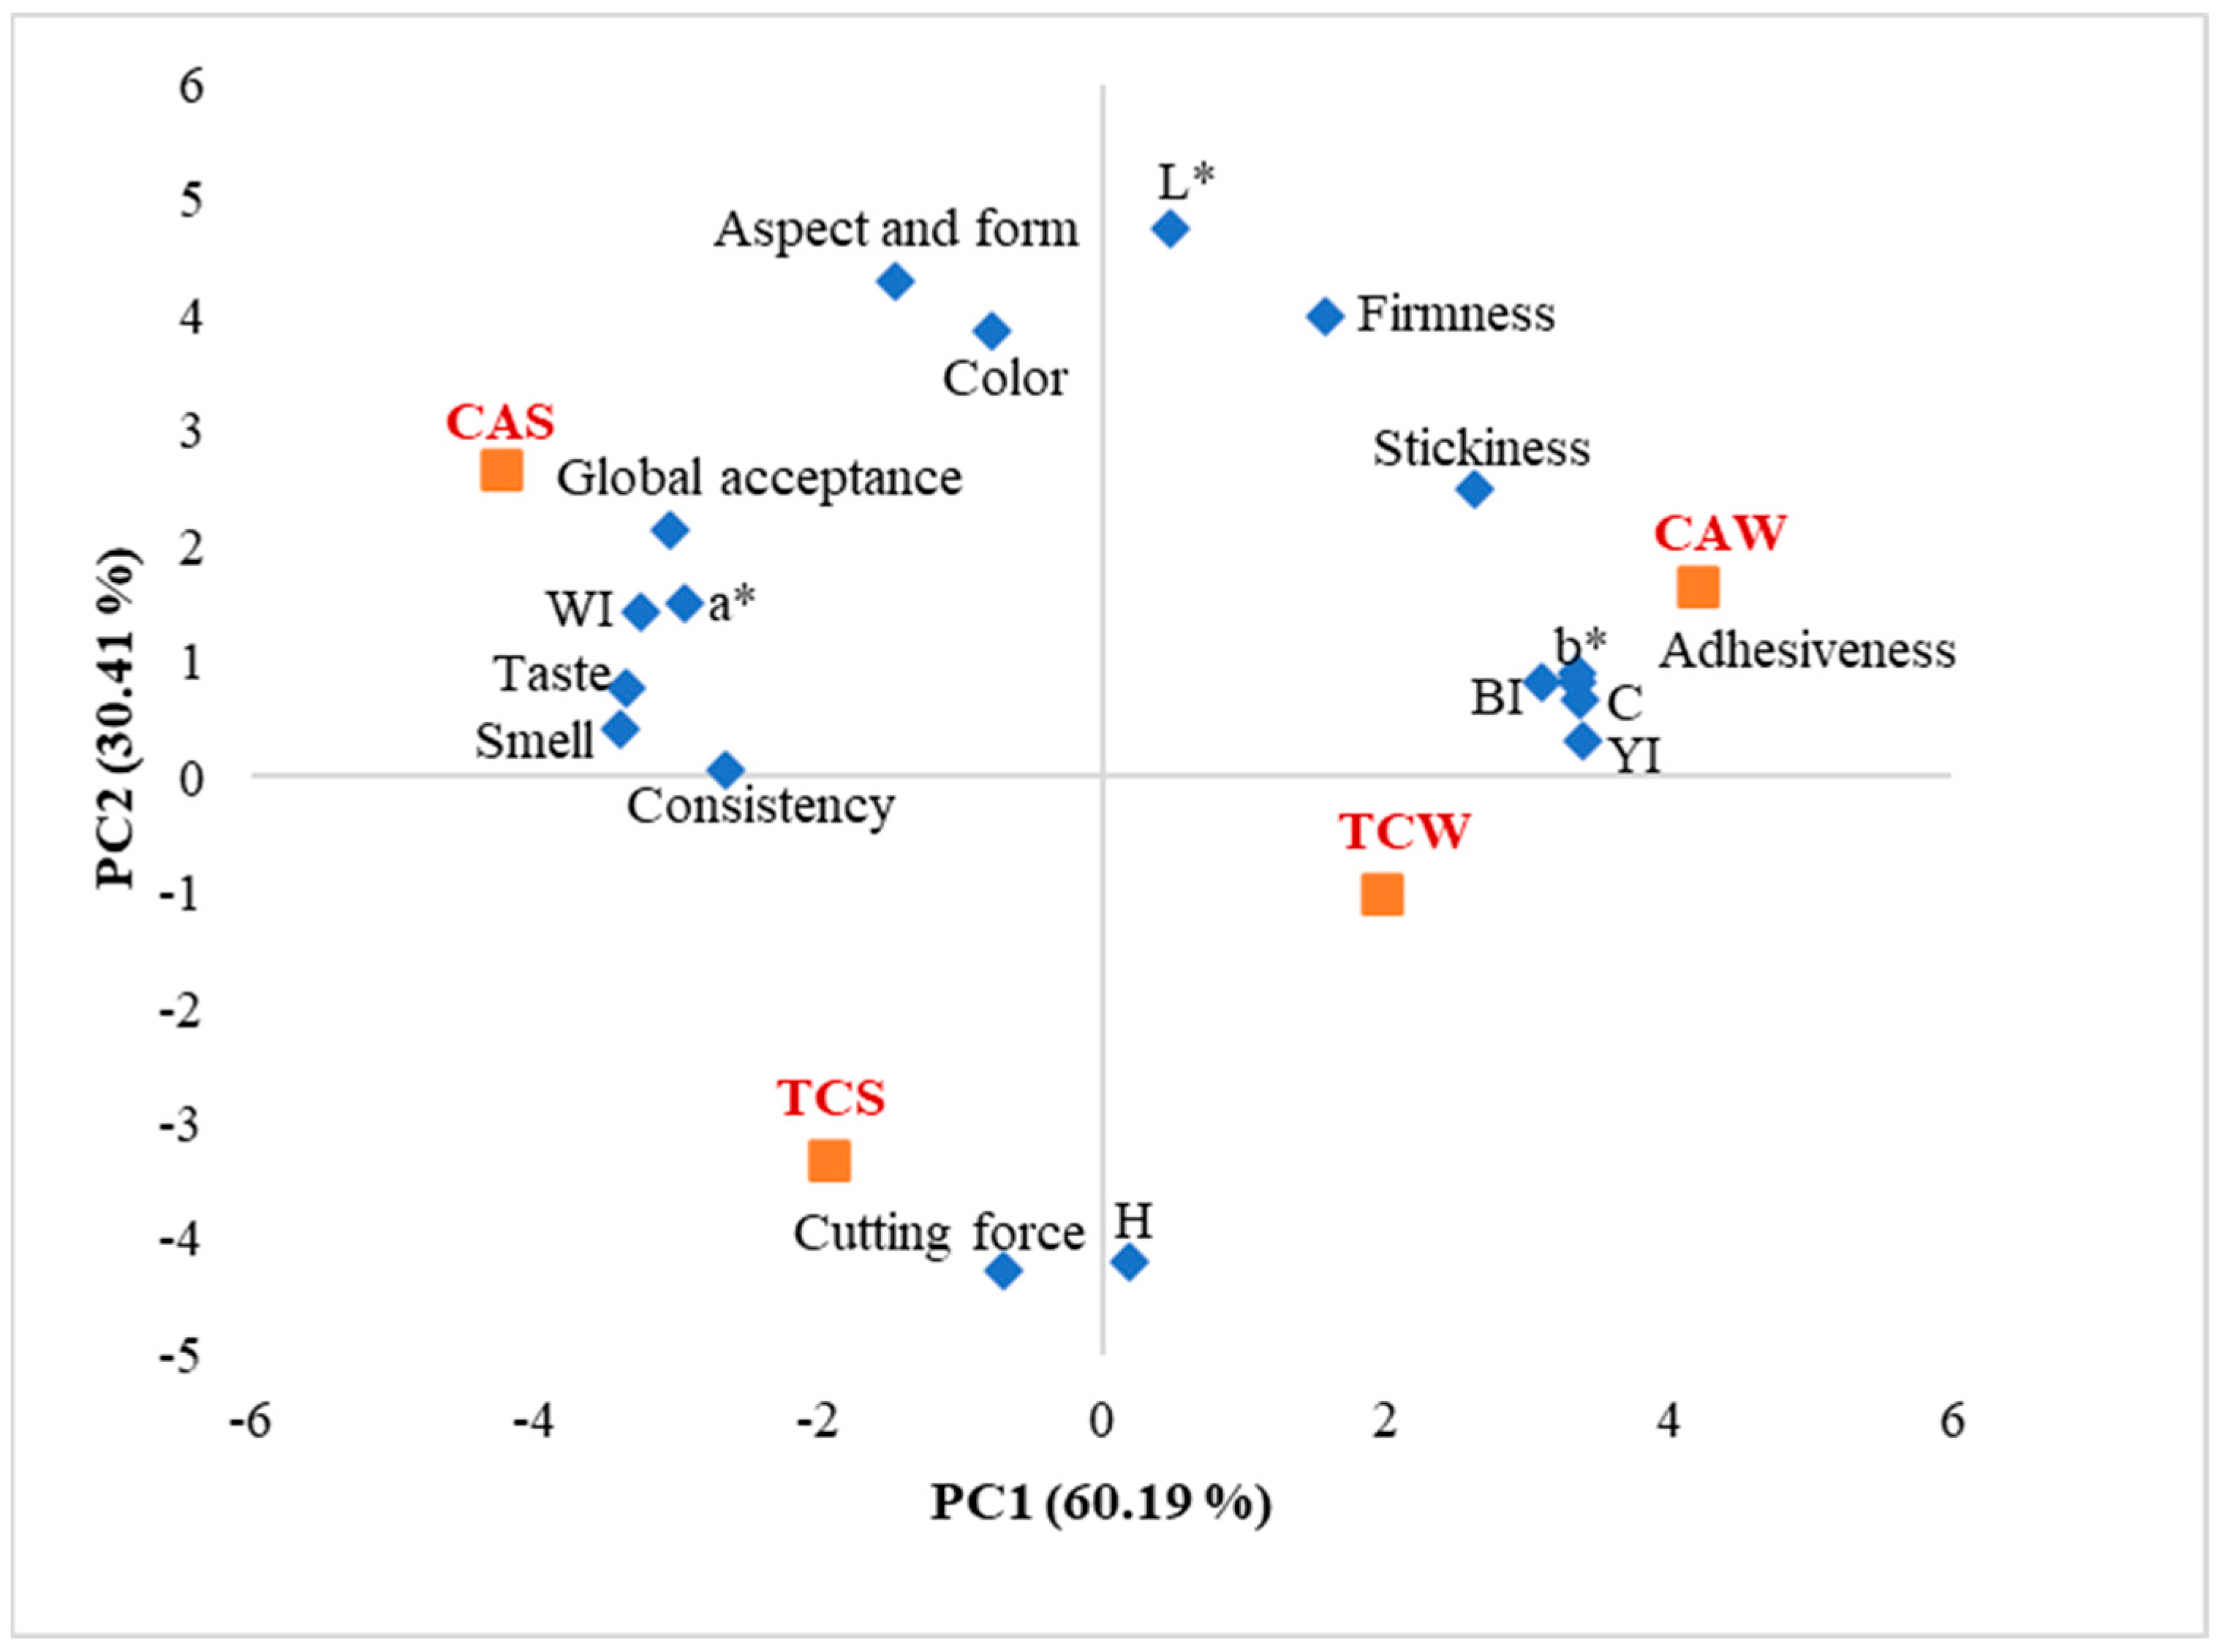
3.9. Relationships Among the Physical and Sensory Properties and Samples
The PCA bi-plot for the physical and sensory characteristics of the cheese samples is presented in Figure 7. The PC1 explained 60.19% of the data variance, while the PC2 explained 30.41% of the total variance. PC1 was associated with a*, WI, taste, smell, consistency, YI, C, b*, adhesiveness, while PC2 was associated with L*, aspect and form, color, cutting force, and H. Summer samples were located in the negative quadrants, while the winter ones were positioned in the positive ones. CA samples were positioned in the upper part of the graphic, while the TC ones were located in the lower part. Significant strong correlations (p < 0.05, r > 0.90) were obtained between some of the sensory characteristics (taste, smell) and the instrumental color parameters. The global acceptability was positively correlated (p < 0.05, r = 0.98) with index (WI) (Supplementary Material matrix).

Figure 7.
Principal Component Analysis bi-plot for the physical and sensory properties: H—hue angle, C—Chroma, YI—yellow index, BI—brown index, WI—white index, CAW–winter sample from Producer 1, CAS—summer sample from Producer 1, TCW—winter sample from Producer 2, TCS—summer sample from Producer 2.
4. Discussion
The proximate composition of the Emmental cheese samples recorded small variations depending on the season and processing technology (Figure 1). The dry matter, protein, fat, and ash content decreased in summer compared to the winter season, while the CA samples registered higher values compared to TC. Liu et al. [25] also reported lower values for the dry matter content of milk in summer. The protein content is affected when silage is used, while the greatest impact on milk composition is attributed to the stage of lactation [26]. The feeding of cows with hay led to a reduction in the synthesis of casein due to the diminishing of essential amino acids [27]. Florio et al. [27] revealed higher lipid content of milk in winter as a result of the ingestion of more unsaturated fatty acids which in high amounts could affect the microbial activity in the rumen and consequently the synthesis of fatty acids. During the ripening process, glycolysis, lipolysis, and proteolysis reactions occur due to the bacteria and enzyme activities [28]. The differences among producers regarding Emmental cheese proximate composition could be attributed to the use of starter lactic bacteria in TC samples and/or to the differences in the ripening time (70 days for CA vs. 90 days for TC).
Summer cheese samples exhibited higher concentrations of linolenic acid, vaccenic acid, CLA, stearic acid, arachidic acid, 11,14-octadecadienoic acid, and 13-methyl palmitic acid compared to the winter. Generally, the summer samples presented lower saturated fatty acid content (Table 1). Our results are in agreement with those reported by Mihai et al. [29] for a Swiss-type cheese from the Dorna area. In summer, the cows were fed with fresh grass, while in winter, they consumed hay. It was demonstrated that the synthesis of stearic acid is influenced by the concentration of linoleic originating from the diet, with the literature reporting a rise of linoleic acid in the milk from animals fed with fresh pasture [27,30]. The content of palmitic acid is generally affected by the animal diet, with a reduction trend in summer milk also being reported by Florio et al. [27]. From a nutritional point of view, vaccenic acid is of high interest because it is a precursor for rumenic acid which presents anticarcinogenic and antiatherogenic effects [10]. The content of linolenic acid in milk is related to its presence in the fodder and it is correlated with the content of vaccenic acid [10], a possible explanation for the higher amounts found in the summer cheese samples being the higher intestinal absorption which leads to richer milk in these compounds. CLA was proven to have antihypertensive, antidiabetic, and anti-carcinogenic effects on the human body [31]. It was demonstrated that summer milk from animals grazed on pastures has higher concentrations of CLA than winter milk [26]. The increase in some fatty acids content in TC samples compared to CA could be due to the larger ripening time used by Producer 1, which is in agreement with previous data from the literature [32]. Furthermore, the use of standard lactic bacteria in TC is also a major factor that affects cheese fatty acid profile because they are responsible for some lipolysis reactions during ripening [33]. Higher amounts of CLA in TC samples could be due to the use of lactic acid bacteria strains that produce CLA from linoleic acid [33]. The differences regarding the fatty acid profile of Emmental cheese could be also related to the use of copper tank in TC samples production compared to stainless steel in Ca production since it is demonstrated that copper has inhibitory effects on some bacteria strains [34].
According to the amino acid data obtained in this study, it can be mentioned that Dorna Emmental cheese is a great source of amino acids, especially glutamine, proline, aspartic acid, and lysine. Generally, in winter, the cheese samples presented higher amounts of amino acids, except the leucine and lysine content (Table 2). The production technology had a small impact on the amino acid profile, with the CA samples being slightly richer in some amino acids than TC. Muñoz et al. [35] also reported differences in the amino acid profile of sheep milk depending on the season, probably due to the variations in microflora responsible for the proteolysis processes. Addis et al. [36] observed a reduction in proteolysis in summer compared to winter possibly due to the smaller water activity that could exert an inhibitory effect on the enzymes. Our results are in line with the study conducted by Ziarno et al. [33] that revealed the influence of the type of microorganism and maturation time on the amino acid profile of cheese. Thus, the differences among producers in the present study could be attributed to the use of different sources of the microflora and/or to the different ripening times.
The season did not affect the TPC of Emmental cheese, but the production technology exerted a significant influence (Figure 3). Danieli et al. [37] observed also that the season did not influence Italian Alpine cheeses TPC. It was stated that milk microflora and enzymatic system activity could have a great influence on cheese TPC [38]. Thus, the use of different sources of lactic bacteria (spontaneous vs. standard) and the differences regarding the ratio of pasteurized milk to raw milk (40:60 for CA vs. 30:70 for TC) could explain the results of the TPC in the present study.
The analysis of the chemical composition of Emmental cheese in this study revealed the presence of riboflavin in both CA and TC samples, while TC samples also contained 2-hydroxy-3-(2-hydroxyphenyl) propanoic acid, hydroxyvaleric acid, and 3-phenyllactic acid. The 3-phenyllactic acid produced by the lactic bacteria is known for its antimicrobial and antifungal effects [39], the differences among producers being related to the origin of the microflora (spontaneous vs. standard). Thus, the unique characteristics and health benefits of Emmental cheese produced in the Ţara Dornelor area are supported by its chemical composition, rich in bioactive compounds.
Summer Emmental cheese presented lower firmness and higher adhesiveness and stickiness (Figure 3), while the highest cutting force was observed in the summer TCS sample. CA cheese showed higher firmness and lower stickiness and adhesiveness than TC samples. A major contribution to the cheese texture is represented by the proteolysis reactions during ripening, and consequently by the amino acid profile [8]. In addition, the fat content and characteristics also impact the texture of the cheese [2]. Thus, the differences regarding the amino acid and fatty acid profile of Emmental cheese could explain the variations in texture in this study. The level of salt, the pH, the coagulant activity, and the type of lactic bacteria (standard or spontaneous) are the main factors affecting Emmental cheese texture [28]. Cheese texture is determined by the cumulative effects of some factors such as the chemical composition, microstructure that represents the structural disposition of water, fat, protein, and salt molecules, and macrostructure that refers to the disposing of curd fragments [28]. Renes et al. [40] reported lower values for sheep cheese adhesiveness in winter compared to summer as a result of different degrees of proteolysis during maturation. Similar to our results, de Jesus et al. [41] observed greater hardness values for some Brazilian ripened cheese samples in winter compared to summer which could be related to the extent of protein breakdown and release of amino and carboxyl groups.
TC samples presented lower L* and WI values compared to CA, while the a* and H values were higher (Figure 4). Summer samples were less green (lower a*) and yellow (lower b*), with lower C, YI, and BI, and higher WI compared to winter samples. According to Rohm et al. [42], Emmental cheese color depends on the dry matter content and the YI is influenced by the milk fat composition. The nature of the feed affects the color of the milk and cheese final product [43], so the differences among seasons could be explained by the use of hay in winter and fresh pasture in summer for cows feeding. On the other hand, the ripening time was proven to influence cheese color, with an increase in a* and b* and a decrease in L* values in time being reported [42]. The similar results between the two producers in this study for the b* parameter could be related to the fact that the milk raw material came from close geographical areas, with little or no differences in vegetation landscape, being known that b* can be influenced by the carotenoid content of pasture [41].
Summer Emmental cheese samples showed superior sensory attributes compared to winter, with the most appreciated sample being CAS (Figure 5). The particular sensory properties of cheese are given, among others, by the lactic bacteria activity during ripening, as a result of the proteolytic reactions that release different amounts of amino acids [40]. The sensory properties are also influenced by the fatty acid content and their position in milk fat’s triacylglycerols [33]. The direct transfer of volatile compounds from feed to milk could contribute also the final product aroma [44]. This could explain the differences among seasons in the present study since the fresh pasture in summer is richer in volatile compounds than the hay used in cow feeding during the winter. The microflora plays a crucial role in aroma compound formation during ripening because it is responsible for some proteolysis and lipolysis reactions [7]. Thus, the differences among producers could be explained on the one hand by the sources of the lactic bacteria (spontaneous vs. standard), and on the other hand by the different ripening times. In addition, the use of a copper tank in TC cheese production could affect the sensory properties of the final product because of its ability to promote lipid oxidation, generating an unpleasant flavor [45]. To sum up, both milk composition and processing conditions are key factors in determining Emmental cheese sensory characteristics.
5. Conclusions
Dorna Swiss-type Emmental cheese is a traditional specialty product appreciated by consumers and has a very limited production area in Romania because of the specific requirements for the milk raw material quality. The season affects milk characteristics and consequently cheese’s final quality mainly due to the different animal nutrition. Another major factor that influences Swiss-type cheese properties is the production technology. The present study demonstrated that the season factor significantly (p < 0.05) affected the fatty acid profile, protein, fat, texture, color, and some of the amino acid content. The production technology, especially the use of different tank materials (copper or stainless steel), lactic bacteria (spontaneous or standard), and different maturation times (70 or 90 days) exhibited significant effects (p > 0.05) on Emmental cheese color, texture, protein, fat, ash content, sensory properties, and total phenolic content. These results could be of interest to producers interested in improving the manufacturing technologies or developing the production capacity and extension of the production area of Swiss cheese and consumers aware of the nutritional quality of such products. The limitation of this study is related to the sampling size, but the only attested producers of Swiss cheese at this moment in the studied area are the ones included in this study. Further research should be focused on the effects of animal feed and animal husbandry conditions on the quality of Swiss cheese, especially the transfer of nutrients from feed into the final product.
Supplementary Materials
The following supporting information can be downloaded at: https://www.mdpi.com/article/10.3390/agriculture14122149/s1, Table S1: Model fitting and effects of factors on the studied variables; Table S2: Correlation matrix (Pearson).
Author Contributions
Conceptualization, D.N., M.U.-I., E.M., B.P., I.S., V.T. and L.O.; methodology, D.N., M.U.-I., E.M., B.P., I.S., V.T. and L.O.; software, D.N., M.U.-I. and E.M.; validation, D.N., M.U.-I., E.M., B.P. and V.T.; formal analysis, D.N., M.U.-I., E.M., B.P. and V.T.; investigation, D.N., M.U.-I., E.M., B.P. and V.T.; resources, D.N., M.U.-I., E.M., I.S., V.T. and L.O.; data curation, D.N., M.U.-I., E.M., B.P. and V.T. writing—original draft preparation, D.N. and M.U.-I.; writing—review and editing, D.N., M.U.-I., E.M., I.S., V.T. and L.O.; visualization, D.N. and M.U.-I.; supervision, D.N., M.U.-I., I.S. and L.O.; project administration, D.N., M.U.-I. and L.O.; funding acquisition, D.N., M.U.-I., E.M., I.S., V.T. and L.O. All authors have read and agreed to the published version of the manuscript.
Funding
This research received no external funding.
Institutional Review Board Statement
The sensory analysis was conducted in accordance with the Declaration of Helsinki, and approved by the Institutional Review Board of the Faculty of Food Engineering, Stefan cel Mare University of Suceava.
Data Availability Statement
Data will be available upon reasonable request at the corresponding author.
Conflicts of Interest
The authors declare no conflicts of interest.
References
- Muehlhoff, E.; Bennett, A.; McMahon, D. Milk and Dairy Products in Human Nutrition; FAO: Rome, Italy, 2013; ISBN 9251078637. [Google Scholar]
- Manuelian, C.L.; Currò, S.; Penasa, M.; Cassandro, M.; De Marchi, M. Characterization of major and trace minerals, fatty acid composition, and cholesterol content of Protected Designation of Origin cheeses. J. Dairy Sci. 2017, 100, 3384–3395. [Google Scholar] [CrossRef]
- Hartmann, K.I.; Dunkel, A.; Hillmann, H.; Hansen, D.; Schieberle, P.; Hofmann, T.; Hinrichs, J. Identification of physical properties and volatile and non-volatile compounds for discrimination between different Emmental-type cheeses: A preliminary study. Dairy Sci. Technol. 2015, 95, 701–717. [Google Scholar] [CrossRef]
- Bisig, W.; Fröhlich-Wyder, M.T.; Jakob, E.; Wechsler, D. Comparison between Emmentaler PDO and generic emmental cheese production in Europe. Aust. J. Dairy Technol. 2010, 65, 206–213. [Google Scholar]
- Whalter, B.; Schmid, A.; Sieber, R.; Wehrmuller, K. Cheese in nutrition and health. Dairy Sci. Technol. 2008, 88, 389–405. [Google Scholar] [CrossRef]
- Mato Rodriguez, L.; Alatossava, T. Effects of copper on germination, growth and sporulation of Clostridium tyrobutyricum. Food Microbiol. 2010, 27, 434–437. [Google Scholar] [CrossRef]
- Khattab, A.R.; Guirguis, H.A.; Tawfik, S.M.; Farag, M.A. Cheese ripening: A review on modern technologies towards flavor enhancement, process acceleration and improved quality assessment. Trends Food Sci. Technol. 2019, 88, 343–360. [Google Scholar] [CrossRef]
- Sousa, M.J.; Ardö, Y.; McSweeney, P.L.H. Advances in the study of proteolysis during cheese ripening. Int. Dairy J. 2001, 11, 327–345. [Google Scholar] [CrossRef]
- Azarnia, S.; Robert, N.; Lee, B.H. Biotechnological methods to accelerate cheddar cheese ripening. Crit. Rev. Biotechnol. 2006, 26, 121–143. [Google Scholar] [CrossRef] [PubMed]
- Altomonte, I.; Conte, G.; Serra, A.; Mele, M.; Cannizzo, L.; Salari, F.; Martini, M. Nutritional characteristics and volatile components of sheep milk products during two grazing seasons. Small Rumin. Res. 2019, 180, 41–49. [Google Scholar] [CrossRef]
- Turri, F.; Cremonesi, P.; Battelli, G.; Severgnini, M.; Brasca, M.; Gandini, G.; Pizzi, F. High biodiversity in a limited mountain area revealed in the traditional production of Historic Rebel cheese by an integrated microbiota–lipidomic approach. Sci. Rep. 2021, 11, 10374. [Google Scholar] [CrossRef]
- Lopez, A.; Bellagamba, F.; Savoini, G.; Moretti, V.M.; Cattaneo, D. Characterization of fat quality in cow milk from alpine farms as influenced by seasonal variations of diets. Animals 2022, 12, 515. [Google Scholar] [CrossRef] [PubMed]
- Tao, S.; Orellana Rivas, R.M.; Marins, T.N.; Chen, Y.C.; Gao, J.; Bernard, J.K. Impact of heat stress on lactational performance of dairy cows. Theriogenology 2020, 150, 437–444. [Google Scholar] [CrossRef] [PubMed]
- Necula, D.; Tamas-Krumpe, O.; Feneșan, D.; Ungureanu-Iuga, M.; Ognean, L. Analysis of the milk raw materials used in the production of Dorna Swiss cheese in different seasons. Ukr. Food J. 2023, 12, 265–284. [Google Scholar] [CrossRef]
- Necula, D.; Tamas-Krumpe, O.; Fenesan, D.; Todoran, D.; Ognean, L. Aspects regarding the production and the hygiene- sanitary control of the Dorna Swiss Cheese. Sci. Pap. Ser. D. Anim. Sci. 2022, 65, 517–524. [Google Scholar]
- Necula, D.; Ungureanu-Iuga, M.; Dan, S.D.; Tamas-Krumpe, O.; Ognean, L. Analysis of the mineral profile of milk and Swiss cheese from Ţara Dornelor in relation to seasonal and technological factors. Stud. UBB Chem. 2023, 68, 35–49. [Google Scholar] [CrossRef]
- AOAC International. Official Method 933.05, Fat in Cheese; AOAC: Rockville, MD, USA, 2013. [Google Scholar]
- AOAC International. Official Method 969.19-1974, Moisture in Cheese; AOAC: Rockville, MD, USA, 2015. [Google Scholar]
- AOAC International. Official Method 935.4, Gravimetric Method, Ash of Cheese; AOAC: Rockville, MD, USA, 2015. [Google Scholar]
- AOAC International. Official Method 920.123-1920, Nitrogen in Cheese; AOAC: Rockville, MD, USA, 2015. [Google Scholar]
- Poșta, D.S.; Radulov, I.; Cocan, I.; Berbecea, A.A.; Alexa, E.; Hotea, I.; Iordănescu, O.A.; Băla, M.; Cântar, I.C.; Rózsa, S.; et al. Hazelnuts (Corylus avellana L.) from spontaneous flora of the west part of Romania: A Source of Nutrients for Locals. Agronomy 2022, 12, 214. [Google Scholar] [CrossRef]
- Aleya, A.; Mihok, E.; Pecsenye, B.; Jolji, M.; Kertész, A.; Bársony, P.; Vígh, S.; Cziaky, Z.; Máthé, A.B.; Burtescu, R.F.; et al. Phytoconstituent profiles associated with relevant antioxidant potential and variable nutritive effects of the olive, sweet almond, and black mulberry gemmotherapy extracts. Antioxidants 2023, 12, 1717. [Google Scholar] [CrossRef]
- Al-Hilphy, A.R.; Ali, H.I.; Al-IEssa, S.A.; Gavahian, M.; Mousavi-Khaneghah, A. Assessing compositional and quality parameters of unconcentrated and refractive window concentrated milk based on color components. Dairy 2022, 3, 400–412. [Google Scholar] [CrossRef]
- SR 6345:1995; Milk and Dairy Products. Sensory Analysis. ASRO: Bucharest, Romania, 1995.
- Liu, N.; Pustjens, A.M.; Erasmus, S.W.; Yang, Y.; Hettinga, K.; van Ruth, S.M. Dairy farming system markers: The correlation of forage and milk fatty acid profiles from organic, pasture and conventional systems in the Netherlands. Food Chem. 2020, 314, 126153. [Google Scholar] [CrossRef]
- Timlin, M.; Tobin, J.T.; Brodkorb, A.; Murphy, E.G.; Dillon, P.; Hennessy, D.; O’Donovan, M.; Pierce, K.M.; O’Callaghan, T.F. The impact of seasonality in pasture-based production systems on milk composition and functionality. Foods 2021, 10, 1–32. [Google Scholar] [CrossRef]
- Florio, M.; Giannone, C.; Ianni, A.; Bennato, F.; Grotta, L.; Martino, G. Seasonal and Feeding System Effects on Qualitative Parameters of Bovine Milk Produced in the Abruzzo Region (Italy). Agriculture 2022, 12, 917. [Google Scholar] [CrossRef]
- Fox, P.F.; Guinee, T.P. Cheese Science and Technology. In Milk and Dairy Products in Human Nutrition; Wiley-Blackwell Publishers: Oxford, UK, 2013; ISBN 9780470674185. [Google Scholar]
- Mihai, A.L.; Mulțescu, M.; Negoiță, M.; Horneț, G.A.; Surdu, I.; Nicula, A.S. Nutritional Characterization of Some Romanian Mountain Products. Ann. Univ. Dunarea Jos Galati, Fascicle VI Food Technol. 2022, 46, 104–124. [Google Scholar] [CrossRef]
- Leiber, F.; Kreuzer, M.; Nigg, D.; Wettstein, H.R.; Scheeder, M.R.L. A study on the causes for the elevated n-3 fatty acids in cows’ milk of alpine origin. Lipids 2005, 40, 191–202. [Google Scholar] [CrossRef] [PubMed]
- Koba, K.; Yanagita, T. Health benefits of conjugated linoleic acid (CLA). Obes. Res. Clin. Pract. 2014, 8, e525–e532. [Google Scholar] [CrossRef]
- Shin, Y.K.; Oh, N.S.; Nam, M.S. Changes of organic acids and free fatty acids during the ripening of emmental cheese. Korean J. Food Sci. Anim. Resour. 2011, 31, 928–934. [Google Scholar] [CrossRef]
- Ziarno, M.; Bryś, J.; Kowalska, E.; Cichońska, P. Effect of metabolic activity of lactic acid bacteria and propionibacteria on cheese protein digestibility and fatty acid profile. Sci. Rep. 2023, 13, 15363. [Google Scholar] [CrossRef]
- Mato Rodriguez, L.; Ritvanen, T.; Joutsjoki, V.; Rekonen, J.; Alatossava, T. The role of copper in the manufacture of Finnish Emmental cheese. J. Dairy Sci. 2011, 94, 4831–4842. [Google Scholar] [CrossRef]
- Muñoz, N.; Ortigosa, M.; Torre, P.; Izco, J.M. Free amino acids and volatile compounds in an ewe’s milk cheese as affected by seasonal and cheese-making plant variations. Food Chem. 2003, 83, 329–338. [Google Scholar] [CrossRef]
- Addis, M.; Fiori, M.; Riu, G.; Pes, M.; Salvatore, E.; Pirisi, A. Physico-chemical characteristics and acidic profile of PDO Pecorino Romano cheese: Seasonal variation. Small Rumin. Res. 2015, 126, 73–79. [Google Scholar] [CrossRef]
- Danieli, P.P.; Lopez, A.; Bellagamba, F.; Vetturini, T.; Bernabucci, U.; Ronchi, B.; Moretti, V.M.; Basiricò, L. Effects of season and management on fatty acid profile, ACE-inhibitory activity and anti-oxidant properties of Italian Alpine cheeses. Ital. J. Anim. Sci. 2022, 21, 1021–1033. [Google Scholar] [CrossRef]
- Levkov, V.; Gadžovska, S.; Tuševski, O.; Gjorgovska, N.; Mateva, N. Preliminary study of total phenolic content in traditional sheep cheese (Bieno Sirenje). Maced. J. Anim. Sci. 2014, 4, 31–35. [Google Scholar] [CrossRef]
- Prema, P.; Smila, D.; Palavesam, A.; Immanuel, G. Production and characterization of an antifungal compound (3-phenyllactic acid) produced by Lactobacillus plantarum strain. Food Bioprocess Technol. 2010, 3, 379–386. [Google Scholar] [CrossRef]
- Renes, E.; Fernández, D.; Abarquero, D.; Ladero, V.; Álvarez, M.A.; Tornadijo, M.E.; Fresno, J.M. Effect of forage type, season, and ripening time on selected quality properties of sheep milk cheese. J. Dairy Sci. 2021, 104, 2539–2552. [Google Scholar] [CrossRef] [PubMed]
- de Jesus Filho, M.; Klein, B.; Quintão Teixeira, L.J.; Silva, J.G.S.; Pallone, J.A.L.; Wagner, R.; Godoy, H.T. The influence of production units and seasons on the physicochemical characteristics, mineral and fatty acid content, and texture profile of the artisanal cheeses from Serra da Canastra, Brazil. J. Food Compos. Anal. 2023, 123, 105589. [Google Scholar] [CrossRef]
- Rohm, H.; Jaros, D. Colour of hard cheese: 2. Factors of influence and relation to compositional parameters. Eur. Food Res. Technol. 1997, 204, 259–264. [Google Scholar]
- Pillonel, L.; Dufour, E.; Schaller, E.; Bosset, J.O.; De Baerdemaeker, J.; Karoui, R. Prediction of colour of European Emmental cheeses by using near infrared spectroscopy: A feasibility study. Eur. Food Res. Technol. 2007, 226, 63–69. [Google Scholar] [CrossRef]
- Faulkner, H.; O’Callaghan, T.F.; McAuliffe, S.; Hennessy, D.; Stanton, C.; O’Sullivan, M.G.; Kerry, J.P.; Kilcawley, K.N. Effect of different forage types on the volatile and sensory properties of bovine milk. J. Dairy Sci. 2018, 101, 1034–1047. [Google Scholar] [CrossRef]
- Kirdar, S.S.; Ocak, E.; Köse, S.; Özer, E. Seasonal changes in mineral and trace elements of çanak cheese. Asian J. Chem. 2013, 25, 6177–6180. [Google Scholar] [CrossRef]


Disclaimer/Publisher’s Note: The statements, opinions and data contained in all publications are solely those of the individual author(s) and contributor(s) and not of MDPI and/or the editor(s). MDPI and/or the editor(s) disclaim responsibility for any injury to people or property resulting from any ideas, methods, instructions or products referred to in the content. |
© 2024 by the authors. Licensee MDPI, Basel, Switzerland. This article is an open access article distributed under the terms and conditions of the Creative Commons Attribution (CC BY) license (https://creativecommons.org/licenses/by/4.0/).