Article

Effects of Seven-Year-Optimized Irrigation and Nitrogen Management on Dynamics of Soil Organic Nitrogen Fractions, Soil Properties, and Crop Growth in Greenhouse Production

1
Institute of Agricultural Resources and Environment, Hebei Academy of Agriculture and Forestry Sciences, Shijiazhuang 050051, China
2
Hebei Fertilizer Technology Innovation Center, Shijiazhuang 050051, China
3
Yellow River Institute of Eco–Environmental Research, Zhengzhou 450004, China
4
School of Information Science & Engineering, Lanzhou University, Lanzhou 730000, China
*
Author to whom correspondence should be addressed.
Agriculture 2024, 14(12), 2319; https://doi.org/10.3390/agriculture14122319
Submission received: 6 November 2024 / Revised: 12 December 2024 / Accepted: 16 December 2024 / Published: 17 December 2024
(This article belongs to the Section Agricultural Soils)

Abstract

:
Exploring the temporal evolution dynamics of different soil organic nitrogen (N) components under different water–N management practices is a useful approach to accurately assessing N supply and soil fertility. This information can provide a scientific basis for precise water and N management methods for greenhouse vegetable production. The objective of this study was to investigate the effects of optimized irrigation and nitrogen management on the dynamics of soil organic nitrogen fractions, soil properties, and crop growth. This research was conducted from 2017 to 2023 in a greenhouse vegetable field in North China. Four treatments were applied: (1) high chemical N application with furrow irrigation (farmers’ practice, FP); (2) no chemical N application with drip irrigation (DN0); (3) 50% N of FP with drip irrigation (DN1); and (4) 75% N of FP with drip irrigation (DN2). The volume in drip irrigation is 70% of that in furrow irrigation. The results showed that in 2023 (after seven years of field trials), compared with FP, the soil organic carbon (SOC), total N, and water use efficiency of the DN1 and DN2 treatments increased by 15.9%, 11.4%, and 11.3% and 7.7%, 47.2% and 44.6%, respectively. However, there was no significant difference in the total crop yield except in the DN0 treatment. Soil organic N was mostly in the form of acid-hydrolyzed N (AHN). After seven years of optimized irrigation and N management, the DN1 treatment significantly increased the content of ammonium N (AN) and amino sugar N (ASN) in AHN compared with the FP treatment. The results of further analysis demonstrated that SOC was the main factor in regulating AHN and non-hydrolyzable N (NHN), while the main regulatory factors for amino acid N (AAN) and ASN in the AHN component were dry biomass and water use efficiency, respectively. From a time scale perspective, optimization of the water and N scheduling, especially in DN1 (reducing the total irrigation volume by 30% and the amount of N applied by 50%), is crucial for the sustainable improvement of soil fertility and the maintenance of vegetable production.

1. Introduction

Irrigation and nitrogen (N) fertilizer play a vital role in regulating N supply capacity, crop growth, and water use efficiency (WUE) [1,2,3,4]. However, excessive irrigation and N application can lead to soil degradation, nutrient leaching, and reduced water/N use efficiency, especially in greenhouse production systems with high temperature and humidity levels [5,6]. Irrigation and the application of N fertilizer can directly or indirectly affect the soil’s physical and biological processes, thereby affecting the availability and supply capacity of N by regulating the soil N content and distribution in the greenhouse soil [4].
The soil N pool is divided into inorganic and organic N pools, with the latter accounting for 90% of the total pool [7]. Organic N is the cornerstone of maintaining N fertility [8]. According to the classification method proposed by Bremner [8], soil organic N can be divided into acid-hydrolyzable N (AHN) and non-hydrolyzable N (NHN), in which the fraction of AHN can be subdivided into the fractions of amino acid N (AAN), ammonium N (AN), amino sugar N (ASN), and hydrolyzable unknown N (UN). Furthermore, some studies have shown that AAN, AN, and ASN are the main contributors to bioavailable N [9], which are the mostly easily mineralizable forms and are the main source of soil organic N [4,9].
Recently, several studies have examined the effects of different soil types, N application rates, irrigation methods, organic fertilizers, and biochar, as well as other factors, on the content and distribution of different fractions of soil organic N [4,10,11,12,13,14,15]. A study in greenhouse crops reported that AN and AAN are important indicators of N supply [4]. A further analysis found that optimizing the irrigation and N fertilization schedules may effectively enhance the soil’s N supply potential and improve soil fertility by increasing its AN and AAN contents [4]. However, the dynamic changes in how soil organic N fractions respond to different water and N management practices is unclear. Having this information will enhance our understanding of the relationship between N availability and irrigation and N management in greenhouse production systems.
The different soil organic N fractions are differentially affected by variables such as irrigation method, form and amount of N application, soil type, and other factors. Drip irrigation is a highly efficient water management technology that delivers water at low pressure through a specialized network of pipe systems and associated equipment. Small emitters slowly and continuously release water to a small, localized area, ensuring optimal water application close to the root system. Compared with furrow irrigation, drip irrigation saves water, reduces evaporation, improves water use efficiency, and often increases crop yield. Singh et al. [16] also reported that drip irrigation can save 40% water and significantly increase the pepper crop yield by 52% compared to conventional irrigation.
Additionally, a five-year experiment with different irrigation methods and N fertilizer management showed that AN and AAN can effectively predict the soil N supply potential in greenhouse production systems [4]. A further analysis found that soil total N, soil organic carbon, and nitrate were the main explanatory factors for the soil organic N fractions [4]. Although changes in N fertilizer application or irrigation methods and their interactions may affect the content and distribution of soil organic N fractions [12,17], it is still unclear how optimized water and N management schedules regulate the organic N composition at the temporal scale.
More importantly, there are few reports on how changes in organic N composition affect soil properties, crop growth, and water use efficiency. Such information will enhance the optimization of the N supply and precise irrigation management in greenhouse production systems. Optimizing both irrigation and N management will maximize vegetable yields and water and nutrient use efficiency in greenhouse production systems.
This seven-year study focused on optimizing irrigation and N application aims to achieve the following: (i) investigate the changes in the soil properties; (ii) evaluate the capacity of soil organic N supply; and (iii) explore the factors driving the dynamics of different soil organic N fractions. Obtaining these results will provide a robust framework for optimizing the management of greenhouse crops and for future research activity.

2. Materials and Methods

2.1. Study Area

This study was conducted at the Experimental Station of Hebei Academy of Agriculture and Forestry Science, located in Luquan County, Hebei Province, China (38°5′ N, 114°23′ E; elevation: 67–69 m). Since February 2017, a long-term experiment on the vegetable growth in a solar plastic greenhouse has been ongoing in an area characterized by a warm-temperature, continental, monsoonal climate. The solar greenhouse spans 8 m in width and covers a total area of 400 m2. The soil type in this study is classified as calcareous cinnamon soil with a clay loam texture (Calcaric Cambisols in the FAO classification) [18,19]. The initial topsoil layer (0–20 cm) has the following physio-chemical properties: soil organic carbon (SOC) of 4.7 g kg−1, total N of 0.59 g kg−1, available P (AP) of 10.0 mg kg−1, available K (AK) of 101.2 mg kg−1, bulk density of 1.5 g cm−3, and a pH of 7.6 (soil/water: 1:2.5).

2.2. Experimental Design

This study was conducted from 2017 to 2023, with two growing seasons each year: a winter–spring season (WS) from early February to early July and an autumn–winter season (AW) from October to early January. Cucumbers were grown in the WSs of 2017 to 2022. Tomatoes were grown in the AWs of 2017 to 2023, except for 2019, when celery was grown. Due to viral diseases and root-knot nematodes, the crop for the AW in 2019 was changed to celery, and the crop for the WS in 2023 was changed from cucumber to tomato (Table 1). This required the water and N application rates to be modified accordingly (Table 1).
A completely randomized block design was used with the following treatments: (1) high chemical N application with furrow irrigation (farmers’ practice, FP); (2) no chemical N application with drip irrigation (DN0); (3) 50% N of FP with drip irrigation (DN1); and (4) 75% N of FP with drip irrigation (DN2). Each treatment was replicated three times. Organic fertilizer was applied in all of the treatments. The commercial organic fertilizer (Hebei Xingwu Biotechnology Co., Ltd., Handan, China) was developed from mushroom culture medium.
Each plot measured 2 m by 6 m and used the high-ridge cultivation technique. Plots were longitudinally isolated with a buried plastic film to a depth of 100 cm to prevent cross-contamination between the treatments. Each plot was planted with 57 cucumber plants, 39 tomato plants, or 85 celery plants.
Commercial organic fertilizer (1.57% N, 1.00% P2O5, 1.71% K2O) and chemical fertilizers, including urea (46-0-0, Hebei Zhengyuan Hydrogen Energy Technology Co., Ltd., Cangzhou, China), monoammonium phosphate (11-61-0, Hebei Monband Water Soluble Fertilizer Co., Ltd., Shijiazhuang, China), potassium dihydrogen phosphate (0-52-34, Hebei Monband Water Soluble Fertilizer Co., Ltd., Shijiazhuang, China), potassium nitrate (13.5-0-46, Hebei Monband Water Soluble Fertilizer Co., Ltd., Shijiazhuang, China), and water-soluble potassium sulfate (0-0-50, Hebei Monband Water Soluble Fertilizer Co., Ltd., Shijiazhuang, China), were applied at a 1:1 ratio of P2O5. Organic fertilizer was applied as the basal fertilizer, and chemical fertilizers were applied as a topdressing with irrigation. The overall fertilization rate was adjusted according to the specific growth requirements of each vegetable season, with slight variations due to seasonal differences in the organic fertilizer moisture content and nutrient content.
Furrow irrigation followed the traditional local methods, while drip irrigation was an optimized technique, conserving water compared to furrow irrigation. The inner diameter of the drip tape was 16 mm, the rated emitter flow rate was 2 L h−1, the spacing of the drip head was 30 cm, and the maximum working pressure was 0.3 MPa. Throughout the cucumber-, tomato-, and celery-growing seasons, the vegetables received furrow irrigation 10, 5, and 4 times and drip irrigation 15, 8, and 6 times, respectively. The total irrigation volumes are given in Table 1.

2.3. Sampling and Analysis

Soil samples (0–20 cm) were collected during the harvest period in the summers of 2017, 2019, 2021, and 2023 using the 5-point method [20]. The samples were air-dried, milled, and sieved through a 2 mm mesh for subsequent determination of the soil properties. Fresh soil samples extracts were analyzed using a spectrophotometer to determine the NO3-N content [21]. pH was measured using a pH meter with a standardized soil-to-water ratio of 1:2.5. EC was measured using a conductivity meter with a soil-to-water ratio of 1:5. Soil organic carbon (SOC) content was quantified using the potassium dichromate wet combustion procedure. Available phosphorus (AP) was measured using the Olsen method; soil was extracted using 0.5 mol L−1 sodium bicarbonate solution, followed by analysis with the molybdenum–antimony anti-colorimetric method. Available potassium (AK) was assessed through extraction with 1.0 mol L−1 ammonium acetate solution, with subsequent determination using flame photometry. The total N (TN), total phosphorus (TP), and total potassium (TK) in the soil samples were measured using the semimicro Kjeldahl method, the molybdate colorimetric method after digestion with perchloric acid, and flame photometry following fusion with sodium hydroxide, respectively.
Organic N fractions were differentiated using a soil heating method with 6 mol L−1 HCl for 12 h, as described by Bremner [8]. The organic N fraction was further divided into acid-hydrolyzable N (AHN) and non-hydrolyzable N (NHN). AHN comprises amino acid N (AAN), ammonium N (AN), amino sugar N (ASN), and hydrolyzable unknown N (UN). AAN was quantified using the ninhydrin oxidation and phosphate-buffered distillation method. AN was determined in the presence of 3.5% magnesium oxide (MgO), while the sum of AN and ASN was assessed using a phosphate–borate buffer. UN was calculated using the formula UN = AHN − (AN + AAN + ASN). Non-hydrolyzable N (NHN) was derived from the formula NHN = TN − AHN.
The cucumber and tomato crops were hand-harvested and weighed at each harvest event. Celery was harvested at the conclusion of the growing season. At the final harvest, two representative plants were selected, and their roots, stems, leaves, and fruits were separated and cleaned with deionized water. The plant samples were initially oven-dried at 105 °C for 30 min, followed by drying at 55 °C for over 48 h to achieve a constant weight.

2.4. Data Analysis and Calculation

The following equations were used to compute the water use efficiency (WUE) for each crop.
WUE = Fresh yield/irrigation amount
Annual WUE = Total annual yield/total annual irrigation amount
where irrigation is the irrigation volume of the whole vegetable season (m3).
A one-way ANOVA was used to analyze the effects of different rates of irrigation and N on the fractions of soil organic N (AN, AAN, ASN, UN, AHN, and NHN), the soil properties (TN, SOC, C/N, NO3-N, pH, EC, TP, TK, AP, and AK), yield, dry biomass, and WUE. Then, a one-way ANOVA was used to compare the differences in the fractions of soil organic N (AN, AAN, ASN, UN, AHN, and NHN) and the soil properties (TN, SOC, C/N, NO3-N, pH, EC, TP, TK, AP, and AK) for the same treatment between years. For multiple comparisons, a post hoc Duncan’s test was used to compare the differences between the treatments at the p < 0.05 levels. Pearson’s correlation coefficients were used to evaluate the relationships between soil organic N fractions and parameter variables of soil or vegetation in R. Plots were generated using R. The variance inflation factor (VIF) was used to identify the multicollinearity among the explanatory variables. Variables with a VIF > 10 were discarded. For the final selected model, the relative contributions of each predictor to the model were quantified using the Lindeman–Merenda–Gold relative importance method with the R package “relaimpo”. All of the statistical analyses were performed using R version 3.4.4.

3. Results

3.1. Yield, Dry Biomass, and Water Use Efficiency (WUE) Under Various Irrigation and N Rates

Table 2 presents the data on vegetable yields, dry biomass, and WUE under different irrigation and N application rates. These indicators varied across different vegetable types and growth seasons. Prior to 2023, the yields and dry biomass from the FP (furrow irrigation) treatment were greater than those from the drip irrigation treatments (DN0, DN1, and DN2).
However, by 2023, there were no significant differences in the total yields between the FP, DN1, and DN2 treatments (Table 2). Concurrently, the annual WUE for the drip-irrigated treatments (DN1 and DN2) was consistently higher than that in the FP treatment throughout the study period (Table 2).

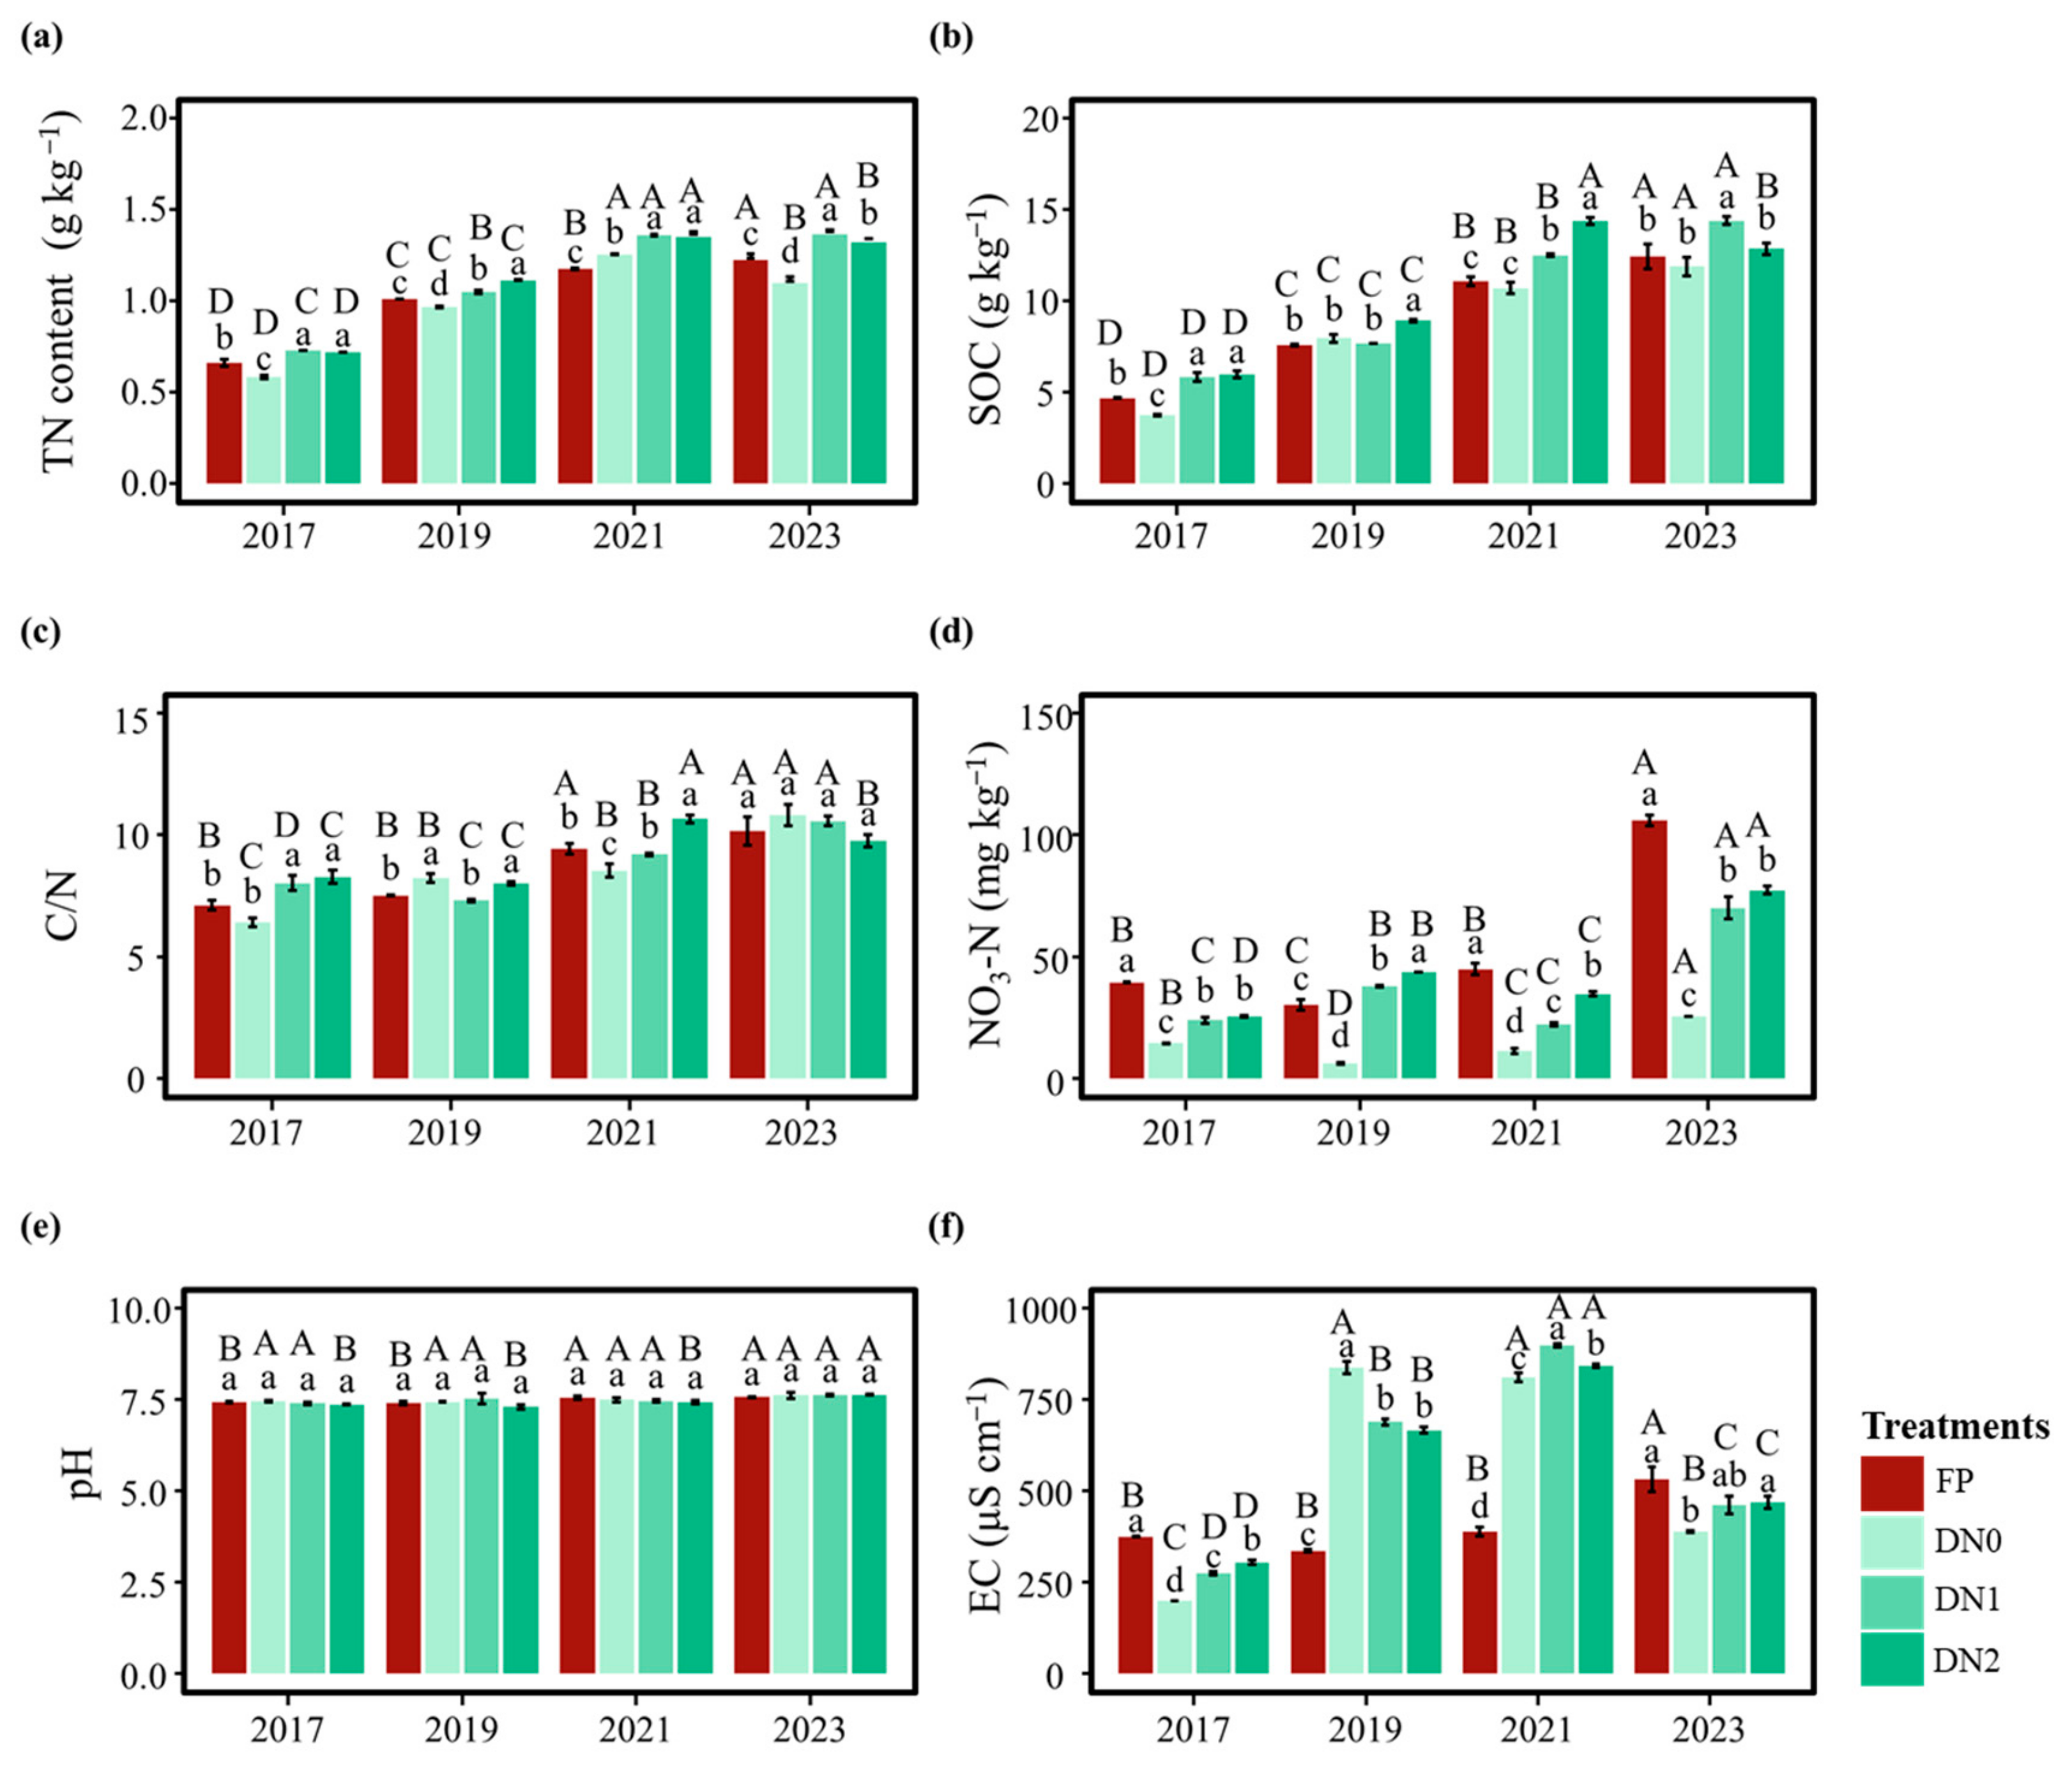
3.2. Soil Properties Under Various Irrigation and N Application Rates

Figure 1 and Table S1 present the data on the soil properties throughout study. During the seven-year period, SOC notably increased over time and was influenced by the different irrigation methods and N application rates. Compared to 2017, the SOC in 2023 increased by 166%, 218%, 147%, and 115% under the treatments of FP, DN0, DN1, and DN2, respectively. After 14 vegetable growing seasons (2 growing seasons per calendar year), SOC under the DN1 treatment was significantly higher, by 15.9%, compared to that in the FP treatment (p < 0.05). In 2023, the C/N ratios were significantly increased compared to those in 2017 (p < 0.05). However, no significant differences in the C/N ratios were observed among the FP, DN0, DN1, and DN2 treatments after 14 seasons of vegetable cultivation. The soil NO3-N content increased with the N application rate during the seven-year period. Compared to the DN0 treatment, the soil NO3-N content increased by 315% for the FP treatment, 203% for the DN2 treatment, and 175% for the DN1 treatment (p < 0.05).
There was no significant difference in the pH values among the four treatments over the seven years. However, compared to the results in 2017, the pH values in 2023 increased by 0.2 units for both the FP and DN2 treatments (p < 0.05). EC also increased with the N application levels in both 2017 and 2023, and the FP treatment had the highest EC values. Notably, the EC was lower for the FP treatment compared to the other treatments in 2019 and 2021, which may be attributed to the leaching of inorganic ions associated with the irrigation practices.

3.3. Soil Organic N Fractions in the Greenhouse Under Different Irrigation and Fertilization Practices

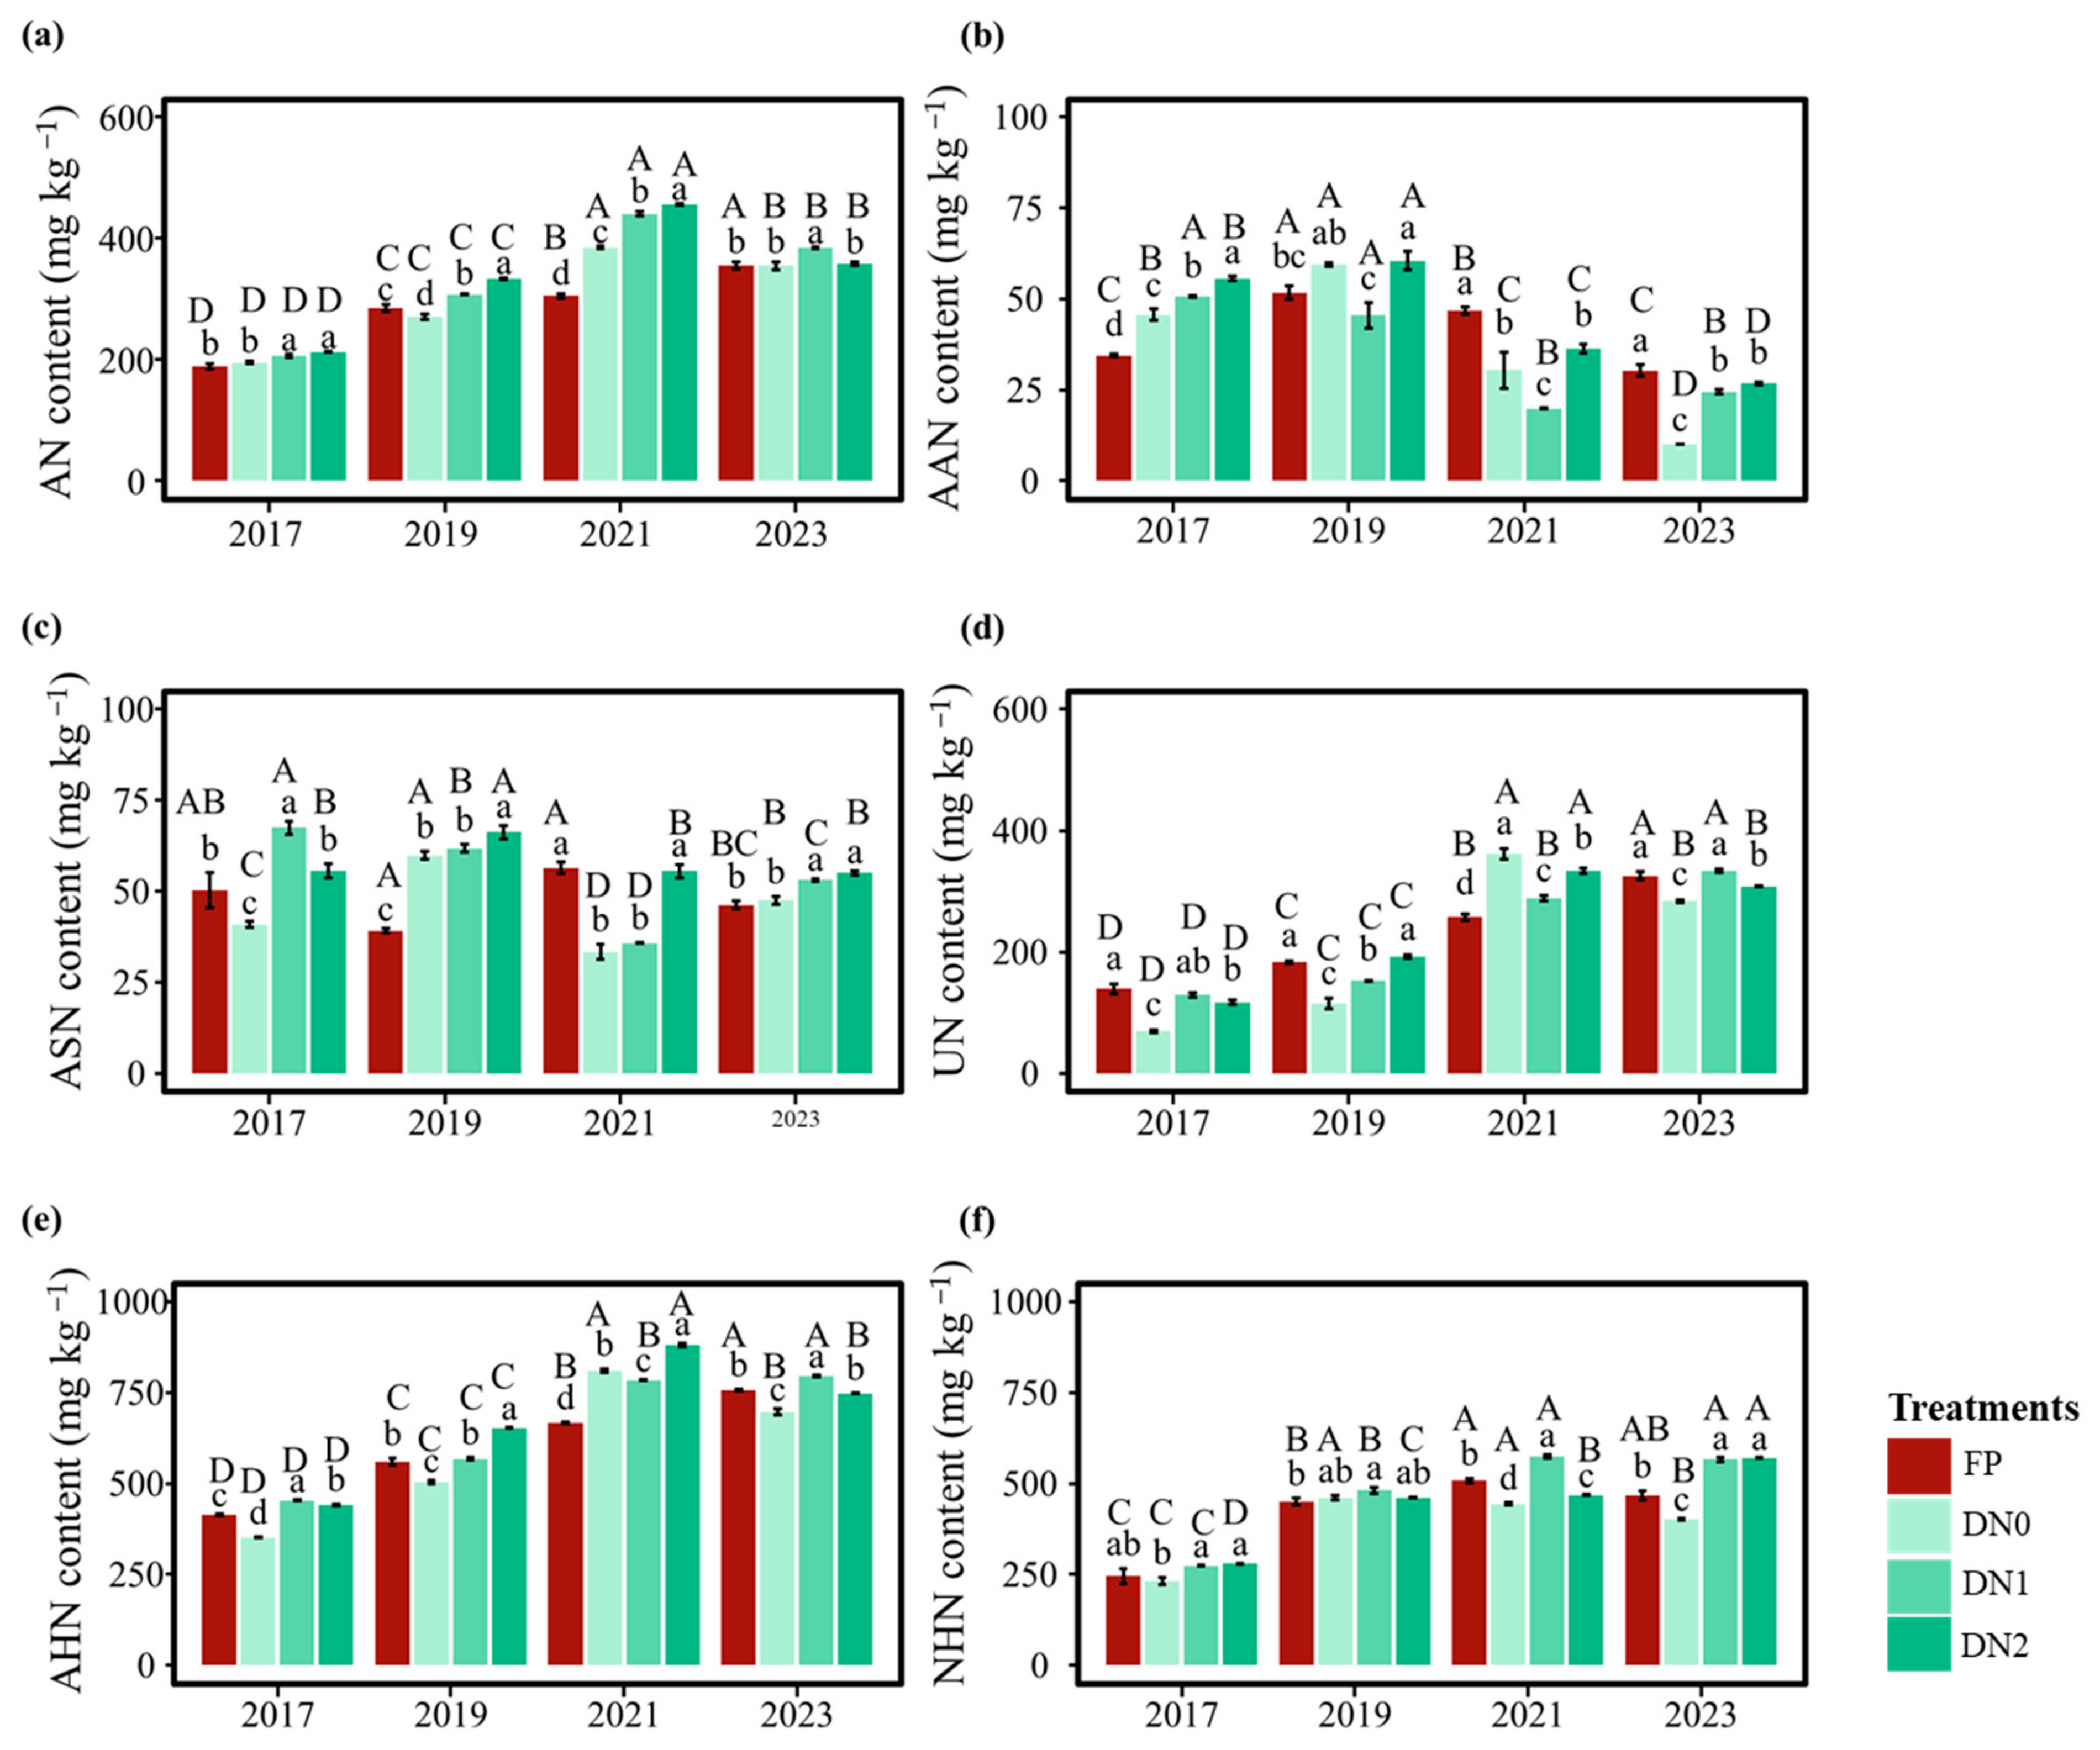
3.3.1. Total N, Acid-Hydrolyzable N, and Non-Hydrolyzable Nitrogen

The total N (TN) content under the FP, DN0, DN1, and DN2 treatments exhibited a trend of increasing from 2017 to 2021 and then the TN content showing different patterns in 2023 (Figure 1a). The soil TN fell within the ranges of 0.63–1.24, 0.57–1.26, 0.73–1.37, and 0.72–1.36 g kg−1 under the FP, DN0, DN1, and DN2 treatments, respectively (Figure 1a). Under the FP treatment, soil TN exhibited a significant increasing trend, with an increasing rate up to 85.90% in 2023 compared with 2017. Similar patterns were observed under the DN0 and DN2 treatments; that is, it began to increase rapidly in 2017, reached the highest value in 2021, and then declined. The DN1 treatment demonstrated a consistent upward trend, with an 87.23% increase in 2023 relative to 2017.
Figure 2 provides a clear depiction of the soil organic N fractions, including acid-hydrolyzable N (AHN) and non-hydrolyzable nitrogen (NHN). From 2017 to 2023, the AHN contents fell into the ranges of 409.31–759.70, 348.87–817.89, 452.15–797.65, and 437.53–890.03 mg kg−1 under the FP, DN0, DN1, and DN2 treatments, respectively. During the seven years, the AHN content under the FP and DN1 treatments exhibited a significant upward trend, while for DN0 and DN2, there was a marked increase until 2021, followed by a decline. During the same period, the soil NHN contents under FP, DN0, DN1, and DN2 fell into the ranges of 219.11–518.97, 215.81–471.89, 270.24–584.87, and 276.00–571.34 mg kg−1, respectively. The NHN content under the DN1 and DN2 treatments showed a significant increasing trend throughout the experimental period, whereas under the FP treatment, it initially increased and then reached a plateau. Meanwhile, the NHN content under the DN0 treatment fluctuated, with it consistently laying at lower levels.

3.3.2. Soil AHN Fractions

The AHN fractions include AAN, AN, ASN, and UN. As illustrated in Figure 2a, the AN content under the FP, DN0, DN1, and DN2 treatments exhibited a trend of first increasing and then decreasing from 2017 to 2023. The AN content under the FP, DN0, DN1, and DN2 treatments fell into the ranges of 180.99–365.24, 191.44–388.03, 200.67–447.45, and 212.16–457.28 mg kg−1, respectively. Notably, the FP treatment demonstrated a significant trend of an increase in AN content during the seven-year period, contrasting with the peak in the AN content observed in 2021 for the DN0, DN1, and DN2 treatments, which was followed by a decline. The AAN content presented a fluctuating trend in all circumstances during the period of seven years. It is noteworthy that among all of the treatments, the soil AAN content was the lowest pool of soil organic N. From 2017 to 2023, the soil ASN contents fell into ranges of 38.52–59.61, 29.58–59.77, 35.37–67.40, and 52.16–69.88 mg kg−1 under the FP, DN0, DN1, and DN2 treatments, respectively. ASN content displayed a fluctuating trend across all of the treatments, with an upward trend observed in 2019, 2021, and 2023 for the DN0, DN1, and DN2 treatments. Notably, the lowest ASN content under the FP treatment occurred in 2019. From 2017 to 2023, the UN contents under the FP, DN0, DN1, and DN2 treatments were in the ranges of 124.63–336.45, 65.39–378.53, 121.83–336.27, and 109.89–341.25 mg kg−1, respectively. The UN contents under the FP and DN1 treatments showed a significant increasing trend over time, while the UN contents under the DN0 and DN2 treatments also exhibited a significant increasing trend before 2021 and but then declined. Figure 2b shows the proportions of the AHN and NHN fractions in the TN under different rates of irrigation and fertilization. Under the FP treatments, the contents of the AHN fractions are shown in order as AN > UN > AAN/ASN, while under the DN0, DN1, and DN2 treatments, the contents of the AHN fractions are shown in the following order: AN > UN > ASN > AAN (Figure 3).

3.4. Drivers of Soil Organic N Fractions

The Pearson’s correlation coefficients revealed a very strong positive association between the soil properties and het organic N fractions. TN, SOC, C/N, EC, TP, AP, and AK all demonstrated significant positive correlations with AN, UN, NHN, and AHN (Table 3). NO3-N was found to be significantly correlated with UN, NHN, and AHN. No significant correlation was observed between TK or TY and the soil’s organic N fractions (Table 3). pH showed a significant positive correlation with most of the soil’s organic N fractions, with the exception of ASN and AAN. TDM was found to be significantly and very significantly positively correlated with AHN and UN, respectively. Annual WUE was the only parameter that showed a significant positive correlation with ASN (Table 3).
The results of Pearson’s correlation were confirmed by the stepwise Akaike Information Criterion (AIC) model selection. SOC, TP, EC, and TK were identified as key drivers of AN and together accounted for 92.9% of the variation in AN (as depicted in Figure 4a). A subsequent analysis of the relative importance partitioning revealed that these four factors individually contributed to 44.7%, 30.2%, 24.5%, and 0.69% of the explained variation, respectively. TDM, AK, TY, and NO3-N were the most influential drivers, collectively explaining 79.7% of AAN (as illustrated in Figure 4b). The relative importance partitioning for these parameters indicated that they contributed 52.7%, 29.7%, 10.5%, and 7.1% of the explained variation in AAN, respectively.
For AHN, SOC and EC were identified as the most significant drivers; together, they explained 93.8% of the variation (as shown in Figure 4c). Further partitioning of the relative importance revealed that these two factors are responsible for 79.7% and 20.3% of the explained variation in AHN, respectively. SOC, TDM, AK, EC, and annual WUE were recognized as the primary drivers of UN and explained 91.4% of the variation in UN (as seen in Figure 4d). The relative importance partitioning for these factors showed that they contributed 52.4%, 23%, 13.1%, 10.5%, and 1.1% of the explained variation in UN, respectively. The most crucial drivers of ASN were annual WUE, TDM, NO3-N content, and TY, which together explained 56.5% of the variation (as indicated in Figure 4e). Lastly, AP and SOC + TDM were the most important drivers, jointly explaining 74.3% of the variation in NHN (as shown in Figure 4f). The relative importance partitioning for these factors indicated that they contributed 94.6% and 5.4% to the explained variation in NHN, respectively.

4. Discussion

4.1. Vegetable Yield and Soil Properties Under Different Irrigation Methods and N Application Rates

Optimizing practices related to the amount of water (drip irrigation) and N used is key to improving soil fertility and increasing vegetable production [22]. However, the effects of long-term drip irrigation, especially coupled with optimized N fertilization, on soil quality and vegetable yields were unknown. Our study showed that after seven years of optimized water and N management, there were no significant differences in the vegetable yield (DN1 and DN2) and total dry biomass (DN1) compared with the FP treatment (Table 2). This result showed that optimizing irrigation and fertilizer management played an important role in vegetable yield and the sustainability of these greenhouse production systems. The WUE under optimized irrigation and N application practices (DN0, DN1, and DN2) was significantly higher than that in the FP treatment, which is likely attributable to the 30% reduced irrigation volume with drip irrigation (Table 2). Furthermore, our study also demonstrated that optimizing the water and fertilizer management pattern significantly increased the SOC content and maintained a high C/N ratio (Figure 1b,c). After the seven-year study, SOC increased under the FP treatment; however, it was slightly lower than that of the DN1 treatment. The increase in SOC in all treatments, especially after the optimized water–N practices (DN1), could have occurred for the following two reasons: (i) In all of the treatments, organic fertilizer was applied as the base fertilizer to provide a large amount of carbon sources for the formation of SOC; (ii) in this study, the amount of irrigation under the drip irrigation pattern was reduced by 30% compared with that in FP, which provided the possibility of reducing the loss of water-soluble carbon in SOC, thereby maintaining a higher SOC content, which agreed with the reports by Ding et al. (2023) [22] and Chen et al. (2018) [23]. By reducing the irrigation volume by 30% compared to traditional furrow irrigation, drip irrigation not only stimulates root development and plant nutrient uptake but also appreciably reduces potential nutrient leaching loss [24].

4.2. Soil Organic N Fractions Under Different Irrigation Methods and N Rates

N is an essential element for crop growth and an important parameter for soil fertility. As the main form of soil N, soil organic N directly affects nutrient uptake, the accumulation and distribution of assimilates, and balanced growth both above and below ground [25]. Moreover, the proportions of the soil organic N fractions contributing to the total soil N vary with the amounts of N applied, organic fertilizer, and irrigation and tillage practices [12,26,27]. In our study, the results demonstrated that the content and distribution of the soil organic N fractions differed significantly under various irrigation and N application rates (Figure 2). These findings were consistent with previous studies [4,12]. The AHN content was higher than that of NHN, showing an increasing trend before 2021. The AHN content was highest in the DN1 treatment in 2023; however, the lowest was found in the DN0 treatment, followed by FP treatment (Figure 2). These results demonstrated that N application rates that were neither too high nor too low were conducive to the accumulation of AHN in the greenhouse soil. Sekhon et al. [17] also found that the AHN content and distribution were affected by the irrigation and N fertilization practices.
AHN consists of four components: AN, AAN, ASN, and UN. Several studies have shown that optimizing water and fertilization practices can significantly affect the composition and transformation of these components. These changes, in turn, affect the contents and distribution of AHN, thereby regulating N availability [4,28,29]. Our study showed that the content and distribution of AN and UN increased over time, while AAN decreased. The average contents of AHN fractions, during these seven years (2017–2023), were in the order AN > UN > AAN/ASN (Figure 2 and Figure 3). However, Wang et al. [15] found that the content of AHN and its allocation ratio followed the order of UN > AAN/AN > ASN. Meanwhile, Braos et al. [30] showed that the hydrolyzable N fractions varied widely among the soils studied and were more variable for ASN than for the other fractions. This slightly different result may be attributed to the following two reasons: (i) different optimized water–N regulation modes maybe directly lead to the redistribution of various organic N forms, and (ii) different soil environmental conditions, such as soil water, air, and heat, under different irrigation and N treatments may indirectly lead to effects on soil microbial activity, quantity, and community structure, thereby affecting the distribution of the soil’s organic N components [11,31].
The present study showed that AN and UN were the main forms of soil organic N in this greenhouse’s soil (Figure 2 and Figure 3). AN is primarily derived from the decomposition of exchangeable ammonium N in the soil and N-containing organic substances such as amides and hydroxyl amino acids [32]. AN was the most active N reservoir and was used as the main source of labile organic N in the soil that can promote the soil’s N supply capacity [9,33,34]. UN is widely recognized as a primary contributor to the soil’s active N. Its components encompass N heterocyclics, soil humus, the products of N transformation processes, and some portion of unreleased fixed ammonium solutions, with the specific nature of the acid solution N remaining unclear [7,35]. Our study showed that the AN and UN contents under the DN1 treatment were higher than those under low or high levels of N application (DN0 and DN2; Figure 2 and Figure 3). Therefore, AN and UN are the most important and the main forms of soil organic N under reasonable water and N management. They are also the key indicators of the soil’s N supply potential in greenhouse soil. Consequently, AN and UN are identified as the most crucial and predominant forms of soil organic N. They also serve as pivotal indicators of the soil’s N supply potential, particularly in greenhouse soils.
AAN was the lowest component among the AHN fractions and exhibited minimal variation throughout the experimental period, indicating that irrigation and N fertilizer had little effect on amino sugar N, which is not consistent with the results of other research [4,36]. This may be because AAN has been proven to be the main source of N that can be assimilated by crops and microorganisms, with higher bioavailability in greenhouse production systems. The proportion of NHN within the total N in the soil has been increasing over time (Figure 2 and Figure 3), which is consistent with the findings of Ji et al. [37]. In general, under high-TN-content conditions, the AHN content decreased with an increase in the TN content, and the reduced AHN was mainly converted into NHN. These contradictory results we obtained may have been due to the low TN content in the soil in this study, so residual N was preferentially converted into AHN. Then, when the TN content continued to increase, the easily mineralized AHN pool was further converted into NHN, thus promoting an increase in the soil’s total N.
Unlike other production systems, the high-temperature and high-humidity conditions in greenhouse soils are conducive to the mineralization of organic N. Therefore, optimizing water and N management can significantly influence the distribution of the soil’s organic N fractions and even the soil’s N supply capacity.

4.3. Driving Factors Regulating the Content and Distribution of Soil Organic N Components

In agroecosystems, dynamic changes in the soil’s organic N fractions are the result of the comprehensive interaction of physical and biochemical processes in the soil, as well as vegetation growth [38]. Our results showed that SOC was the most important driving factor for the contents of AHN and NHN and the fractionation of AN and UN in the AHN (Figure 4). In our study, organic fertilizer (containing 300 kg N ha−1 organic fertilizer, Table 2) was applied as the base fertilizer under different water and N management practices, which may have been the main reason for the increase in SOC as the experimental time prolonged. In turn, when the soil fertility and N input increased, the soil N content, which is highly coupled with carbon, also increased significantly (Figure 1). The above process ultimately led to an increase in the content of AHN and NHN under different water and N management practices (Figure 2 and Figure 3). Furthermore, the result that the content of AN in soil organic N was also significantly regulated by SOC was consistent with previous studies [39,40]. This may have been due to the fact that low SOC levels (the average SOC of all treatments in this study was 9.5 g kg−1) limit the N cycle in the soil, allowing microorganisms to use low-molecular-weight amino sugars as alternative carbon sources, ultimately causing greater conversion of other components into AN and increasing its content [41,42] (Figure 2). The SOC-driven UN content may be the result of apparent synergy, and its specific reasons still need to be further studied.
AAN and ASN have been shown to be the most important N components for plant growth in different agricultural systems, with high availability [43]. Our study demonstrated that TDM and annual WUE emerged as the most significant drivers of AAN and ASN, respectively (Figure 4). This underscores the role of AAN as an active component of soil organic N that is readily absorbed and utilized by crops.
In our study, the irrigation methods and N application rates significantly affected the content and distribution of the soil N fractions and thus could change the availability and potential N supply capacity in the greenhouse agronomic system. However, more importantly, although amino acids and similar compounds are part of soil organic N and can be directly absorbed by plants [44], most of the soil’s organic N must be converted into mineral N before it can be used by vegetation [45,46]. It is worth noting that different water and N management practices will cause changes in the soil’s environmental conditions, including moisture, fertility, aeration, and thermal status, which, in turn, lead to changes in the activity, abundance, and composition of soil microorganisms, ultimately controlling the microbial-dominated soil organic N conversion direction and rates. Therefore, the dynamic relationship between the organic N fractions and the activities, abundance, and composition of soil microorganisms under different irrigation and N application practices should be considered in future studies. In addition, the effects of nitrogen fertilizer types on the soil’s organic nitrogen fractions need to be studied [47].

4.4. Practical Implications

Our results showed that by optimizing N and water management, crop yields can be maintained while ensuring a steady increase in soil fertility (Table 2; Figure 1). This provides a reference for effective ways to solve the problem of excessive irrigation and fertilization in vegetable production. The integration of irrigation and fertilization into crop growth has been extensively researched across various global regions, but the outcomes have varied among these studies depending on the agricultural practices and soil environments [48,49]. Equally, excessive irrigation and fertilization practices, often employed to mitigate the risk of yield reduction, have led to a significant escalation in the waste of resources and environmental damage, such as groundwater eutrophication and soil nutrient leaching [50,51]. Through its seven-year experiments, this study combined the concept of “fertilizer–water–saving” and took the soil’s organic N fractions as its entry point. Compared with traditional farmers practice, reducing irrigation by 30% and N by 50% with drip fertigation is essential not only for enhancing water and N use efficiency but also for preserving soil fertility and sustainability.

4.5. Limitations

In our study, we employed chemical methods to ascertain the fractions and content of soil organic N (SON). Utilizing a Pearson’s correlation statistical analysis, we established the relationship between the individual fractions of SON and vegetable yield. However, the actual bioavailability of each SON fraction and its correlation with crop N uptake remain inestimable, suggesting a potential need for isotopic techniques and methodological advancements to quantify these aspects. Notably, organic fertilizers play a crucial role in enhancing the SON content and its distribution in the soil, as they contribute directly to promoting the transformation of organic nitrogen into forms that are more readily available to crops [52]. The findings of this study involved dissecting the relative effects of water and N on SON under consistent conditions of organic fertilizer application. Going forward, it is imperative to continue monitoring and unraveling the effects of organic fertilizers on the soil’s N components and their underlying mechanisms.

5. Conclusions

This seven-year field study demonstrated that optimized irrigation and N management improved the soil’s N supply and fertility and maintained vegetable production. The results indicated that compared to FP, optimized irrigation and N management markedly enhanced SOC, TN, and specific fractions of soil organic N, concurrently stabilizing vegetable production. SOC was the main driving factor for regulating AHN and NHN, and the main regulatory factors for AAN and ASN in the AHN component were dry biomass and water use efficiency, respectively. Our results suggest that compared to FP, an optimized irrigation and N management strategy (DN1) could reduce the total irrigation volume by 30% and the amount of N applied by 50% and that it could enhance soil N supply and availability by altering the contents and relative distribution of the fractions of soil organic N. This, in turn, resulted in improved soil properties and vegetation growth. These findings provide valuable insights and scientific guidelines for the precise and efficient management of irrigation and N application.

Supplementary Materials

The following supporting information can be downloaded at https://www.mdpi.com/article/10.3390/agriculture14122319/s1, Table S1: The TP, TK, AP, and AK of topsoil (0–20 cm) under the different rates of irrigation and N.

Author Contributions

Conceptualization, Z.J.; methodology, Z.J.; software, C.W. and R.L.; formal analysis, J.S.; investigation, J.S., L.J., R.L., L.P. and T.J.; resources, J.S. and L.W.; data curation, J.S., L.J., C.W. and R.L.; writing—original draft, J.S.; writing—review and editing, L.W. and Z.J.; supervision, S.H.; funding acquisition, L.W. and S.H. All authors have read and agreed to the published version of the manuscript.

Funding

This research was funded by the National Key Research and Development Program of China “Intergovernmental Cooperation in International Science and Technology Innovation” (2023YFE0104700), HAAFS Agriculture Science and Technology Innovation Project (2022KJCXZX-ZHS-1), and Hebei Agriculture Research System (HBCT2024130215).

Institutional Review Board Statement

Not applicable.

Data Availability Statement

The data that support the findings of this study are available from the corresponding author upon reasonable request.

Acknowledgments

We would like to thank all of the external reviewers for their guidance and help during the revision process. We would also like to thank Rodney Tomson from the University of Almeria in Spain for his guidance and help.

Conflicts of Interest

The authors declare no conflicts of interest.

References

  1. Dai, Z.; Fei, L.; Huang, D.; Zeng, J.; Chen, L.; Cai, Y. Coupling effects of irrigation and nitrogen levels on yield, water and nitrogen use efficiency of surge-root irrigated jujube in a semiarid region. Agric. Water Manag. 2019, 213, 146–154. [Google Scholar] [CrossRef]
  2. Gao, N.; Liu, Y.; Wu, H.; Zhang, Y.; Zou, H.; Fan, Q.; Zhang, Y. Interactive effects of irrigation and nitrogen fertilizer on yield, nitrogen uptake, and recovery of two successive Chinese cabbage crops as assessed using 15N isotope. Sci. Hortic. 2017, 215, 117–125. [Google Scholar] [CrossRef]
  3. Wang, Y.; Janz, B.; Engedal, T.; Neergaard, A.D. Effect of irrigation regimes and nitrogen rates on water use efficiency and nitrogen uptake in maize. Agric. Water Manag. 2017, 179, 271–276. [Google Scholar] [CrossRef]
  4. Wu, H.; Du, S.; Zhang, Y.; An, J.; Zou, H.; Zhang, Y.; Yu, N. Effects of irrigation and nitrogen fertilization on greenhouse soil organic nitrogen fractions and soil-soluble nitrogen pools. Agric. Water Manag. 2019, 216, 415–424. [Google Scholar] [CrossRef]
  5. Shu, L.; Liu, R.; Min, W.; Wang, Y.; Yu, H.; Zhu, P.; Zhu, J. Regulation of soil water threshold on tomato plant growth and fruit quality under alternate partial root-zone drip irrigation. Agric. Water Manag. 2020, 238, 106200. [Google Scholar] [CrossRef]
  6. Yu, X.; Zhang, J.; Zhang, Y.; Ma, L.; Jiao, X.; Zhao, M.; Li, J. Identification of optimal irrigation and fertilizer rates to balance yield, water and fertilizer productivity, and fruit quality in greenhouse tomatoes using TOPSIS. Sci. Hortic. 2023, 311, 111829. [Google Scholar] [CrossRef]
  7. Stevenson, F.J. Organic Forms of Soil Nitrogen. Nitrogen Agric. Soils. USA Am. Soc. Agron. 1982, 22, 1–42. [Google Scholar]
  8. Bremner, J.M. Organic Forms of Nitrogen//BLACK C A. Methods of Soil Analysis; American Society of Agronomy Incorporation: Madison, WI, USA, 1965; pp. 1148–1178. [Google Scholar]
  9. Li, L.; Li, S. Nitrogen Mineralization from Animal Manures and Its Relation to Organic N Fractions. J. Integr. Agric. 2014, 13, 2040–2048. [Google Scholar] [CrossRef]
  10. Chen, M.; Xu, J.; Li, Z.; Li, D.; Wang, Q.; Zhou, Y.; Guo, W.; Ma, D.; Zhang, B. Long-term nitrogen fertilization-induced enhancements of acid hydrolysable nitrogen are mainly regulated by the most vital microbial taxa of keystone species and enzyme activities. Sci. Total Environ. 2023, 874, 162463. [Google Scholar] [CrossRef]
  11. Zhang, N.; Wan, S.; Guo, J.; Han, G.; Gutknecht, J.; Schmid, B.; Yu, L.; Liu, W.; Bi, J.; Wang, Z.; et al. Precipitation modifies the effects of warming and nitrogen addition on soil microbial communities in northern Chinese grasslands. Soil Biol. Biochem. 2015, 89, 12–23. [Google Scholar] [CrossRef]
  12. Tian, J.; Wei, K.; Condron, L.M.; Chen, Z.; Xu, Z.; Feng, J.; Chen, L. Effects of elevated nitrogen and precipitation on soil organic nitrogen fractions and nitrogen-mineralizing enzymes in semi-arid steppe and abandoned cropland. Plant Soil 2017, 417, 217–229. [Google Scholar] [CrossRef]
  13. Li, Y.; Feng, H.; Chen, J.; Lu, J.; Wu, W.; Liu, X.; Li, C.; Dong, Q.; Siddique, K.H.M. Biochar incorporation increases winter wheat (Triticum aestivum L.) production with significantly improving soil enzyme activities at jointing stage. CATENA 2022, 211, 105979. [Google Scholar] [CrossRef]
  14. Li, J.; Shao, X.; Huang, D.; Liu, K.; Shang, J.; Zhang, Q.; Zhao, T.; Yang, X. Short-term biochar effect on soil physicochemical and microbiological properties of a degraded alpine grassland. Pedosphere 2022, 32, 426–437. [Google Scholar] [CrossRef]
  15. Wang, D.; Lan, Y.; Chen, W.; Liu, Z.; Gao, J.; Cao, D.; Wang, Q.; Ma, C.; An, X. Response of bacterial communities, enzyme activities and dynamic changes of soil organic nitrogen fractions to six-year different application levels of biochar retention in Northeast China. Soil Tillage Res. 2024, 240, 106097. [Google Scholar] [CrossRef]
  16. Singh, Y.V.; Joshi, N.L.; Singh, D.V.; Saxena, A. Response of Chili to Water and Nitrogen under Drip and Check-basin Methods of Irrigation. Ann. Arid. Zone 1999, 38, 9–13. [Google Scholar]
  17. Sekhon, K.S.; Singh, J.P.; Mehla, D.S. Long-term effect of manure and mineral fertilizer application on the distribution of organic nitrogen fractions in soil under a rice–wheat cropping system. Arch. Agron. Soil Sci. 2011, 7, 705–714. [Google Scholar] [CrossRef]
  18. Ma, L.; Li, R.; Luan, H.; Tang, J.; Wang, L.; Huang, S. Temperature Matters More than Fertilization for Straw Decomposition in the Soil of Greenhouse Vegetable Field. Agronomy 2024, 14, 233. [Google Scholar] [CrossRef]
  19. Lin, X.; Zhang, G.; Wang, Z.; Han, Q.; Leng, P. Phosphatase activities and available nutrients in soil aggregates affected by straw returning to a calcareous soil under the maize–wheat cropping system. Front. Environ. Sci. 2023, 11, 1208323. [Google Scholar] [CrossRef]
  20. Wang, L.; Zhou, Y.; Sun, X.; Wu, S.; Xia, L.; Sun, J.; Zha, Y.; Yang, P. Retrieval of chromium and mercury concentrations in agricultural soils: Using spectral information, environmental covariates, or a fusion of both? Ecol. Indic. 2024, 167, 112594. [Google Scholar] [CrossRef]
  21. Wang, X.; Shi, Y.; Guo, Z.; Zhang, Y.; Yu, Z. Water use and soil nitrate nitrogen changes under supplemental irrigation with nitrogen application rate in wheat field. Field Crops Res. 2015, 183, 117–125. [Google Scholar] [CrossRef]
  22. Ding, W.; Zhang, G.; Yi, X.; Kang, J.; Zhang, J.; Li, G.; Zhang, J.; Chang, N.; Li, H. Improving potential of reactive nitrogen and carbon footprint of intensified greenhouse cucumber-tomato production with optimized drip irrigation with nitrogen reduction strategies. J. Clean. Prod. 2023, 424, 138898. [Google Scholar] [CrossRef]
  23. Chen, Y.; Zhang, J.; Xu, X.; Qu, H.; Hou, M.; Zhou, K.; Jiao, X.; Sui, Y. Effects of different irrigation and fertilization practices on nitrogen leaching in facility vegetable production in northeastern China. Agric. Water Manag. 2018, 210, 165–170. [Google Scholar] [CrossRef]
  24. Ashraf, M.Y.; Akhtar, K.; Sarwar, G.R.; Ashraf, M.Y. Role of the rooting system in salt tolerance potential of different guar accessions. Agron. Sustain. Dev. 2005, 25, 243–249. [Google Scholar] [CrossRef]
  25. Dietz, K.J.; Zörb, C.; Geilfus, C.M. Drought and crop yield. Plant Biol. 2021, 23, 881–893. [Google Scholar] [CrossRef]
  26. Gao, Q.; Li, H.; Zhang, J.; Zhang, Z.; Zhu, P.; Gao, Q.; Lu, W. Response of Organic Nitrogen in Black Soil to Long-term Different Fertilization and Tillage Practices in Northeast China. Soil Water Res. 2016, 11, 124–130. [Google Scholar]
  27. Zhang, H.; Zhang, Y.; Yan, C.; Liu, E.; Chen, B. Soil nitrogen and its fractions between long-term conventional and no-tillage systems with straw retention in dryland farming in northern China. Geoderma 2016, 269, 138–144. [Google Scholar] [CrossRef]
  28. Wang, J.; Zhuang, S.; Zhu, Z. Soil organic nitrogen composition and mineralization of paddy soils in a cultivation chrono sequence in China. J. Soils Sediments 2017, 17, 1588–1598. [Google Scholar] [CrossRef]
  29. Zhang, Y.; Xu, W.; Duan, P.; Cong, Y.; An, T.; Yu, N.; Zou, H.; Dang, X.; An, J.; Fan, Q.; et al. Evaluation and simulation of nitrogen mineralization of paddy soils in Mollisols area of Northeast China under waterlogged incubation. PLoS ONE 2017, 12, e171022. [Google Scholar] [CrossRef]
  30. Braos, L.B.; Carlos, R.S.; Kuhnen, F.; Ferreira, M.E.; Mulvaney, R.L.; Khan, S.A.; Cruz, M.C.P.D. Predicting Soil Nitrogen Availability for Maize Production in Brazil. Nitrogen 2022, 3, 555–568. [Google Scholar] [CrossRef]
  31. Nielsen, U.N.; Ball, B.A. Impacts of altered precipitation regimes on soil communities and biogeochemistry in arid and semi-arid ecosystems. Glob. Change Biol. 2015, 21, 1407–1421. [Google Scholar] [CrossRef]
  32. Schulten, H.R.; Schnitzer, M. The chemistry of soil organic nitrogen: A review. Biol. Fertil. Soils 1997, 26, 1–15. [Google Scholar] [CrossRef]
  33. González-Prieto, S.J.; Jocteur-Monrozier, L.; Hétier, J.M.; Carballas, T. Changes in the soil organic N fractions of a tropical Alfisol fertilized with 15N-urea and cropped to maize or pasture. Plant Soil 1997, 195, 151–160. [Google Scholar] [CrossRef]
  34. Zhang, Q.; Wang, G.; Xie, W. Soil Organic N Forms and N Supply as Affected by Fertilization Under Intensive Rice Cropping System1 1Project supported by the International Fertilizer Industry Association (IFI), France; the Potast & Phosphate Institute (PPI), USA and Canada; and the International Potassium Institute (IPI), Switzerland. Pedosphere 2006, 16, 345–353. [Google Scholar]
  35. Yawei, Y.; Jianxin, L.; Zhibiao, O. The Characteristics and the Relationships Between Humus Compounds and Organic Nitrogen Compounds in Different Altitude Soil of Zhangjiajie Tobacco Planting Area. Chin. Agric. Sci. Bull. 2014, 13, 269–273. [Google Scholar]
  36. Li, Z.; Liu, M.; Wu, X.; Han, F.; Zhang, T. Effects of long-term chemical fertilization and organic amendments on dynamics of soil organic C and total N in paddy soil derived from barren land in subtropical China. Soil Tillage Res. 2010, 106, 268–274. [Google Scholar] [CrossRef]
  37. Ji, J.; Zhang, Y.; Huang, Y.; Yu, N.; Zhang, Y. Effect of Different Irrigation Methods on Forms and Profile Distribution of Soil Organic Nitrogen in Protected Field. J. Soil Water Conserv. 2007, 21, 99–104. [Google Scholar]
  38. Jiao, Y.; Qi, P.; Wang, X.; Wu, J.; Yao, Y.; Cai, L.; Zhang, R. Effects of Different Nitrogen Application Rates on Soil Organic Nitrogen Components and Enzyme Activities in Farmland. Sci. Agric. Sin. 2020, 53, 2423–2434. [Google Scholar]
  39. Prado, M.; Ramos, F.; Weber, O.; Muller, C. Organic carbon and total nitrogen in the densimetric fractions of organic matter under different soil management. Rev. Caatinga 2016, 29, 263–273. [Google Scholar] [CrossRef]
  40. Shahid, M.; Nayak, A.K.; Puree, C.; Tripathi, R.; Lal, B.; Gautam, P.; Bhattacharyya, P.; Mohanty, S.; Kumar, A.; Panda, B.B.; et al. Carbon and nitrogen fractions and stocks under 41 years of chemical and organic fertilization in a sub-humid tropical rice soil. Soil Tillage Res. 2017, 170, 136–146. [Google Scholar] [CrossRef]
  41. Hurisso, T.T.; Norton, J.B.; Mukhwana, E.J.; Norton, U. Soil Organic Carbon and Nitrogen Fractions and Sugar Beet Sucrose Yield in Furrow-Irrigated Agroecosystems. Soil Sci. Soc. Am. J. 2015, 79, 876–888. [Google Scholar] [CrossRef]
  42. Liu, M.; Ussiri DA, N.; Lal, R. Soil Organic Carbon and Nitrogen Fractions under Different Land Uses and Tillage Practices. Commun. Soil Sci. Plant Anal. 2016, 47, 1528–1541. [Google Scholar] [CrossRef]
  43. Lü, H.; He, H.; Zhao, J.; Zhang, W.; Xie, H.; Hu, G.; Liu, X.; Zhang, X. Dynamics of fertilizer-derived organic nitrogen fractions in an arable soil during a growing season. Plant Soil 2013, 373, 595–607. [Google Scholar] [CrossRef]
  44. Näsholm, T.; Kielland, K.; Ganeteg, U. Uptake of organic nitrogen by plants. New Phytol. 2009, 182, 31–48. [Google Scholar] [CrossRef] [PubMed]
  45. Mishra, S.; Di, H.J.; Cameron, K.C.; Monaghan, R.; Carran, A. Gross nitrogen mineralisation rates in pastural soils and their relationships with organic nitrogen fractions, microbial biomass and protease activity under glasshouse conditions. Biol. Fertil. Soils 2005, 42, 45–53. [Google Scholar] [CrossRef]
  46. Nannipieri, P.; Eldor, P. The chemical and functional characterization of soil N and its biotic components. Soil Biol. Biochem. 2009, 41, 2357–2369. [Google Scholar] [CrossRef]
  47. Zhang, M.; Wang, C.; Luo, S.; Xia, Y.; Xu, Q.; Yang, L.; Yue, K.; Fan, Y. Influences of nitrogen fertilization on soil organic nitrogen 587 components in agroecosystems: A meta-analysis. Acta Ecol. Sin. 2025, 45, 1–11. [Google Scholar]
  48. Li, X.; Liu, F.; Li, G.; Lin, Q.; Jensen, C.R. Soil microbial response, water and nitrogen use by tomato under different irrigation regimes. Agric. Water Manag. 2010, 98, 414–418. [Google Scholar] [CrossRef]
  49. Zhang, J.; Cao, Z.; Dai, H.; Zhang, Z.; Miao, M. Yield, nitrogen uptake and nitrogen leaching of sensor-based fertigation-cultured tomato in a shallow groundwater region: Effect of shallow groundwater on tomato irrigation. J. Agric. Sci. 2020, 12, 10. [Google Scholar] [CrossRef]
  50. Lv, H.; Zhao, Y.; Wang, Y.; Wan, L.; Wang, J.; Butterbach-Bahl, K.; Lin, S. Conventional flooding irrigation and over fertilization drives soil pH decrease not only in the top-but also in subsoil layers in solar greenhouse vegetable production systems. Geoderma 2020, 363, 114156. [Google Scholar] [CrossRef]
  51. Li, Y.; Sun, Y.; Liao, S.; Zou, G.; Zhao, T.; Chen, Y.; Yang, J.; Zhang, L. Effects of two slow-release nitrogen fertilizers and irrigation on yield, quality, and water- fertilizer productivity of greenhouse tomato. Agric. Water Manag. 2017, 186, 139–146. [Google Scholar] [CrossRef]
  52. Song, Z.; Li, X.; Li, J.; Lin, Z.; Zhao, B. Long-term effects of mineral versus organic fertilizers on soil labile nitrogen fractions and soil enzyme activities in agricultural soil. J. Plant Nutr. Fertil. 2014, 20, 525–533. [Google Scholar]
Figure 1. TN (a), SOC (b), C/N (c), NO3-N (d), pH (e), and EC (f) under various irrigation and N application rates in 2017, 2019, 2021, and 2023. Different lowercase letters mean significant differences among treatments in the same year, and different uppercase letters mean significant differences among different years of the same treatment (p < 0.05). Vertical bars represent standard error of mean. DN0: no chemical N application with drip irrigation; DN1: 50% N of FP with drip irrigation; DN2: 75% N of FP with drip irrigation. TN: soil total N; SOC: soil organic carbon; C/N: the ratio of soil organic C to soil total N; NO3-N: nitrate nitrogen; pH: soil pH; EC: soil electrical conductivity.
Agriculture 14 02319 g001
Figure 2. AN content (a), AAN content (b), ASN content (c), UN content (d), AHN content (e), and NHN content (f) under various irrigation and N application rates in 2017, 2019, 2021, and 2023. Different lowercase letters mean significant differences among treatments in the same year, and different uppercase letters mean significant differences among different years of the same treatment (p < 0.05). Vertical bars represent standard error of mean. DN0: no chemical N application with drip irrigation; DN1: 50% N of FP with drip irrigation; DN2: 75% N of FP with drip irrigation. AN: ammonium N; AAN: amino acid N; ASN: amino sugar N; UN: hydrolyzable unknown N; AHN: acid hydrolyzed N; NHN: non-hydrolyzable N.
Agriculture 14 02319 g002
Figure 3. Percentage of soil organic N fraction contents in TN in (a) 2017, (b) 2019, (c) 2021, and (d) 2023 under various irrigation and N application rates. AN: ammonium N; AAN: amino acid N; ASN: amino sugar N; UN: hydrolyzable unknown N; NHN: non-hydrolyzable N. DN0: no chemical N application with drip irrigation; DN1: 50% N of FP with drip irrigation; DN2: 75% N of FP with drip irrigation.
Agriculture 14 02319 g003
Figure 4. The relative importance drivers of AN (a), AAN (b), UN (c), ASN (d), AHN (e), and NHN (f). The vertical bars represent 95% confidence intervals. SOC: soil organic carbon; TP: soil total phosphorus; EC: soil electrical conductivity; TK: soil total potassium; TDM: total dry biomass; AK: soil available potassium; TY: total yield; NO3-N: nitrate nitrogen; annual WUE: annual water use efficiency.
Agriculture 14 02319 g004
Table 1. Irrigation and fertilizer applications in the experiment.
YearGrowing SeasonCropIrrigation
(mm)
Organic N
(kg N ha−1)
Chemical N
(kg N ha−1)
FurrowDripFPDN0DN1DN2
2017WScucumber3302312713790189.5284.25
AWtomato2521761832560128192
2018WScucumber4112882793710185.5278.25
AWtomato2711892062330116.5174.75
2019WScucumber3652562913590179.5269.25
AWcelery13091712540127190.5
2020WScucumber3462422444060203304.5
AWtomato2631842162230111.5167.25
2021WScucumber3272282593910195.5293.25
AWtomato2161831862530126.5189.75
2022WScucumber3632542344160208312
AWtomato2821981333060153229.5
2023WStomato2401681472920146219
AWtomato2111481542850142.5213.75
Note: WS: winter–spring season; AW: autumn–winter season. FP: high chemical N application with furrow irrigation; DN0: no chemical N application with drip irrigation; DN1: 50% N of FP with drip irrigation; DN2: 75% N of FP with drip irrigation.
Table 2. The dry biomass, yield, and water use efficiency (WUE) under the different rates of irrigation and N.
YearCropIndexTreatments
FPDN0DN1DN2
2017cucumberDry biomass (t ha−1)12.04 ± 0.12 a8.22 ± 0.17 d10.7 ± 0.27 b9.57 ± 0.4 c
Yield (t ha−1)179.78 ± 0.54 a126.02 ± 0.32 d167.01 ± 1.08 b157.87 ± 0.71 c
WUE (kg m−3)54.48 ± 0.16 c54.55 ± 0.14 c72.3 ± 0.47 a68.34 ± 0.31 b
tomatoDry biomass (t ha−1)9.95 ± 0.33 a6.65 ± 0.17 c8.78 ± 0.27 b7.73 ± 0.2 b
Yield (t ha−1)86.51 ± 1.64 a70.32 ± 1.86 c79.87 ± 0.34 b71.46 ± 0.19 c
WUE (kg m−3)34.33 ± 0.65 c39.95 ± 1.05 b45.38 ± 0.2 a40.6 ± 0.11 b
totalDry biomass (t ha−1)21.98 ± 0.38 a14.87 ± 0.06 d19.49 ± 0.53 b17.3 ± 0.58 c
Yield (t ha−1)266.28 ± 1.82 a196.34 ± 1.98 d246.88 ± 1.29 b229.33 ± 0.52 c
Annual WUE (kg m−3)45.75 ± 0.31 d48.24 ± 0.49 c60.66 ± 0.32 a56.35 ± 0.13 b
2019cucumberDry biomass (t ha−1)10.24 ± 0.4 a7.46 ± 0.42 c7.58 ± 0.37 c8.76 ± 0.14 b
Yield (t ha−1)113.03 ± 2.37 a88.43 ± 2.55 c81.46 ± 2.06 c95.78 ± 0.28 b
WUE (kg m−3)30.97 ± 0.65 b34.54 ± 1 b31.82 ± 0.8 b37.41 ± 0.11 a
celeryDry biomass (t ha−1)5.27 ± 0.28 a4.1 ± 0.04 b5.18 ± 0.14 a4.3 ± 0.08 b
Yield (t ha−1)89.03 ± 0.51 c86.43 ± 0.31 d106.53 ± 1.78 a96.23 ± 1.1 b
WUE (kg m−3)68.48 ± 0.39 d94.97 ± 0.34 c117.06 ± 1.96 a105.74 ± 1.21 b
totalDry biomass (t ha−1)15.51 ± 0.42 a11.56 ± 0.39 c12.76 ± 0.24 b13.06 ± 0.06 b
Yield (t ha−1)202.06 ± 1.89 a174.86 ± 2.78 b187.99 ± 1.89 c192.01 ± 1.22 b
Annual WUE (kg m−3)40.82 ± 0.38 d50.39 ± 0.8 c54.18 ± 0.55 b55.33 ± 0.35 a
2021cucumberDry biomass (t ha−1)12.63 ± 0.28 a10.79 ± 0.2 b11.66 ± 0.39 a10.36 ± 0.31 b
Yield (t ha−1)168.27 ± 0.25 a136.37 ± 2.71 c148.06 ± 4.81 b146.37 ± 2.71 b
WUE (kg m−3)51.46 ± 0.08 c59.81 ± 1.19 b64.94 ± 2.11 a64.2 ± 1.19 a
tomatoDry biomass (t ha−1)7.57 ± 0.11 b7.75 ± 0.17 b7.7 ± 0.06 ab8.17 ± 0.15 a
Yield (t ha−1)85.04 ± 0.64 a72.99 ± 1.05 c77.54 ± 1.55 b77.75 ± 1.85 b
WUE (kg m−3)32.58 ± 0.25 c39.89 ± 0.57 b42.37 ± 0.85 a42.48 ± 1.01 a
totalDry biomass (t ha−1)20.2 ± 0.37 a18.54 ± 0.36 b19.37 ± 0.33 a18.53 ± 0.42 b
Yield (t ha−1)253.31 ± 0.4 a209.36 ± 2.11 c225.6 ± 6.36 b224.12 ± 4.54 b
Annual WUE (kg m−3)46.65 ± 0.07 c50.94 ± 0.51 b54.89 ± 1.55 a54.53 ± 1.1 a
2023tomatoDry biomass (t ha−1)14.44 ± 0.54 a12.05 ± 0.36 b14.14 ± 0.85 a12.93 ± 0.31 b
Yield (t ha−1)133.24 ± 0.63 b111.75 ± 2.64 c139.5 ± 0.28 a139.1 ± 1.72 a
WUE (kg m−3)55.52 ± 0.26 c66.52 ± 1.57 b83.04 ± 0.17 a82.8 ± 1.02 a
tomatoDry biomass (t ha−1)7.49 ± 0.5 b5.33 ± 0.41 c7 ± 0.29 ab6.22 ± 0.26 bc
Yield (t ha−1)63.09 ± 0.88 a46.14 ± 0.23 c58.49 ± 1.42 b56.14 ± 0.98 b
WUE (kg m−3)29.9 ± 0.42 c31.18 ± 0.15 b39.52 ± 0.96 a37.93 ± 0.66 a
totalDry biomass (t ha−1)21.93 ± 1.03 a17.38 ± 0.76 b21.14 ± 0.58 a19.15 ± 0.47 b
Yield (t ha−1)196.34 ± 1.49 a157.89 ± 2.55 b197.99 ± 1.56 a195.25 ± 2.65 a
Annual WUE (kg m−3)43.53 ± 0.33 c49.97 ± 0.81 b62.66 ± 0.49 a61.79 ± 0.84 a
Note: Values followed by different lowercase letters across the rows mean significant differences among treatments in the same year for each index (p < 0.05). WUE: water use efficiency; FP: high chemical N application with furrow irrigation; DN0: no chemical N application with drip irrigation; DN1: 50% N of FP with drip irrigation; DN2: 75% N of FP with drip irrigation.
Table 3. Correlation analysis of soil organic N fractions, soil properties, TDM, TY, and annual WUE.
n = 48TNSOCC/NNO3-NpHECTPAPTKAKTDWTYAnnual
WUE
AN0.95 **0.91 **0.71 **0.270.30 *0.69 **0.81 **0.78 **−0.020.59 **0.19−0.280.22
ASN−0.16−0.12−0.010.13−0.18−0.07−0.060.040.06−0.07−0.280.050.44 *
AAN−0.5 **−0.6 **−0.6 **−0.29 *−0.55 **−0.12−0.62 **−0.37 **0.23−0.52 **−0.6 **0.15−0.12
UN0.89 **0.92 **0.79 **0.47 **0.45 **0.43 **0.78 **0.64 **0.150.5 **0.54 **−0.120.14
NHN0.93 **0.82 **0.56 **0.40 **0.38 **0.58 **0.71 **0.88 **−0.120.56 **0.06−0.320.22
AHN0.96 **0.95 **0.78 **0.40 **0.36 *0.6 **0.82 **0.75 **0.060.55 **0.34 *−0.200.22
Note: TN: soil total N; SOC: soil organic carbon; C/N: the ratio of soil organic C and soil total N; NO3-N: nitrate nitrogen; pH: soil pH; EC: soil electrical conductivity; TP: soil total phosphorus; AP: soil available phosphorus; TK: soil total potassium; AK: soil available potassium; TDM: total dry biomass; TY: total yield; annual WUE: annual water use efficiency. * or ** = significant at the 0.05 or 0.01 probability level.
Disclaimer/Publisher’s Note: The statements, opinions and data contained in all publications are solely those of the individual author(s) and contributor(s) and not of MDPI and/or the editor(s). MDPI and/or the editor(s) disclaim responsibility for any injury to people or property resulting from any ideas, methods, instructions or products referred to in the content.

