Abstract
This study was conducted to investigate the drying kinetics and internal and external mass transfer characteristics of walnuts for an understanding of the drying mechanism. The drying characteristics, mass transfer characteristics, and color of walnut during hot air drying (HAD) were investigated under different initial moisture content (IMC) (0.35, 0.39, and 0.43 g water/g wet mass) and drying temperatures (50, 60, 70, and 80 °C). The results indicated that the IMC and drying temperature both have significant effects on the drying process of walnut, showing the higher the IMC, the longer the preheating time, the smaller the effective moisture diffusivity (Deff) and mass transfer coefficient (hm), and the longer the drying time, but reverse results for drying temperature. The values of Deff and hm for walnut ranged from 4.94 × 10⁻¹⁰ to 1.44 × 10⁻⁹ m2/s and 1.24 × 10⁻⁷ to 3.90 × 10⁻⁷ m/s, respectively. The values of activation energy for moisture diffusion and mass transfer ranged from 21.56 to 23.35 kJ/mol and 28.92 to 33.43 kJ/mol, respectively. Multivariate linear prediction models were also established for estimating the Deff and hm as a function of the HAD process parameters. The drying temperature has a greater effect on the walnut kernel lightness than the IMC. The Verma et al model could be used to describe the HAD process of the walnut. The findings contribute to the understanding of moisture transfer mechanisms in walnuts and have practical value for the evaluation and improvement of drying systems.
1. Introduction
Walnut has an essential economic and medicinal value due to its high content of unsaturated fatty acids, proteins and amino acids and health benefits [1,2]. Due to the high initial moisture content (IMC) in fresh walnuts, drying is important for the primary processing of walnuts to remove water, avoid microbial spoilage, maintain quality, reduce transportation costs, and increase consumption diversity [3,4]. Over recent decades, drying technology has been increasingly used in the walnut industry. Although different drying technologies such as infrared drying [5], microwave drying [6], vacuum drying [7], radio-frequency drying [7,8,9], intermittent oven drying [10,11], and combined drying [7] have been investigated in a laboratory for efficient drying, hot air drying (HAD) is still predominantly used in industrial production due to limitations in processing ability and running cost [12]. However, HAD usually has low drying efficiency, high energy consumption, and poor quality, which seriously restricts the development of the walnut industry [13,14]. Hence, new walnut HAD methods are demanded for efficient drying, which requires a good understanding of the walnut drying process.
Many studies have been conducted on the HAD of walnuts. Hassan-Beygi et al. investigated the hot air (HA) drying characteristics and effective moisture diffusivity [15]; Zhu et al. studied the effects of HA temperature, loading capacity, and air velocity on the HA drying characteristics of walnuts and determined the optimal combination of process parameters [16]; Chen et al. investigated the effect of walnut structure on the hydration and HA drying characteristics [12]. Most of these studies have successfully explored the drying process of walnuts under the assumption that the IMC of each batch of walnuts is uniform and consistent [7,12,15,16]. However, studies have shown that freshly harvested food and agricultural materials, even under the same environmental conditions, have a significant moisture content (MC) bias [13,17]. The presence of the IMC difference was suspected to affect the change pattern of moisture and the mass transfer characteristics during the walnut drying processes and thus may influence the drying time [13,18,19,20]. Thus, it is necessary to study the influence of the IMC on the change pattern of moisture and the transfer characteristics of the walnuts systematically. In addition, most previous studies have focused on drying characteristics, kinetics, energy consumption, quality and process, and few systematic reports have been made on the internal and external mass transfer characteristics during walnut drying, which is very important for understanding and accurately grasping the drying process of walnuts. The internal and external mass transfer characteristics of food materials are usually significantly affected by their intrinsic properties and drying conditions [5,21,22,23]. Teymori-Omran et al. found a significant correlation between the effective moisture diffusivity (Deff) and mass transfer coefficient (hm) of apple slices and drying temperature and radiation intensity during the combined HA–infrared drying process [24]. Chayjan et al. determined the Deff of squash seeds in a semi fluidized and fluidized bed drying and established two-order polynomial models of air velocities and Deff [25]. Nevertheless, until now, limited documented information is available on the sample IMC—and drying temperature—dependency of Deff and hm in the walnuts under HAD.
Therefore, this paper takes walnuts as the research object, studies the change pattern of moisture and temperature during the HAD process of walnuts, explores the influence of IMC and drying temperature on the drying characteristics, internal and external mass transfer characteristics and color of walnuts, constructs the mathematical model of the Deff and hm related to the IMC and drying temperature, and determines a kinetic model suitable for describing the moisture change pattern of walnuts during the drying process. This study provides (i) an improved understanding of moisture transfer mechanisms during the HAD of walnuts and (ii) a theoretical reference for the improvement of drying technology and the optimization of the operating conditions.
2. Materials and Methods
2.1. Material Preparation
Fresh walnut samples of the Wen-185 variety were provided by the Woodland, Wensu County, Aksu, Xinjiang in the 2023 harvest season. All walnut samples were vacuum-packed in 30 plastic bags, each of which weighed 4.50 ± 0.01 kg, and stored in an air-conditioned room at a relative humidity of 60% and a temperature of 21 °C to prevent water loss [26]. The IMC of walnut samples was measured using an HA dryer at 105 ± 1 °C for 24 h, according to Equation (1):
where, W0 was the initial mass of the sample (g); We was the dry mass of the sample (g); IMC was the initial MC of the walnut (g water/g wet mass).
2.2. Drying Experiment
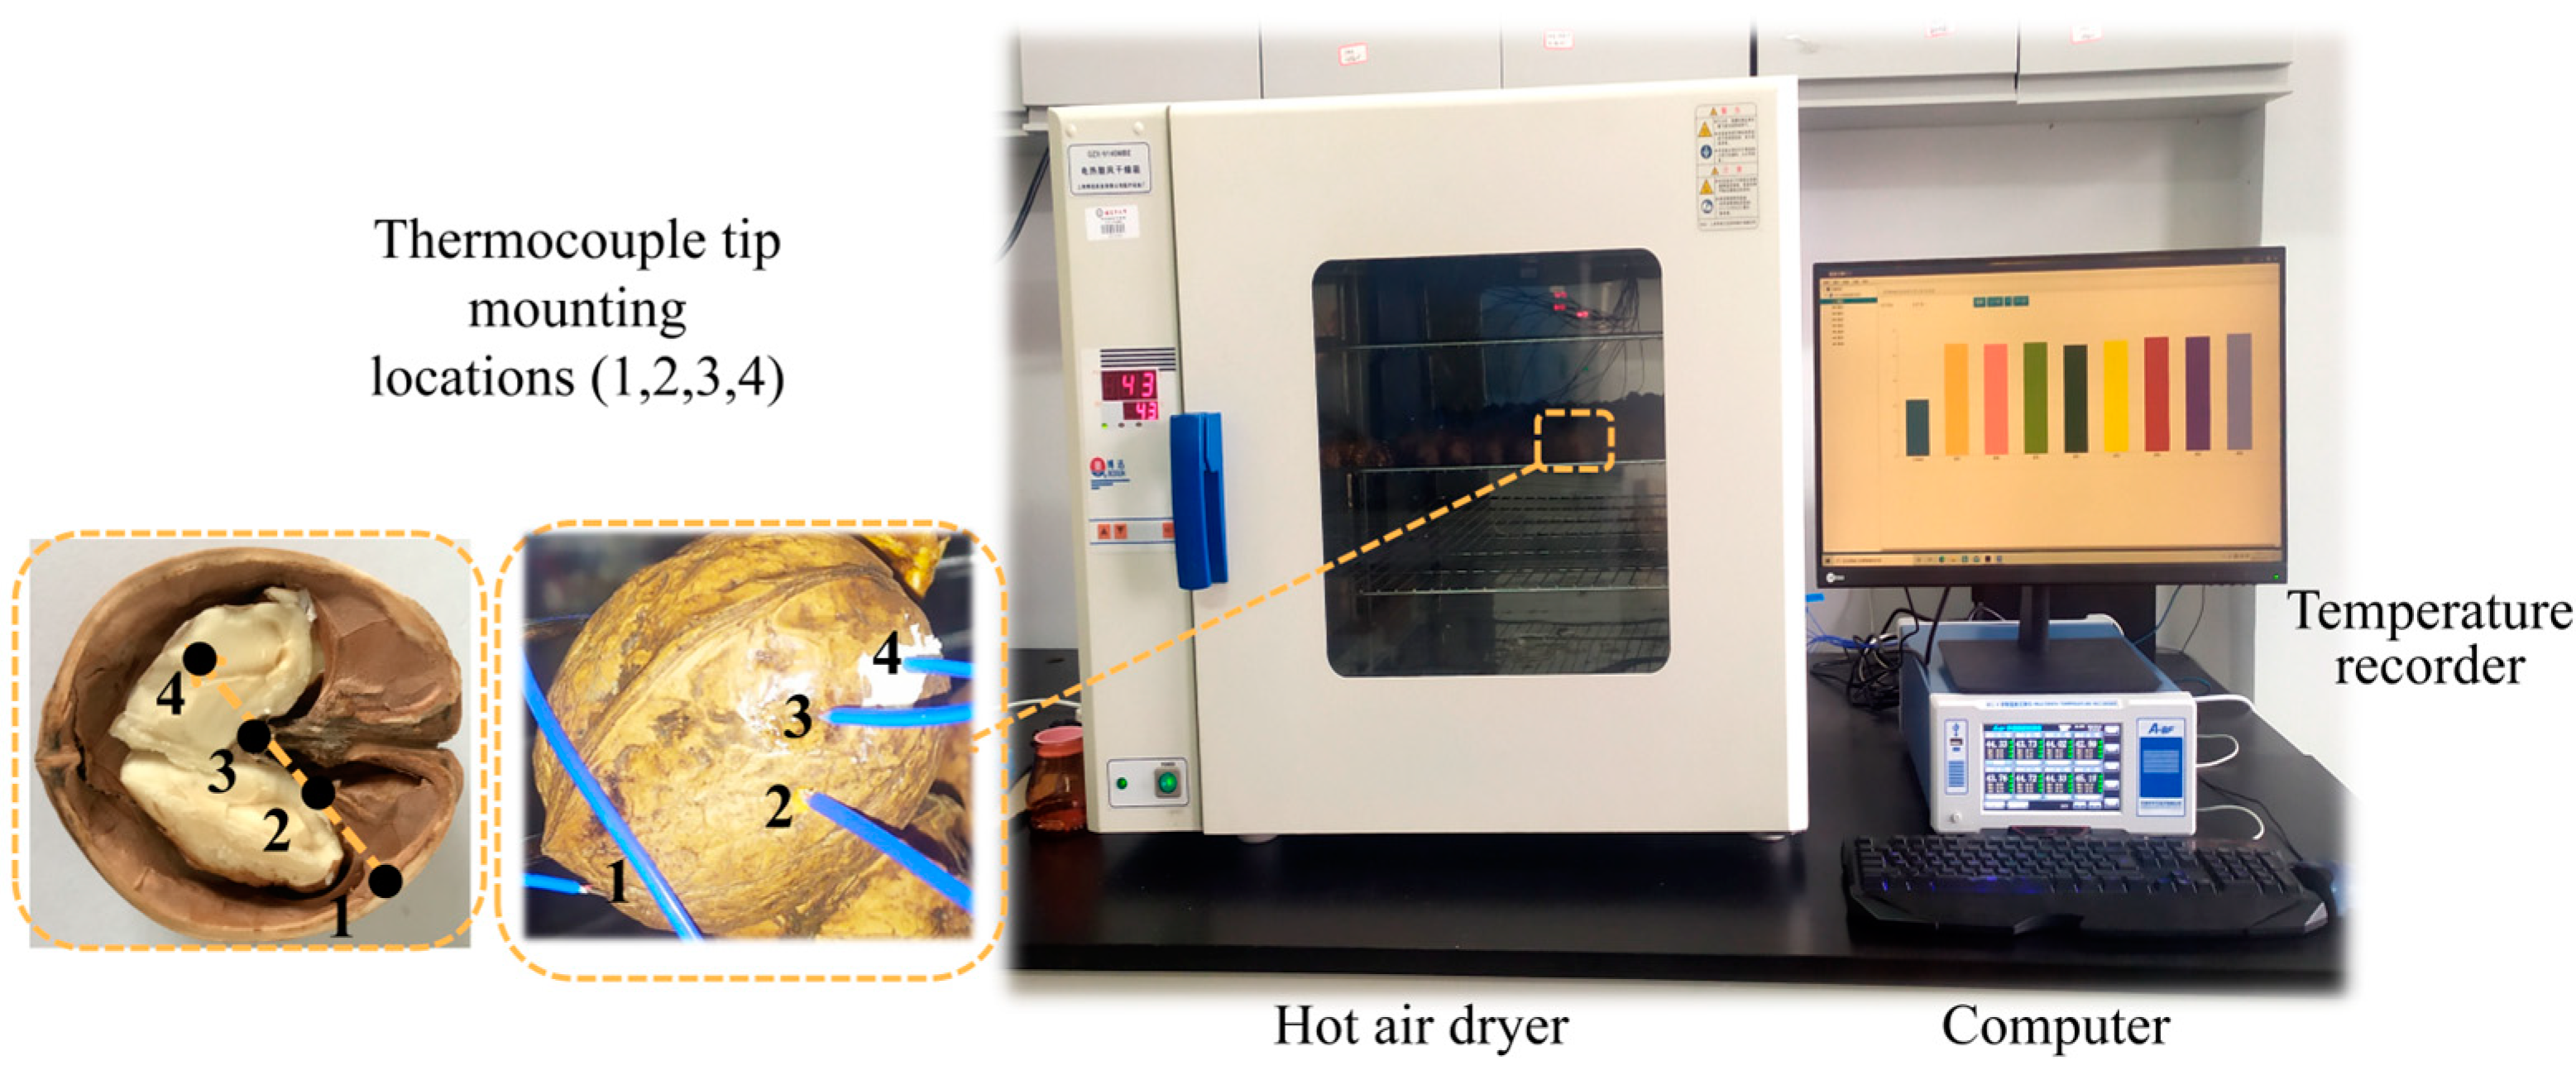
Figure 1 presents a diagram of the HAD apparatus. The experimental apparatus mainly consists of a HA dryer (BoXun, GZX-9140MBE, Shanghai, China) and a temperature recorder (A-BF, BCL3008P, Guangdong, China). K-type thermocouples (Omega, GG-K-36-SLE, Stamford, NY, USA) equipped with the temperature recorder were used to monitor the real-time temperature of the walnut sample. Since walnuts are spherical, solid materials, the temperature at one location cannot represent the overall temperature. Therefore, the temperatures at the four test points were selected for monitoring and recording, and the average of the four test point temperatures was used to characterize the walnut temperature. Specifically, one K-type thermocouple tip (1) was fixed to the surface of the walnut with heat-conducting tape, and the other three K-type thermocouple tips (2, 3, and 4) were inserted into the different positions inside the walnut. The four temperature test points of walnut samples were: surface temperature, upper-middle temperature, middle temperature, and lower-middle temperature (Figure 1).

Figure 1.
Diagram of the HAD apparatus.
During the harvest season, the IMC of the walnuts varied. In this study, the overall range of the walnut IMCS was between 0.35 and 0.43 g water/g wet mass, and this range was divided evenly into 3 groups with 0.04 g water/g wet mass interval to define the impact of walnut IMC on moisture diffusion characteristics. For simplicity, the specific HAD test program for walnuts is given in Table 1.

Table 1.
Program for the HAD tests of the walnut.
The HAD oven was turned on to preheat, and after the system reached thermal equilibrium, samples were quickly placed in the pallets to start the drying test. To track the MC variation of the walnuts during the drying process, we swiftly removed the 30 marked walnuts from the dryer and the weight of each sample was measured on a digital balance (Anting, FA1104, Shanghai, China) and then put back until the end of drying. Note that the sample experimental steps should be completed within 5 s to improve the accuracy of the test results [27]. For all walnut drying tests, three replicates were performed.
2.3. Drying Characteristic Parameters
The moisture ratio of walnut was calculated using Equation (2):
where, M∞ and Mt were the MC at the drying end (g water/g wet mass) and the MC at time t (g water/g wet mass), respectively.
The drying rate of walnut was calculated using Equation (3):
where, DR was the drying rate (g water/g wet mass/min); Mt+Δt was the MC of the walnuts at time t + Δt (g water/g wet mass); Δt is the time difference between t + Δt and the t.
2.4. Effective Moisture Diffusivity
The Deff is the most important key parameter required for the analysis of intrinsic moisture diffusion characteristics during the food material drying process [23,28]. When the drying of rectangular, spherical and other shapes of materials is mainly controlled by the descending drying stage, Fick’s second law can be adopted to analyze the process of moisture diffusion inside the material [29]. Generally, the walnut was viewed as a sphere in the theoretical research due to its relatively high sphericity [30]. Therefore, as per Hassan-Beygi et al., the sphere geometric radius (rg) was derived by measuring the dimension parameters for two hundred walnuts [15].
The Deff of walnut under different drying conditions was calculated based on Fick’s diffusion equation by assuming spherical shape with negligible volumetric shrinkage [5,15]. In order to improve the inaccuracy, as those made in previous studies [5,15,31], the following important assumptions were made:
- (1)
- The moisture diffuses radially from inside to the surface of the particle and evaporates at the surface.
- (2)
- In the beginning, the moisture was evenly distributed throughout the mass of a sphere;
- (3)
- In relation to the center of the sphere, the mass transfer was symmetrical;
- (4)
- Compared to the internal resistance of the walnut sample, the surface mass transfer resistance was negligible.
- (5)
- The Deff was constant.
The general form of Fick’s second law for spherical particles with purely radial diffusion is expressed as:
The initial and the boundary conditions at the surface (r = rg) and at the center of a grain of walnut (r = 0) are:
Crank proposed the analytical solution of this partial differential equation for the one-dimensional moisture transfer in spherical geometry in the way that infinite series [5,32]:
where, n was the number of terms; t was the drying time (s); rg was the geometric radius (m); Deff was the effective moisture diffusivity of the samples (m2·s−1).
For long drying times, the above series converges very rapidly and the first term can be used to approximate the above series with high accuracy, while higher-order terms (n > 1) approach zero as t increases. Hence, ignoring higher-order terms, n = 1, Equation (6) can be simplified to the following form [5,15,31]:
The conversion of Equation (7) can be obtained as follows:
Equation (8) can be further expressed in the form of slope:
2.5. Mass Transfer Coefficient
Mass transfer coefficient (hm) is used to compute the mass transfer rate, and it can be computed with the Biot number (Bi) [5,24]:
where, hm is the mass transfer coefficient (m·s−1); L is the characteristic length (m). L is calculated as the walnut volume divided by the walnut area.
Bi can be calculated with Dincer number (Di) [33]:
Di can be calculated as [34]:
where, V is the flow velocity (m/s); kc is the drying constant (1/s); Me is the equilibrium moisture content (g water/g wet mass).
2.6. Activation Energy
Most researchers in the field of food drying have linked their Deff and hm to the reciprocal of the absolute drying temperature, which usually remains constant during kinetic studies [24,25,35]. This approach can be acceptable when dealing with low MC foods, where the sample temperature quickly attains thermal equilibrium with the drying temperature. Nonetheless, in high MC foods, the sample temperature stays well below the drying temperature for a considerable fraction of the drying time. Therefore, in order to accurately obtain the activation energy of moisture diffusion and mass transfer for foods with high MC, the relationship between the Deff and hm, as well as temperature, must be established with a representative sample temperature value instead of with the drying temperature [35]. In this study, the walnut average temperature was determined from the steady temperature portion of the measured temperature curves. The activation energy for moisture diffusion and mass transfer of walnut were determined from the Arrhenius equation given in Equations (14) and (15) [24,36].
where, D0 and h0 were the pre-exponential factors; R was the universal gas constant (J·mo−1·K−1); T was the sample temperature (K); ED and EH were the activation energies for moisture diffusion and mass transfer, respectively (KJ·mol−1). The equation can be transformed as follows:
2.7. Lightness
The lightness value of walnut kernels was evaluated using a colorimeter (Sanenshi, SC-10, Shenzhen, China) as an indicator of browning.
2.8. Drying Kinetics
Accurately describing and predicting the moisture dissipation of walnuts during HAD is of great significance for the study of the drying characteristics of walnuts [19]. Ten typical mathematical models were selected from the classical drying kinetic models (as shown in Table 2) to fit the walnut drying curves, and the most suitable mathematical model for describing and predicting the change rule of moisture in walnut hot air drying was selected according to the judgment criterion [37]. Note that the OriginPro software 2021 was used to fit parameters in the mathematical model.
Table 2.
Mathematical models considered for describing drying curves.
2.9. Statistical Analysis
The determination coefficient (R2) is the most important indicator for evaluating the fit of the model and is used to indicate the close relationship between the variables. The root mean square error (RMSE) and sum of squared deviations (χ2) reflect the degree of variation between the actual values and the expected values, so that these three criteria can be used to determine the optimal drying kinetic models and judge the models merits [37]. A higher quality of fit was associated with lower RMSE and χ2, and higher R2.
where, MRexp,i, MRpre,i and MRi were experimental MR, predicted MR and the average of the experimental MR, respectively; N and n are the total data and the number of constants, respectively.
3. Results and Discussion
3.1. Drying Characteristics
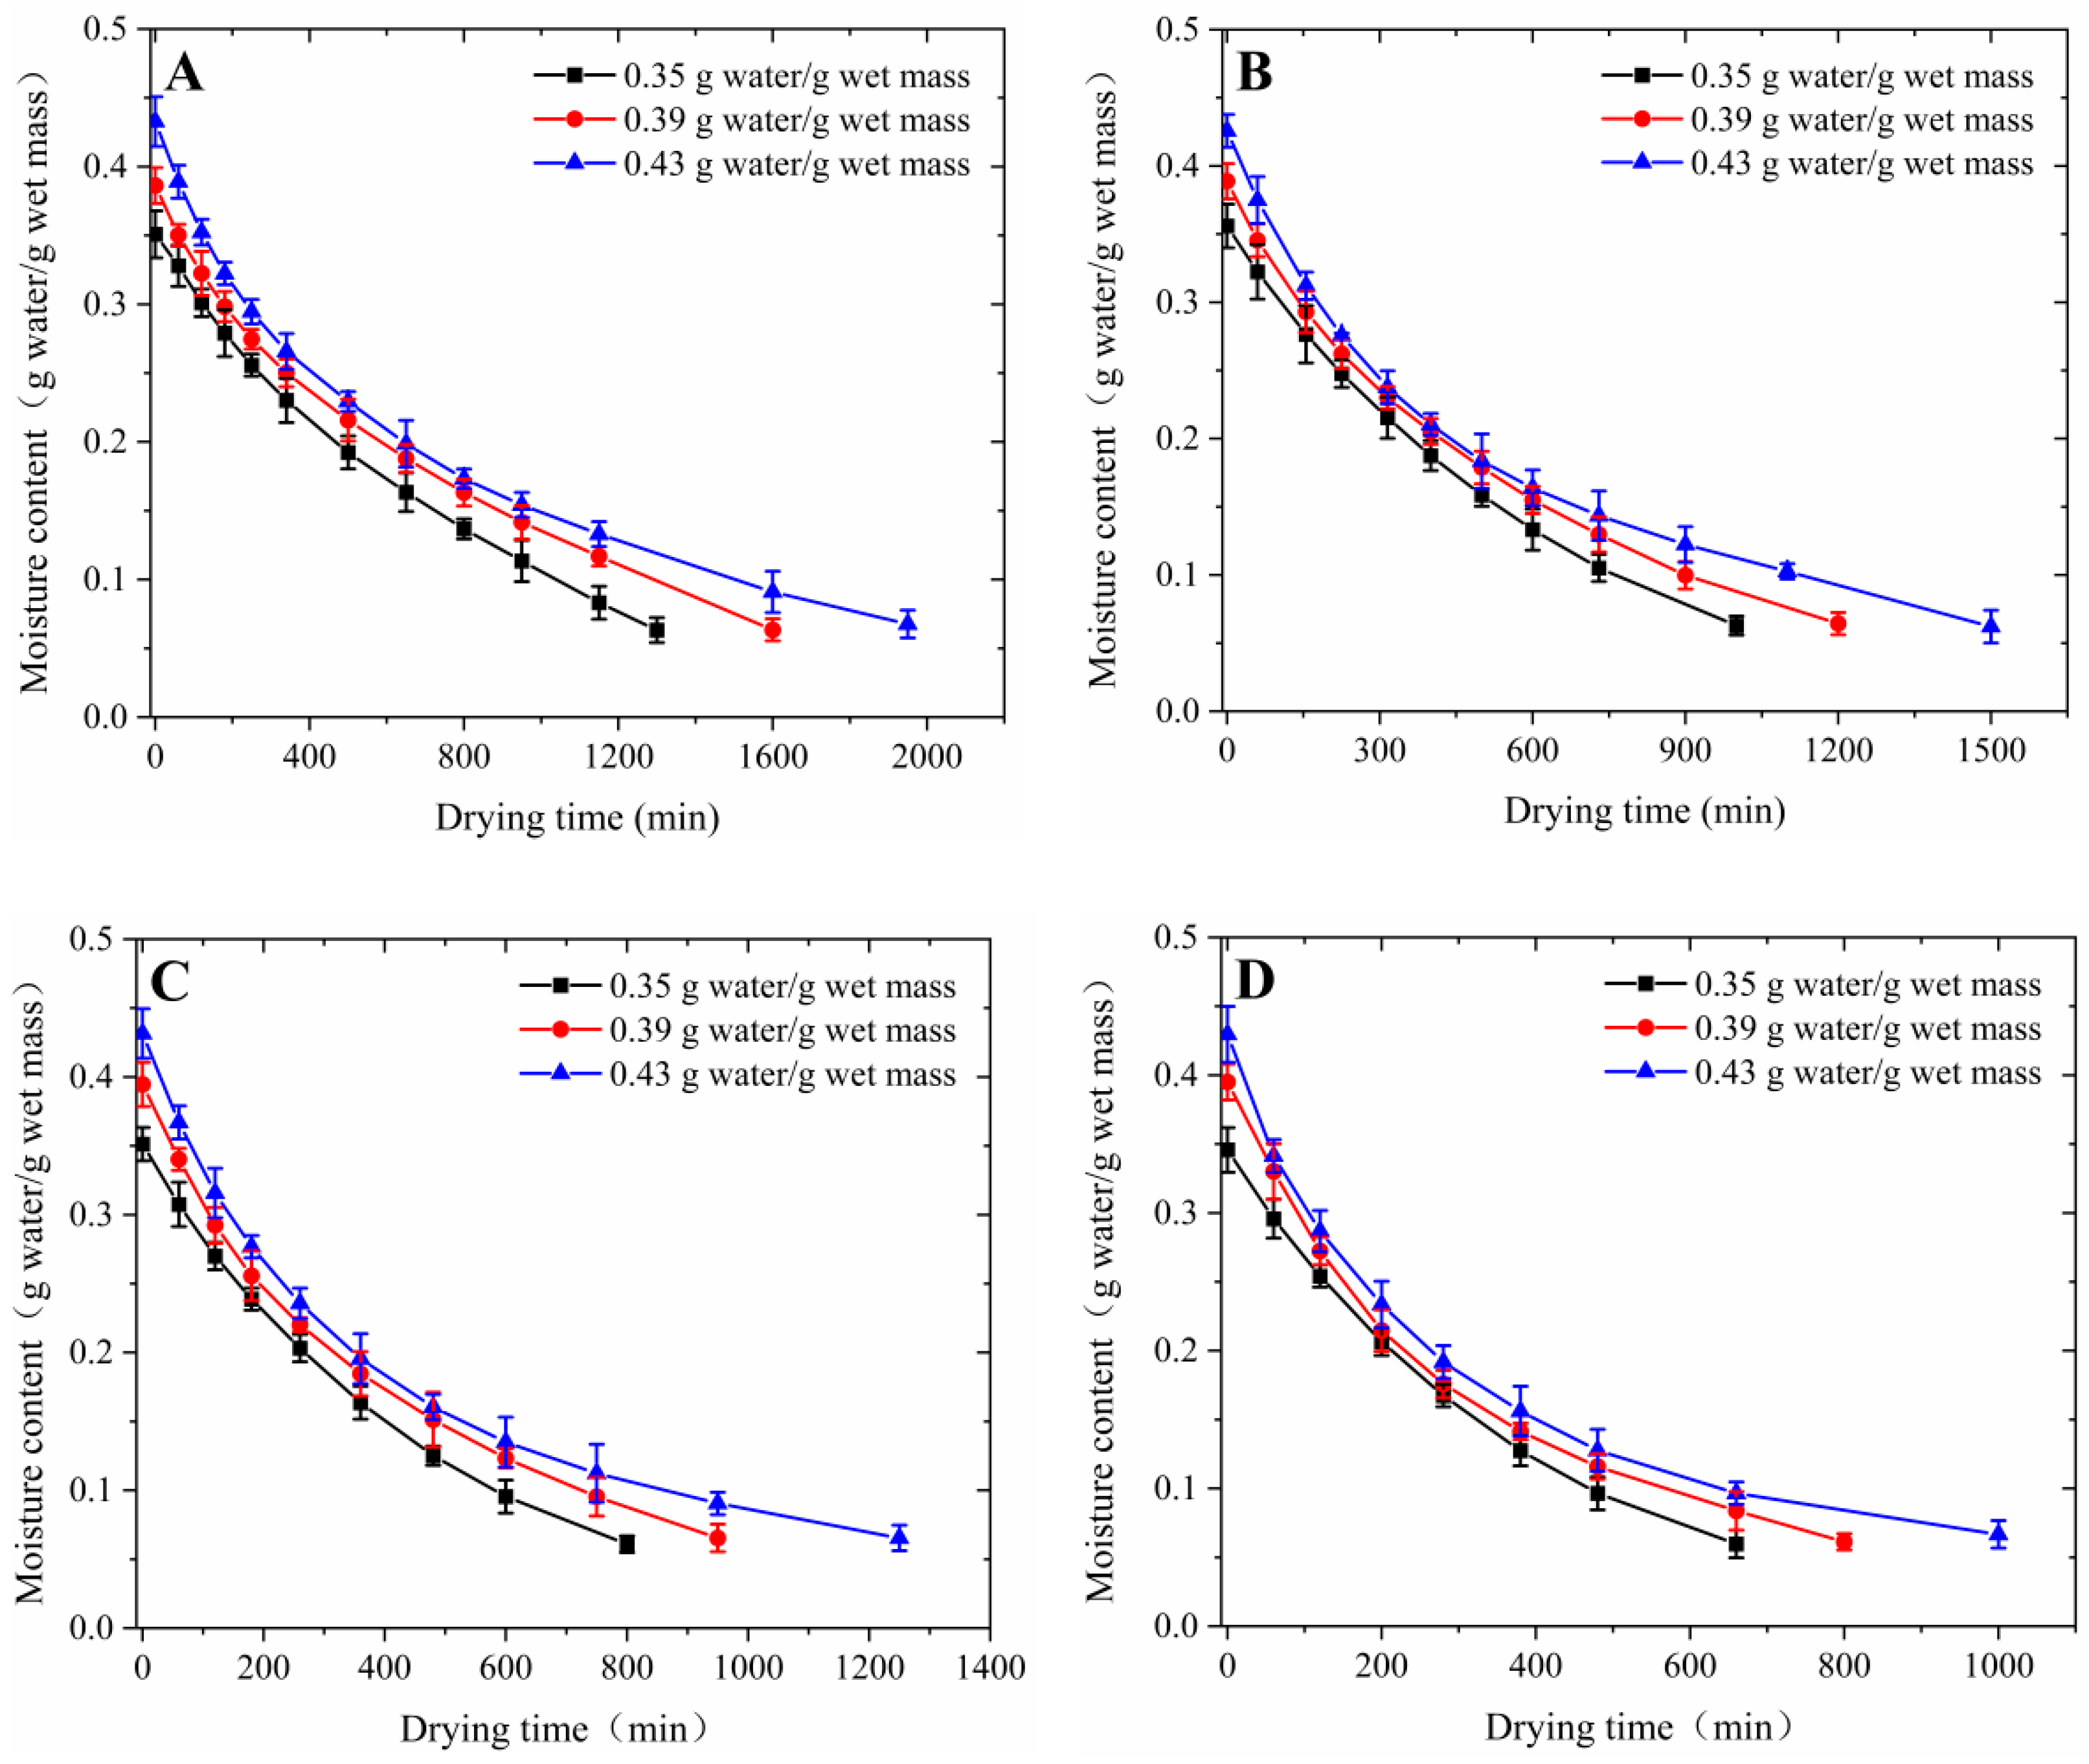
The drying curves of the walnut at different IMCs and drying temperatures are shown in Figure 2. As shown in Figure 2, the MCs of walnuts decreased gradually with the drying time, which was commonly observed for food and agricultural materials [5,21,28,38,39]. It was found that as the IMC was larger, the drying time was substantially longer, and the drying curves were flatter. When the IMC was 0.35, 0.39, and 0.43 g water/g wet mass, the drying time at 50 °C was 1300, 1600, and 1950 min, respectively; the drying time at 60 °C was 1000, 1200, and 1500 min, respectively; the drying time at 70 °C was 800, 950, and 1250 min, respectively; and the drying time at 80 °C was 660, 800, and 1000 min, respectively (Table 3). This is attributed to the different water removal required for walnuts with different IMC [19].

Figure 2.
Drying curves of walnut at different drying conditions (A) 50 °C; (B) 60 °C; (C) 70 °C; (D) 80 °C.
Table 3.
Moisture contents (IMC, MCE), temperatures (Td, TS), drying time (t), and drying rates (DRMAX, DRAVG) of walnuts subjected to HAD.
In addition, it was found that the drying time was significantly reduced with the increase in drying temperature. When the drying temperature increased from 50 °C to 80 °C, the drying time decreased from 1300 min to 660 min for walnuts with an IMC of 0.35 g water/g wet mass, and the drying time decreased by 49.23%; the drying time decreased from 1600 min to 800 min for walnuts with an IMC of 0.39 g water/g wet mass, and the drying time decreased by 50%; and the drying time decreased from 1950 min to 1000 min for walnuts with an IMC of 0.43 g water/g wet mass, and the drying time decreased by 48.72% (Table 3). The results indicated that the drying time was reduced by about 50% when the drying temperature was increased from 50 °C to 80 °C, regardless of the IMC. This may be due to the increased kinetic energy and activity of water molecules in walnuts at high temperatures and the increased rate of water migration [40].
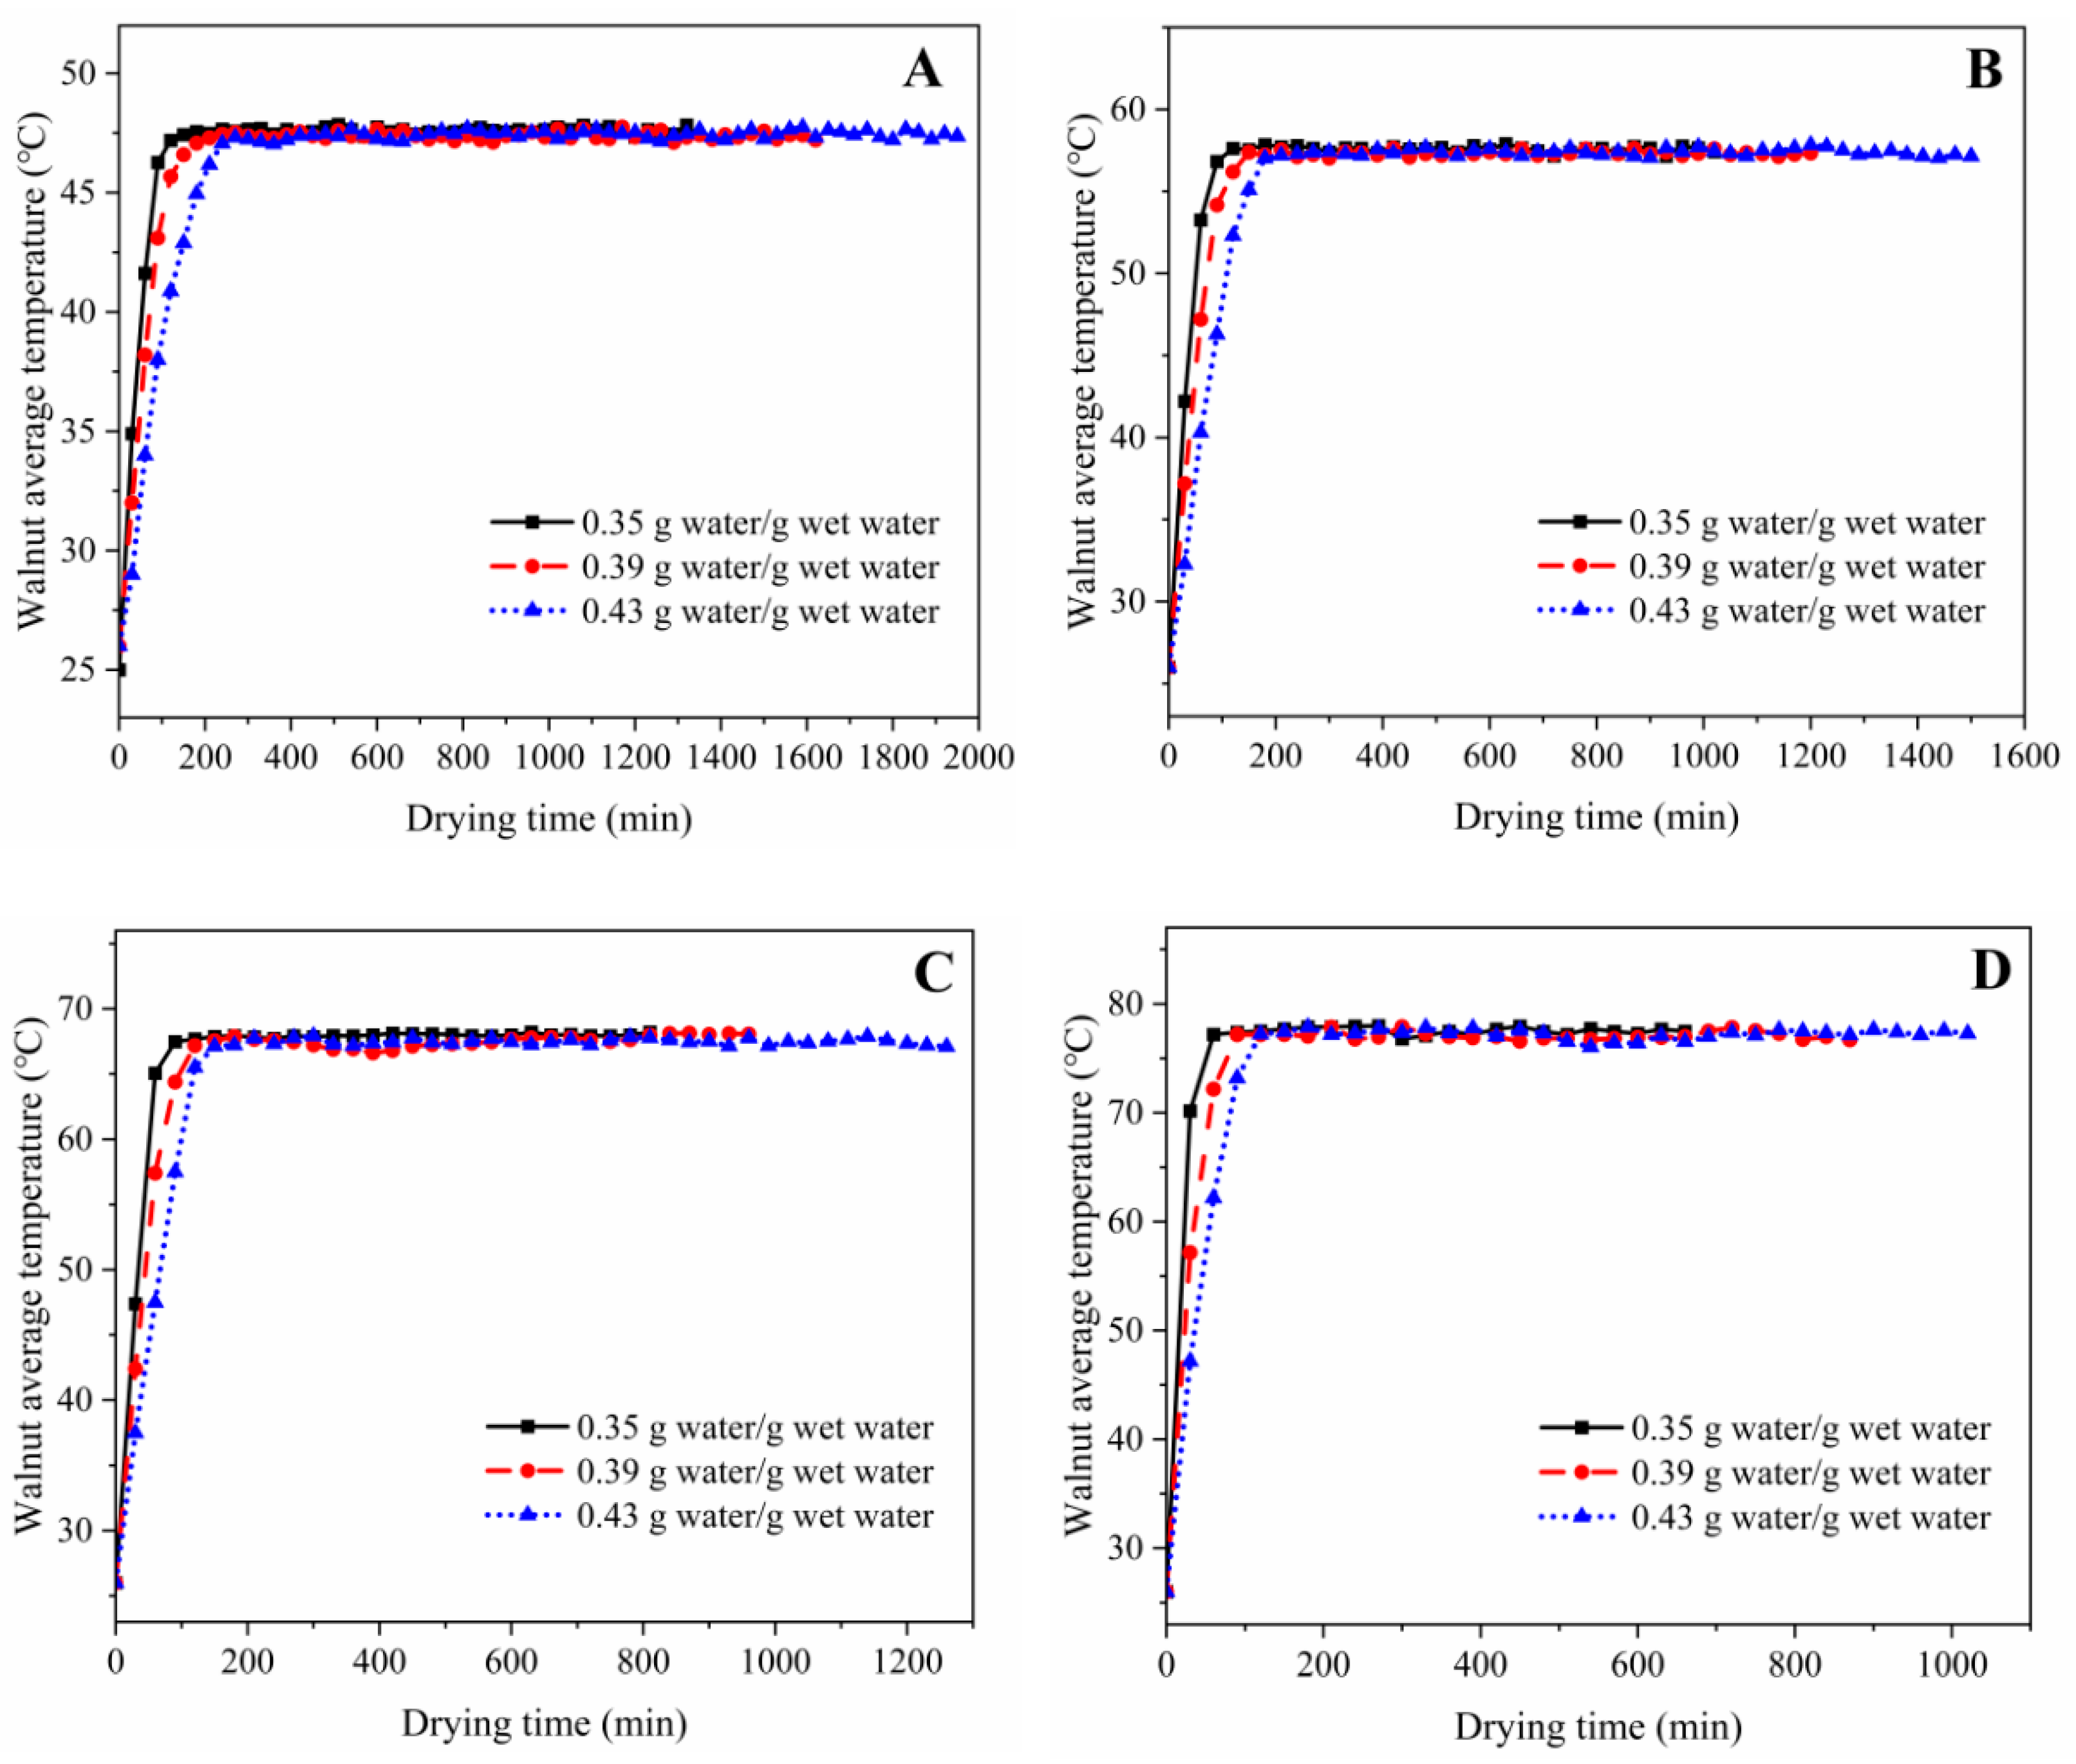
The average temperature curves of the walnut at different IMC and drying temperatures are shown in Figure 3. As shown in Figure 3, the average temperature of walnuts rises continuously with the drying time and maintains a stable value when it rises to a certain value. A hysteresis in the temperature curves was found in Figure 3A–D, as it took a longer time for the preheating of walnuts with high IMC than walnuts with low IMC. This may be due to the fact that the specific heat of water is much higher than the dry mass of walnut, and the higher IMC required more heat energy to evaporate, resulting in a slow increase in the temperature of the walnuts [12]. It was found that the preheating time for walnuts decreased with increasing drying temperatures. This was attributed to the fact that higher temperatures provided more heat energy, thus reducing the preheating time [29]. On the other hand, since the heat energy of the drying medium is transferred from the surface to the interior, the higher temperature resulted in large temperature gradients, thus accelerating the heat transfer [18]. In addition, it was also found that the lag time for temperature changes became shorter as the temperature increased. Therefore, we considered that it should be applied with high temperature treatment at the early stage of drying to improve the heat transfer effect and the drying performance and then enhance the drying rate of walnuts.

Figure 3.
Average temperature curves of walnut at different drying conditions (A) 50 °C; (B) 60 °C; (C) 70 °C; (D) 80 °C.
As can be seen from the temperature curves, the walnut temperature was always lower than the drying temperature during the HAD process. When walnut samples are placed in hot air, theoretically, the walnut temperature and drying temperature should be the same, but due to material moisture evaporation during HAD, the surface temperature is lower than the air temperature. At the same time, moisture evaporation by heat after the HA is properly cooled down during HAD, allowing the HA to reach the walnut surface on the way to heat diffusion. When the HA reaches the walnut center position, the heat diffusion is the most serious, resulting in the center temperature always being the lowest. Similar behavior was observed for the HAD of the almond, where the material temperature was lower than the drying temperature [41].
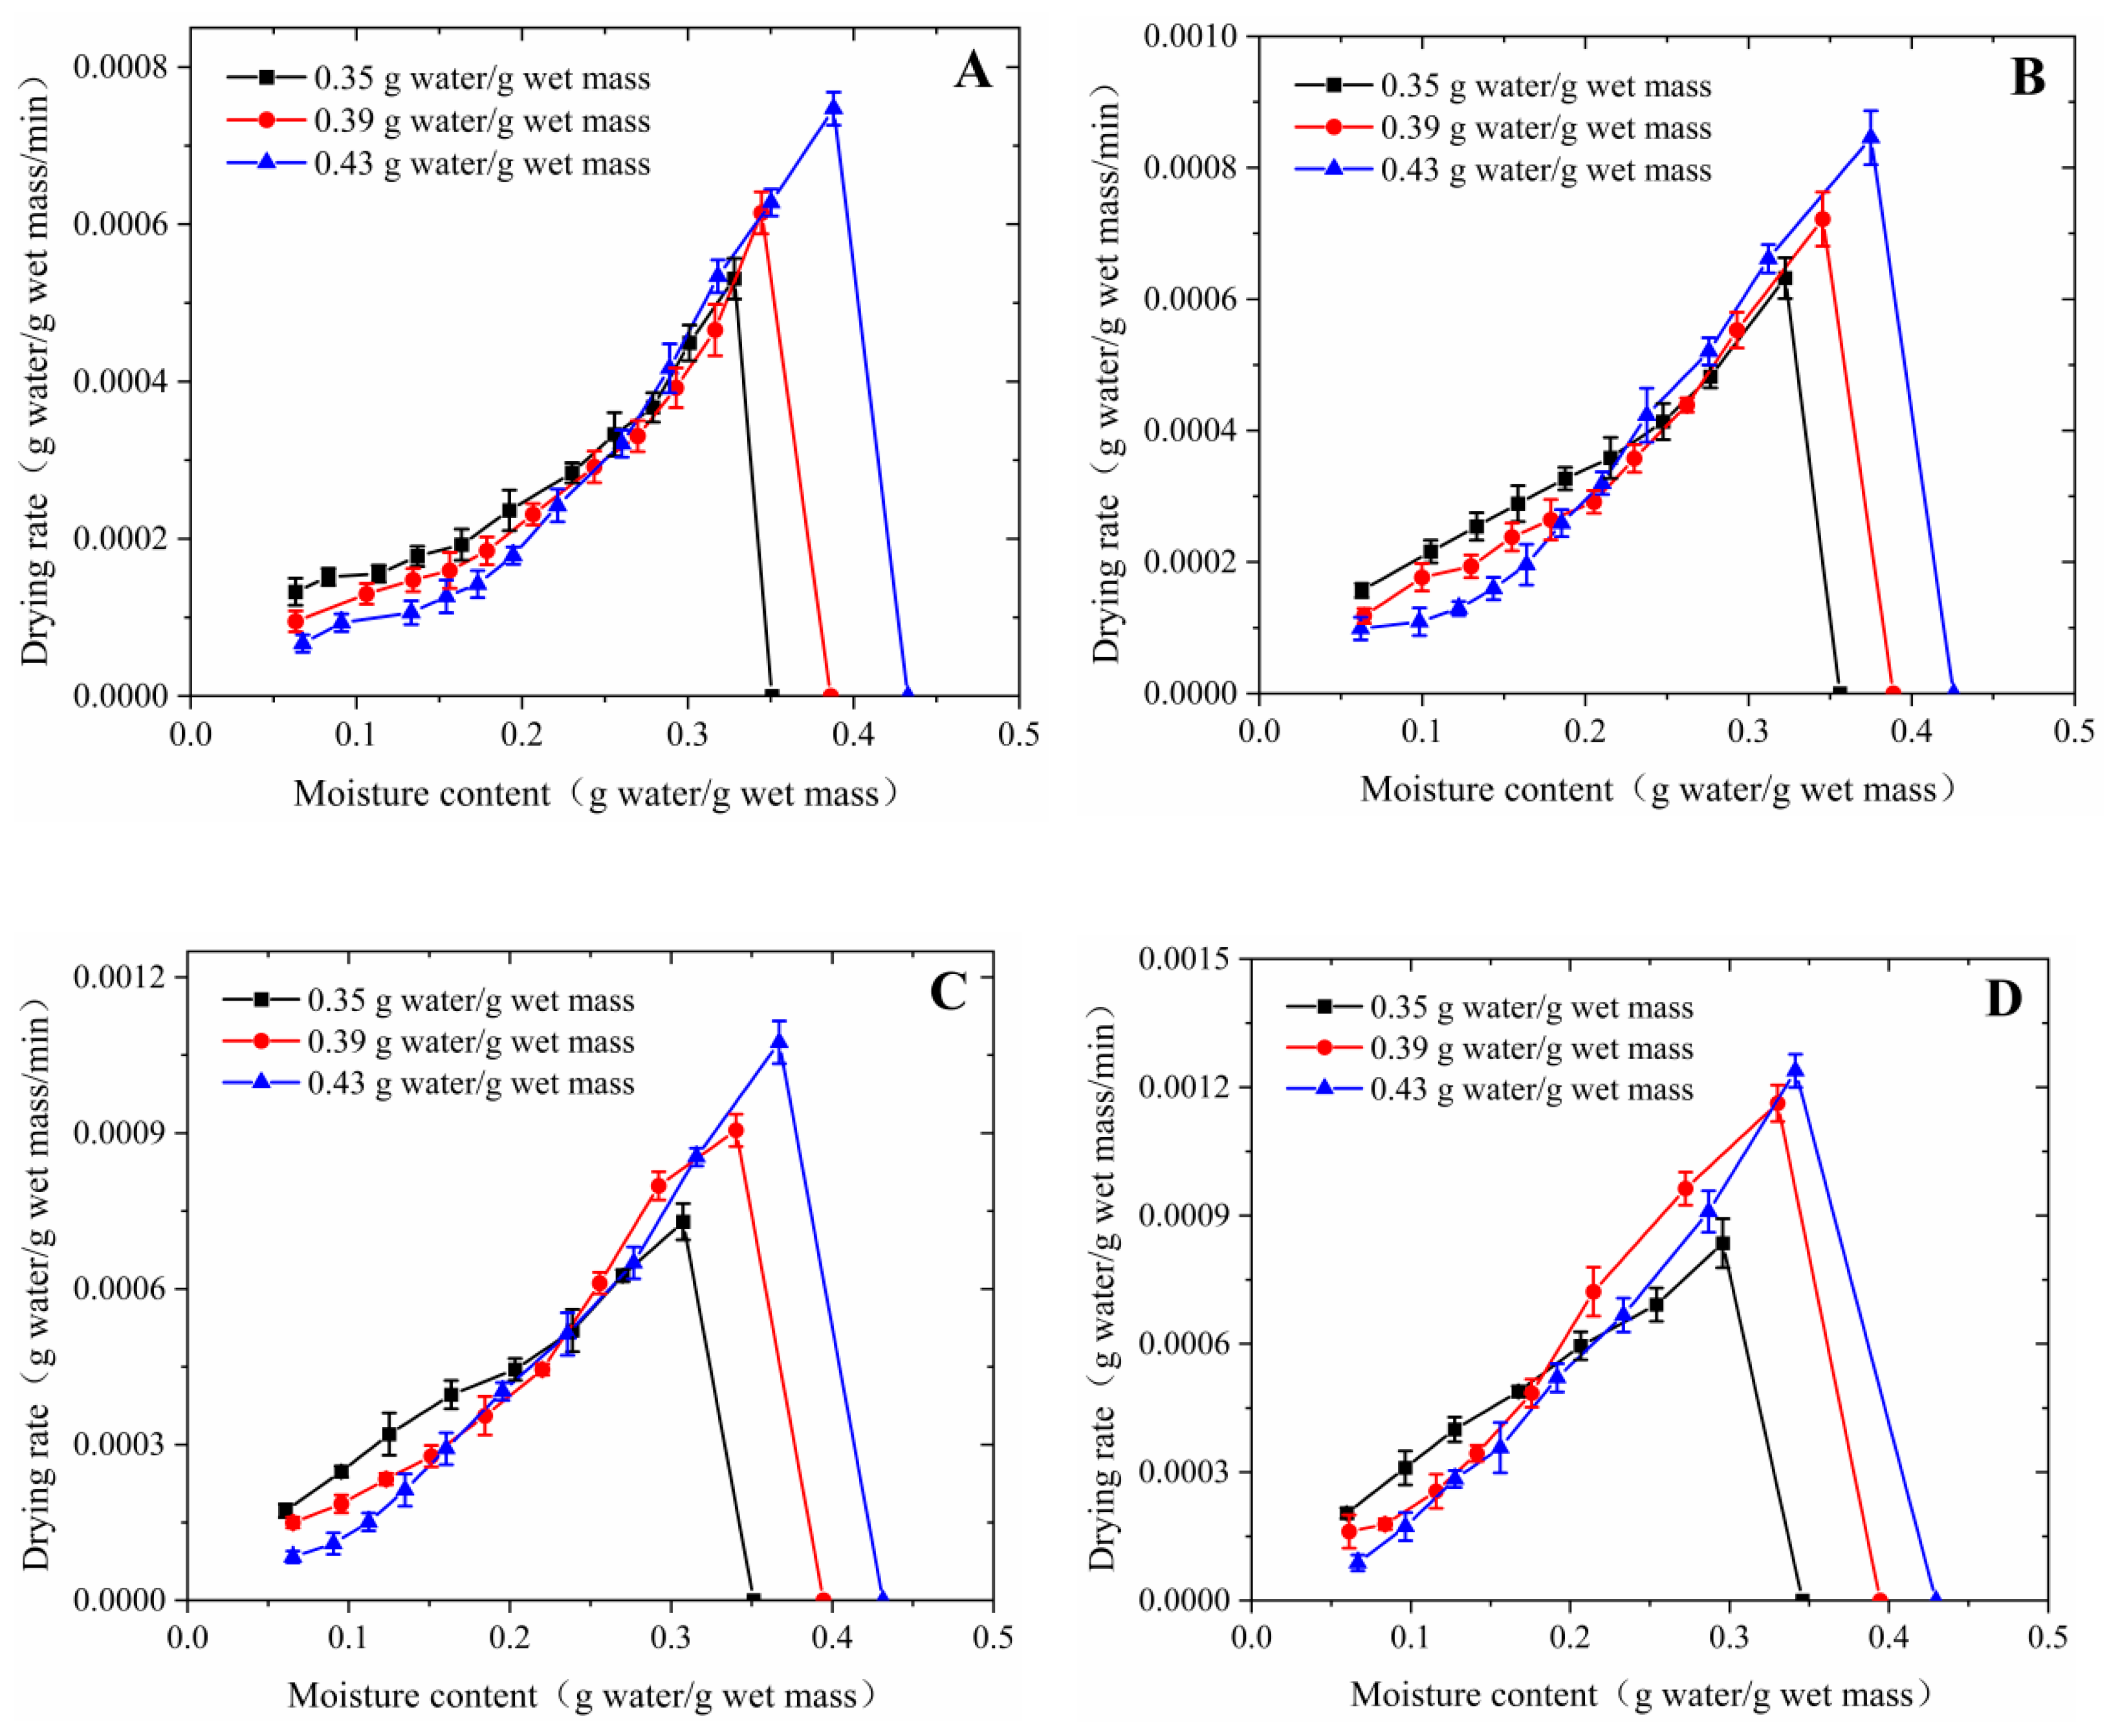
The rate curves of the walnut at different IMCs and drying temperatures are shown in Figure 4. As shown in Figure 4, the drying of walnuts occurred mainly in the falling-rate periods, which indicated that the walnut drying process is controlled by the internal mass transfer rate and the transfer mechanism is diffusion [35,40]. This drying rate curve is a typical drying behavior for food materials with porous structures or cellular structures, i.e., garlic [42], brown rice [43], apple [44], wolfberry [45], and cistanche [46]. As can be seen in Figure 3, the drying rate curve shows two falling-rate drying periods: the first and second falling-rate drying periods. In the first falling-rate drying period, the surface and internal free moisture of walnuts evaporated rapidly, resulting in a high drying rate. As the drying progressed, the drying evaporation zone gradually moved inward from the outside surface to the internal. This results in elongated inner moisture transfer paths, and therefore the drying rate dropped rapidly, indicating that the drying entered the second falling-rate drying period [12,40].
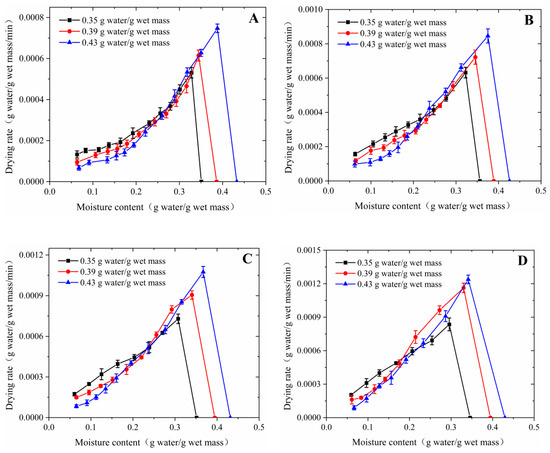
Figure 4.
Drying rate curves of walnut at different drying conditions (A) 50 °C; (B) 60 °C; (C) 70 °C; (D) 80 °C.
It can also be seen from Figure 4 that the drying rates at the early drying stages increase with the increase in IMC. During the drying process of the material, the dissipation of surface moisture and the diffusion of internal moisture occur simultaneously, but the drying rates at the early drying stages are mainly influenced by the rate of surface moisture dissipation [13,40]. Therefore, the larger the IMC of walnut, the greater the surface moisture, and thus the greater the drying rates at the early drying stages. It was found that an increase in drying temperature could significantly increase the highest drying rate and average drying rate of walnuts (Table 3). This is due to the high temperatures improving heat transfer and increasing the thermal energy absorbed by the walnuts, which in turn increases the drying rate [29]. The highest drying rates increased from 0.00053 to 0.00084 g water/g wet mass/min for walnuts with an IMC of 0.35 g water/g wet mass, from 0.00061 to 0.00116 g water/g wet mass/min for walnuts with an IMC of 0.39 g water/g wet mass, and from 0.00075 to 0.00124 g water/g wet mass/min for walnuts with an IMC of 0.43 g water/g wet mass, respectively (Table 3). The combination of high IMC and drying temperature leads to a significant increase in highest drying rates, reaching a peak of approximately 0.00124 g water/g wet mass/min.
3.2. Effective Moisture Diffusivity
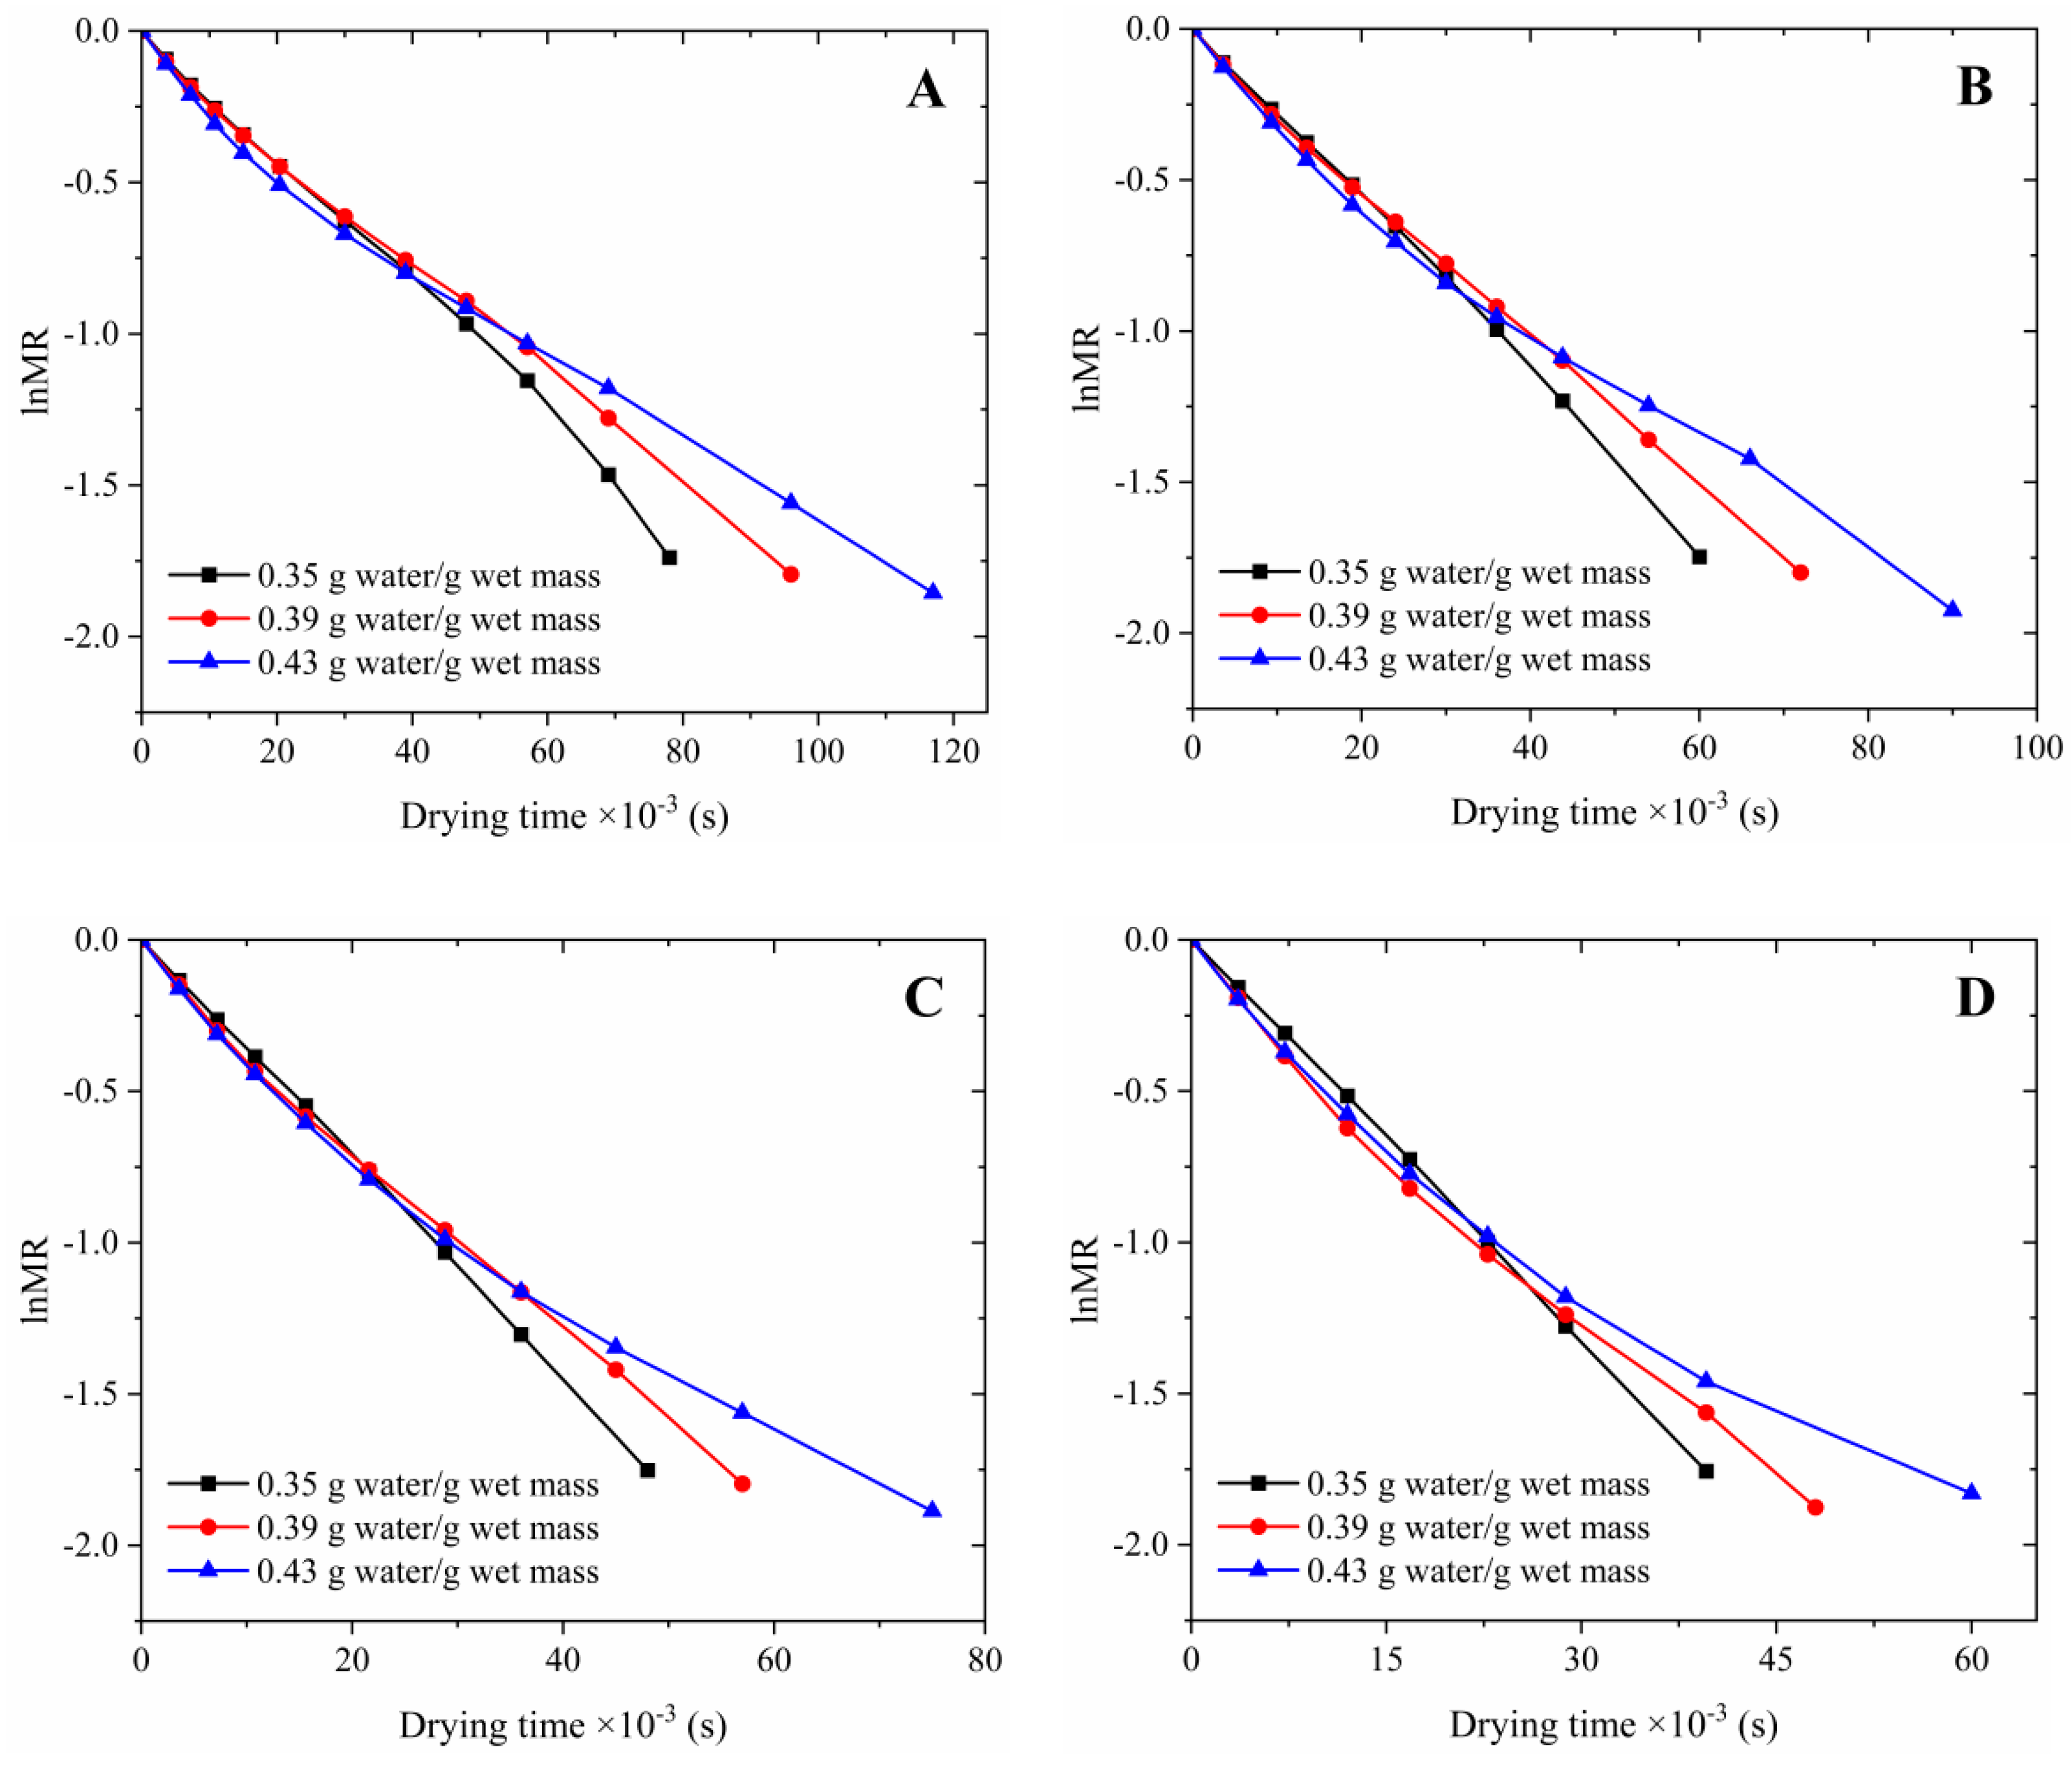
Generally, the Deff is employed and represents an internal moisture diffusion characteristics in the material since the limited information on the moisture movement mechanism during drying [22]. It can be seen from Equation (9) that the natural logarithm of the moisture ratio (lnMR) of walnuts during HAD is linearly related to the drying time. Figure 5 shows the changes of lnMR of walnut with drying time under the drying condition. The Deff were determined by linear regression, as shown in Table 4.
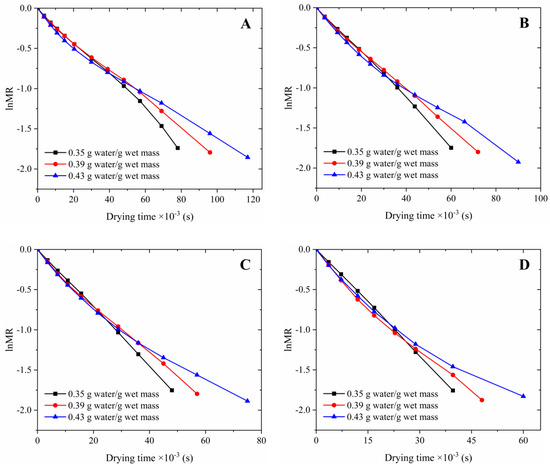
Figure 5.
Variation in lnMR of walnut with drying time under different drying conditions (A) 50 °C; (B) 60 °C; (C) 70 °C; (D) 80 °C.
Table 4.
Effective moisture diffusivity of walnuts at different drying conditions.
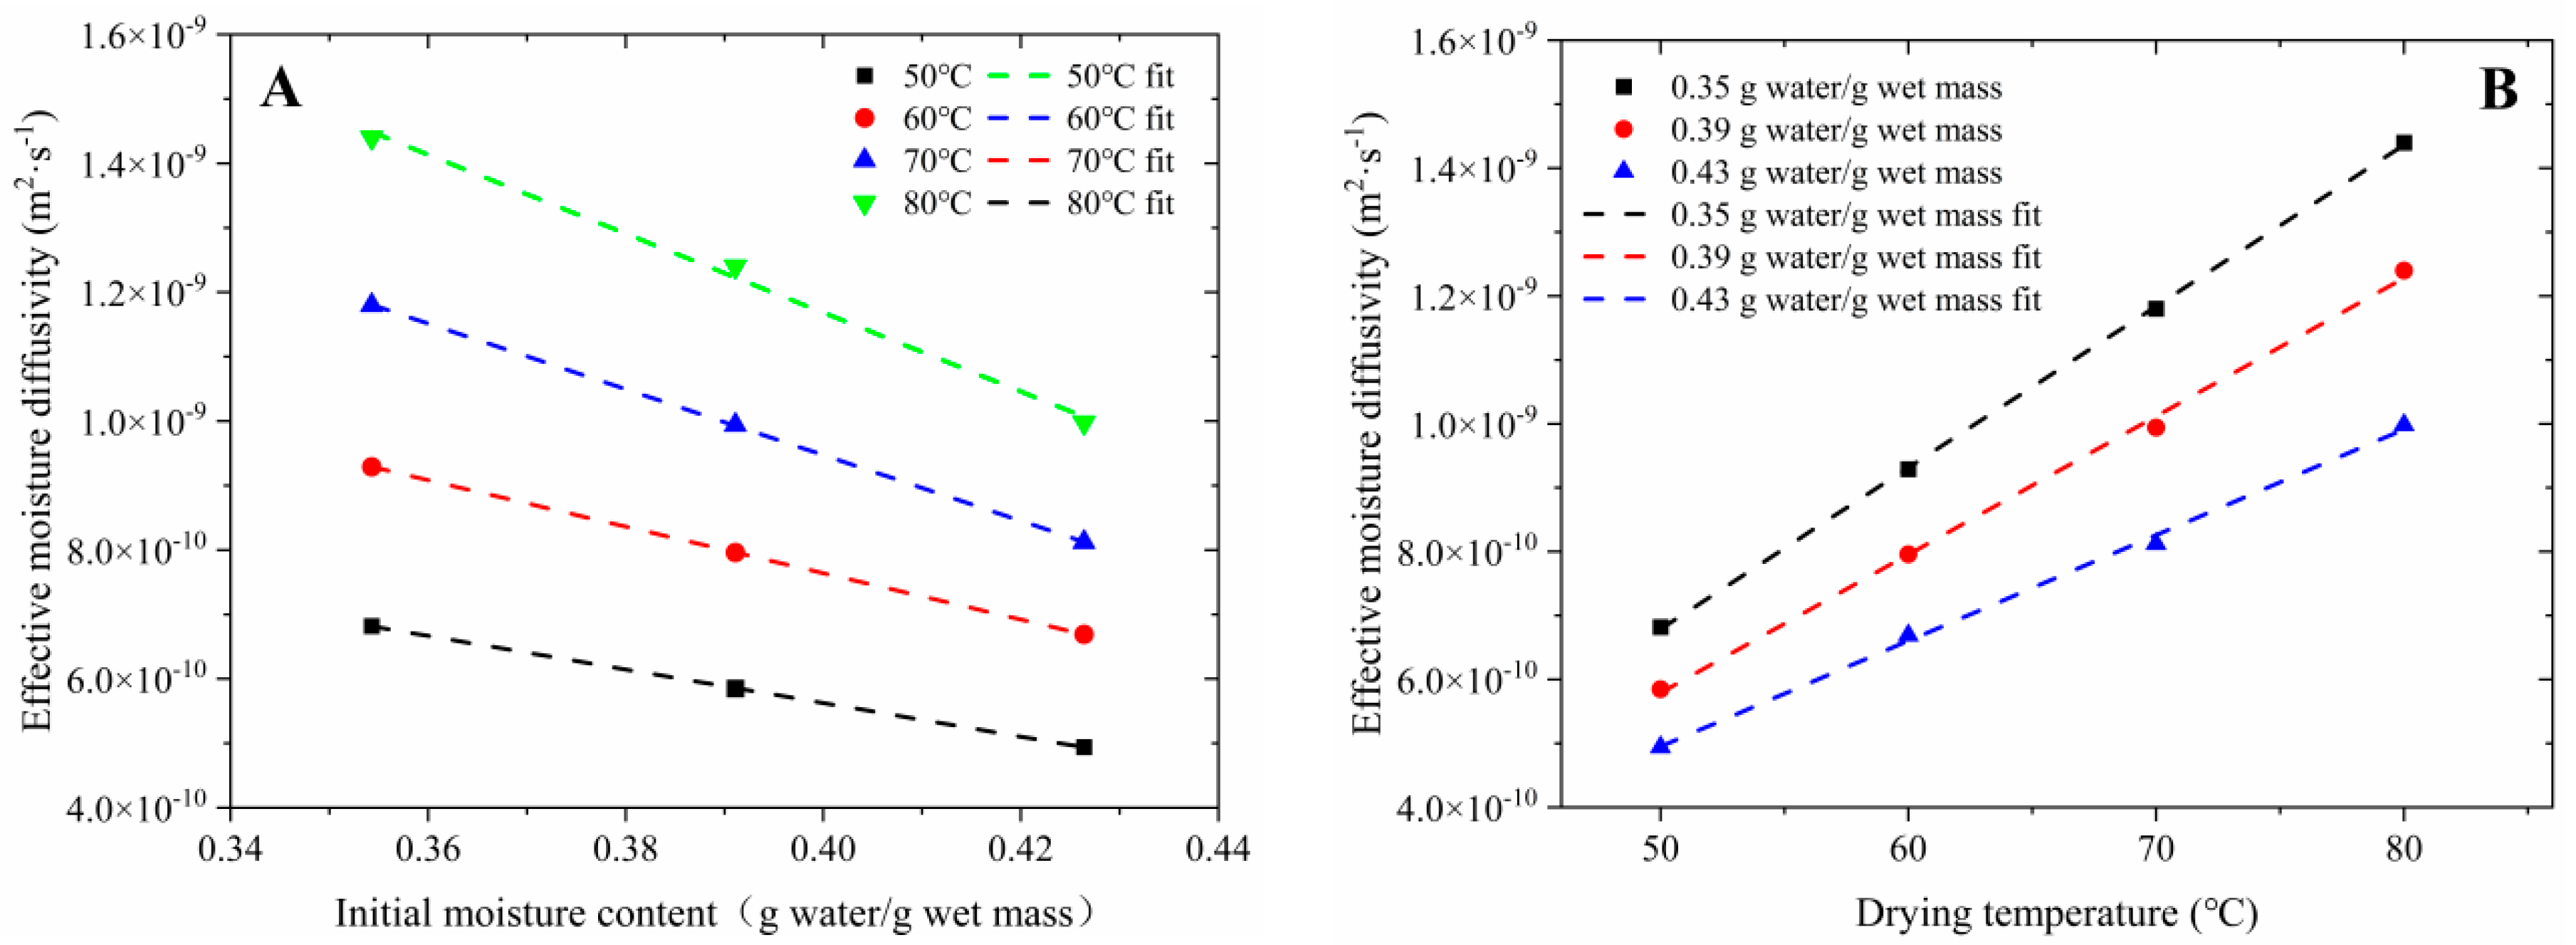
In order to quantitatively analyze the effect of IMC and drying temperature on the internal moisture diffusion characteristics of the walnut, Figure 6 shows the variation of Deff with IMC and drying temperature. It was also found that the Deff of the lower IMC walnuts was generally higher than the higher IMC walnuts. When walnuts with different IMCs were dried to the same MC, walnuts with higher IMCs underwent a longer drying time and excluded more water, and water loss was controlled by more internal water diffusion, while internal water diffusion is much more difficult than surface water dissipation, resulting in smaller Deff values [19]. At the same time, for materials with a porous structure in their organization, the volume of pore shrinkage during drying is almost entirely used to compensate for the loss of moisture in the pores [40]. As a result, higher IMC walnuts have a greater degree of structural shrinkage, which in turn results in a more difficult diffusion of internal moisture. The results showed that walnuts with higher IMC had a longer descending drying time, entered the internal control phase earlier, and were affected by internal diffusion control effects for a longer period of time. In addition, it was also found that as the drying temperature increased from 50 to 80 °C, the value of Deff for walnut with an IMC of 0.35 g water/g wet mass increased linearly from 6.82 × 10⁻¹⁰~1.44 × 10⁻⁹ m2/s; the value of Deff for walnut with an IMC of 0.39 g water/g wet mass increased linearly from 5.85 × 10⁻¹⁰~1.24 × 10⁻⁹ m2/s; and the value of Deff for walnut with an IMC of 0.43 g water/g wet mass increased linearly from 4.94 × 10⁻¹⁰~9.98 × 10⁻¹⁰ m2/s (Figure 6B and Table 4). This is because the high temperature increases the thermal energy absorbed by the walnuts, which in turn enhances the diffusion of water molecules. Similar results were found for straw-based nutrient seedling-growing bowl trays in previous studies [37].

Figure 6.
Effect of initial moisture contents (A) and drying temperatures (B) on the effective moisture diffusivity of walnut.
Comparing Figure 6A,B, drying temperature has a greater effect on the Deff than the IMC, which suggested that the Deff is more sensitive to the increase in the drying temperature than to increases in the IMC during the HAD process of walnut. The values of Deff found in this study were in the range of 4.94 × 10⁻¹⁰ m2/s to 1.44 × 10⁻⁹ m2/s, which is a typical range for drying of agricultural products [5,21,22,23,24,25,28,29,31,35,36,37,46,47,48,49,50]. In order to quantify the effects of IMC and drying temperature on the Deff of walnut, a two factor relationship model of Deff with IMC and drying temperature was developed by multiple linear regression fitting analysis of the experimental data, as shown in Equation (21). The high value of the determination coefficient of the model (R2 > 0.978) suggested the goodness of the regression fittings.
where, Td was the drying temperature (°C).
3.3. Mass Transfer Coefficient
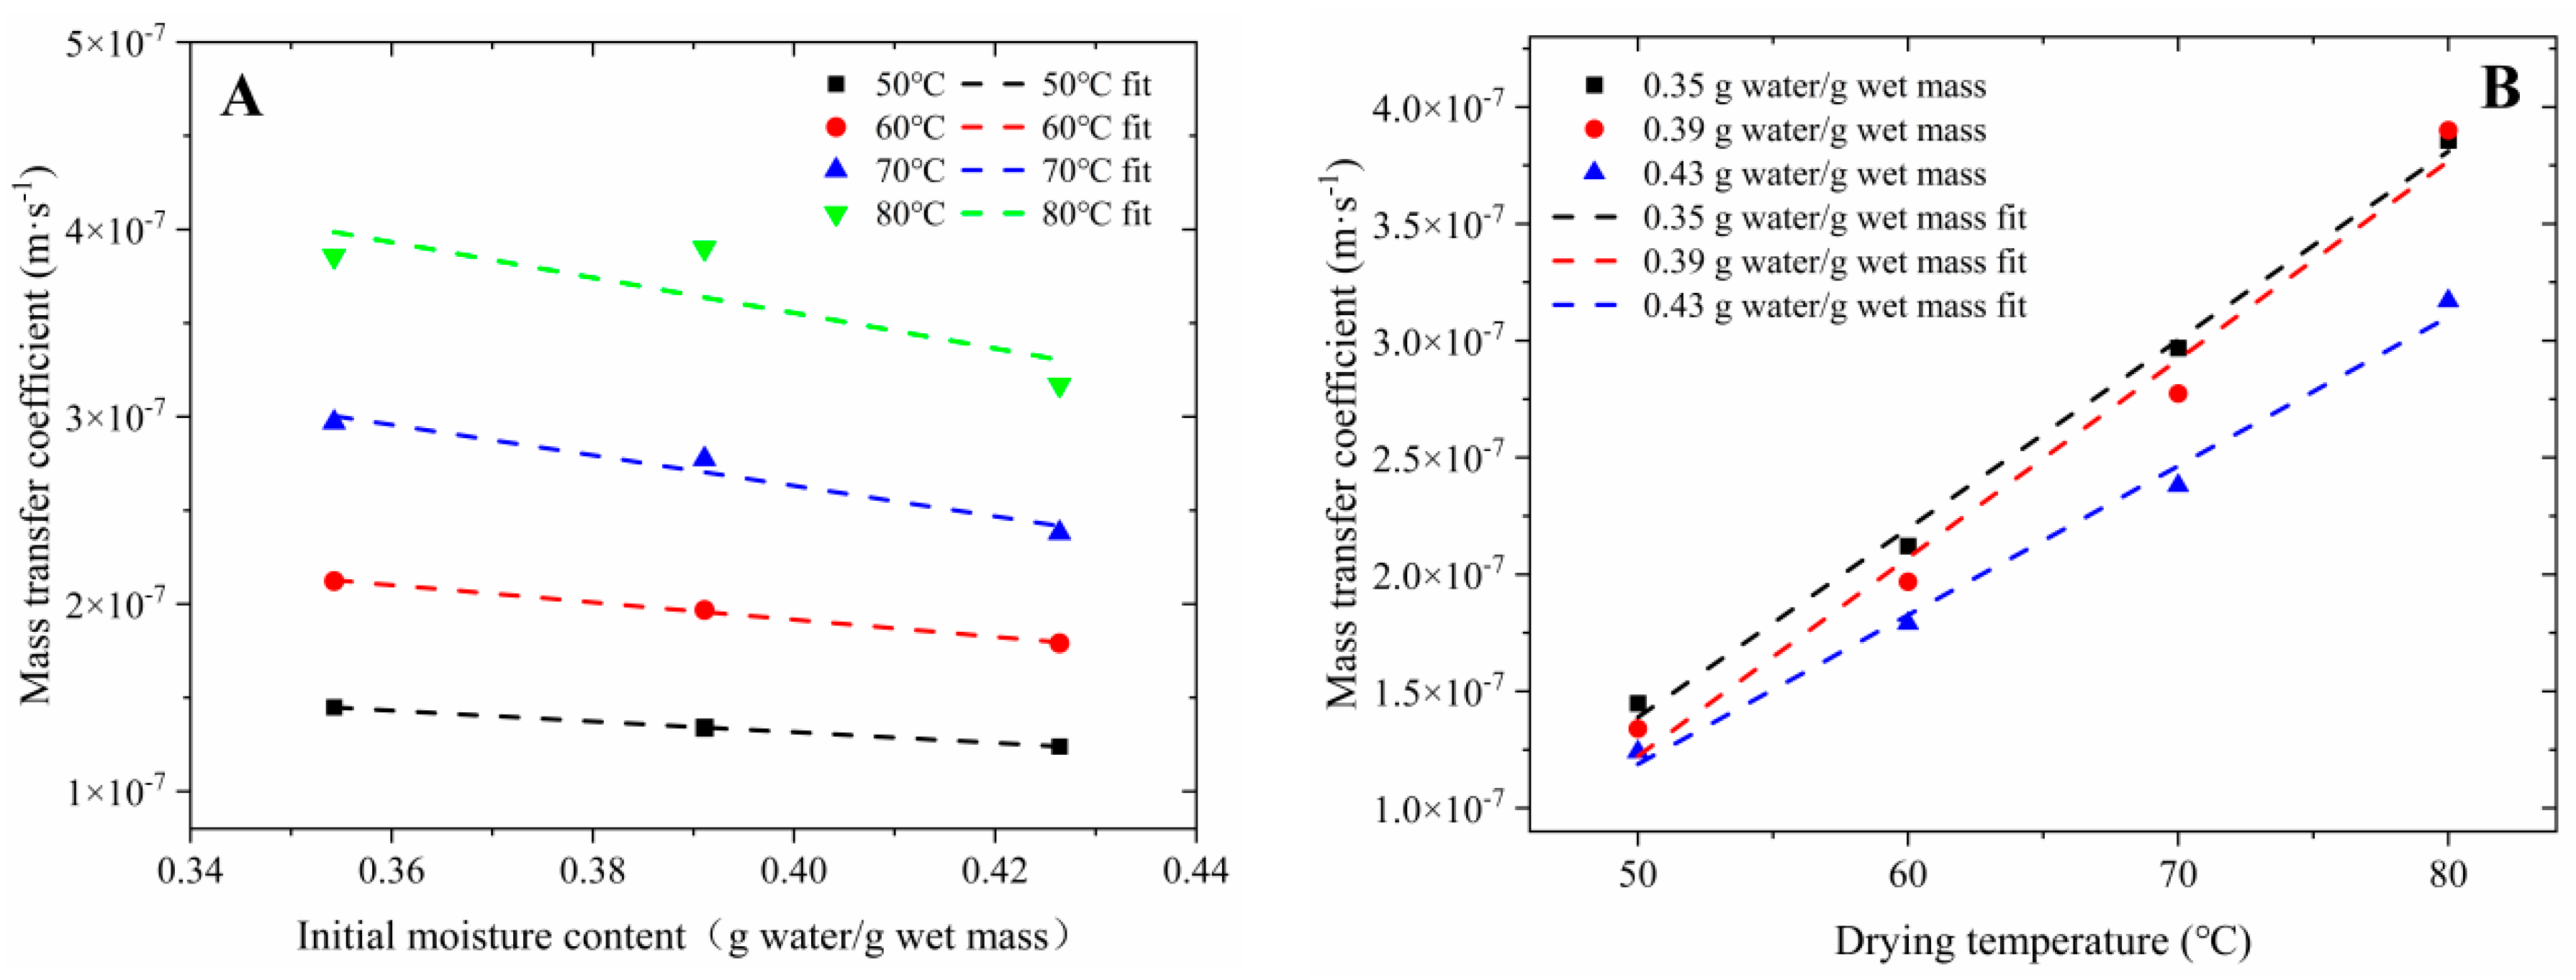
In order to quantitatively analyze the effect of IMC and drying temperature on the mass transfer characteristics of the walnut, Figure 7 shows the variation of hm with IMC and drying temperature. As shown, the value of hm decreased linearly with the increased of IMC (0.35~0.43 g water/g wet mass) and increased linearly with the increased of drying temperature (50~80 °C). Comparing Figure 7A,B, drying temperature has a greater effect on the hm than the IMC, which suggested that the hm is more sensitive to the increase in the drying temperature than to increases in the IMC during the HAD process of walnut. Unsurprisingly, the higher the drying temperature, the faster the water molecules in the walnuts evaporate, thus the higher the hm accordingly [24]. As the drying temperature increased linearly from 50 to 80 °C, the value of hm for walnut with an IMC of 0.35 g water/g wet mass increased linearly from 1.45 × 10⁻⁷~3.86 × 10⁻⁷ m/s; the value of hm for walnut with an IMC of 0.39 g water/g wet mass increased linearly from 1.34 × 10⁻⁷~3.90 × 10⁻⁷ m/s; the value of hm for walnut with an IMC of 0.43 g water/g wet mass increased from 1.24 × 10⁻⁷~3.17 × 10⁻⁷ m/s (Figure 7B).

Figure 7.
Effect of initial moisture contents (A) and drying temperatures (B) on the mass transfer coefficient of walnut.
In order to quantify the effects of IMC and drying temperature on the hm of walnut, a two factor relationship model of hm with IMC and drying temperature was developed by multiple linear regression fitting analysis of the experimental data, as shown in Equation (22). The high value of the determination coefficient of the model (R2 > 0.973) indicated the goodness of the regression fittings.
3.4. Activation Energy
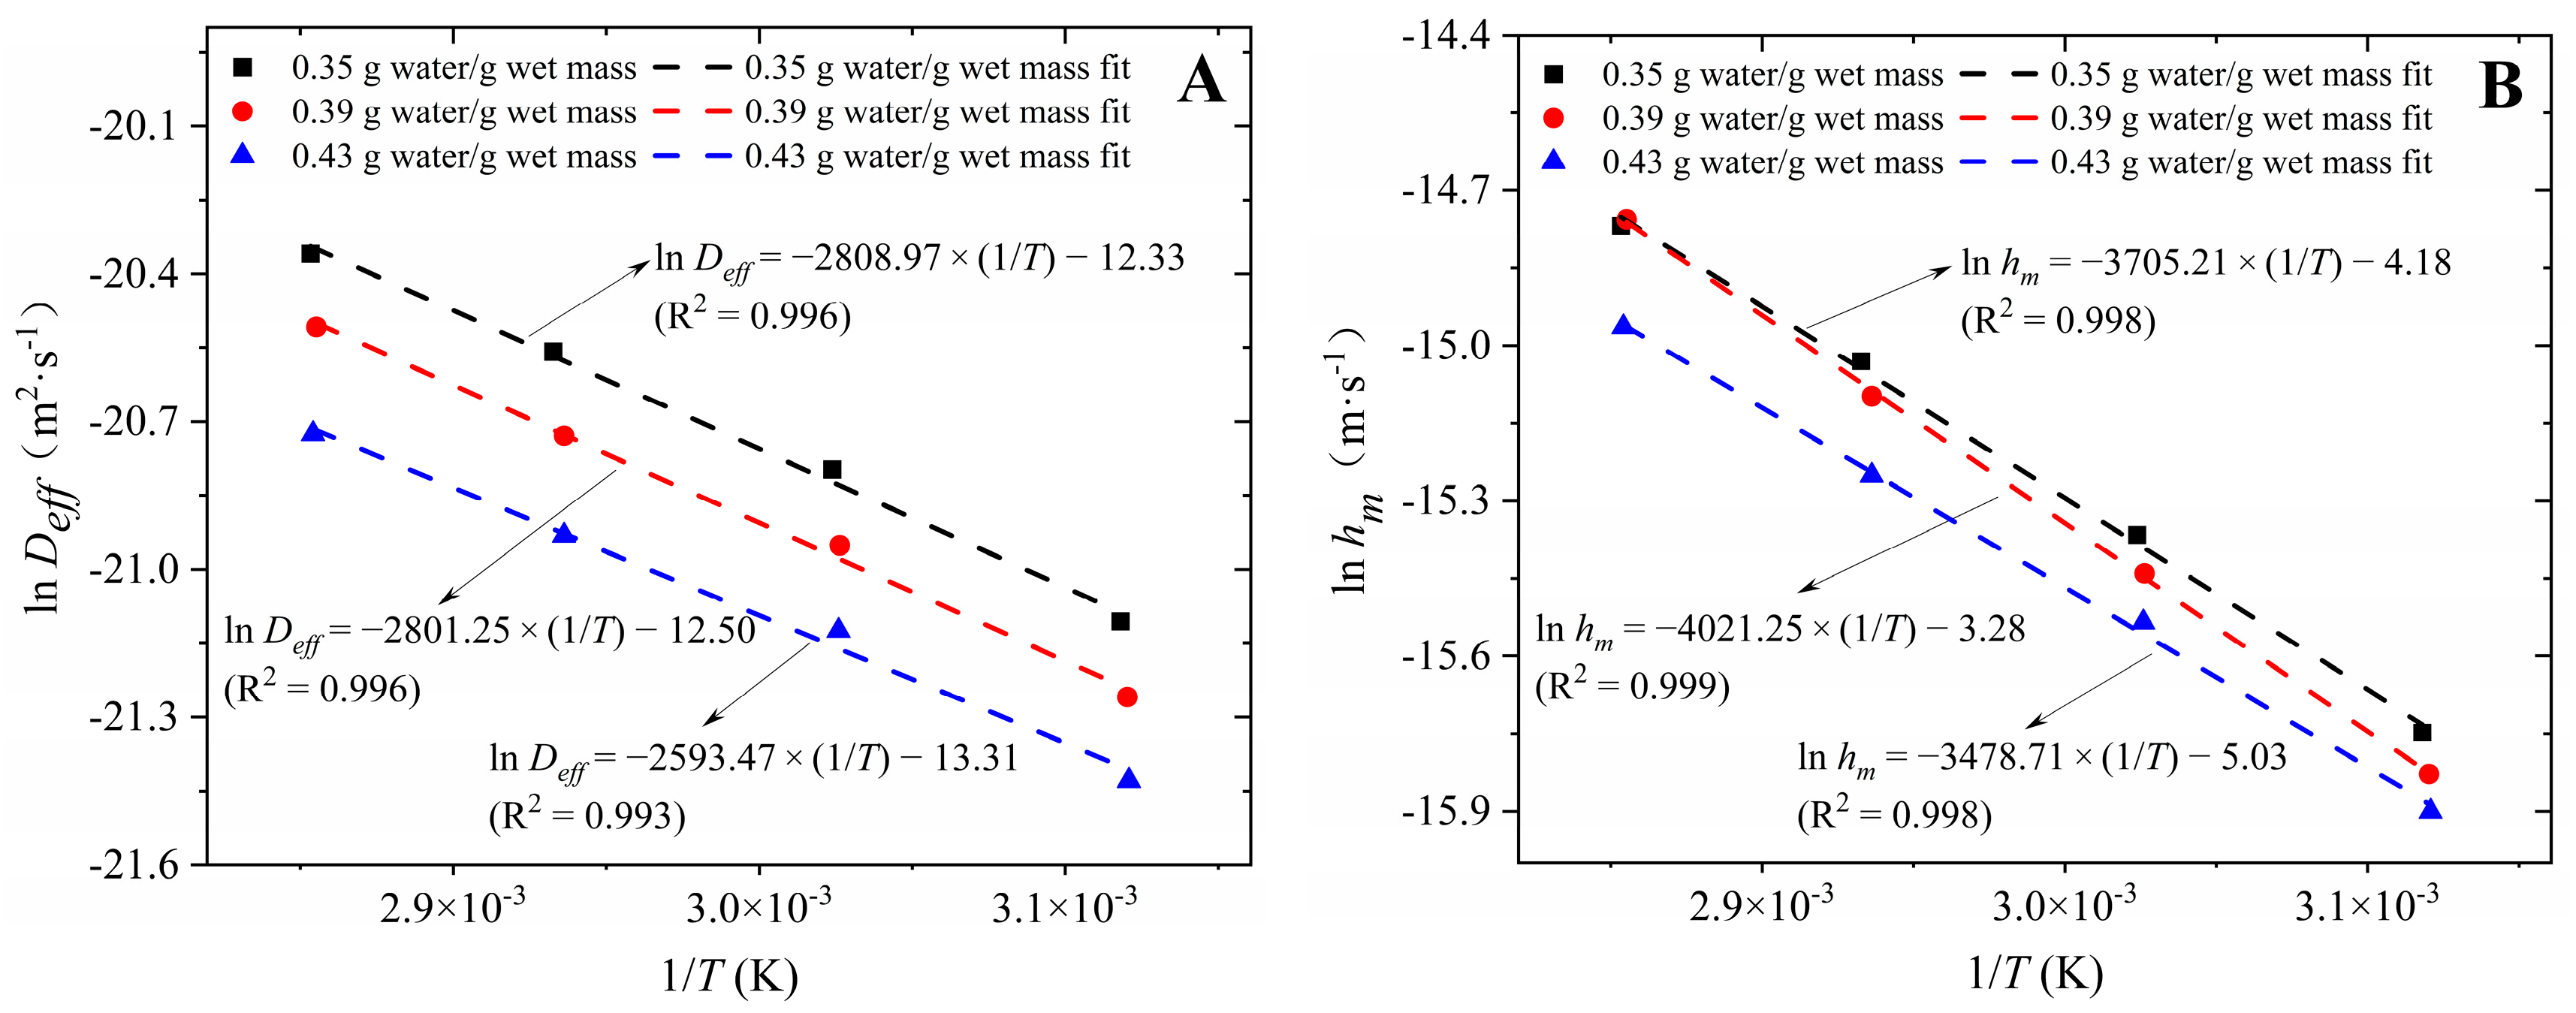
The activation energy is a crucial indicator in the end analysis of the drying process since it shows the difficulty of dehydrating under certain drying conditions [51]. Table 3 displays the walnut average temperatures during the HAD. These walnut average temperatures were employed in Equations (16) and (17) to research the temperature dependence of the hm and Deff. Specifically, Figure 8A shows the plots of the natural log of Deff (ln Deff) versus the reciprocal of sample temperature (1/T) for the HAD experiments of walnut. The high correlation between 1/T and ln Deff under different IMCs was obtained with linear models (R2 > 0.99). From the line slope in Figure 8A, the ED values of walnut were calculated to range from 21.56 to 23.35 kJ/mol, with an average value of 22.73 kJ/mol. Figure 8B shows the plots of the natural log of hm (ln hm) versus reciprocal of sample temperature (1/T) for the HAD experiments of walnut. The high correlation between 1/T and ln hm under different IMCs was obtained with linear models (R2 > 0.99). From the line slope in Figure 8B, the EH values of walnut were calculated to range from 28.92 to 33.43 kJ/mol, with an average value of 31.05 kJ/mol. The results show that the range of energy required to remove 1 mol of water from walnuts during drying is 21.56~33.43 kJ.
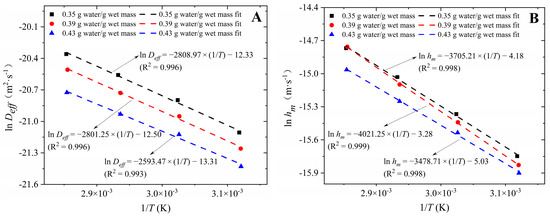
Figure 8.
Plots of ln Deff (A) and ln hm (B) versus 1/T for the hot air drying experiments of walnut.
3.5. Lightness of the Walnut Kernel
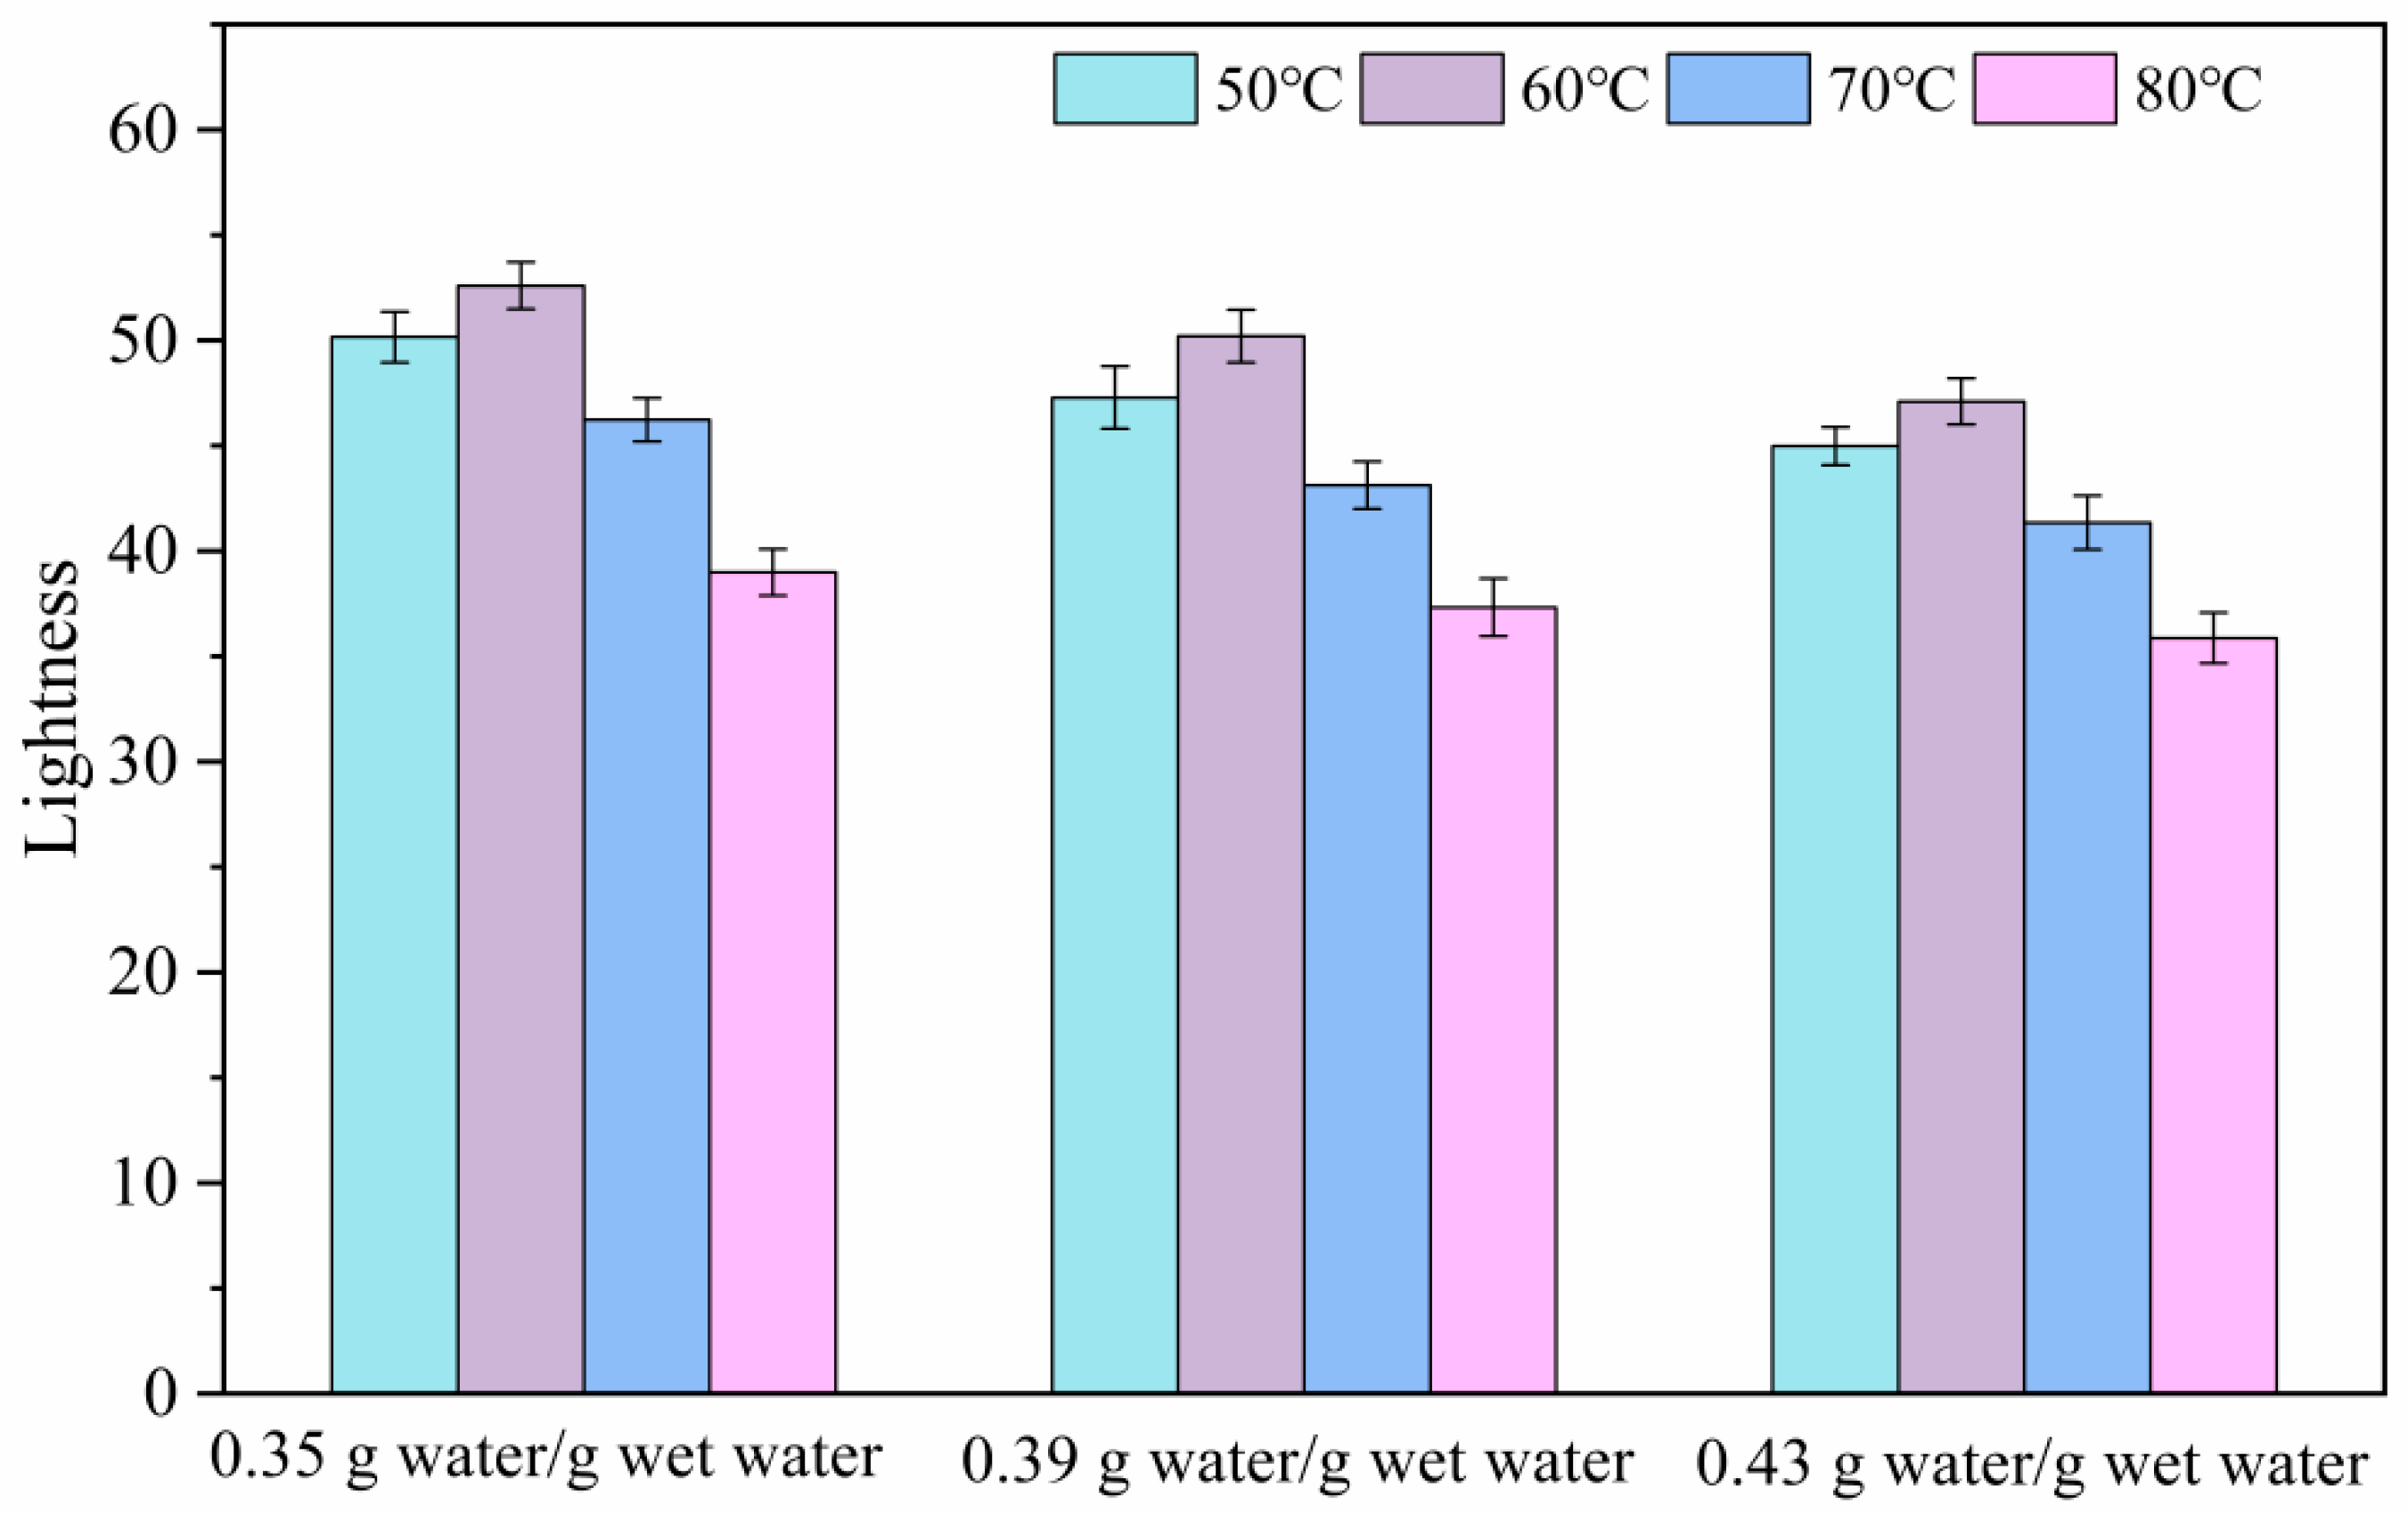
The lightness of the kernel is one of the key quality indicators of dried walnuts. The lightness values of walnut kernels under different IMC and drying temperature conditions are shown in Figure 9, with lightness values ranged from 35.87 to 52.61. As shown in Figure 9, drying temperature has a greater effect on the walnut kernel lightness than the IMC, which suggested that the walnut kernel lightness is more sensitive to changes in the drying temperature than to changes in the IMC under the HAD. It can be found that lightness slightly increases and then decreases with increasing drying temperature. The darkening of the color of food materials during the drying process may be caused by both non-enzymatic and enzymatic browning reactions [52,53]. The walnuts are dried under low-temperature drying conditions for long periods of time, which leads to increased browning [13]. The high temperature heating induced the Maillard reaction of amino acids and reducing sugar within walnut kernels and led to more non-enzymatic browning [54]. Meanwhile, it was also found that the lightness values of kernels after drying of high IMC walnuts were lower than those of kernels after drying of low IMC walnuts. It is due to the fact that the high IMC walnuts require longer drying times, resulting in a higher browning degree of the kernels [19]. Additionally, the combination of high IMC (0.43 g water/g wet water) and drying temperature (70~80 °C) results in a significant decrease in lightness. This indicates that the combination of higher IMC and drying temperature can exacerbate the browning of the kernel during HAD.

Figure 9.
Effect of initial moisture contents and drying temperatures on the lightness of walnut kernels.
3.6. Kinetic Analyses on the Hot Air Drying Process
Moisture movement in food is a dynamic and complex phenomenon. Drying kinetics studies were necessary for assessing and optimizing the walnut drying process [37,55,56]. The MR obtained from the HAD process of walnut was investigated by the mathematical models presented in Table 2, and the model results are summarized in Table 5. As shown, the mean value of R2 for the Verma et al model is 0.99965, which indicated that the Verma et al model could be used to describe the walnut HAD processes. Additionally, the mean values of RMSE and χ2 are 0.00441 and 0.00027, respectively, which are the minimum values, which could also indicated the Verma et al model was the best model to describe the drying processes. The values of drying coefficients and constants in the Verma et al model at different conditions are summarized in Table 6.
Table 5.
Range and average value of R2, χ2 and RMSE of drying kinetic models for walnut.
Table 6.
Fitted results of Verma et al models under different drying conditions.
In order to further characterize the effect of drying factors on the Verma et al model, the equations between the drying model constants (a, g, and k) and the drying factors were developed using regression analysis. The regression equations between the Verma et al model constants and the drying factors were as follows:
IMC was 0.35 g water/g wet mass:
IMC was 0.39 g water/g wet mass:
IMC was 0.43 g water/g wet mass:
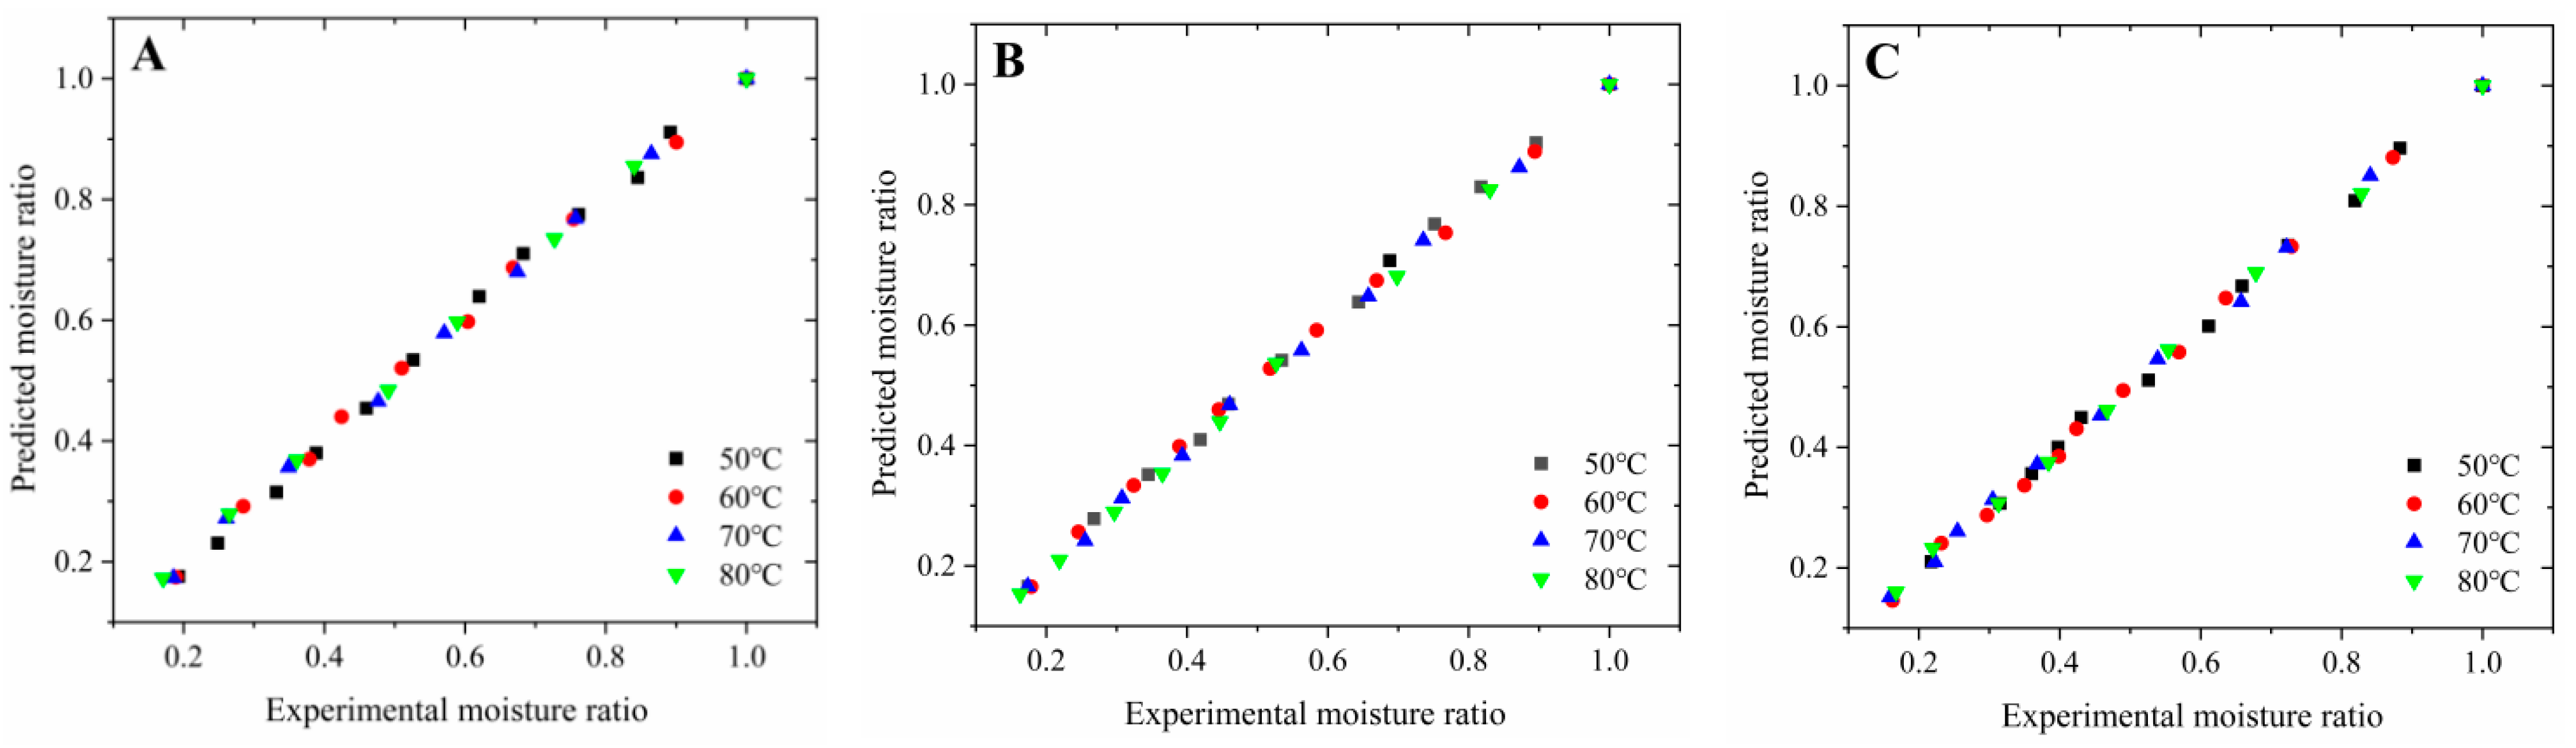
To verify whether the Verma et al model can accurately predict the walnut HAD process, Figure 10 shows the comparison of experimental MR and predicted MR by the Verma et al model. According to the literature, if the curves of the experimental and predicted values are approximately at a 45° angle, it means that the predicted values represent the experimental values well [37]. As can be seen from Figure 10, the model of Verma et al showed a good agreement between experimental MR and predicted MR during the HAD processes of walnut. These data points are banded line plots at an angle of approximately 45°, which suggests that the model of Verma et al is able to make good predictions of walnut HAD processes under different drying conditions.
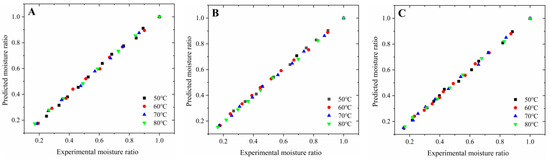
Figure 10.
Comparison of experimental MR and predicted MR from Verma et al model under different drying conditions (A) 0.35 g water/g wet mass; (B) 0.39 g water/g wet mass; (C) 0.43 g water/g wet mass.
4. Conclusions
The HAD of walnuts mainly occurred in the falling-rate stage. The higher the IMC, the longer the preheating time, the smaller the Deff and hm, and the longer the drying time. The higher the drying temperature, the shorter the preheating time, the larger the Deff and hm, and the shorter the drying time. The walnut kernel lightness is more sensitive to changes in the drying temperature than to changes in IMC under the HAD. The values of Deff and hm for walnut ranged from 4.94 × 10⁻¹⁰ to 1.44 × 10⁻⁹ m2/s and 1.24 × 10⁻⁷ to 3.90 × 10⁻⁷ m/s, respectively. The values of ED and EH for walnut ranged from 21.56 to 23.35 kJ/mol and 28.92 to 33.43 kJ/mol, respectively. Two multivariate linear prediction models were developed to correlate the Deff and hm with IMC and drying temperature, respectively, with a high correlation coefficient, and these can be embedded in future FEM simulations to model the moisture transport of walnuts during HAD, which could provide a theoretical basis for elucidating the moisture transfer mechanism of walnuts during HAD. The developed kinetic model showed good potential for the prediction of the walnut HAD process, which can be applied for the optimization of drying conditions for efficient walnut drying in the industry.
Author Contributions
Conceptualization, X.F.; methodology, Y.T.; software, X.M.; investigation, X.M.; resources, X.F., H.Z. and Y.Z.; data curation, X.M.; writing—original draft preparation, X.M.; writing—review and editing, X.M., L.L. and X.F.; visualization, Y.Z.; supervision, H.L.; project administration, H.Z. All authors have read and agreed to the published version of the manuscript.
Funding
This work has been financially supported and encouraged by the Shishi Science and Technology Program (Grant No. 2021ZB01, 2022ZB05 and 2022ZB07), Bingtuan Science and Technology Program (Grant No. 2022CB08, 2018CB014), Modern Agricultural Engineering Key Laboratory at Universities of Education Department of Xinjiang Uygur Autonomous Region (Grant No. TDNG2022101).
Institutional Review Board Statement
Not applicable.
Data Availability Statement
The data presented in this study are available on request from the corresponding author.
Acknowledgments
The authors thank Haipeng Lan from Tarim University for thesis supervision. The authors are grateful to the anonymous reviewers for their comments.
Conflicts of Interest
The authors declare no conflicts of interest.
References
- Erfani, A.; Pirouzifard, M.K.; Almasi, H.; Gheybi, N.; Pirsa, S. Application of cellulose plate modified with encapsulated cinnamomum zelanicum essential oil in active packaging of walnut kernel. Food Chem. 2022, 381, 132246. [Google Scholar] [CrossRef]
- Man, X.L.; Li, L.; Zeng, Y.; Tang, Y.R.; Yang, J.L.; Fan, X.W.; Zhang, Y.C.; Zhang, H.; Su, G.G.; Wang, J.P. Mechanical impact characteristics of hollow shell granule based on continuous damage theory. Powder Technol. 2023, 429, 118946. [Google Scholar] [CrossRef]
- Chen, C.; Pan, Z.L. Postharvest processing of tree nuts: Current status and future prospects-A comprehensive review, Compr. Rev. Food Sci. F 2022, 21, 1702–1731. [Google Scholar] [CrossRef] [PubMed]
- Liu, M.Z.; Li, C.H.; Cao, C.M.; Wang, L.Q.; Li, X.P.; Che, J.; Yang, H.M.; Zhang, X.W.; Zhao, H.Y.; He, G.Z.; et al. Walnut Fruit Processing Equipment: Academic Insights and Perspectives. Food Eng. Rev. 2021, 13, 822–857. [Google Scholar] [CrossRef]
- Dolgun, G.K.; Aktas, M.; Dolgun, E.C. Infrared convective drying of walnut with energy-exergy perspective. J. Food Eng. 2021, 306, 110638. [Google Scholar] [CrossRef]
- Zhu, D.Q.; Ma, J.; Jiang, R.; Yuan, J.H.; Wang, C.X.; Zhu, H. Parameter optimization of hickory nut drying by phased varying power microwave. Trans. CSAE 2016, 32, 268–274. [Google Scholar] [CrossRef]
- Zhou, X.; Gao, H.; Mitcham, E.J.; Wang, S. Comparative analyses of three dehydration methods on drying characteristics and oil quality of in-shell walnuts. Dry. Technol. 2018, 36, 477–490. [Google Scholar] [CrossRef]
- Zhang, B.; Zheng, A.; Zhou, L.; Huang, Z.; Wang, S. Developing Hot Air-Assisted Radio Frequency Drying Protocols for in-Shell Walnuts. J. Food Agric. 2016, 28, 459–467. [Google Scholar] [CrossRef]
- Mao, Y.X.; Wang, P.H.; Wu, Y.; Hou, L.X.; Wang, S.J. Effects of various radio frequencies on combined drying and disinfestation treatments for in-shell walnuts. LWT-Food Sci. Technol. 2021, 144, 111246. [Google Scholar] [CrossRef]
- Fu, M.; Qu, Q.; Yang, X.; Zhang, X. Effect of intermittent oven drying on lipid oxidation, fatty acids composition and antioxidant activities of walnut. LWT-Food Sci. Technol. 2016, 65, 1126–1132. [Google Scholar] [CrossRef]
- Qu, Q.; Yang, X.; Fu, M.; Chen, Q.; Zhang, X.; He, Z.; Qiao, X. Effects of Three Conventional Drying Methods on the Lipid Oxidation, Fatty Acids Composition, and Antioxidant Activities of Walnut (Juglans regia L.). Dry Technol. 2016, 34, 822–829. [Google Scholar] [CrossRef]
- Chen, C.; Zhang, W.P.; Venkitasamy, C.; Khir, R.; McHugh, T.; Pan, Z.L. Walnut structure and its influence on the hydration and drying characteristics. Dry. Technol. 2019, 38, 975–986. [Google Scholar] [CrossRef]
- Chen, C.; Venkitasamy, C.; Zhang, W.P.; Deng, L.Z.; Meng, X.Y.; Pan, Z.L. Effect of step-down temperature drying on energy consumption and product quality of walnuts. J. Food Eng. 2020, 285, 110105. [Google Scholar] [CrossRef]
- Chen, C.; Upadhyaya, S.; Khir, R.; Pan, Z.L. Simulation of walnut drying under hot air heating using a nonequilibrium multiphase transfer model. Dry. Technol. 2020, 40, 987–1001. [Google Scholar] [CrossRef]
- Hassan-Beygi, S.R.; Aghbashlo, M.; Kianmehr, M.H.; Massah, J. Drying characteristics of walnut (Juglans regia L.) during convection drying. Int. Agrophysics 2009, 23, 129–135. [Google Scholar] [CrossRef]
- Zhu, D.W.; Cao, C.M.; Ding, Z.Y.; Liu, W.W.; Zhang, N.S.; Wang, J.X. Hot-air drying characteristics and technical parameters optimization of kernel hickory (Carya cathayensis Sarg.). Trans. CSAE 2011, 27, 364–369. [Google Scholar] [CrossRef]
- Yang, Z.; Luo, X.W.; Li, C.Y. Distribution of rice kernel moisture content at harvest. Trans. CSAM 2005, 21, 38–41. Available online: http://www.tcsae.org/cn/article/id/20050309?viewType=citedby-info (accessed on 15 December 2023).
- Chen, C.; Pan, Z.L. Heat and moisture transfer studies on walnuts during hot air drying in a fixed-bed column dryer. Appl. Therm. Eng. 2021, 199, 117554. [Google Scholar] [CrossRef]
- Huang, Y.; Huang, J.L.; Zheng, B.D. Microwave vacuum drying properties and kinetics model of white fungus. Trans. CSAE 2010, 26, 362–367. [Google Scholar] [CrossRef]
- Khir, R.; Pan, Z.L.; Salim, A.; Hartsough, B.R.; Mohamed, S. Moisture diffusivity of rough rice under infrared radiation drying. LWT-Food Sci. Technol. 2011, 44, 1126–1132. [Google Scholar] [CrossRef]
- Kaveh, M.; Abbaspour-Gilandeh, Y.; Nowacka, M. Optimisation of microwave-rotary drying process and quality parameters of terebinth. Biosyst. Eng. 2021, 208, 113–130. [Google Scholar] [CrossRef]
- Dadalı, G.; Apar, K.D.; Ozbek, B. Estimation of effective moisture diffusivity of okra for microwave drying. Dry. Technol. 2007, 25, 1445–1450. [Google Scholar] [CrossRef]
- Khan, M.I.H.; Kumar, C.; Joardder, M.U.H.; Karim, M.A. Determination of appropriate effective diffusivity for different food materials. Dry. Technol. 2017, 35, 335–346. [Google Scholar] [CrossRef]
- Teymori-Omran, M.; Askari Asli-Ardeh, E.; Taghinezhad, E.; Motevali, A.; Szumny, A.; Nowacka, M. Enhancing Energy Efficiency and retention of bioactive compounds in apple drying: Comparative analysis of combined hot air–infrared drying strategies. Appl. Sci. 2023, 13, 7612. [Google Scholar] [CrossRef]
- Chayjan, R.A.; Sabziparvar, A.A. Modeling moisture diffusivity, activation energy and specific energy consumption of squash seeds in a semi fluidized and fluidized bed drying. J. Food Sci. Technol. 2011, 50, s13197–s132011. [Google Scholar] [CrossRef] [PubMed]
- Zeng, Y.; Mao, B.Q.; Jia, F.G.; Han, Y.L.; Li, G.R. Modelling of grain breakage of in a vertical rice mill based on dem simulation combining particle replacement model. Biosyst. Eng. 2022, 215, 32–48. [Google Scholar] [CrossRef]
- Song, Z.L.; Jing, C.M.; Yao, L.S.; Zhao, X.Q.; Sun, J.; Wang, W.L.; Mao, Y.P.; Ma, C.Y. Coal slime hot air/microwave combined drying characteristics and energy analysis. Fuel Process Technol. 2016, 156, 491–499. [Google Scholar] [CrossRef]
- Vera, C.M.; Vizcarra, M.G. Concentration-dependent moisture diffusion coefficient estimation in peas drying considering shrinkage: An observer approach. Biosyst. Eng. 2022, 218, 256–273. [Google Scholar] [CrossRef]
- Chen, C.; Venkitasamy, C.; Zhang, W.P.; Khir, R.; Upadhyaya, S.; Pan, Z.L. Effective moisture diffusivity and drying simulation of walnuts under hot air. Int. J. Heat. Mass. Tran. 2020, 150, 119283. [Google Scholar] [CrossRef]
- Li, L.; Mao, B.Q.; Zeng, Y.; Tang, Y.R.; Man, X.L.; Fan, X.W.; Zhang, Y.C.; Zhang, H. Experimental study on crack irregularity of hollow shell particle under impact loading. Powder Technol. 2023, 427, 118704. [Google Scholar] [CrossRef]
- Dak, M.; Pareek, N.K. Effective moisture diffusivity of pomegranate arils under going microwave-vacuum drying. J. Food Eng. 2014, 122, 117–121. [Google Scholar] [CrossRef]
- Crank, J. The Mathematics of Diffusion; Oxford University Press: Oxford, UK, 1977. [Google Scholar]
- Dincer, I.; Hussain, M.M. Development of a new Bi-Di correlation for solids drying. Int. J. Heat. Mass. Tran. 2002, 45, 3065–3069. [Google Scholar] [CrossRef]
- Dincer, I. Development of a new number (the Dincer number) for forcedconvection heat transfer in heating and cooling applications. Int. J. Energy Res. 1996, 20, 419–422. [Google Scholar] [CrossRef]
- Fiorentini, C.; Demarchi, S.M.; Ruiz, N.A.Q.; Irigoyen, R.M.T.; Giner, S.A. Arrhenius activation energy for water diffusion during drying of tomato leathers: The concept of characteristic product temperature. Biosyst. Eng. 2015, 132, 39–46. [Google Scholar] [CrossRef]
- Darvishi, H.; Mohammadi, P.; Azadbakht, M.; Farhudi, Z. Effect of different drying conditions on the mass transfer characteristics of kiwi slices. J. Agr. Sci. Technol. 2018, 20, 249–264. Available online: https://jast.modares.ac.ir/article-23-10509-en.html (accessed on 10 October 2021).
- Yu, H.M.; Li, H.Y.; Zhang, X.Y.; Wang, H.Y.; Sun, Y. Drying kinetic model of microwave coupled with hot air drying of straw-based nutrient seedling-growing bowl tray. Trans. CSAM 2020, 51, 339–348. [Google Scholar] [CrossRef]
- Ishibashi, R.; Numata, T.; Tanigawa, H.; Tsuruta, T. In-situ measurements of drying and shrinkage characteristics during microwave vacuum drying of radish and potato. J. Food Eng. 2022, 323, 110988. [Google Scholar] [CrossRef]
- Zhou, Y.H.; Staniszewska, I.; Liu, Z.L.; Zielinska, D.; Xiao, H.W.; Pan, Z.L.; Nowak, K.W.; Zielinska, M. Microwave-vacuum-assisted drying of pretreated cranberries: Drying kinetics, bioactive compounds and antioxidant activity. LWT-Food Sci. Technol. 2021, 146, 111464. [Google Scholar] [CrossRef]
- Lu, Y.J.; Ren, G.Y.; Duan, X.; Zhang, L.D.; Ling, Z.Z. Moisture migration properties and quality changes of fresh in-shell peanuts during hot air drying. Food Sci. 2020, 41, 86–92. [Google Scholar] [CrossRef]
- Venkitasamy, C.; Zhu, C.; Brandl, M.T.; Niederholzer, F.J.A.; Zhang, R.; Mchugh, T.H.; Pan, Z. Feasibility of using sequential infrared and hot air for almond drying and inactivation of Enterococcus faecium NRRL B-2354. LWT Food Sci. Technol. 2018, 95, 123–128. [Google Scholar] [CrossRef]
- Chen, Y.N.; Li, M.; Dharmasiri, T.S.K.; Song, X.Y.; Liu, F.; Wang, X. Novel ultrasonic-assisted vacuum drying technique for dehydrating garlic slices and predicting the quality properties by low field nuclear magnetic resonance. Food Chem. 2020, 306, 125625. [Google Scholar] [CrossRef]
- Shen, L.Y.; Zhu, Y.; Liu, C.H.; Wang, L.; Liu, H.; Kamruzzaman, M.; Liu, C.; Zhang, Y.P.; Zheng, X.Z. Modelling of moving drying process and analysis of drying characteristics for germinated brown rice under continuous microwave drying. Biosyst. Eng. 2020, 195, 64–88. [Google Scholar] [CrossRef]
- Chen, A.Q.; Achkar, G.E.; Liu, B.; Bennacer, R. Experimental study on moisture kinetics and microstructure evolution in apples during high power microwave drying process. J. Food Eng. 2020, 29, 110362. [Google Scholar] [CrossRef]
- Ni, J.; Ding, C.; Zhang, Y.; Song, Z.; Hu, X.; Hao, T. Electrohydrodynamic Drying of Chinese Wolfberry in a Multiple Needle-to-Plate Electrode System. Foods 2019, 8, 152. [Google Scholar] [CrossRef] [PubMed]
- Jiang, C.; Wan, F.; Zang, Z.; Zhang, Q.; Ma, G.; Huang, X. Effect of an Ultrasound Pre-Treatment on the Characteristics and Quality of Far-Infrared Vacuum Drying with Cistanche Slices. Foods 2022, 11, 866. [Google Scholar] [CrossRef] [PubMed]
- Mirzaei-Baktash, H.; Hamdami, N.; Torabi, P.; Fallah-Joshaqani, S.; Dalvi-Isfahan, M. Impact of different pretreatments on drying kinetics and quality of button mushroom slices dried by hot-air or electrohydrodynamic drying. LWT-Food Sci. Technol. 2022, 155, 112894. [Google Scholar] [CrossRef]
- Wiktor, A.; Dadan, M.; Nowacka, M.; Rybak, K.; Witrowa-Rajchert, D. The impact of combination of pulsed electric field and ultrasound treatment on air drying kinetics and quality of carrot tissue. LWT-Food Sci. Technol. 2019, 110, 71–79. [Google Scholar] [CrossRef]
- Xiao, A.; Ding, C. Effect of electrohydrodynamic (EHD) on drying kinetics and quality characteristics of shiitake mushroom. Foods 2022, 11, 1303. [Google Scholar] [CrossRef] [PubMed]
- Yu, F.; Yang, Z.; Tao, Z.C.; Yong, Z.Y. Optimization of pea seed intermittent drying assisted with ultrasound technology. Int. J. Food Eng. 2020, 16, 20190225. [Google Scholar] [CrossRef]
- Perazzini, H.; Leonel, A.; Perazzini, M.T.B. Energy of activation, instantaneous energy consumption, and coupled heat and mass transfer modeling in drying of sorghum grains. Biosyst. Eng. 2021, 210, 181–192. [Google Scholar] [CrossRef]
- An, N.N.; Lv, W.Q.; Li, D.; Wang, L.J.; Wang, Y. Effects of hot-air microwave rolling blanching pretreatment on the drying of turmeric (Curcuma longa L.): Physiochemical properties and microstructure evaluation. Food Chem. 2023, 398, 133925. [Google Scholar] [CrossRef] [PubMed]
- Wang, H.; Fang, X.M.; Sutar, P.P.; Meng, J.S.; Wang, J.; Yu, X.L.; Xiao, H.W. Effects of vacuum-steam pulsed blanching on drying kinetics, colour, phytochemical contents, antioxidant capacity of carrot and the mechanism of carrot quality changes revealed by texture, microstructure and ultrastructure. Food Chem. 2021, 338, 127799. [Google Scholar] [CrossRef] [PubMed]
- Shen, L.Y.; Wang, L.; Zheng, C.Y.; Liu, C.H.; Zhu, Y.; Liu, H.; Liu, C.; Shi, Y.K.; Zheng, X.Z.; Xu, H. Continuous microwave drying of germinated brown rice: Effects of drying conditions on fissure and color, and modeling of moisture content and stress inside kernel. Dry. Technol. 2020, 39, 669–697. [Google Scholar] [CrossRef]
- Silva, E.S.D.; Brando, S.C.R.; Silva, A.L.D.; Silva, J.H.F.D.; Coêlho, A.C.D.; Azoubel, P.M. Ultrasound-assisted vacuum drying of nectarine. J. Food Eng. 2019, 246, 119–124. [Google Scholar] [CrossRef]
- Zhou, M.; Cong, L.; Bi, J.F.; Jin, X.; Lyu, J.; Li, X. Towards understanding the enhancement of moisture diffusion during intermediate-infrared drying of peach pomace based on the glass transition theory. Innov. Food Sci. Emerg. Technol. 2019, 54, 143–151. [Google Scholar] [CrossRef]
Disclaimer/Publisher’s Note: The statements, opinions and data contained in all publications are solely those of the individual author(s) and contributor(s) and not of MDPI and/or the editor(s). MDPI and/or the editor(s) disclaim responsibility for any injury to people or property resulting from any ideas, methods, instructions or products referred to in the content. |
© 2024 by the authors. Licensee MDPI, Basel, Switzerland. This article is an open access article distributed under the terms and conditions of the Creative Commons Attribution (CC BY) license (https://creativecommons.org/licenses/by/4.0/).