Abstract
The depth of shallow groundwater significantly influences crop growth and yield by altering the physicochemical properties of farmland soil profiles. Concurrently, shallow groundwater is subject to various changes, and it remains unclear how alterations in shallow groundwater depth within field soil impact soil physicochemical properties, crop yields, and the overall dynamics of groundwater transformations. To address these uncertainties, this study utilized a sample plot equipped with a volume lysimeter and implemented four distinct groundwater depths as treatment conditions: G0 (no groundwater depth), G1 (a groundwater depth of 40 cm), G2 (a groundwater depth of 70 cm), G3 (a groundwater depth of 110 cm), and G4 (a groundwater depth of 150 cm). This study was carried out on a weekly basis to monitor fluctuations in ion content in shallow groundwater and soil moisture after the summer maize harvest, and special attention was afforded to non-irrigation conditions. This study also scrutinized the distribution of salt and nutrients in soil profiles and assessed changes in summer maize yield. Very interesting findings were obtained by conducting the study. Firstly, the shallower the groundwater depth, the higher the water and salt content of the soil surface. Small, frequent rainfall events (precipitation ≤ 25 mm) facilitated the effective removal of salt from the soil surface. Despite increased rainfall contributing to salt ion dilution in groundwater, the risk of soil surface salinization increased at the surface level. Secondly, a linear relationship existed between groundwater depth and surface soil moisture and salt content. With every 10 cm increase in groundwater depth, the surface soil moisture and salt content decreased by 0.56% and 0.06 g/kg, respectively. Soil nutrients tended to accumulate in the surface layer, with nutrient content increasing with depth. However, C/N was not notably affected by groundwater depth. Thirdly, Na+ and K+ consistently dominated the soil surface. As soil salinity increased, the prevalence of Cl− and SO42− increased, with the rate of SO42− increase surpassing that of chlorine. HCO3− altered by rainfall served as an indicator of soil alkalization characteristics, while Na+ and K+ in soil, along with Cl− and SO42− derived from groundwater, represented soil salt composition and salinization trends. Ultimately, under the conditions of this study, the most favorable groundwater depth for the growth of summer maize was determined to be 1.1 m. Analyzing the impact of different shallow groundwater depths on the physicochemical properties of farmland soil enhances our understanding of the mechanisms of interaction between groundwater and soil in agricultural ecosystems. This knowledge is instrumental in significantly improving the soil environment, thereby ensuring optimal crop yields.
1. Introduction
The groundwater level is defined as the undulating surface between the oxygen-containing soil layer and the saturated aquifer [1]. It plays a crucial role in influencing the physicochemical properties of soil and the growth of plants [2]. In situations where the groundwater level is shallow, excessive rainfall can lead to waterlogging problems, exacerbate oxygen supply, and inhibit the decomposition of soil organic matter by aerobic microorganisms. This, in turn, generates low oxygen stress in plant roots, resulting in adverse effects on plant photosynthesis and soil nutrient content [3,4]. Additionally, shallow groundwater level, even without the influence of rainfall, can impact the distribution of nutrients and salts in the soil, thereby affecting plant growth [5,6]. Conversely, groundwater serves as a significant water source for plant growth. When the groundwater level is too deep, it becomes challenging for plants to replenish water from groundwater, leading to the deterioration of the plant’s living environment and a reduction in crop yield due to water scarcity [7]. Consequently, numerous scholars have conducted investigations to determine the optimal groundwater depth for plant growth. As depicted in Table 1, some scholars have focused on studying the shallow groundwater level that is most favorable for plants in natural ecosystems. Others have explored the most suitable groundwater depth for crop growth in farmland by assessing different groundwater depths. Adjusting the groundwater depth in regional ecosystems can enhance vegetation coverage per unit area and mitigate environmental issues such as secondary soil salinization and desertification. Similarly, adjusting the groundwater level to a suitable range for crop growth in agricultural ecosystems can ameliorate the soil environment, ultimately leading to increased crop yields and improved quality.

Table 1.
The most suitable groundwater level/burial depth for plant growth in different regions.
The North China Plain is a primary grain-producing region in China, with winter wheat constituting over 60% of the national total output and summer maize contributing more than 30% [16]. Approximately 70% of the arable land in this region relies on groundwater irrigation [17,18]. Unfortunately, due to extensive groundwater extraction, the North China Plain stands out as one of the areas that is most severely affected by groundwater depletion globally [19]. However, efforts have been made to address this issue through the implementation of groundwater overexploitation remediation measures and the South-to-North Water Diversion Project. Between 2015 and 2017, there was an annual reduction in groundwater mining output of about 1.3 km3 in the North China Plain. Additionally, from 2015 to 2019, the East Route Project of the South-to-North Water Diversion Project transported approximately 23.9 km3 of groundwater to the North China Plain [20]. Notably, in the Shandong area of the North China Plain, both deep and shallow groundwater levels have been steadily rising due to the ecological water supplement effect of the South-to-North Water Diversion Project [21]. While this has positively contributed to groundwater conservation, careful attention must be given to the potential impact of changes in soil physicochemical properties on agricultural production.
The physicochemical properties of soil are closely related to the depth of groundwater, as noted in previous studies [9]. Groundwater depth plays a significant role in influencing soil moisture levels. In a humid environment, there is an acceleration of the mineralization process of organic matter, fostering microbial activity and reducing the accumulation of organic carbon [22]. Conversely, excessive soil moisture can diminish the supply of oxygen in the soil, inhibiting the activity of aerobic microorganisms, slowing down the decomposition of organic matter, and leading to increased organic carbon accumulation [4]. A continuous high groundwater depth in moist soil conditions is more conducive to the leaching of NO3− N into groundwater [23]. Conversely, soil dryness stimulates the mineralization of nitrogen (N) and reduces its denitrification, thereby increasing the effectiveness of nitrogen and promoting the release of potassium into the soil [24]. The salt content in groundwater is a principal factor influencing the migration, accumulation, and release of soil salt. Variations in groundwater depth and evaporation are key factors influencing salt entry into shallow soil [25]. Shallow groundwater, through capillary rise, not only provides water for plants but also continuously transports salt into the root zone. Following water evaporation, salt accumulates in the root zone or on the soil surface [26]. During summer, characterized by robust evapotranspiration and frequent rainfall, the groundwater depth exhibits a pattern of repeated fluctuations. This dynamic process contributes to the complex interplay of salt content in both groundwater and soil, involving alternating phases of dilution and concentration [27,28]. Consequently, these variations impact the physicochemical properties of the soil, thereby influencing plant growth. Currently, the literature on the influence of groundwater depth on the physicochemical properties of farmland soil is predominantly centered on arid and semi-arid regions, with most investigations emphasizing large-scale spatial alterations. There is a scarcity of quantitative studies concerning farmland soil, particularly regarding variations in groundwater properties under different depths in the relatively humid farmlands of the North China Plain. Furthermore, the ramifications for soil physicochemical properties and crop yield remain unclear. Adjusting groundwater depth presents an opportunity for more effective soil management in the field, potentially leading to increased crop yields [29].
To enhance the quantitative analysis of how shallow groundwater depths influence the physicochemical properties of agricultural soils in the North China Plain, our study relied on the lysimeter sample plots at the Yucheng Comprehensive Experimental Station, Chinese Academy of Sciences. To investigate the impact of varying groundwater burial depths, this study focused on three key aspects: (1) analyzing the changes in soil physicochemical properties; (2) assessing the variations in crop yields; and (3) examining the shifts in major salt ions in shallow groundwater and their influence on soil salinity. This study aims to provide a theoretical foundation for understanding the potential changes in the North China Plain’s farmland ecosystem due to fluctuations in shallow groundwater levels in the region and offer insights into potential management measures.
2. Materials and Methods
2.1. Study Area
Our study was conducted at an altitude of 20 m at the Yucheng Comprehensive Experimental Station, Chinese Academy of Sciences, situated in the southwest of Yucheng, Dezhou City, Shandong Province (116°36′ E and 36°57′ N) (Figure 1). The research area falls within the temperate semi-arid monsoon climate zone, characterized by abundant sunlight and heat. The annual average temperature is 13.4 °C, with an annual average precipitation of 567 mm and an annual evaporation of 1100 mm. Precipitation is unevenly distributed throughout the year, with June to September accounting for 72.1% of the annual precipitation, while the period from October to May of the following year contributes 27.9% to the total annual precipitation [30]. The soil in this region primarily consists of silt and light soil, and the predominant cultivation system revolves around a winter wheat/summer maize rotation.
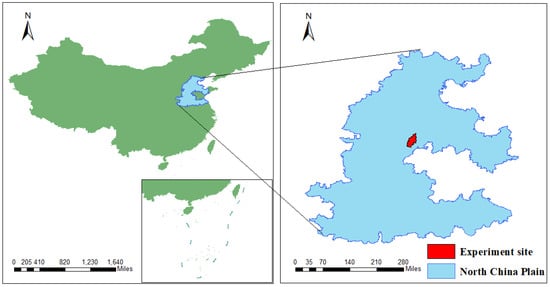
Figure 1.
The location of the study area.
2.2. Volumetric Lysimeter System
Volumetric lysimeter systems, first constructed in 1988, comprise an external soil container and an internal drainage system. Each soil container is constructed from a 5 mm steel plate with a 1 m2 square cross section. It has a height of 1.9 m underground and 0.1 m above ground and has a bottom sealing. A 0.3-m filter layer at the bottom of the container, consisting of a mixture of gravel and sand, ensures proper drainage. The soil employed is calcareous fluvial soil with the following composition: 13.63% sand, 81.50% silt, 4.87% clay, and a salt content ranging between 0.98 and 1.03 g/kg. A soil column is uniformly filled with the original silt, possessing a bulk density of 1.42 g/cm³, extending above the filter layer. Figure 2 illustrates the design of the experimental lysimeter. The basement, reaching a depth of approximately 2 m, accommodates the water supply and drainage systems as well as the observation installations. A drainage pipe is installed in the filter layer, connected to the Mariotte bottle via a balance cup, supplying water with a salinity of 1.5 g/L to stabilize the groundwater depth in the soil container [30]. During the rainy season, surplus water in the soil can be discharged through the balance cup to maintain a stable groundwater depth. The daily evaporated groundwater was determined by measuring the amount of water supplied to the soil container and recording the change in height of the water surface in the Mariotte bottle. For groundwater sampling, a water sample collector was strategically positioned at the groundwater burial depth, facilitating the regular collection of groundwater samples.
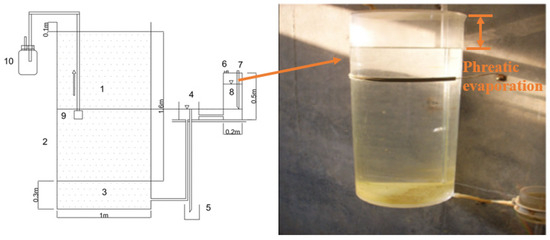
Figure 2.
Design of the lysimeter used for the experiment (1: filling soil; 2: soil container; 3: filter bed; 4: Mariotte bottle; 5: drainage tank; 6: valve; 7: air inlet pipe; 8: water supplement bottle; 9: water collector; 10: sampling bottle).
2.3. Experiment Design
The experiment was initiated on 16 July 2022, and 25 June 2023, over a 15-day period for groundwater replenishment. The composition of the groundwater is detailed in Table 2. Following the stabilization of groundwater depth, sampling activities were conducted every Monday for a total of 11 and 12 weeks in 2022 and 2023, respectively. The crop chosen for cultivation was summer maize, with a growth cycle of approximately 120 days. Farming and sowing were performed on the same day with a planting density of 8 plants/m2 and a row spacing of 50 cm. On 9 August 2022, and 22 July 2023, 276 kg of N ha−1 urea (CH4N2O) was applied to the soil surface in a single topdressing manner. Notably, this experiment did not involve irrigation during the maize’s growth period. The study utilized 12 volume lysimeters, designated as G0 (no groundwater depth; three replicates), G1 (a groundwater depth of 40 cm; two replicates), G2 (a groundwater depth of 70 cm; two replicates), G3 (a groundwater depth of 110 cm; two replicates), and G4 (a groundwater depth of 150 cm; three replicates). The number of replicates adhered to the aforementioned lysimeter design, which has been consistent since 1988, ensuring the reliability of the experiment. The layout of the experiment is illustrated in Figure 3.
Table 2.
Supplementary water hydrochemical parameters.
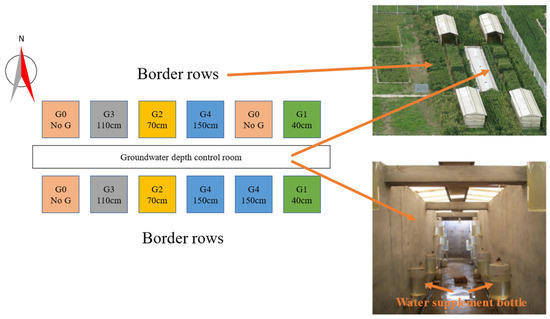
Figure 3.
Experimental layout (G0: no groundwater; G1: a groundwater depth of 40 cm underground; G2: a groundwater depth of 70 cm underground; G3: a groundwater depth of 110 cm underground; G4: a groundwater depth of 150 cm underground).
2.4. Sampling Methods and Data Collection
2.4.1. Daily Evaporation and Leakage Replenishment
The daily evaporation was determined by recording changes in the water surface height in the Mariotte bottle (Figure 3), and the height of the water surface drop in the Mariotte bottle was recorded from 8:00 to 9:00 every day.
The formula used to calculate the daily evaporation is as follows:
where ET is the daily evaporation (mm/d); R is the radius of the Mariotte bottle (mm); h is the daily drop height in the Mariotte bottle (mm); and S is the cross-sectional area of the volume lysimeter (mm2).
2.4.2. Meteorological Data
The meteorological data used came from an automatic meteorological station (China, DZZ5) located 50 m away from the experimental site. The meteorological data included information on rainfall and the daily average temperature.
2.4.3. Determination of Groundwater and Its Chemical Indicators
A total of 100 mL of groundwater was collected once a week, and the content of each ion was measured. Through 0.45 μm filter membrane filtration, HCO3− was determined using the dual-indicator neutralization method (GB7871-87), and Na+, K+, Ca2+, Mg2+, Cl−, NO3−, and SO42− concentrations were determined using ion chromatography (ICS-900, Thermo Scientific, Waltham, MA, USA) and a spectrometer (ICP-OES, Agilent, Santa Clara, CA, USA).
2.4.4. Determination of Soil and Its Chemical Indicators
After the maize harvest, soil samples were collected at various depths—0–20, 20–40, 40–70, 70–110, and 110–150 cm—by employing the soil drilling method. Soil moisture content (SWC) was determined using the drying method (ISO11465-1993). Following natural air drying, the soil samples were brought to the laboratory, homogeneously mixed, compacted, and subsequently sifted through a 1 mm sieve. Upon sieving, the soil was divided into mass ratios of 1:5. An extraction solution with a soil-to-water ratio of 5 was prepared (GB7871-87), and soil conductivity was measured using a water quality analyzer (HACH-HQ40d, HACH, Loveland, CO, USA). Salt ions were identified using ion chromatography (ICS-900, Thermo Scientific) and a spectrometer (ICP-OES, Agilent). Soil organic carbon content (SOC), soil total nitrogen content (STN), and soil C/N were determined using an elemental analyzer (vario MACRO cube, Elemental, Langenselbold, Germany). Additionally, the total phosphorus (STP) content in the soil was assessed using alkaline fusion molybdenum antimony impedance spectrophotometry (GB7852-87).
Soil salinity (SSC) was calculated based on the empirical relationship between SSC and EC (dS/m), as established by Wang et al. [31]:
SSC = 2.18 × EC + 0.727, R2 = 0.9387
2.4.5. Maize Dry Matter Accumulation
On a sunny day, after the summer maize had been harvested, the straw, grains, and maize stalks were placed separately in an oven at 105 °C for 30 min to undergo greenification. The temperature was then adjusted to 80 °C, before the materials were dried to a constant weight. The dry weight of each organ was measured individually.
2.5. Data Analysis
The study area map was created using ArcGIS 10.7. The relationship between soil surface salt ions and salinity was meticulously examined through the utilization of SPSS Spearman’s coefficient. This correlation coefficient served as a sensitivity index, enabling an in-depth analysis of the underlying mechanisms contributing to the increase in surface salinity. Plots were generated using Origin 2022.
3. Results
3.1. Meteorology and Groundwater Evaporation during the Maize Growth Season
Data regarding meteorology and groundwater evaporation during the maize growth seasons in 2022 and 2023 are depicted in Figure 4. The precipitation during the maize growth season in 2022 and 2023 was 570.4 and 363.0 mm, respectively. According to meteorological data from previous years, the typical precipitation during the maize growth season in the region is around 400 mm. Due to their significant differences in precipitation, 2022 and 2023 were classified as wet and dry years, respectively.
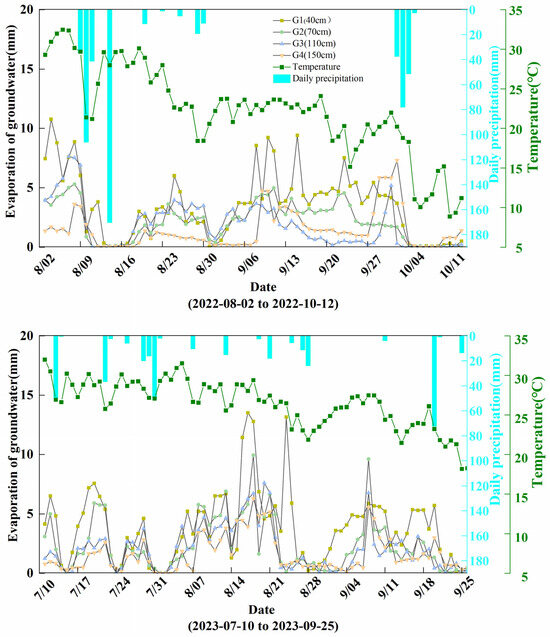
Figure 4.
Meteorology and groundwater evaporation in the maize growth periods of 2022 and 2023 from seeding to harvest.
The increase in precipitation led to a reduction in groundwater evaporation. The average groundwater evaporation for each treatment during the maize growth season in 2022 was 3.49 (G1, 40 cm), 2.11 (G2, 70 cm), 1.90 (G3, 110 cm), and 1.47 (G4, 150 cm) mm d−1. In contrast, the average groundwater evaporation for each treatment during the maize growth season in 2023 was 3.84 (G1, 40 cm), 2.38 (G2, 70 cm), 2.06 (G3, 110 cm), and 1.61 (G4, 150 cm) mm d−1. The average temperatures during the maize growth seasons of 2022 and 2023 were 22.2 and 26.5 °C, respectively.
3.2. Impact of Shallow Groundwater Depth on Soil Physicochemical Properties
3.2.1. The Influence of Shallow Groundwater Depth on Soil Moisture and Salt Content
The soil profiles for the maize harvest seasons in 2022 and 2023 are depicted in Figure 5. In 2022, the soil moisture content (SWC) exhibited a consistent trend under different burial depth treatments. As the soil depth increased, SWC initially decreased and then increased. Notably, the G1, G2, and G3 treatments displayed the lowest SWCs at a soil depth of 40 cm, while the G4 treatment group showed the lowest SWC at a soil depth of 70 cm. In the same year, the soil salinity (SSC) values of the G1, G2, and G3 treatments experienced a decrease and then stabilization with an increase in soil depth. Conversely, the SSC of the G4 treatment initially increased, then decreased, and then stabilized, with enrichment in the middle layer (40~70 cm) being observed. Moving on to 2023, the SWCs for G1 and G2 at different burial depths followed a similar pattern, initially decreasing before increasing at greater soil depths. Meanwhile, the G3 and G4 treatments showed an increase in SWC with increasing soil depth. In 2023, the SSC for the G1 and G2 treatments initially decreased and then tended to stabilize with increasing soil depth. On the other hand, the G3 and G4 treatments both exhibited an increase followed by a decrease in SSC, with enrichment concentrated in the middle layer (40~70 cm). Significant changes in SWC were observed when the groundwater depths were 110 and 150 cm, influenced by groundwater depth and capillary rise height. Salt accumulation was also noted in the middle layer under these conditions. Conversely, when the groundwater was buried at depths of 40 and 70 cm, the soil surface (0~20 cm) displayed higher water and salt content due to its shallower depth.
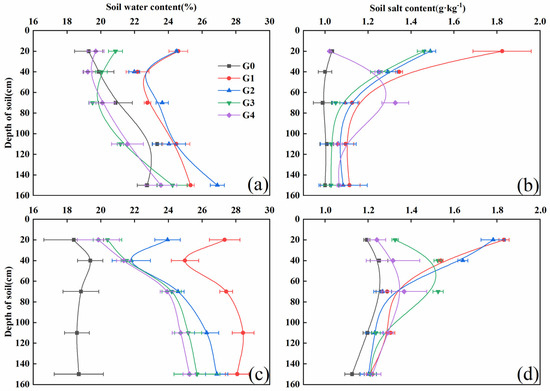
Figure 5.
Vertical profiles of the post-harvest SWC and SSC values of summer maize at different groundwater depths in 2022 and 2023 ((a): 2022 SWC; (b): 2022 SSC; (c): 2023 SWC; (d): 2023 SSC).
The SWC in the G0 treatment exceeded that in the G3 and G4 treatments at soil depths of 70 and 110 cm. This phenomenon may be attributed to the rainfall during the later stage of maize growth in 2022, leading to the accumulation of water in deeper soil layers. However, the reduction in rainfall in 2023 resulted in soil salinity surpassing the levels observed in 2022. Additionally, small and frequent rainfall events contributed to salt accumulation in G3 at depths of 70~110 cm. This observation underscores the significant impact of climate change on soil salt content. Importantly, it suggests that large rainfall events occurring over a short period may not substantially influence the final accumulation of salt in the soil.
3.2.2. Influence of Shallow Groundwater Depth on Soil Nutrient Content
Figure 6 illustrates the values pertaining to soil nutrient content for the years 2022 and 2023. Notably, soil organic matter (SOC), total nitrogen (STN), and total phosphorus (STP) exhibited a declining pattern with greater soil depth. Concurrently, the soil C/N ratios demonstrate an upward trend with increasing soil depth. Interestingly, as the groundwater depth increased, there was an observable upward trajectory in SOC, TN, TP, and C/N specifically within the 0~20 cm soil layer.
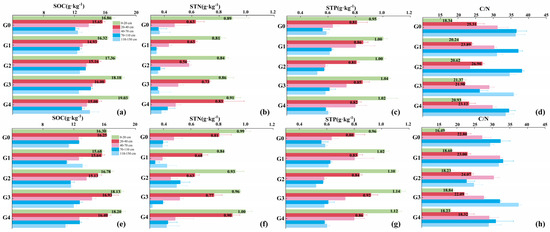
Figure 6.
Nutrient content and C/N ((a): 2022 SOC; (b): 2022 STN; (c): 2022 STP; (d): 2022 C/N. (e): 2023 SOC; (f): 2023 STN; (g): 2023 STP; (h): 2023 C/N) of soil profiles during summer maize maturity under different groundwater depths in 2022 and 2023.
3.2.3. Ionic Characteristics of Soil Salinity
As depicted in Table 3, the concentrations of conventional ions (Na+, K+, Ca2+, Mg2+, Cl−, NO3−, SO42−, and HCO3−) in the soil increased with increasing salt content in the surface layer of the soil (0~20 cm) from no groundwater depth to a groundwater depth of 40 cm. With the exception of Mg2+, the concentrations of the other ions exhibited an increase. Specifically, Na+, K+, Ca2+, Cl−, NO3−, SO42−, and HCO3− showed increases of 105.9, 16.87, 13.47, 30.74, 89.07, and 137.6 mg/kg, respectively. The rate of change for each ion followed the following sequence: HCO3− > Na+ + K+ > SO42− > NO3− > Ca2+ > Cl− > Mg2+.
Table 3.
Ion concentrations in the soil surface layer (0~20 cm) at different groundwater depths during the summer maize harvest seasons of 2022 and 2023.
As shown in Figure 7, alterations in the correlation between surface salt ions (Na+, K+, Ca2+, Mg2+, Cl−, NO3−, SO42−, and HCO3−) and surface soil salinity were used as indicators of ion sensitivity to scrutinize the mechanism underlying heightened soil surface salinity under varying groundwater depths. The correlation coefficients between soil salinity and Na+ and K+ hovered around 0.90 (p < 0.05). Conversely, in the G0 group, i.e., the no groundwater depth treatment group, the correlation between Ca2+, Mg2+, NO3−, HCO3−, and soil salinity was notably high, with values of 0.778, 0.91, 0.80, and 0.63, respectively (p < 0.05). With an increase in groundwater depth, there was a significant decrease in the correlation coefficient. Specifically, the correlation coefficient between soil surface salinity and Cl− and SO42− gradually increased with increasing salinity, with SO42− demonstrating a higher sensitivity to soil salinity. Furthermore, in the G0 group without groundwater depth treatment, a robust correlation existed between soil salinity and HCO3−. However, as groundwater depth decreased, the correlation coefficient rapidly diminished, signifying that HCO3− was exceedingly sensitive to changes in soil salinity. In summary, the primary ions influencing soil salinity in the absence of groundwater depth were Na+ + K+, Ca2+, Mg2+, NO3−, and HCO3−. As burial depth increased and salinity escalated, the dominance of Na+ + K+, Cl−, and SO42− became more pronounced. The sensitivity of each ion to soil salinity followed the following sequence: HCO3− > SO42− > Ca2+ > Cl− > Mg2+ > NO3− > Na+ + K+.
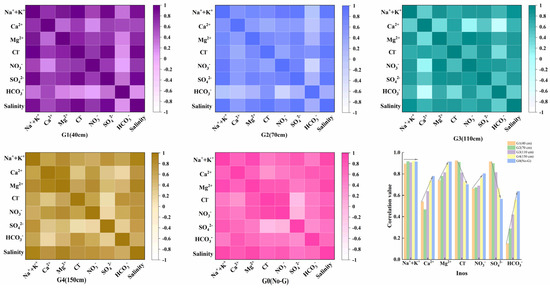
Figure 7.
Heat map and ion sensitivity map of the correlation between surface soil salinity and conventional ions under different burial depths in the study area.
3.3. Shallow Groundwater Depth Affects Crop Dry Matter Accumulation
Figure 8 illustrates the dry matter accumulation in various parts of maize for the years 2022 and 2023. In summer maize, the lowest dry matter accumulation values for 2022 and 2023 were 3.71 and 2.18 kg/m2, respectively, when the groundwater depth was 0.4 m. Conversely, the highest accumulation was observed at 4.54 and 3.75 kg/m2 for 2022 and 2023, respectively, when the groundwater depth was 1.1 m. The variation in the results may be attributed to the frequent rainfall in 2023, which had dual impacts. On the one hand, it could have resulted in overly saturated soil, elevating the susceptibility of maize plants to root rot and diseases. On the other hand, it might have hindered the pollination process, potentially diminishing crop yields. The different groundwater depths exerted a notable influence on the dry matter accumulation of both maize straw and grains, while their influence on the maize axis was minimal. During the summers of 2022 and 2023, the maize yields reached optimal levels at a groundwater depth of 1.1 m, with yields of 1.52 and 1.50 kg/m2, respectively. Consequently, this study highlights that a groundwater depth of 1.1 m is the most favorable for the accumulation of dry matter in maize grains, leading to optimal yields and favorable growth conditions for summer maize.
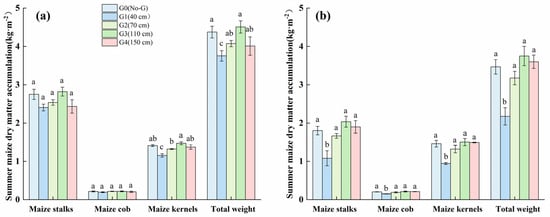
Figure 8.
Accumulation of dry matter in various parts of summer maize harvested at different groundwater depths in 2022 and 2023, different letters within the same indicator show significance, and similar letters are not significant at p < 0.05 after one-way ANOVA ((a): 2022; (b): 2023).
3.4. Relationship between Groundwater Depth, Surface Soil Physicochemical Properties, and Summer Maize Yield
The interrelation between the physicochemical characteristics of the surface soil and the yield of summer maize within the designated study area across the years 2022 and 2023 is delineated in Figure 9. The analysis revealed that the moisture content of the surface soil (0~20 cm depth) exhibited a direct linear correlation with the groundwater depth, encapsulated by the equation y = −0.056x + 27.35 (R2 = 0.9033, p < 0.05). Specifically, an increase of 10 cm in the groundwater depth (x) corresponded to a decrease of 0.56% in the surface soil moisture content (y). Similarly, surface soil salinity and the groundwater depth demonstrated a linear association, expressed through the equation y = −0.006x + 2.08 (R2 = 0.9997, p < 0.05), where a 10 cm elevation in groundwater depth (x) led to a 0.06 g/kg reduction in the surface soil salinity (y). Furthermore, a linear relationship was observed between the surface soil total nitrogen content and the groundwater depth, described by the equation y = 0.0012x + 0.79 (R2 = 0.97, p < 0.05), with a 10 cm rise in groundwater depth (x) resulting in an increase of 0.012 g/kg in the surface soil total nitrogen content (y).
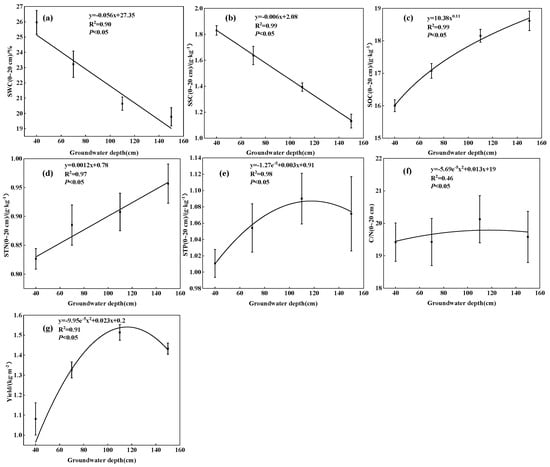
Figure 9.
The fitting relationship between groundwater depth, surface soil physicochemical properties, and summer maize yield ((a): SWC; (b): SSC; (c): SOC; (d): STN; (e): STP; (f):C/N; (g): yield).
Contrastingly, the correlation between surface soil organic carbon content and groundwater depth was characterized by a nonlinear relationship, formulated as y = 10.38x0.11 (R2 = 0.99, p < 0.05). This implies that the augmentation in surface soil organic carbon content (y) decelerated with an increase in groundwater depth (x). The surface soil total phosphorus content, the surface soil carbon-to-nitrogen (C/N) ratio, and the yield of summer maize all exhibited nonlinear correlations with groundwater depth, which can be described by the quadratic functions y = −1.27e−5x2 + 0.003x + 0.91 (R2 = 0.982, p < 0.05), y = −5.69e−5x2 + 0.013x + 19 (R2 = 0.46, p < 0.05), and y = −9.95e−5x2 + 0.023x + 0.2 (R2 = 0.91, p < 0.05), respectively. These findings elucidate that, with an increase in the groundwater depth, the surface soil total phosphorus content, the C/N ratio, and the yield of summer maize initially increased but subsequently decreased, peaking at a groundwater depth of approximately 110 cm.
3.5. Ion Variations in Shallow Groundwater
3.5.1. Time Variation of Ion Content in Shallow Groundwater with Different Burial Depths
By examining the variation characteristics of the main ions (Na+, Ca2+, Mg2+, K+, Cl−, NO3−, SO42−, and HCO3−) in the shallow groundwater of the study area (Figure 10 and Figure 11), we determined that, during maize growth, ion concentrations were primarily influenced by atmospheric precipitation, evaporation, and fertilization. The homogeneous soil within the lysimeter’s soil column exhibited a robust infiltration replenishment capacity, with shallower burial depths demonstrating heightened sensitivity to atmospheric precipitation. Based on the classification standards for precipitation intensity [32], the rainfall events during the 2022 and 2023 maize growth seasons were sorted into five categories: light rainfall (P < 10 mm), medium rainfall (10 ≤ P < 25 mm), heavy rainfall (25 ≤ P < 50 mm), rainstorm (50 ≤ P < 100 mm), and heavy rainstorm (P ≥ 100 mm). Table 4 illustrates that on 9 August and 13 August 2022, the recorded rainfall amounted to 106.1 and 170.4 mm, respectively. After heavy rainfall, the concentrations of Na+, Mg2+, Ca2+, Cl−, and SO42− ions decreased due to the diluting effect of precipitation. Conversely, in evaporation conditions, the concentration of these ions increased, with a more rapid rise being observed at shallower depths. The initial concentration of K ions was relatively low, making their concentration changes less noticeable under the effects of both dilution from heavy rainfall and concentration due to evaporation (Figure 10). From an interannual perspective, although rainfall was more frequent in 2023 compared to 2022, the study area was predominantly subjected to light and medium rainfall (Table 4). The total rainfall during the maize growth period in 2022 surpassed that of 2023, exerting a more pronounced dilution effect on shallow groundwater and consequently yielding lower ion concentrations compared to 2023. The elevated presence of NO3− in shallow groundwater was attributed to the application of nitrogen fertilizer in farmlands. Notably, the shallower the burial depth, the quicker it attained its peak concentration. This observation underscores that shallower groundwater depths exhibit greater sensitivity in ion concentration to changes in the external environment.
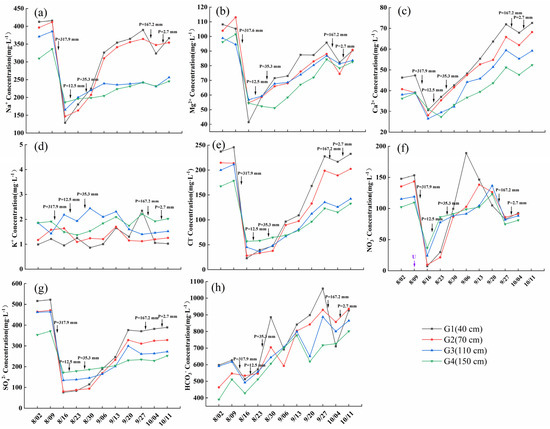
Figure 10.
Changes in groundwater ion content at different depths in 2022 ((a): Na+ content change; (b): Mg2+ content change; (c): Ca2+ content change; (d): K+ content change; (e): Cl− content change; (f): NO3− content change; (g): SO42− content change; (h): HCO3− content change. U represents urea application; P represents weekly cumulative rainfall).
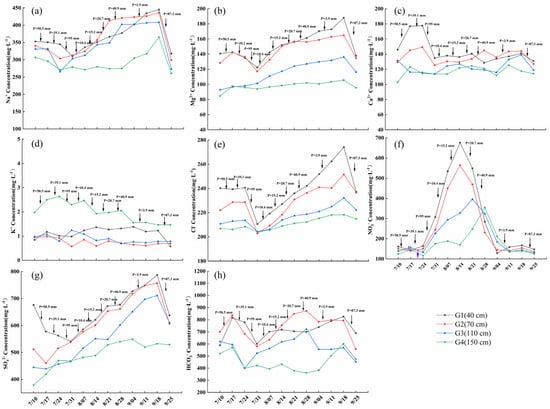
Figure 11.
Changes in groundwater ion content at different shallow depths in 2023 ((a): Na+ content change; (b): Mg2+ content change; (c): Ca2+ content change; (d): K+ content change; (e): Cl− content change; (f): NO3− content change; (g): SO42− content change; (h): HCO3− content change. U represents urea application; P represents weekly cumulative rainfall).
Table 4.
Different precipitation events and levels during the maize growth periods in 2022 and 2023.
3.5.2. Changes in Ion Types in Groundwater
Based on the disparities in groundwater evaporation and rainfall among the treatment groups, the 2022 and 2023 summer maize growth seasons can be categorized into three distinct periods: period I, characterized by precipitation exceeding evaporation; the evaporation-dominant period; and period II, also marked by precipitation surpassing evaporation(Table 5). This classification enables a comparative analysis of the changes in ion types within the shallow groundwater during each phase.
Table 5.
The three different periods of the summer maize growth seasons in 2022 and 2023.
In 2022, the initial groundwater ion composition was Na-Cl·SO4. Subsequently, the impact of rainfall (P = 400.5 mm) in the study area triggered a reaction between increased water in the soil and CaCO3, resulting in the generation of more HCO3−. Consequently, the ion composition transitioned towards Na-HCO3. Throughout the period of evaporation surpassing precipitation, the Na-HCO3 ion composition gradually stabilized. While the ion composition did not change post-rainfall in the study area, the supplementation of brackish water led to a diminishing trend in HCO3−, causing a shift in anions towards SO42− and Cl− (Figure 12). Despite frequent rainfall in 2023, the overall precipitation was considerably lower than that in 2022, maintaining the Na-Cl·SO4 ion composition (Figure 13). This substantiates that groundwater ion types are significantly influenced by diverse climates, particularly in the face of extreme precipitation events such as heavy rainstorms.
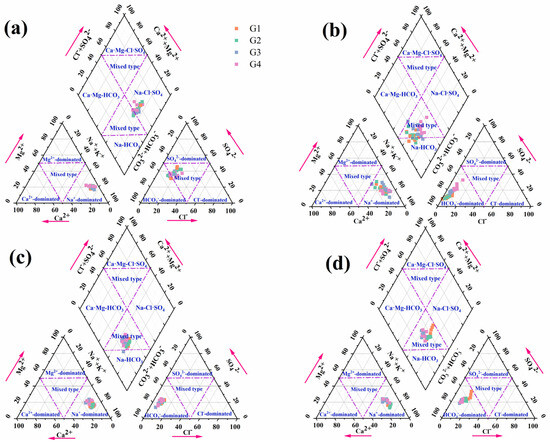
Figure 12.
Changes in groundwater ion types in 2022 ((a): initial chemical composition of groundwater; (b): chemical composition of groundwater during the first precipitation greater than evaporation (period I); (c): chemical composition of groundwater during the evaporation greater than precipitation period (evaporation-dominant period); (d): chemical composition of groundwater during the second precipitation greater than evaporation (period II)).
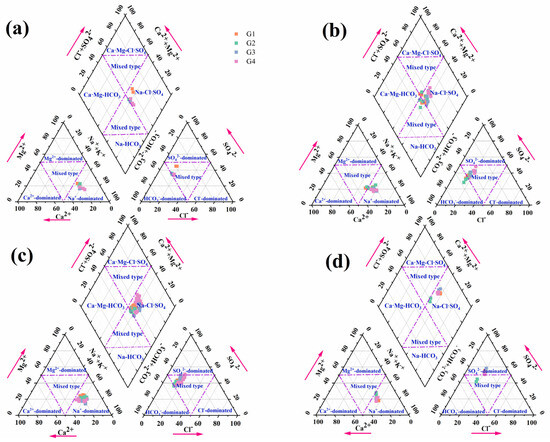
Figure 13.
Changes in groundwater ion types in 2023 ((a): initial chemical composition of groundwater; (b): chemical composition of groundwater during the first period where precipitation is greater than evaporation (period I); (c): chemical composition of groundwater during the period where evaporation is greater than precipitation (evaporation-dominant period); (d): chemical composition of groundwater during the second period where precipitation is greater than evaporation (period II)).
4. Discussion
4.1. The Response of Soil Physicochemical Properties and Crop Yield to Groundwater Depth
Groundwater depth can directly impact soil moisture content, and the accumulation of salt in the soil is a direct consequence of groundwater evaporation [33,34]. When groundwater is too shallow, the potent capillary action of the soil prompts water from the saturated zone to migrate to the unsaturated zone. This process replenishes shallow soil water and concurrently transports salt into the root zone [6]. After the water evaporates, salt accumulates on the surface. In the years 2022 and 2023, the groundwater depth increased from G4 (150 cm) to G1 (40 cm). Consequently, at 0~20 cm, the SWCs increased by 4.89% and 7.48%, respectively. The SSC also exhibited an increase, with values of 0.80 and 0.60 g/kg, respectively (Figure 5). Furthermore, for every 10 cm increase in groundwater depth, at 0~20 cm, the SWC and SSC increased by 0.56% and 0.06 g/kg, respectively (Figure 9). Previous research indicates that, in the field soil of the lower reaches of the Yellow River Delta, the maximum burial depth at which groundwater can rise and maintain soil surface moisture is 1.2 m [35]. As groundwater depth increases, the capillary action in the soil gradually weakens, leading to a decreasing trend in the amount of capillary water rising. This results in a reduction in water content reaching the soil surface and a subsequent decrease in salt content. In this study, the groundwater depths of the G1, G2, and G3 treatment groups were all above 1.2 m. Except for 2023, soil salt accumulated in the surface layer, while the G4 treatment group accumulated salt in the 40~70 cm soil layer and had significantly lower SSC values than the other treatment groups (Figure 5). Although increased rainfall can dilute the content of salt ions in groundwater (Figure 10 and Figure 11), in shallow groundwater, strong upward water flow poses a risk of soil surface salinization, even if the groundwater has a low salt content and there is no salt in the soil profile [36]. Therefore, it is imperative to keep groundwater depth below 1.1 m.
Several studies have highlighted that soil nutrients tend to concentrate in the surface layer due to the predominant accumulation of vegetation litter, root residues, and soil microorganisms in this upper stratum [37,38]. This observation aligns with the findings of our research, indicating that the nutrient content in the surface soil surpasses that in the deeper layers (Figure 6). Notably, the SOC content demonstrated an upward trend with increasing groundwater depth, showcasing a relationship that can be modeled by the following power function: y = 10.38x0.11 [Figure 9c]. Shallow groundwater levels contribute to reduced soil aeration and heightened moisture content in the surface soil. This moisture-rich environment fosters organic matter decomposition, expediting the oxidation process of organic carbon within the soil [22,39]. Simultaneously, increased moisture levels stimulate microbial activity [40,41], facilitating the decomposition of organic carbon into carbon dioxide, which is subsequently released into the atmosphere. This phenomenon is particularly evident at shallow groundwater depths of 0~20 cm. The rise in STN and STP content with increasing groundwater depth mirrored the SOC trend. Notably, approximately 95% of nitrogen (N) and 40~60% of phosphorus (P) in soil are derived from organic matter [42]. Consequently, changes in SOC content directly impact STN and STP levels as they are influenced by soil organic matter mineralization. Furthermore, when groundwater depth is excessively shallow, the N and P components in the soil become susceptible to leaching during rainfall, leading to a decrease in their respective contents. The interannual variation data revealed that the STN and STP contents in 2023 surpassed those in 2022, which can be attributed to the higher rainfall in 2022 compared to 2023 and the occurrence of extreme rainfall events (Table 4).
Different groundwater depths impact summer maize yield by influencing changes in soil physicochemical properties. Shallow burial depths may result in elevated soil moisture content, intensifying oxygen supply to the roots, and inducing low-oxygen stress in the crop roots. This, in turn, affects crop growth, leading to a reduction in crop yield. However, when soil salt ion concentrations are excessively high, soil permeability is diminished, causing osmotic stress and creating conditions where crops struggle to absorb water, resulting in physiological drought. Maintaining an optimal groundwater depth is crucial as it not only shields crops from water and salt stress but also facilitates the regulation of essential nutrients required for crop growth. This, in turn, enhances the overall growth environment for crops, ultimately improving the quality and yield of the harvest [43,44]. According to the findings of this study, the most suitable groundwater depth for the optimal growth of summer maize is within the range of 1.1~1.5 m (Figure 8).
4.2. The Relationship between Surface Salinity and Groundwater
Soil, as a crucial component within the groundwater–soil–crop–atmosphere system, significantly influences the transport of water and salts [45,46]. However, the relationship between groundwater and soil salinity is intricate, with capillary and evaporative effects in the soil promoting the upward movement of salt ions in groundwater [47]. Additionally, the infiltration of precipitation and irrigation causes the soil salts in the solution to migrate downward [48]. In the study area, the salt ions in the soil primarily originated from shallow groundwater. While there was some similarity in the compositions of the soil and groundwater ions, Na+ and K+ consistently dominated in both soil and groundwater, displaying a robust correlation with soil surface salinity (Figure 7). Notably, in the year 2022, the proportion of Ca2+ in the soil was higher than that in groundwater. Conversely, in 2023, the proportions of HCO3− and SO42− exceeded those in groundwater (Figure 12, Figure 13 and Figure 14).
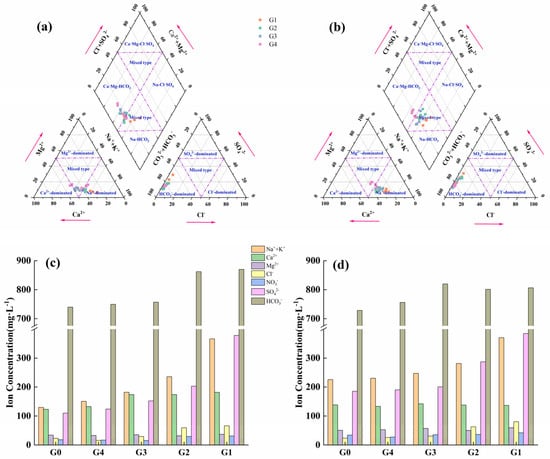
Figure 14.
Comprehensive charts depicting the soil salt ion compositions for 2022 and 2023 ((a): Piper chart of soil soluble salt ions in 2022; (b): Piper chart of soil-soluble salt ions in 2023; (c): diagram of soil-soluble salt and salinization degree in 2022; (d): diagram of soil soluble salt and salinization degree in 2023).
As shown in Figure 14c,d, the utilization of soil ions without groundwater as the baseline value led to the HCO3− content in the soil significantly surpassing that of other ions and remained relatively stable. Consequently, HCO3− played a pivotal role in soil salinity. However, the correlation between total soil salt content and HCO3− was weak, indicating that HCO3− did not dominantly influence salt changes. During the maize growth period in 2023, marked by frequent rainfall (Figure 4), HCO3− exhibited a higher proportion in soil with increased moisture content. Other ions were reduced through leaching after rainfall. As soil moisture increased and oxygen content decreased, the dissolution of CaCO3 and anaerobic respiration in the soil resulted in an elevated HCO3− content. Groundwater evaporation has a relatively minor impact on HCO3− in the soil [49,50]. Furthermore, in the absence of groundwater depth, the total soil salt content is primarily related to Ca2+, Mg2+, and NO3−. As groundwater depth increased and salt content increased, the dominance of Cl− and SO42− was heightened (Figure 7). Previous studies have suggested that SO42− and Cl− exhibit similar migration rates due to evaporation [51]. However, with increasing salt content, the rate of increase in SO42− was significantly faster than that of Cl− (Figure 12), making it more sensitive to changes in salt content than Cl− (Figure 7). This sensitivity is attributed to the strong evaporation and frequent rainfall in the study area. Multiple salt accumulation and desalination processes make SO42− more soluble in water, while chlorides do not accumulate on the soil surface. SO42− has more stable properties in the soil and is more likely to remain in the soil during high rainfall, leading to its strong accumulation on the surface. The application of urea can rapidly increase the concentration of NO3− in shallow groundwater, reaching its peak faster and at a higher level with shallower groundwater depths. However, with crop consumption and absorption, its contribution to soil salinity is not significant. In conclusion, soil salinity enrichment is not only associated with groundwater evaporation but also closely linked to rainfall. In the soils of the study area, HCO3− content changes due to rainfall can represent soil alkalization characteristics, while SO42−, Cl−, Na+, and K+ from shallow groundwater can indicate soil salt composition and salinization trends.
4.3. The Enhancement of the Environmental Quality of Soil through the Regulation of Groundwater Depth
The deterioration of soil environmental conditions poses a global challenge to socioeconomic development, particularly with regard to soil salinization [52,53]. Since the establishment of the People’s Republic of China in 1949, numerous ground drainage systems have been constructed [54]. The creation of drainage ditches provides a dual benefit, preventing water deficit and accumulation during dry and rainy seasons [55]. It also enables the adjustment of groundwater levels to enhance the soil environment, mitigating soil salinization and boosting crop yields [54]. For example, in their study in the North China Plain, Tang et al. found that jointly controlling farmland drainage through main ditches and field ditches, coupled with lowering the groundwater level, could increase the yield of maize and wheat [56]. Yao et al. discovered that appropriate agricultural ditch drainage depth in northern Jiangsu Province could effectively control the groundwater level, reducing root zone salinity [57]. Nevertheless, it is crucial to acknowledge that, during the dry season, farmland channel leakage can elevate the groundwater level, and intense evaporation may lead to the accumulation of salt on the soil surface [58]. In the rainy season, some agricultural ditches and channels may be obstructed by sedimentation, impeding the downward transportation of water and salt, resulting in upstream water and salt accumulation. Compared to open drainage ditches, buried pipe drainage proves more effective in improving the soil environment [59], emphasizing the need to reconstruct farmland drainage systems to enhance the soil environment for crop growth. Inadequate water resource management can exacerbate environmental issues relating to soil. Li suggested using a combination of surface water and groundwater, as well as regulating the groundwater level, to enhance the crop growth environment [47]. In contrast, Heng et al. utilized concealed pipes and vertical wells for drainage to improve agricultural ecosystems [60]. Determining the optimal joint water allocation ratio and employing multiple drainage methods not only reduces economic investment but also enhances the soil environment and increases crop yield. This has become a significant approach to ecological governance and achieving sustainable agricultural development. In expansive regions, enhancing the crop growth environment involves controlling the shallow groundwater level through strategies such as reservoir regulation, canal management, and the enhancement of irrigation and drainage systems [61,62]. Prior to the rainy season, drainage through river channels, agricultural ditches, and concealed pipes is employed to lower the groundwater level in fields. Employing control engineering to manage river distribution during drought and replenishing groundwater are crucial aspects [63]. The purposeful management and design of groundwater levels, considering the actual field conditions, can lead to adequate control of soil physicochemical properties and increase crop yields.
5. Conclusions
The major findings of this study are as follows:
(1) The soil surface moisture and salt content decreased with an increase in groundwater depth. For every 10 cm rise in groundwater depth, the SWC and SSC of the 0~20 cm layer decreased by 0.56% and 0.06 g/kg, respectively. Conversely, nutrient content in the 0~20 cm soil increased with groundwater depth, with nutrient levels on the soil surface surpassing those in the deeper layers.
(2) The rate of change of the soil ions in the study area as soil salinity increased followed the following sequence: HCO3− > Na+ + K+ > SO42− > NO3− > Ca2+ > Cl− > Mg2+. The sensitivity ranking of the soil ions with respect to soil salinization was as follows: HCO3− > SO42− > Ca2+ > Cl− > Mg2+ > NO3− > Na+ and K+. The alteration of HCO3− content due to rainfall can depict soil alkalization characteristics, while Na+ and K+ from the soil and SO42− and Cl− from shallow groundwater can signify soil salt composition and soil salinization trends.
(3) At a groundwater depth ranging from 1.1 to 1.5 m, the yield of summer maize tended to peak or remain relatively stable, indicating that this depth range offers the optimal soil environment for crop growth.
(4) The deeper the groundwater is buried, the less susceptible it is to the climate and human agricultural activities. Although increased rainfall can dilute the salt ions in groundwater, in cases of shallow groundwater depth, strong upward water flow can still lead to salt accumulation on the soil surface.
By implementing strategies such as reservoir regulation, canal management, and enhancements to irrigation and drainage systems, the issue of shallow groundwater level can be controlled to improve the crop growth environment, thereby enhancing crop yields.
Author Contributions
Conceptualization, X.L. and Z.L.; methodology, Z.L.; investigation, Z.L.; resources, F.L.; writing—review and editing, X.L., F.L. and W.F.; supervision, F.L.; funding acquisition, W.F. All authors have read and agreed to the published version of the manuscript.
Funding
This work was supported by the National Natural Science Foundation of China (No.U1906219).
Institutional Review Board Statement
Not applicable.
Data Availability Statement
The data that are presented in this study are available upon request from the corresponding author.
Acknowledgments
We would like to thank our colleagues at Shandong Yucheng Agro-ecosystem National Observation and Research Station for experimental support and constructive advice on this manuscript.
Conflicts of Interest
The authors declare no conflicts of interest.
References
- Fan, Y.; Li, H.; Miguez-Macho, G. Global Patterns of Groundwater Table Depth. Science 2013, 339, 940–943. [Google Scholar] [CrossRef]
- Ren, B.; Dong, S.; Liu, P.; Zhao, B.; Zhang, J. Ridge tillage improves plant growth and grain yield of waterlogged summer maize. Agric. Water Manag. 2016, 177, 392–399. [Google Scholar] [CrossRef]
- Ghobadi, M.E.; Ghobadi, M.; Zebarjadi, A. Effect of waterlogging at different growth stages on some morphological traits of wheat varieties. Int. J. Biometeorol. 2017, 61, 635–645. [Google Scholar] [CrossRef] [PubMed]
- Sahrawat, K.L. Organic matter accumulation in submerged soils. Adv. Agron. 2003, 81, 169–201. [Google Scholar]
- Abliz, A.; Tiyip, T.; Ghulam, A.; Halik, Ü.; Ding, J.-L.; Sawut, M.; Zhang, F.; Nurmemet, I.; Abliz, A. Effects of shallow groundwater table and salinity on soil salt dynamics in the Keriya Oasis, Northwestern China. Environ. Earth Sci. 2016, 75, 260–275. [Google Scholar] [CrossRef]
- Zhang, W.; Zhu, J.; Zhou, X.; Li, F. Effects of shallow groundwater table and fertilization level on soil physico-chemical properties, enzyme activities, and winter wheat yield. Agric. Water Manag. 2018, 208, 307–317. [Google Scholar] [CrossRef]
- Trillo, N.; Fernández, R.J. Wheat Plant Hydraulic Properties Under Prolonged Experimental Drought: Stronger Decline in Root-system Conductance than in Leaf Area. Plant Soil 2005, 277, 277–284. [Google Scholar] [CrossRef]
- Liu, M.; Paredes, P.; Shi, H.; Ramos, T.B.; Dou, X.; Dai, L.; Pereira, L.S. Impacts of a shallow saline water table on maize evapotranspiration and groundwater contribution using static water table lysimeters and the dual Kc water balance model SIMDualKc. Agric. Water Manag. 2022, 273, 107887. [Google Scholar] [CrossRef]
- Zhang, R.; Wu, J.; Yang, Y.; Peng, X.; Li, C.; Zhao, Q. A method to determine optimum ecological groundwater table depth in semi-arid areas. Ecol. Indic. 2022, 139, 108915. [Google Scholar] [CrossRef]
- Li, F.; Wang, Y.; Zhao, Y.; Qiao, J. Modelling the response of vegetation restoration to changes in groundwater level, based on ecologically suitable groundwater depth. Hydrogeol. J. 2018, 26, 2189–2204. [Google Scholar] [CrossRef]
- Kahlown, M.A.; Ashraf, M.; Zia-ul, H. Effect of shallow groundwater table on crop water requirements and crop yields. Agric. Water Manag. 2005, 76, 24–35. [Google Scholar] [CrossRef]
- Zhang, H.; Li, Y.; Meng, Y.-L.; Cao, N.; Li, D.-S.; Zhou, Z.-G.; Chen, B.-L.; Dou, F.-G. The effects of soil moisture and salinity as functions of groundwater depth on wheat growth and yield in coastal saline soils. J. Integr. Agric. 2019, 18, 2472–2482. [Google Scholar] [CrossRef]
- Zhao, Y.; Li, F.; Wang, Y.; Jiang, R. Evaluating the Effect of Groundwater Table on Summer Maize Growth Using the AquaCrop Model. Environ. Model. Assess. 2019, 25, 343–353. [Google Scholar] [CrossRef]
- Florio, E.L.; Mercau, J.L.; Jobbágy, E.G.; Nosetto, M.D. Interactive effects of water-table depth, rainfall variation, and sowing date on maize production in the Western Pampas. Agric. Water Manag. 2014, 146, 75–83. [Google Scholar] [CrossRef]
- Kadioglu, H.; Hatterman-Valenti, H.; Jia, X.; Chu, X.; Aslan, H.; Simsek, H. Groundwater Table Effects on the Yield, Growth, and Water Use of Canola (Brassica napus L.) Plant. Water 2019, 11, 1730. [Google Scholar] [CrossRef]
- Liang, W.L.; Carberry, P.; Wang, G.Y.; Lü, R.H.; Lü, H.Z.; Xia, A.P. Quantifying the yield gap in wheat–maize cropping systems of the Hebei Plain, China. Field Crops Res. 2011, 124, 180–185. [Google Scholar] [CrossRef]
- Moreno Méndez, E. An Argument for Weakly Magnetized, Slowly Rotating Progenitors of Long Gamma-Ray Bursts. Astrophys. J. 2013, 781, 3. [Google Scholar] [CrossRef][Green Version]
- Zhu, X.; Li, Y.; Li, M.; Pan, Y.; Shi, P. Agricultural irrigation in China. J. Soil Water Conserv. 2013, 68, 147A–154A. [Google Scholar] [CrossRef]
- de Graaf, I.E.M.; Gleeson, T.; Rens van Beek, L.P.H.; Sutanudjaja, E.H.; Bierkens, M.F.P. Environmental flow limits to global groundwater pumping. Nature 2019, 574, 90–94. [Google Scholar] [CrossRef] [PubMed]
- Zhang, C.; Duan, Q.; Yeh, P.J.-F.; Pan, Y.; Gong, H.; Moradkhani, H.; Gong, W.; Lei, X.; Liao, W.; Xu, L.; et al. Sub-regional groundwater storage recovery in North China Plain after the South-to-North water diversion project. J. Hydrol. 2021, 597, 126156. [Google Scholar] [CrossRef]
- Wang, K.; Chen, H.; Fu, S.; Li, F.; Wu, Z.; Xu, D. Analysis of exploitation control in typical groundwater over-exploited area in North China Plain. Hydrol. Sci. J. 2021, 66, 851–861. [Google Scholar] [CrossRef]
- Chaopricha, N.T.; Marín-Spiotta, E. Soil burial contributes to deep soil organic carbon storage. Soil Biol. Biochem. 2014, 69, 251–264. [Google Scholar] [CrossRef]
- Guo, H.; Li, G.; Zhang, D.; Zhang, X.; Lu, C. Effects of water table and fertilization management on nitrogen loading to groundwater. Agric. Water Manag. 2006, 82, 86–98. [Google Scholar] [CrossRef]
- Venterink, H.O.; Davidsson, T.E.; Kiehl, K.; Leonardson, L.J.P. Impact of drying and re-wetting on N, P and K dynamics in a wetland soil. Plant Soil 2002, 243, 119–130. [Google Scholar] [CrossRef]
- Seeboonruang, U. Relationship between groundwater properties and soil salinity at the Lower Nam Kam River Basin in Thailand. Environ. Earth Sci. 2012, 69, 1803–1812. [Google Scholar] [CrossRef]
- Karimov, A.K.; Šimůnek, J.; Hanjra, M.A.; Avliyakulov, M.; Forkutsa, I. Effects of the shallow water table on water use of winter wheat and ecosystem health: Implications for unlocking the potential of groundwater in the Fergana Valley (Central Asia). Agric. Water Manag. 2014, 131, 57–69. [Google Scholar] [CrossRef]
- Li, X.; Zhang, C.; Huo, Z. Optimizing irrigation and drainage by considering agricultural hydrological process in arid farmland with shallow groundwater. J. Hydrol. 2020, 585, 124785. [Google Scholar] [CrossRef]
- Yuan, C. Simulation soil water–salt dynamics in saline wasteland of Yongji Irrigation Area in Hetao Irrigation District of China. Water Supply 2021, 21, 2681–2890. [Google Scholar] [CrossRef]
- Si, G.; Yuan, J.; Xu, X.; Zhao, S.; Peng, C.; Wu, J.; Zhou, Z. Effects of an integrated rice-crayfish farming system on soil organic carbon, enzyme activity, and microbial diversity in waterlogged paddy soil. Acta Ecol. Sin. 2018, 38, 29–35. [Google Scholar] [CrossRef]
- Li, Z.; Zhang, Q.; Qiao, Y.; Leng, P.; Zhang, Q.; Du, K.; Tian, C.; Li, X.; Chen, G.; Li, F. Influence of the shallow groundwater table on the groundwater N(2)O and direct N(2)O emissions in summer maize field in the North China Plain. Sci. Total Environ. 2021, 799, 149495. [Google Scholar] [CrossRef] [PubMed]
- Wang, Q.; Jin, H.; Yuan, Z.; Yang, C. Synergetic variations of active layer soil water and salt in a permafrost-affected meadow in the headwater area of the Yellow River, northeastern Qinghai–Tibet plateau. Int. Soil Water Conserv. Res. 2022, 10, 284–292. [Google Scholar] [CrossRef]
- Liu, B.; Wang, S.; Liu, X.; Sun, H. Evaluating soil water and salt transport in response to varied rainfall events and hydrological years under brackish water irrigation in the North China Plain. Geoderma 2022, 422, 115954. [Google Scholar] [CrossRef]
- Li, X.; Xia, J.; Zhao, X.; Chen, Y. Effects of planting Tamarix chinensis on shallow soil water and salt content under different groundwater depths in the Yellow River Delta. Geoderma 2019, 335, 104–111. [Google Scholar] [CrossRef]
- Rose, D.A.; Konukcu, F.; Gowing, J.W. Effect of watertable depth on evaporation and salt accumulation from saline groundwater. Soil Res. 2005, 43, 565–573. [Google Scholar] [CrossRef]
- Zhao, X.; Xia, J.; Chen, W.; Chen, Y.P. Effect of groundwater depth on the distribution of water and salinity in the soil-Tamarix chinensis system under evaporation conditions. Acta Ecol. Sin. 2017, 37, 6074–6080. [Google Scholar]
- Li, X.; Chang, S.X.; Salifu, K.F. Soil texture and layering effects on water and salt dynamics in the presence of a water table: A review. Environ. Rev. 2014, 22, 41–50. [Google Scholar] [CrossRef]
- Yang, Y.; Sun, H.; Zhang, P.; Wu, F.; Qiao, J.; Li, T.; Wang, Y.; An, S. Review of Managing Soil Organic C Sequestration from Vegetation Restoration on the Loess Plateau. Forests 2023, 14, 1964. [Google Scholar] [CrossRef]
- Hartmann, M.; Six, J. Soil structure and microbiome functions in agroecosystems. Nat. Rev. Earth Environ. 2023, 4, 4–18. [Google Scholar] [CrossRef]
- Liu, W.; Zhang, Z.H.E.; Wan, S. Predominant role of water in regulating soil and microbial respiration and their responses to climate change in a semiarid grassland. Glob. Chang. Biol. 2009, 15, 184–195. [Google Scholar] [CrossRef]
- Huo, L.; Pang, H.; Zhao, Y.; Wang, J.; Lu, C.; Li, Y. Buried straw layer plus plastic mulching improves soil organic carbon fractions in an arid saline soil from Northwest China. Soil Tillage Res. 2017, 165, 286–293. [Google Scholar] [CrossRef]
- Yin, S.; Bai, J.; Wang, W.; Zhang, G.; Jia, J.; Cui, B.; Liu, X. Effects of soil moisture on carbon mineralization in floodplain wetlands with different flooding frequencies. J. Hydrol. 2019, 574, 1074–1084. [Google Scholar] [CrossRef]
- Su, T.Y.; Jia, B.Y.; Hu, Y.L.; Yang, Q.; Mao, W. Effects of groundwater depth on soil environmental factors and root biomass of typical plant communities in sandy grassland. Pratacult. Sci. 2021, 38, 1694–1705. [Google Scholar]
- Anuradha, M.; Sivaraju, K.; Krishnamurthy, V. Effect of waterlogging on physiological characteristics, yield and quality of flue-cured tobacco. Indian J. Plant Physiol. 2013, 18, 67–70. [Google Scholar] [CrossRef]
- Kumar, P.; Pal, M.; Joshi, R.; Sairam, R.K. Yield, growth and physiological responses of mung bean [Vigna radiata (L.) Wilczek] genotypes to waterlogging at vegetative stage. Physiol. Mol. Biol. Plants 2012, 19, 209–220. [Google Scholar] [CrossRef] [PubMed]
- Ortiz, A.C.; Jin, L. Chemical and hydrological controls on salt accumulation in irrigated soils of southwestern U.S. Geoderma 2021, 391, 114976. [Google Scholar] [CrossRef]
- Zhang, Q.; Qian, H.; Xu, P.; Li, W.; Feng, W.; Liu, R. Effect of hydrogeological conditions on groundwater nitrate pollution and human health risk assessment of nitrate in Jiaokou Irrigation District. J. Clean. Prod. 2021, 298, 126783. [Google Scholar] [CrossRef]
- Li, P.; Qian, H.; Wu, J. Conjunctive use of groundwater and surface water to reduce soil salinization in the Yinchuan Plain, North-West China. Int. J. Water Resour. Dev. 2018, 34, 337–353. [Google Scholar] [CrossRef]
- Jia, H.; Qian, H.; Zheng, L.; Feng, W.; Wang, H.; Gao, Y. Alterations to groundwater chemistry due to modern water transfer for irrigation over decades. Sci. Total Environ. 2020, 717, 137170. [Google Scholar] [CrossRef]
- Shimojimaa, E.; Yoshioka, R.; Tamagawa, I. Salinization owing to evaporation from bare-soil surfaces and its influences on the evaporation. J. Hydrol. 1996, 178, 109–136. [Google Scholar] [CrossRef]
- Shang, F.; Ren, S.; Zou, T.; Yang, P. Effects of infiltration and evaporation with treated wastewater and salt solutions on soil moisture and salinize-alkalization. Trans. Chin. Soc. Agric. Eng. 2013, 29, 120–129. [Google Scholar]
- Liu, F.X. Study on Law and Effect of Soil Evaporation in Bare soil under the Influence of Temperature and Humidity; Chang’an University: Xi’an, China, 2020. [Google Scholar]
- Cuevas, J.; Daliakopoulos, I.N.; del Moral, F.; Hueso, J.J.; Tsanis, I.K. A Review of Soil-Improving Cropping Systems for Soil Salinization. Agronomy 2019, 9, 295. [Google Scholar] [CrossRef]
- Minhas, P.S.; Ramos, T.B.; Ben-Gal, A.; Pereira, L.S. Coping with salinity in irrigated agriculture: Crop evapotranspiration and water management issues. Agric. Water Manag. 2020, 227, 105832. [Google Scholar] [CrossRef]
- Wang, S.; Wang, X.; Brown, L.C.; Qu, X. Current status and prospects of agricultural drainage in China. Irrig. Drain. 2007, 56, S47–S58. [Google Scholar]
- Li, J.; Pu, L.; Han, M.; Zhu, M.; Zhang, R.; Xiang, Y. Soil salinization research in China: Advances and prospects. J. Geogr. Sci. 2014, 24, 943–960. [Google Scholar] [CrossRef]
- Tang, R.; Wang, X.; Han, X.; Yan, Y.; Huang, S.; Huang, J.; Shen, T.; Wang, Y.; Liu, J. Effects of Combined Main Ditch and Field Ditch Control Measures on Crop Yield and Drainage Discharge in the Northern Huaihe River Plain, Anhui Province, China. Agriculture 2022, 12, 1167. [Google Scholar] [CrossRef]
- Yao, R.; Yang, J.; Zhang, T.; Hong, L.; Wang, M.; Yu, S.; Wang, X. Studies on soil water and salt balances and scenarios simulation using SaltMod in a coastal reclaimed farming area of eastern China. Agric. Water Manag. 2014, 131, 115–123. [Google Scholar] [CrossRef]
- Wu, J.; Li, P.; Qian, H.; Fang, Y. Assessment of soil salinization based on a low-cost method and its influencing factors in a semi-arid agricultural area, northwest China. Environ. Earth Sci. 2013, 71, 3465–3475. [Google Scholar] [CrossRef]
- Heng, T.; Liao, R.; Wang, Z.; Wu, W.; Li, W.; Zhang, J. Effects of combined drip irrigation and sub-surface pipe drainage on water and salt transport of saline-alkali soil in Xinjiang, China. J. Arid Land 2018, 10, 932–945. [Google Scholar] [CrossRef]
- Heng, T.; He, X.-L.; Yang, L.-L.; Xu, X.; Feng, Y. Mechanism of Saline–Alkali land improvement using subsurface pipe and vertical well drainage measures and its response to agricultural soil ecosystem. Environ. Pollut. 2022, 293, 118583. [Google Scholar] [CrossRef]
- Mao, H.; Wang, Z.; Wang, X.; Huang, Q.; Liu, Y. Influence of reservoir seepage prevention measures and drainage ditch behind dam on groundwater depth of surrounding farmland. Trans. Chin. Soc. Agric. Eng. 2017, 33, 98–107. [Google Scholar]
- Xu, X.; Huang, G.; Sun, C.; Pereira, L.S.; Ramos, T.B.; Huang, Q.; Hao, Y. Assessing the effects of water table depth on water use, soil salinity and wheat yield: Searching for a target depth for irrigated areas in the upper Yellow River basin. Agric. Water Manag. 2013, 125, 46–60. [Google Scholar] [CrossRef]
- He, M. Drought and Flood in Huaibei Plain Area Groundwater Equilibrium Governance Deep Study on Appropriate; Yangzhou University: Yangzhou, China, 2014. [Google Scholar]
Disclaimer/Publisher’s Note: The statements, opinions and data contained in all publications are solely those of the individual author(s) and contributor(s) and not of MDPI and/or the editor(s). MDPI and/or the editor(s) disclaim responsibility for any injury to people or property resulting from any ideas, methods, instructions or products referred to in the content. |
© 2024 by the authors. Licensee MDPI, Basel, Switzerland. This article is an open access article distributed under the terms and conditions of the Creative Commons Attribution (CC BY) license (https://creativecommons.org/licenses/by/4.0/).