Article

Fine-Tuning Quantitative Trait Loci Identified in Immortalized F2 Population Are Essential for Genomic Prediction of Hybrid Performance in Maize

1
Henan Collaborative Innovation Center of Modern Biological Breeding, School of Agriculture, Henan Institute of Science and Technology, Xinxiang 453003, China
2
State Key Laboratory of Crop Gene Resources and Breeding, Institute of Crop Sciences, Chinese Academy of Agricultural Sciences, Beijing 100081, China
*
Authors to whom correspondence should be addressed.
These authors contributed equally to this work.
Agriculture 2024, 14(3), 340; https://doi.org/10.3390/agriculture14030340
Submission received: 13 January 2024 / Revised: 9 February 2024 / Accepted: 16 February 2024 / Published: 21 February 2024
(This article belongs to the Special Issue Gene Editing and Molecular Markers for Crops Genetics and Breeding)

Abstract

:
Maize breeding is greatly affected by hybrid vigor, a phenomenon that hybrids exhibit superior performance than parental lines. The immortalized F2 population (IMF2) is ideal for the genetic dissection and prediction of hybrid performance. Here, in this study, we conducted the QTL mapping and genomic prediction of six traits related to plant architecture using an IMF2 population. Broad-sense heritability of these traits ranged from 0.85 to 0.94. Analysis of genetic effects showed that additive variance was the main contributor to phenotypic variations. The mapping of quantitative trait loci (QTLs) revealed 10 to 16 QTLs (including pleiotropic loci and epistatic QTLs) for the six traits. Additionally, we identified 15 fine-tuning QTLs for plant height (PH). For genomic prediction (GP), the model of additive and dominance (AD) exhibited higher prediction accuracy than those fitting general combining ability (GCA) and its combination with special combining ability (SCA) effects for all tested traits. And adding the epistasis (E) effect into the AD model did not significantly increase its prediction accuracy. Moreover, the identified 15 fine-tuning QTLs of PH, which exerted large genomic prediction effects, were verified by the marker effect of GP. Our results not only provide an approach for the fine-mapping of fine-tuning QTLs but also serve as references for GP breeding in crops.

1. Introduction

In the face of the exploding global population, maize occupies an important position in grain yield and food security [1,2]. Optimizing plant architecture is a promising strategy for increasing planting density and the yield of maize [3,4]. The dissection of the QTLs and genes controlling plant architecture would provide valuable insights into the underlying molecular mechanisms and further benefit crop breeding [5,6].
Up till now, enhancing the plant architecture has been regarded as one of the major approaches to breed varieties for higher planting density [7]. Plant height, a trait closely linked to plant architecture, was strongly associated with grain yield, biomass and changes in plant density. It serves as one of the main traits that requires urgent improvement in crop breeding. The control of the quantitative variation in plant height by cloning genes is the foundation for hybrid breeding designs [8,9]. Several genes associated with plant height have been identified in crops, such as Ghd7 and Hd1 in rice [10,11] and Rht1 in wheat [8,12]. And, in maize, genes controlling the quantitative variation in plant height have also been discovered, including Vegetative to generative transition 1 (Vgt1) [13], ZmGA3ox2 [14], Brachytic2 [15,16], ZmTE1 [17], and ZmAMP1 [4,18]. These studies indicated that maize plant height is a complex quantitative trait controlled by intricate regulatory mechanisms.
The high yield of maize is due to heterosis, which is a complex phenomenon pertaining to the superior performance of hybrids than that of the parental inbred lines [19,20]. Various hybrid populations derived from multiple mating designs (such as the triple test cross design, the diallel design, and the North Carolina design) have been utilized to study heterosis [21]. The immortalized F2 (IMF2) population serves as an ideal model for genetic dissection and prediction of hybrid performance, due to its diverse and repeatable genetic variances [22]. A previous study using an IMF2 population containing 441 lines identified 10 QTLs on seven chromosomes for plant height (PH), most of which showed over-dominant effects [23]. By crossing 339 recombinant inbred lines (RILs) with two elite lines (Chang7-2 and Mo17), 33 epistatic heterosis loci for PH were identified, and two dominance heterosis loci and 31 epistatic heterosis loci for ear height were also discovered [24].
Genomic selection (GS) was first introduced in animal research in 2001 [25] and was later applied in maize in 2007 [26], which has become a cutting-edge technology in the molecular breeding era [27,28]. In GS, genetic parameters are estimated from the training population that has both genotypic and phenotypic data. The genomic estimated breeding values of the test population can then be predicted using GS models, such as the genomic best linear unbiased prediction (GBLUP) or the ridge regression best linear unbiased prediction (rrBLUP) models [29]. In quantitative genetics, hybrid performance can be expressed as the linear combinations of general combining ability (GCA) of female and male pools and special combining ability (SCA) [30], or the combinations of additive (A), dominance (D), and epistatic (E) effects [29]. It is meaningful to compare the prediction accuracy of these two methods to take full advantage of genetic information.
In this study, an IMF2 population derived from 194 RILs of Zheng58 and PH6WC was developed. A total of six traits related to plant architecture were investigated in three environments. The main objectives of this study were as follows: (1) to figure out the contribution of different genetic effects to hybrid performance, namely, additive, dominance, additive-by-additive, additive-by-dominance, and dominance-by-dominance effects; (2) to identify additive, dominance, and epistatic QTLs in IMF2, and compare them with the reported genes to search for fine-tuning QTLs; and (3) to calculate the prediction accuracies of genomic prediction (GP) models fitting various genetic factors, and verify whether the identified fine-tuning QTLs are essential for the GP of hybrid performance, so as to guide the analysis framework of GP breeding.

2. Materials and Methods

2.1. Plant Materials

A total of 194 recombinant inbred lines (RILs) derived from Zheng58 and PH6WC were used in this study. The elite inbred lines, Zheng58 and PH6WC, serve as the female parents of two widely cultivated maize hybrids in China, namely, Zhengdan958 and Xinyu335, respectively. In the summer of 2015, Zheng58 was crossed with PH6WC (female parent) to produce the F1 combination in Xinxiang (Henan province, China, 35.5° N, 113.8° E). In the winter of 2015, the F2 population was obtained in Sanya (Hainan province, China, 18.4° N, 109.2° E). Using the method of single seed descent, a set of RILs at F7 generation consisting of 194 lines were finally constructed. Then, the whole RIL panel was split into two groups randomly, and paired crossings were conducted randomly without replacement, resulting in 97 hybrids (Figure S1). This procedure was repeated three times, yielding an IMF2 population consisting of 291 lines. The development procedure of the IMF2 population is shown in detail in Figure S1.

2.2. Field Design and Trait Evaluation

In the summer of 2021, three replicates of the IMF2 population were planted in Xinxiang (Henan province, China, 35.5° N, 113.8° E), Luoyang (Henan province, China, 34.7° N, 112.7° E), and Xingtai (Hebei province, China, 37.5° N, 114.8° E). The year and location were combined and described as environment, which were abbreviated as 21XX, 21LY, and 21XT in the further study. An augmented design was performed in each environment. Each genotype was arranged in a single plot, with row length of 4 m, row space of 0.6 m, and individual interval of 0.2 m. The management in the field followed the local practices. Five individuals in each row were recorded for plant height (PH), ear height (EH), plant height above-ear (PHAE), tassel length (TL), above-ear node number (AENN), and average internode length above-ear (AILAE).

2.3. Phenotypic Data Analyses

Firstly, the following model was established to calculate the best linear unbiased estimator value (BLUE) in each environment:
y i m = μ + G i + R m + B n ( R m ) + ε i m
where y i m is the phenotype of the ith genotype in the mth replicate in the target environment, μ is the mean, G i is the genetic effect of the ith genotype treated as fixed effect, R m is the effect of the mth replicate treated as random effect, B n   ( R m ) is the effect of the nth block nested in the mth replicate, and ε i m is the error following a normal distribution.
Secondly, the following model was established to calculate BLUE and heritability across environments [31]:
y i j m = μ + G i + E j + G     E i j + R m   E j + B n ( E j R m ) + ε i j m
where y i m is the effect of the ith genotype in mth replicate nested in the jth environment, μ is the overall mean, G i is the genetic effect of the ith genotype, E j is the effect of the jth environment, G     E i j is the interaction between the ith genotype and jth environment, R m   ( E j ) is the effect of the mth replicate in the jth environment, B n   ( E j R m ) is the effect of the nth block in the mth replicate and the jth environment, and ε i j m is the error following a distribution ε i j m ~ N ( 0 , σ 2 ) across environments. When calculating BLUE, only the genotype effect was treated as fixed, and all effects were treated as random when calculating heritability.
The Studentized Residual Razor method was used to remove outliers in the linear model with a threshold of 2.8 [32]. Broad-sense heritability was calculated using Cullis’s formula [33]. The linear mode was solved with the R package ASReml-R (version 4.1) [34].

2.4. Genotyping and QTL Mapping

For each genotype, more than ten leaves at the five-leaf stage were collected. DNA extraction was performed using the cetyltrimethylammonium bromide method [35]. The RIL samples were genotyped at China Golden Marker Biotech Co., Ltd. (Beijing, China), using the 10 K single-nucleotide polymorphisms (SNP) chips [36]. The parents, Zheng58 and PH6WC, were coded as −1 and 1, respectively. For the original dataset in RILs, SNP with missing rate over 10%, and P value of segregation distortion below 0.05 were discarded. Individuals with heterozygous rate over 20% were excluded. Then, the remaining heterozygous genotypes were treated as missing genotypes. The potential error genotypes were corrected according to the flanking alleles with a max haplotype length equal to three in the R package ABHgenotypeR [37], before being imputed with Beagle in the synbreed package. The genotypes in IMF2 were inferred based on their parents using the build. HMM function in the R package sommer [30].
The linkage map of the IMF2 population was constructed through the MAP function in software QTL IciMapping (Version 4.2.53) [38], with the default parameters. This linkage map was shared with the RIL population. QTL mapping for performance in single environment and BLUE across environments were performed, using the method of inclusive composite interval mapping (ICIM) through the BIP function, with the default parameters. Epistatic QTL mapping for the traits of the BLUE values was performed using the method of ICIM for epistatic mapping (ICIM-EPI) through the BIP function, with the default parameters. The identified QTLs of PH were compared with the reported PH genes in maize. QTLs with confidence intervals that did not overlap with the reported PH genes were defined as fine-tuning QTLs. A summary of the reported PH genes in maize can be found in Table S1.

2.5. Genomic Prediction

To evaluate the prediction accuracy in hybrid population, two GP models were applied by partitioning the performance into different components (GCA and SCA, as well as the linear combinations of A, D, and E effects). The two GBLUP models were implemented in the R package BGLR [39] by setting nIter equal to 10,000 and burnIn equal to 2000. The 80% training set and 20% test set partitioning was repeated 200 times to obtain the mean predictive ability.

3. Results

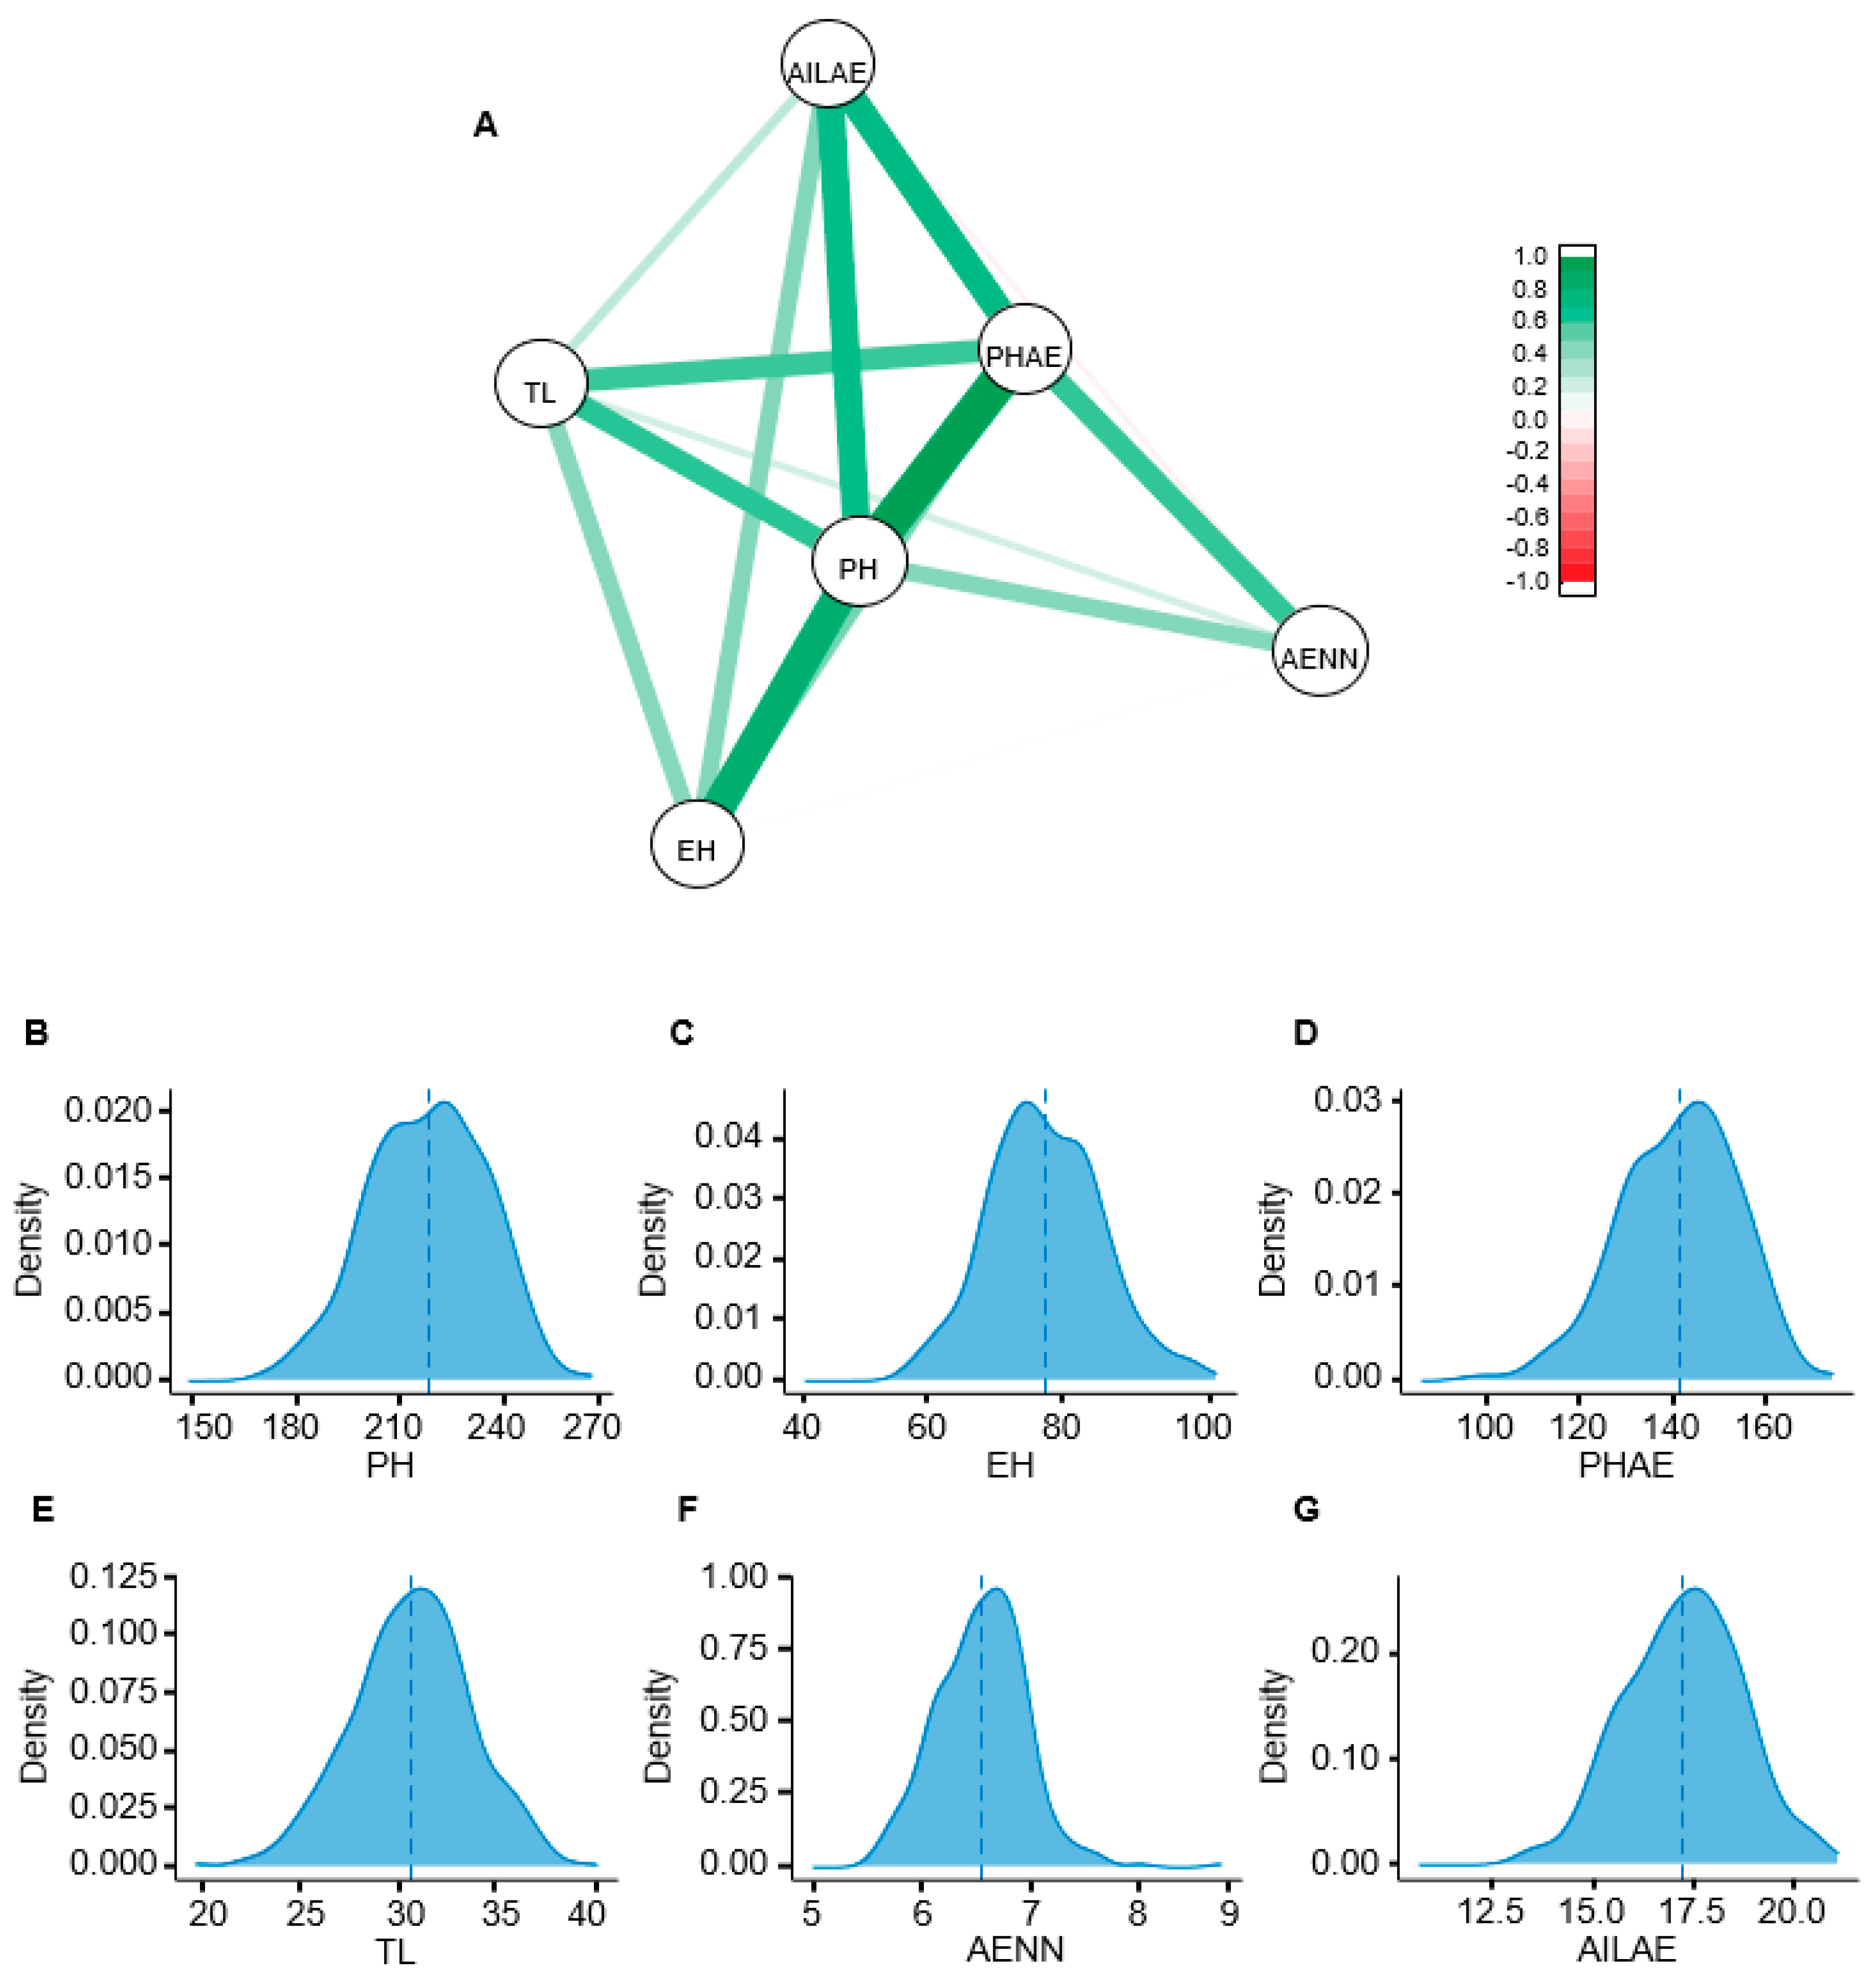
3.1. Phenotype Analysis under Multi-Environments

The coefficient of variance (CV) of the traits in the IMF2 population ranged from 6.28% for AENN to 10.89% for TL (Table 1). The genetic variance and genotype-by-environment variance were both significant (P value < 0.01) for all tested traits (Table 1). The broad-sense heritability (h2) of the traits was larger than 0.85 in the IMF2 population, among which PH showed the highest value of 0.94 (Table 1). The genetic network showed positive correlations among all tested traits, and PH was highly correlated with PHAE, AILAE, and EH (Figure 1A). Furthermore, the six traits were all in accordance with normal distribution in general (Figure 1B–G).

3.2. Additive Is the Main Contributor to All Tested Traits for the IMF2 Population

In order to dissect the genetic variance of the six traits of plant architecture for hybrid performance, the additive and dominance models with the additive (a), dominance (D), additive-by-additive (AA), additive-by-dominance (AD), and dominance-by-dominance (DD) effects were examined based on 3069 SNP markers in the hybrid population (Figure 2; Table S2). The proportions of variances by additive effect over the phenotypic variance in the hybrid population ranged from 52.1% for AILAE to 69.3% for EH. The proportions of variances by dominance effect over the phenotypic variance ranged from 5.1% for EH to 8.5% for AILAE. In terms of the interactive effect, the proportions of variances due to the AA effect over the phenotypic variance ranged from 6.0% for EH to 12.3% for AILAE, the proportions of variances due to the AD effect over the phenotypic variance ranged from 5.4% for EH to 7.2% for AILAE, and the proportions of variances due to the DD effect over the phenotypic variance ranged from 4.3% for EH to 6.7% for AILAE (Figure 2; Table S2). In general, the proportion of phenotypic variance explained by the additive effects was larger than other genetic effects for all the six traits in the hybrid population (Figure 2).

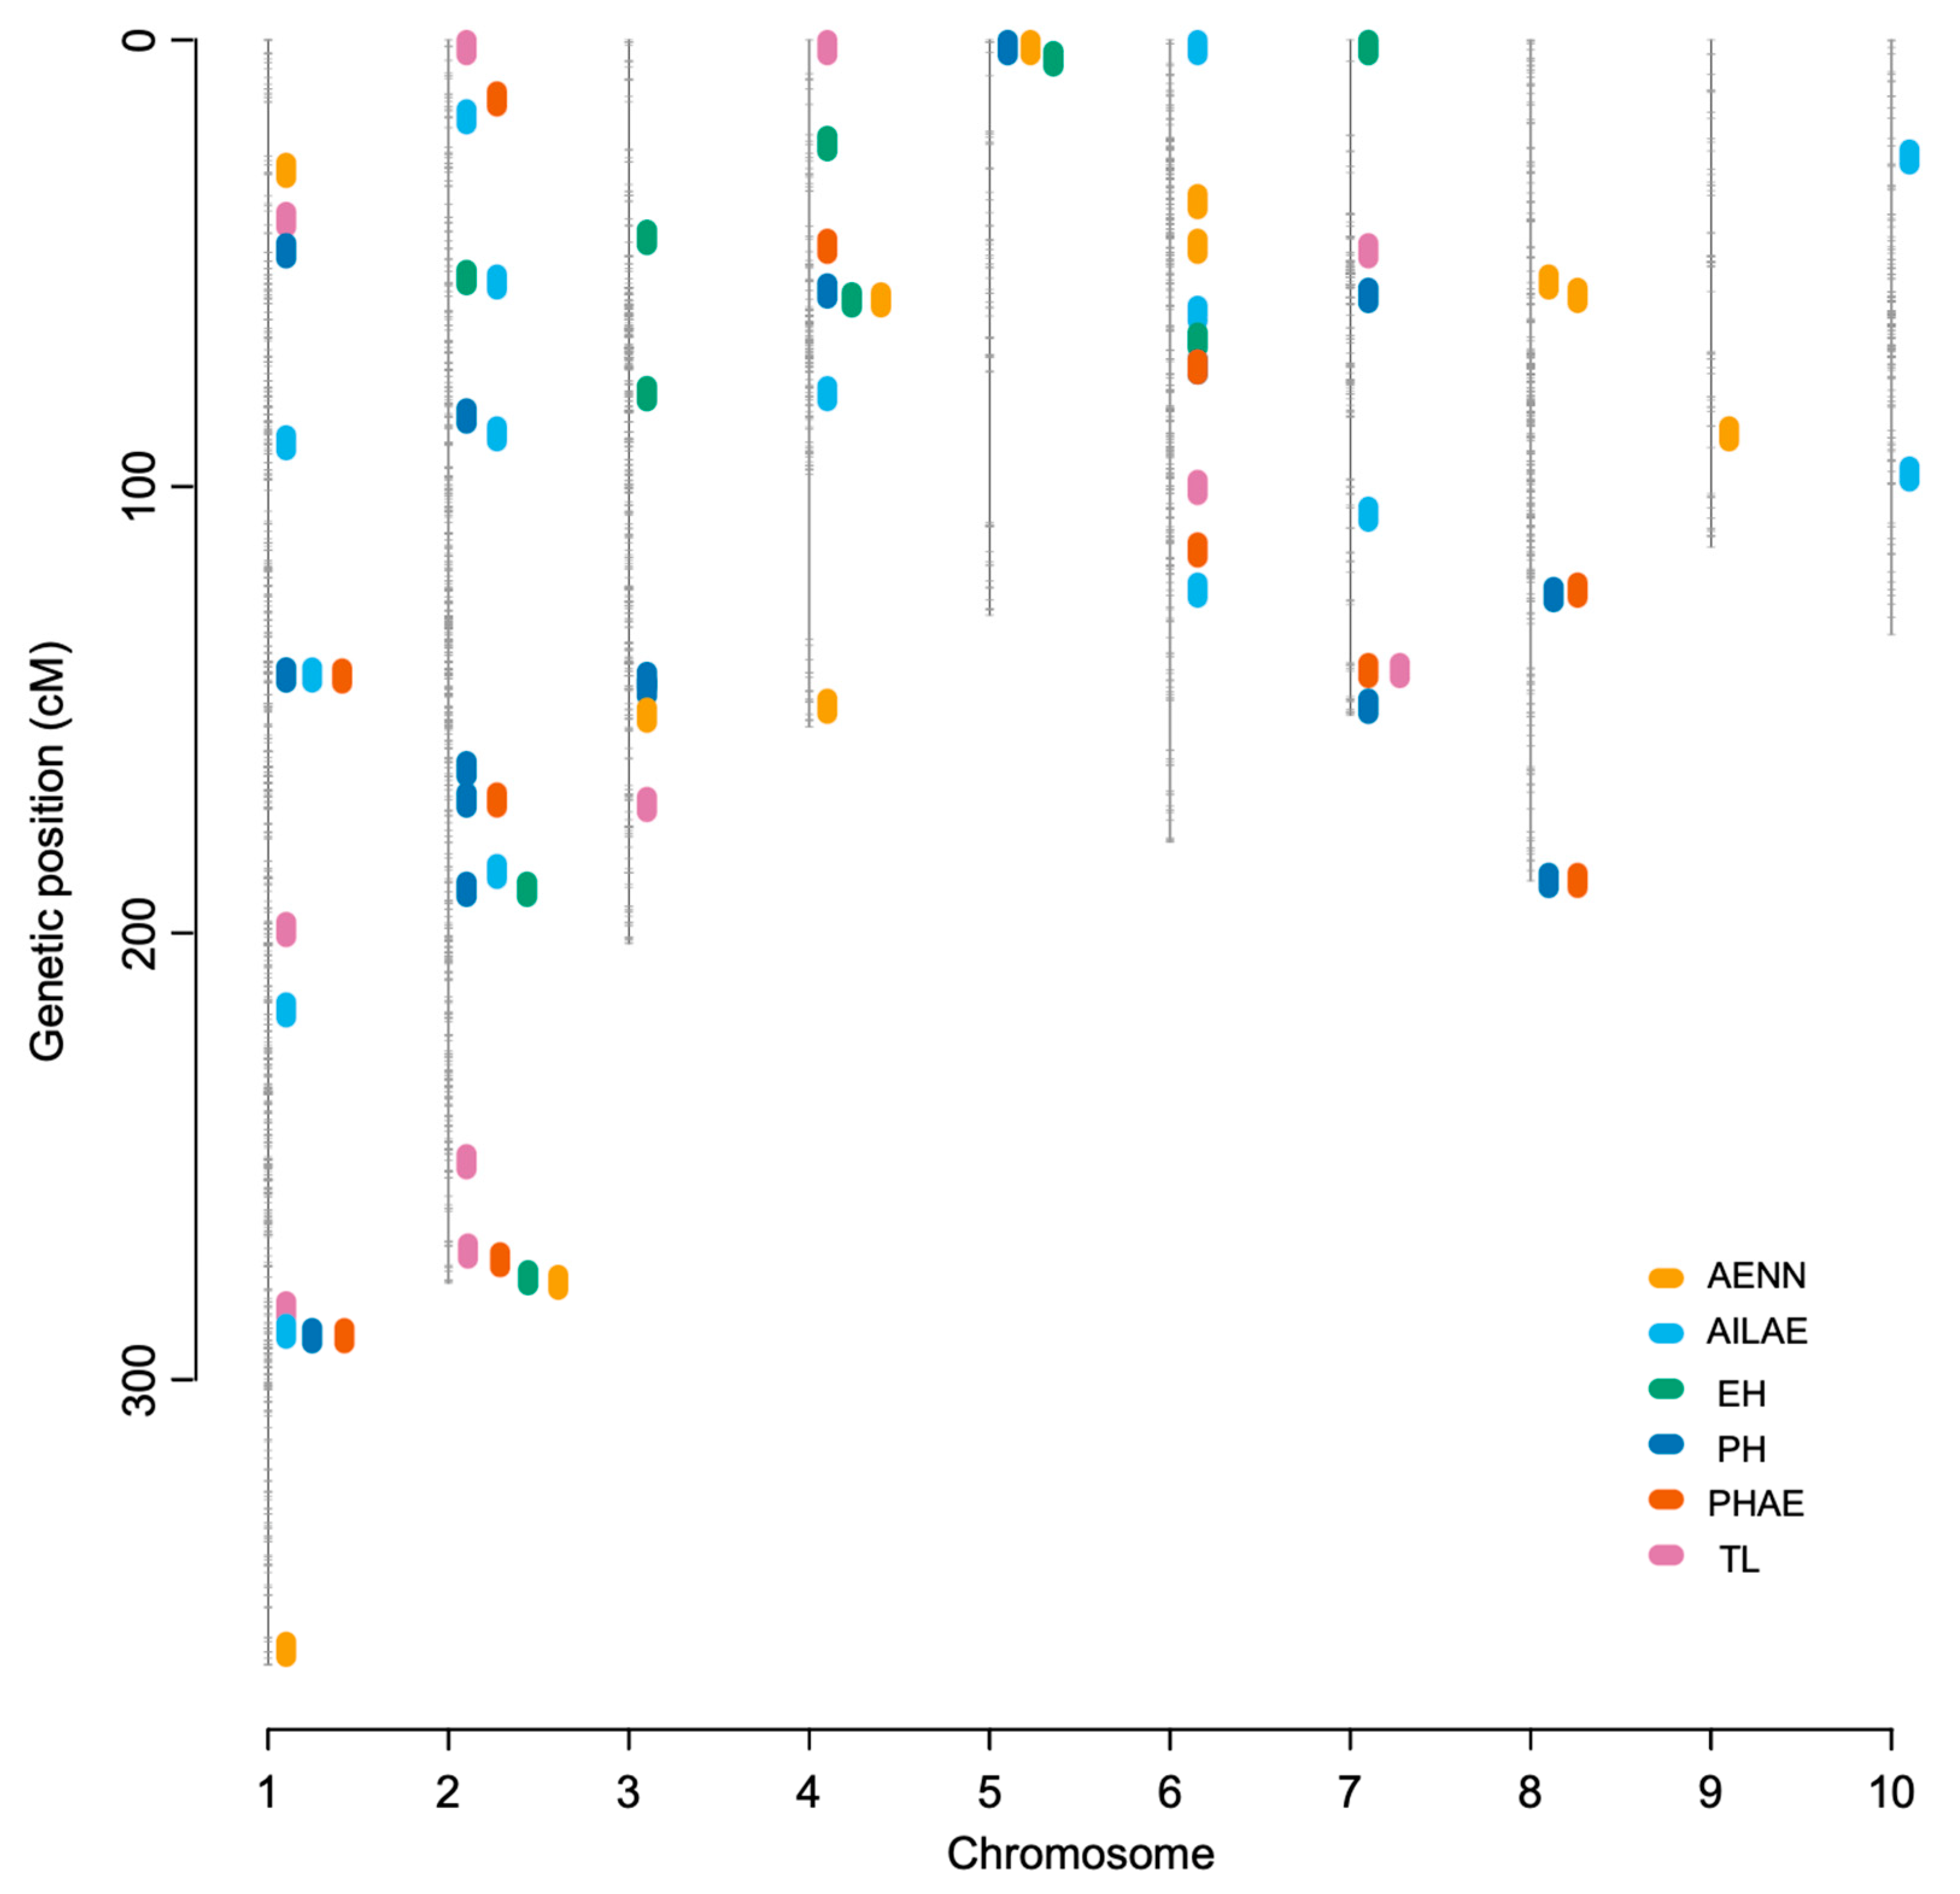
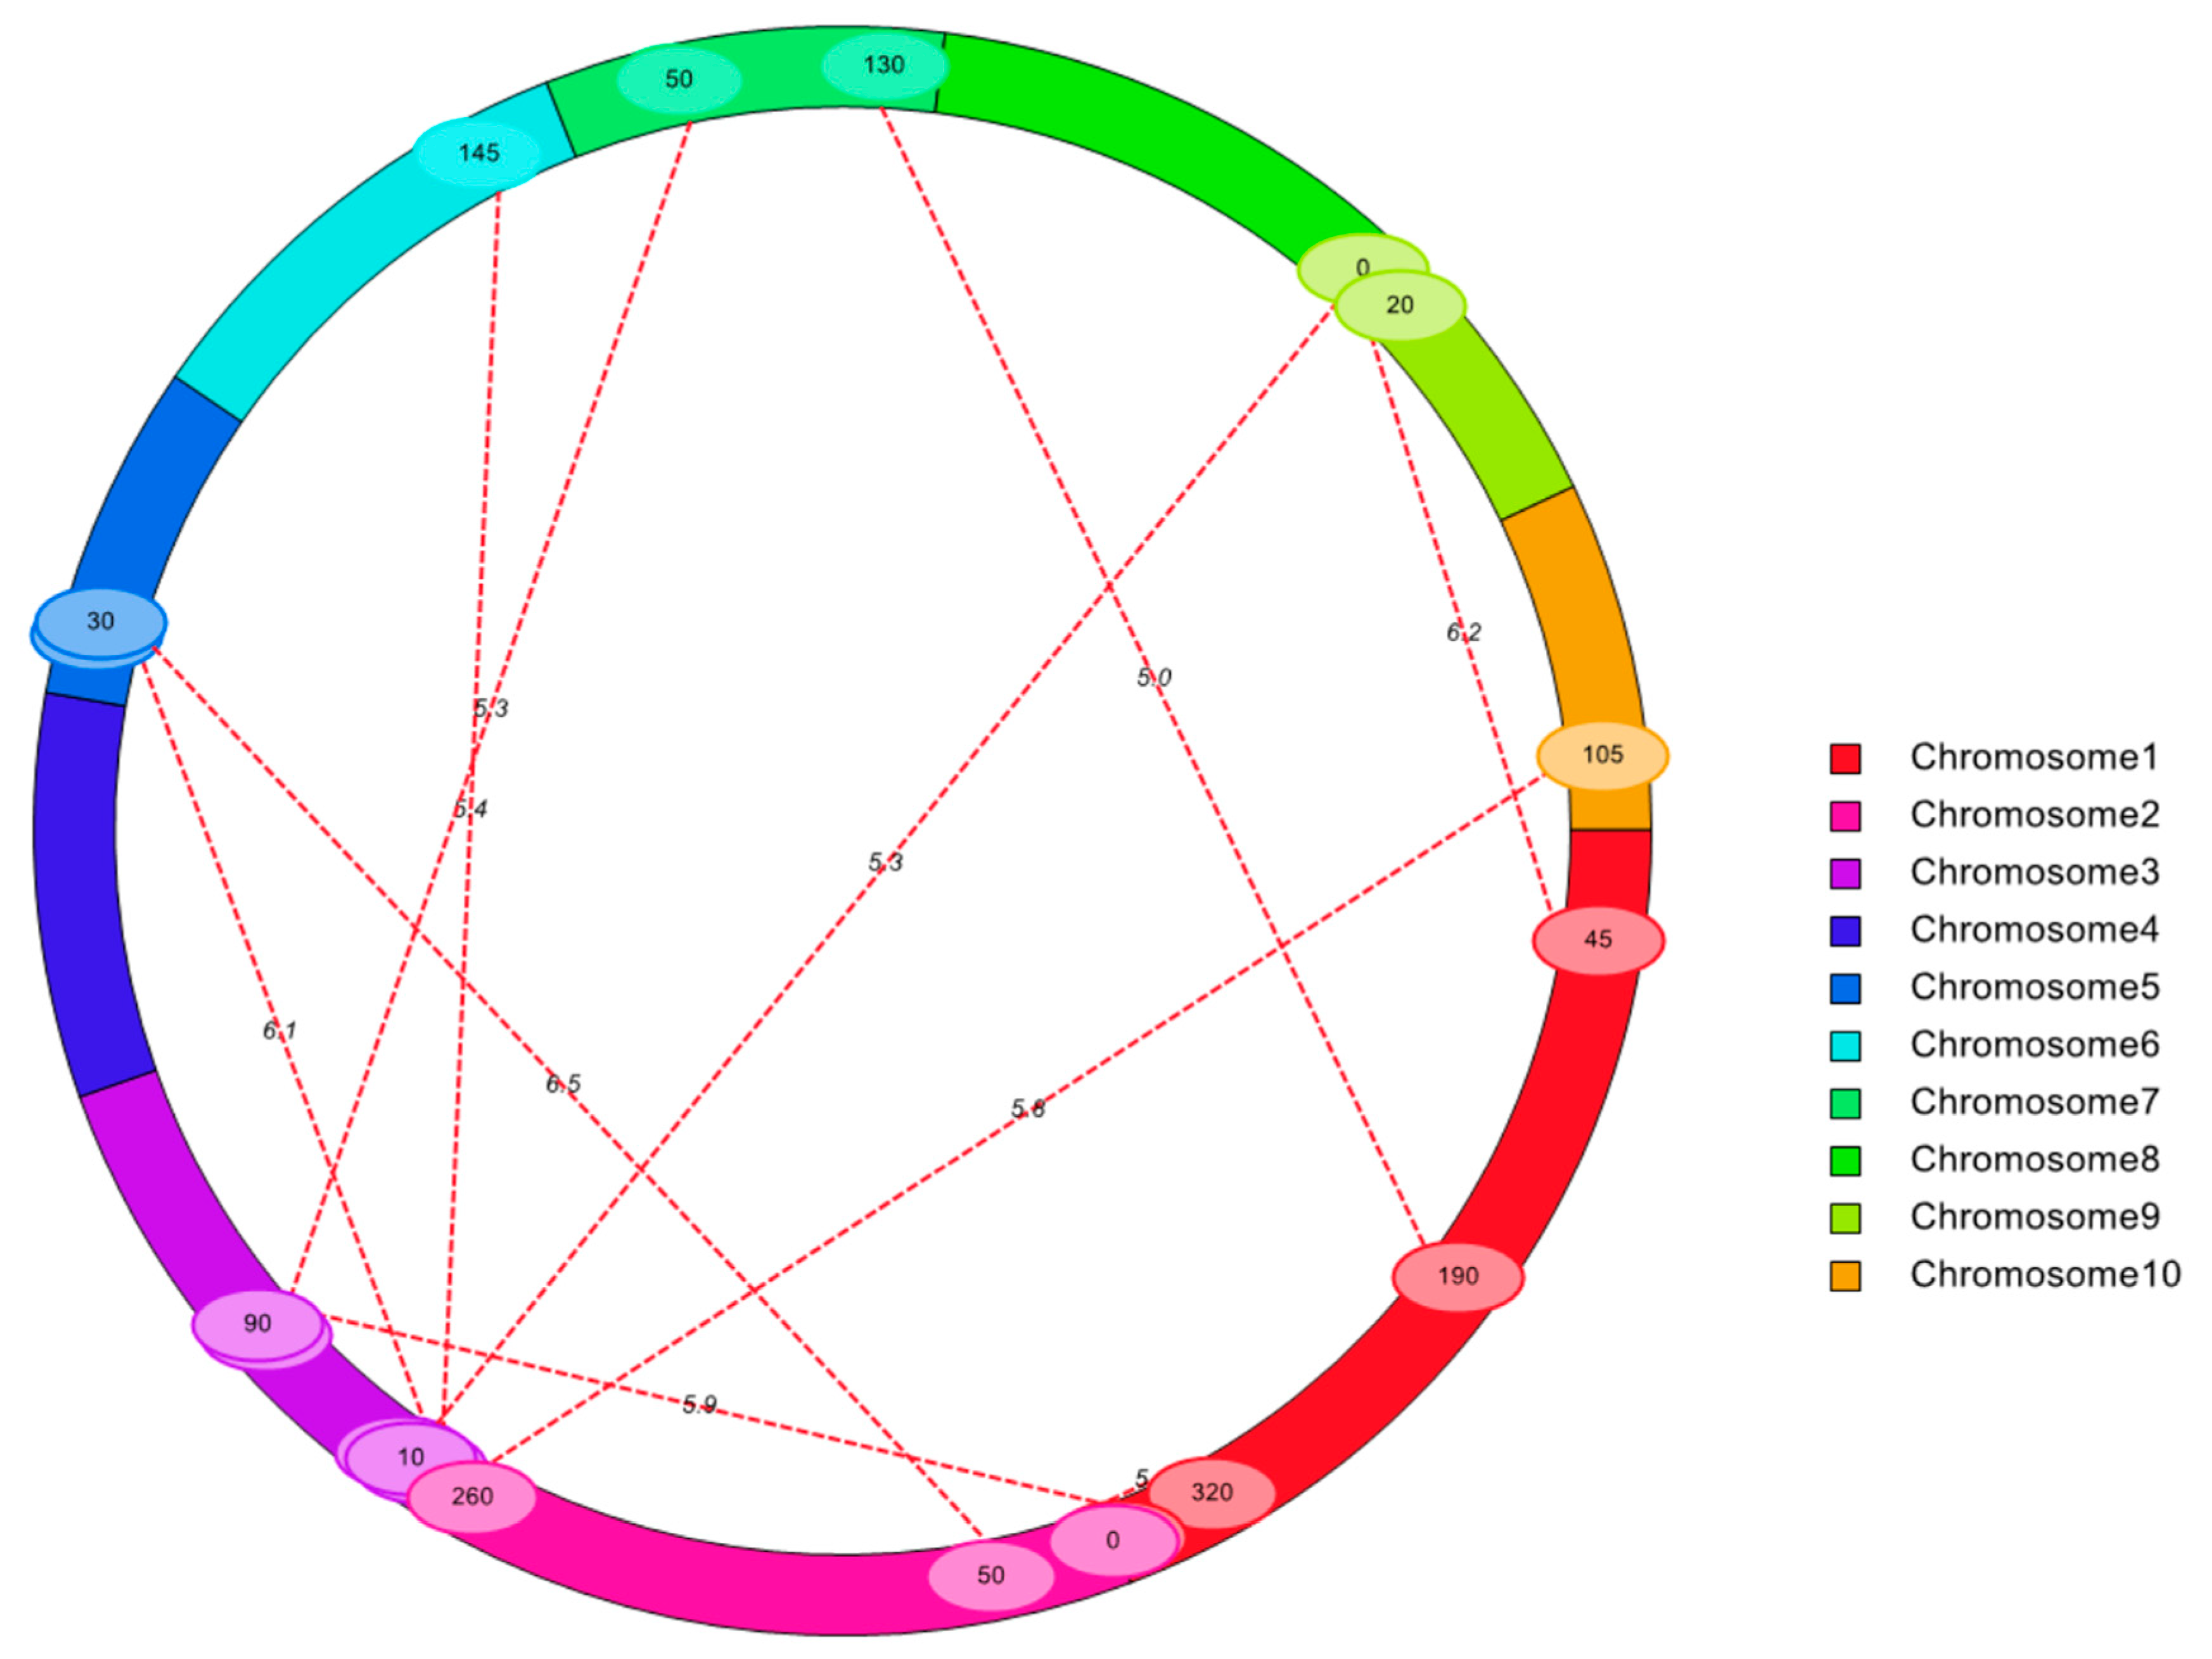
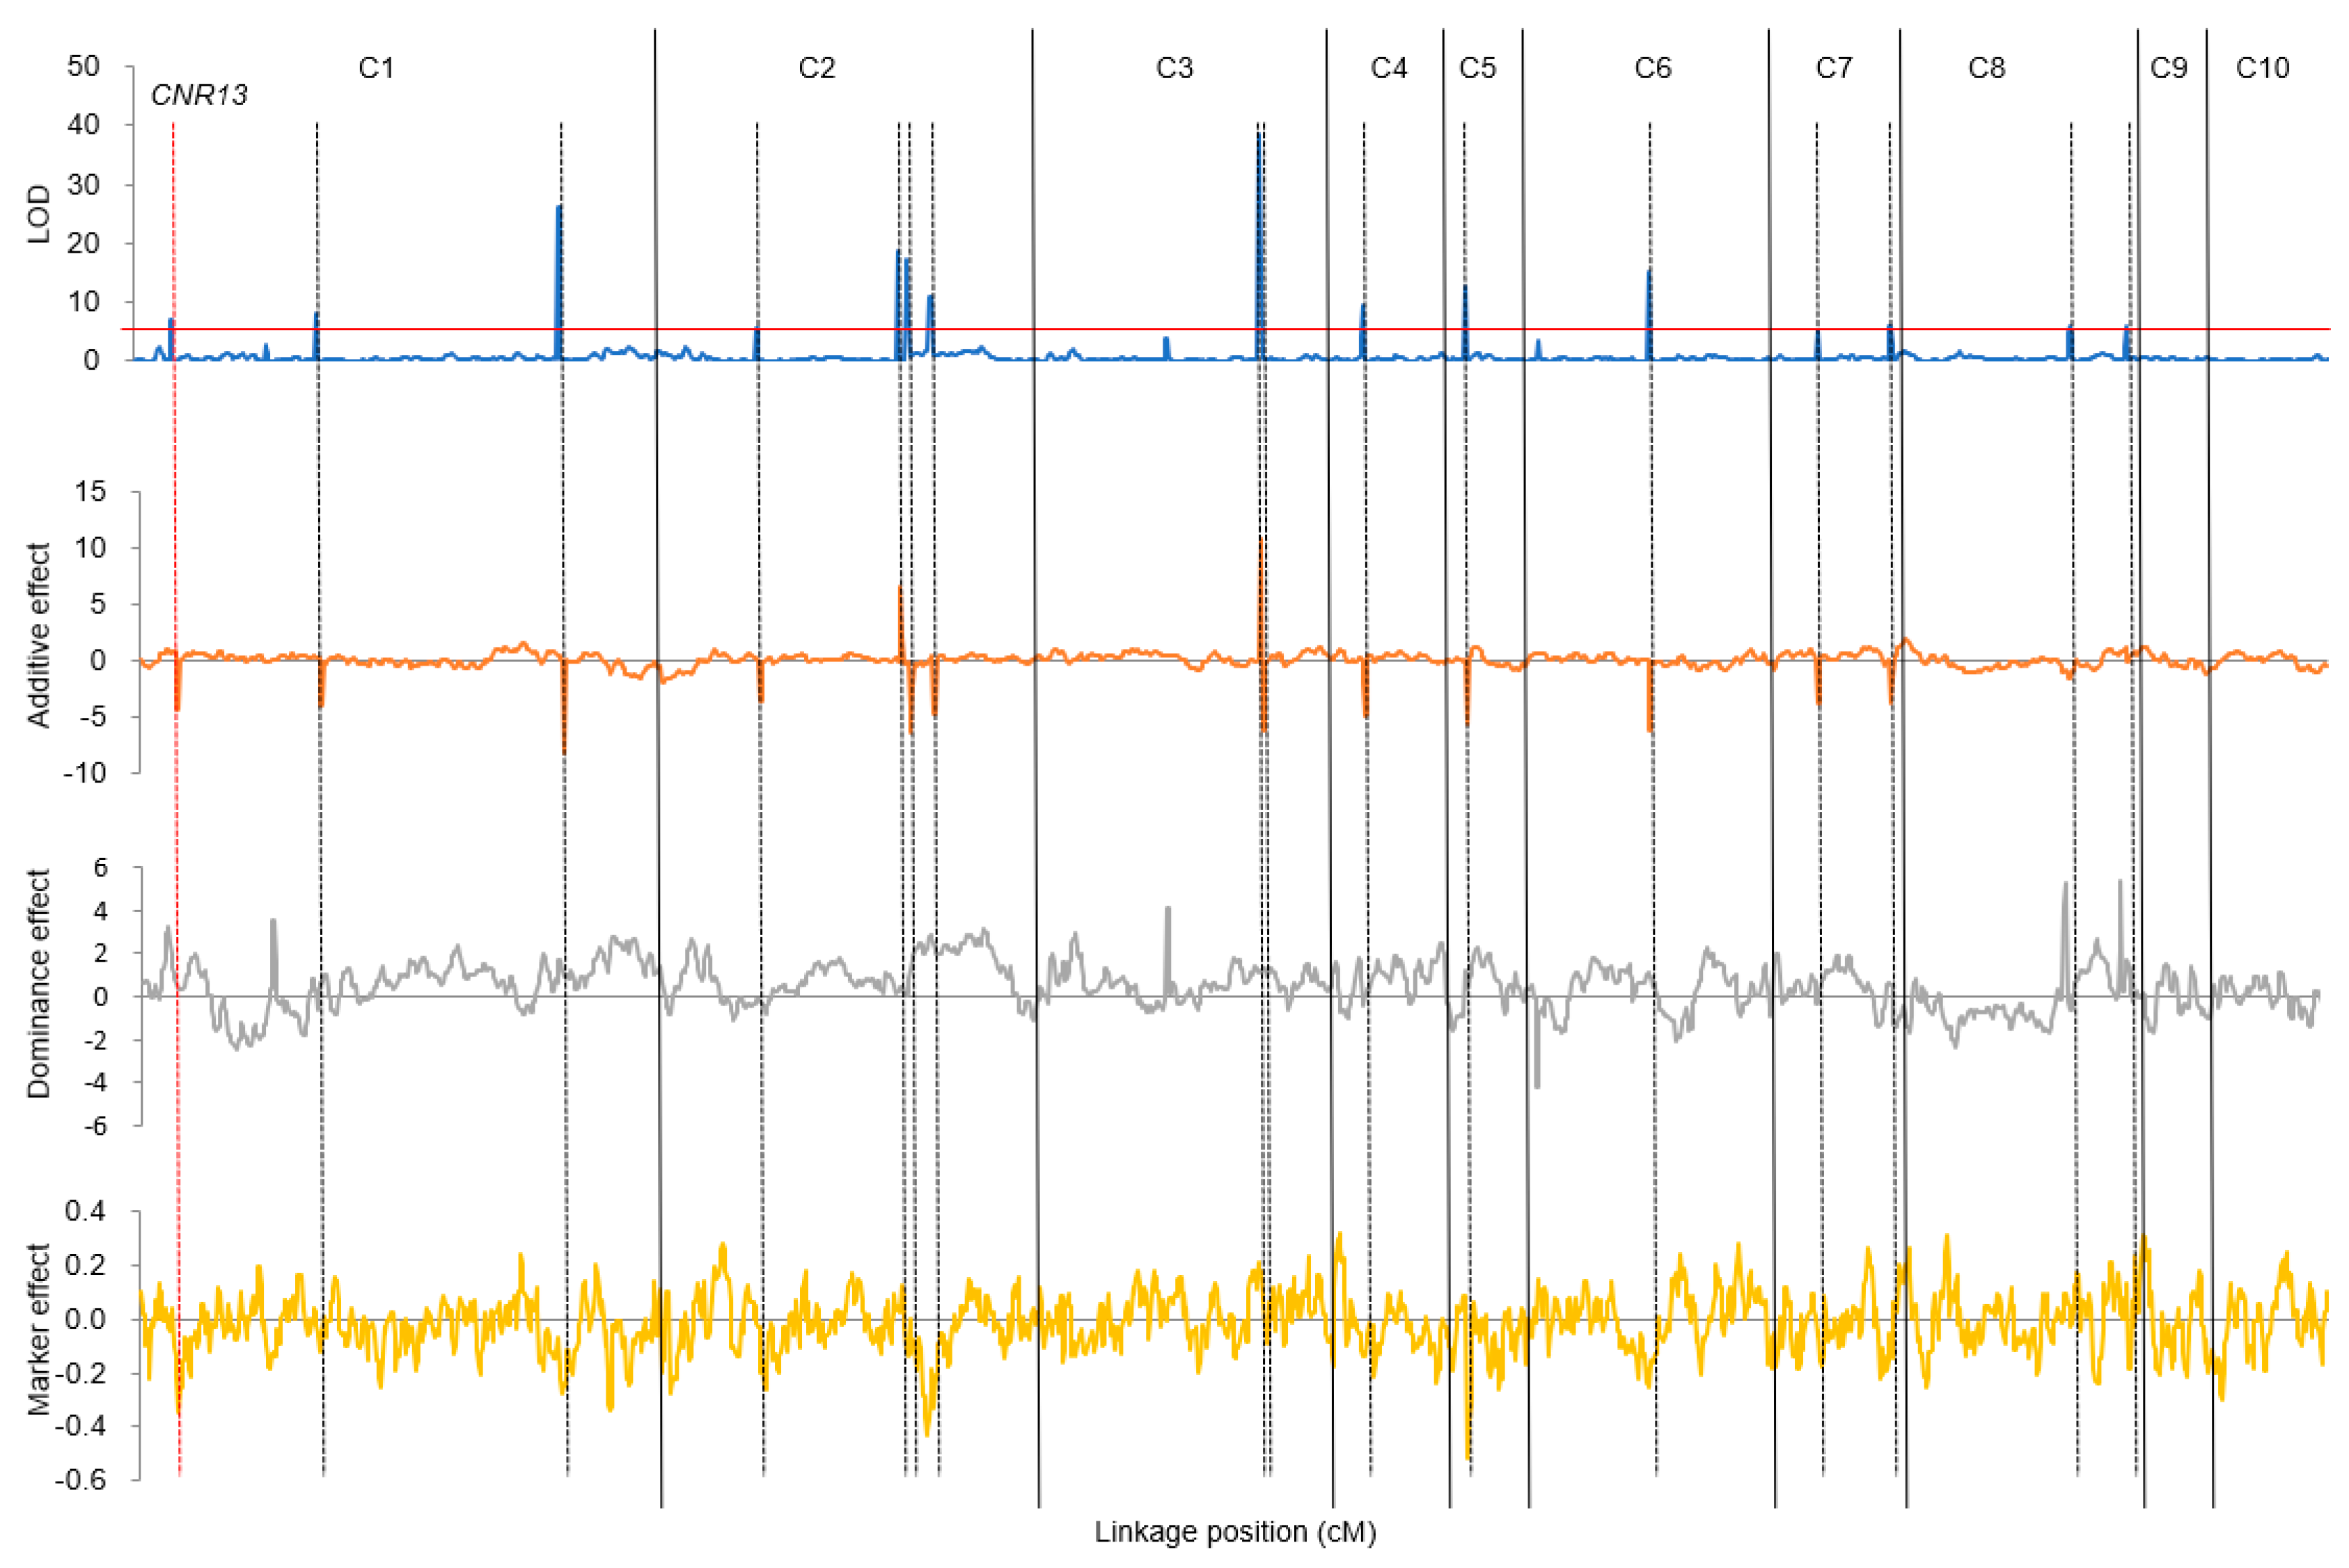
3.3. QTL Mapping Identified Pleiotropic Loci and Epistatic QTLs

To identify the genetic loci controlling the six traits, we first constructed a linkage map with the total genetic distance of 1892.83 cM (Figure S2; Table S3). The average distance between flanking markers was 0.86 cM, corresponding to the physical distance of ~1.12 Mb. The BLUE values across environments and phenotype values in each environment were used for QTL mapping in the IMF2 population (Table S4). In total, 16 QTLs were identified for PH and 10 for EH, 11 for PHAE, 12 for both TL and AENN, as well as 15 for AILAE (Figure 3), and the PVE ranged from 0.6% to 20.9% (Table 2). Interestingly, we identified several QTLs that controlled multiple traits simultaneously. For example, in terms of chromosome 1, the QTL located at ~141 cM controls three traits (PH, PHAE, and AILAE), and the one located at ~289 cM affected four traits at the same time (PH, PHAE, TL, and AILAE). For chromosome 2, the QTL located at ~186 cM was related to traits including PH, EH, and AILAE, whereas the QTL located at ~277 cM controlled EH, PHAE, TL, and AENN simultaneously. The verification of these QTLs was performed in a single environment (Table 2), substantiating the existence of pleiotropic loci controlling plant architecture in the IMF2 population.
Epistatic QTL mapping in the IMF2 population identified epistatic QTLs for the six traits (10 for PH, 5 for EH, 19 for PHAE, 16 for TL, 12 for AENN, and 9 for AILAE) (Table S5). The PVE of the six traits ranged from 3.4% to 14.7% (Table S5). Multi-environment QTL analysis yielded 10 pairs of epistasis interactions, involving 20 genetic loci for PH in the whole genome, with LOD values ranging from 5.0 to 6.5 (Figure 4, Table S5). Chromosome 3 harbored the most epistatic loci (5) for PH, whereas no epistatic loci were detected on chromosomes 4 and 8 (Figure 4).

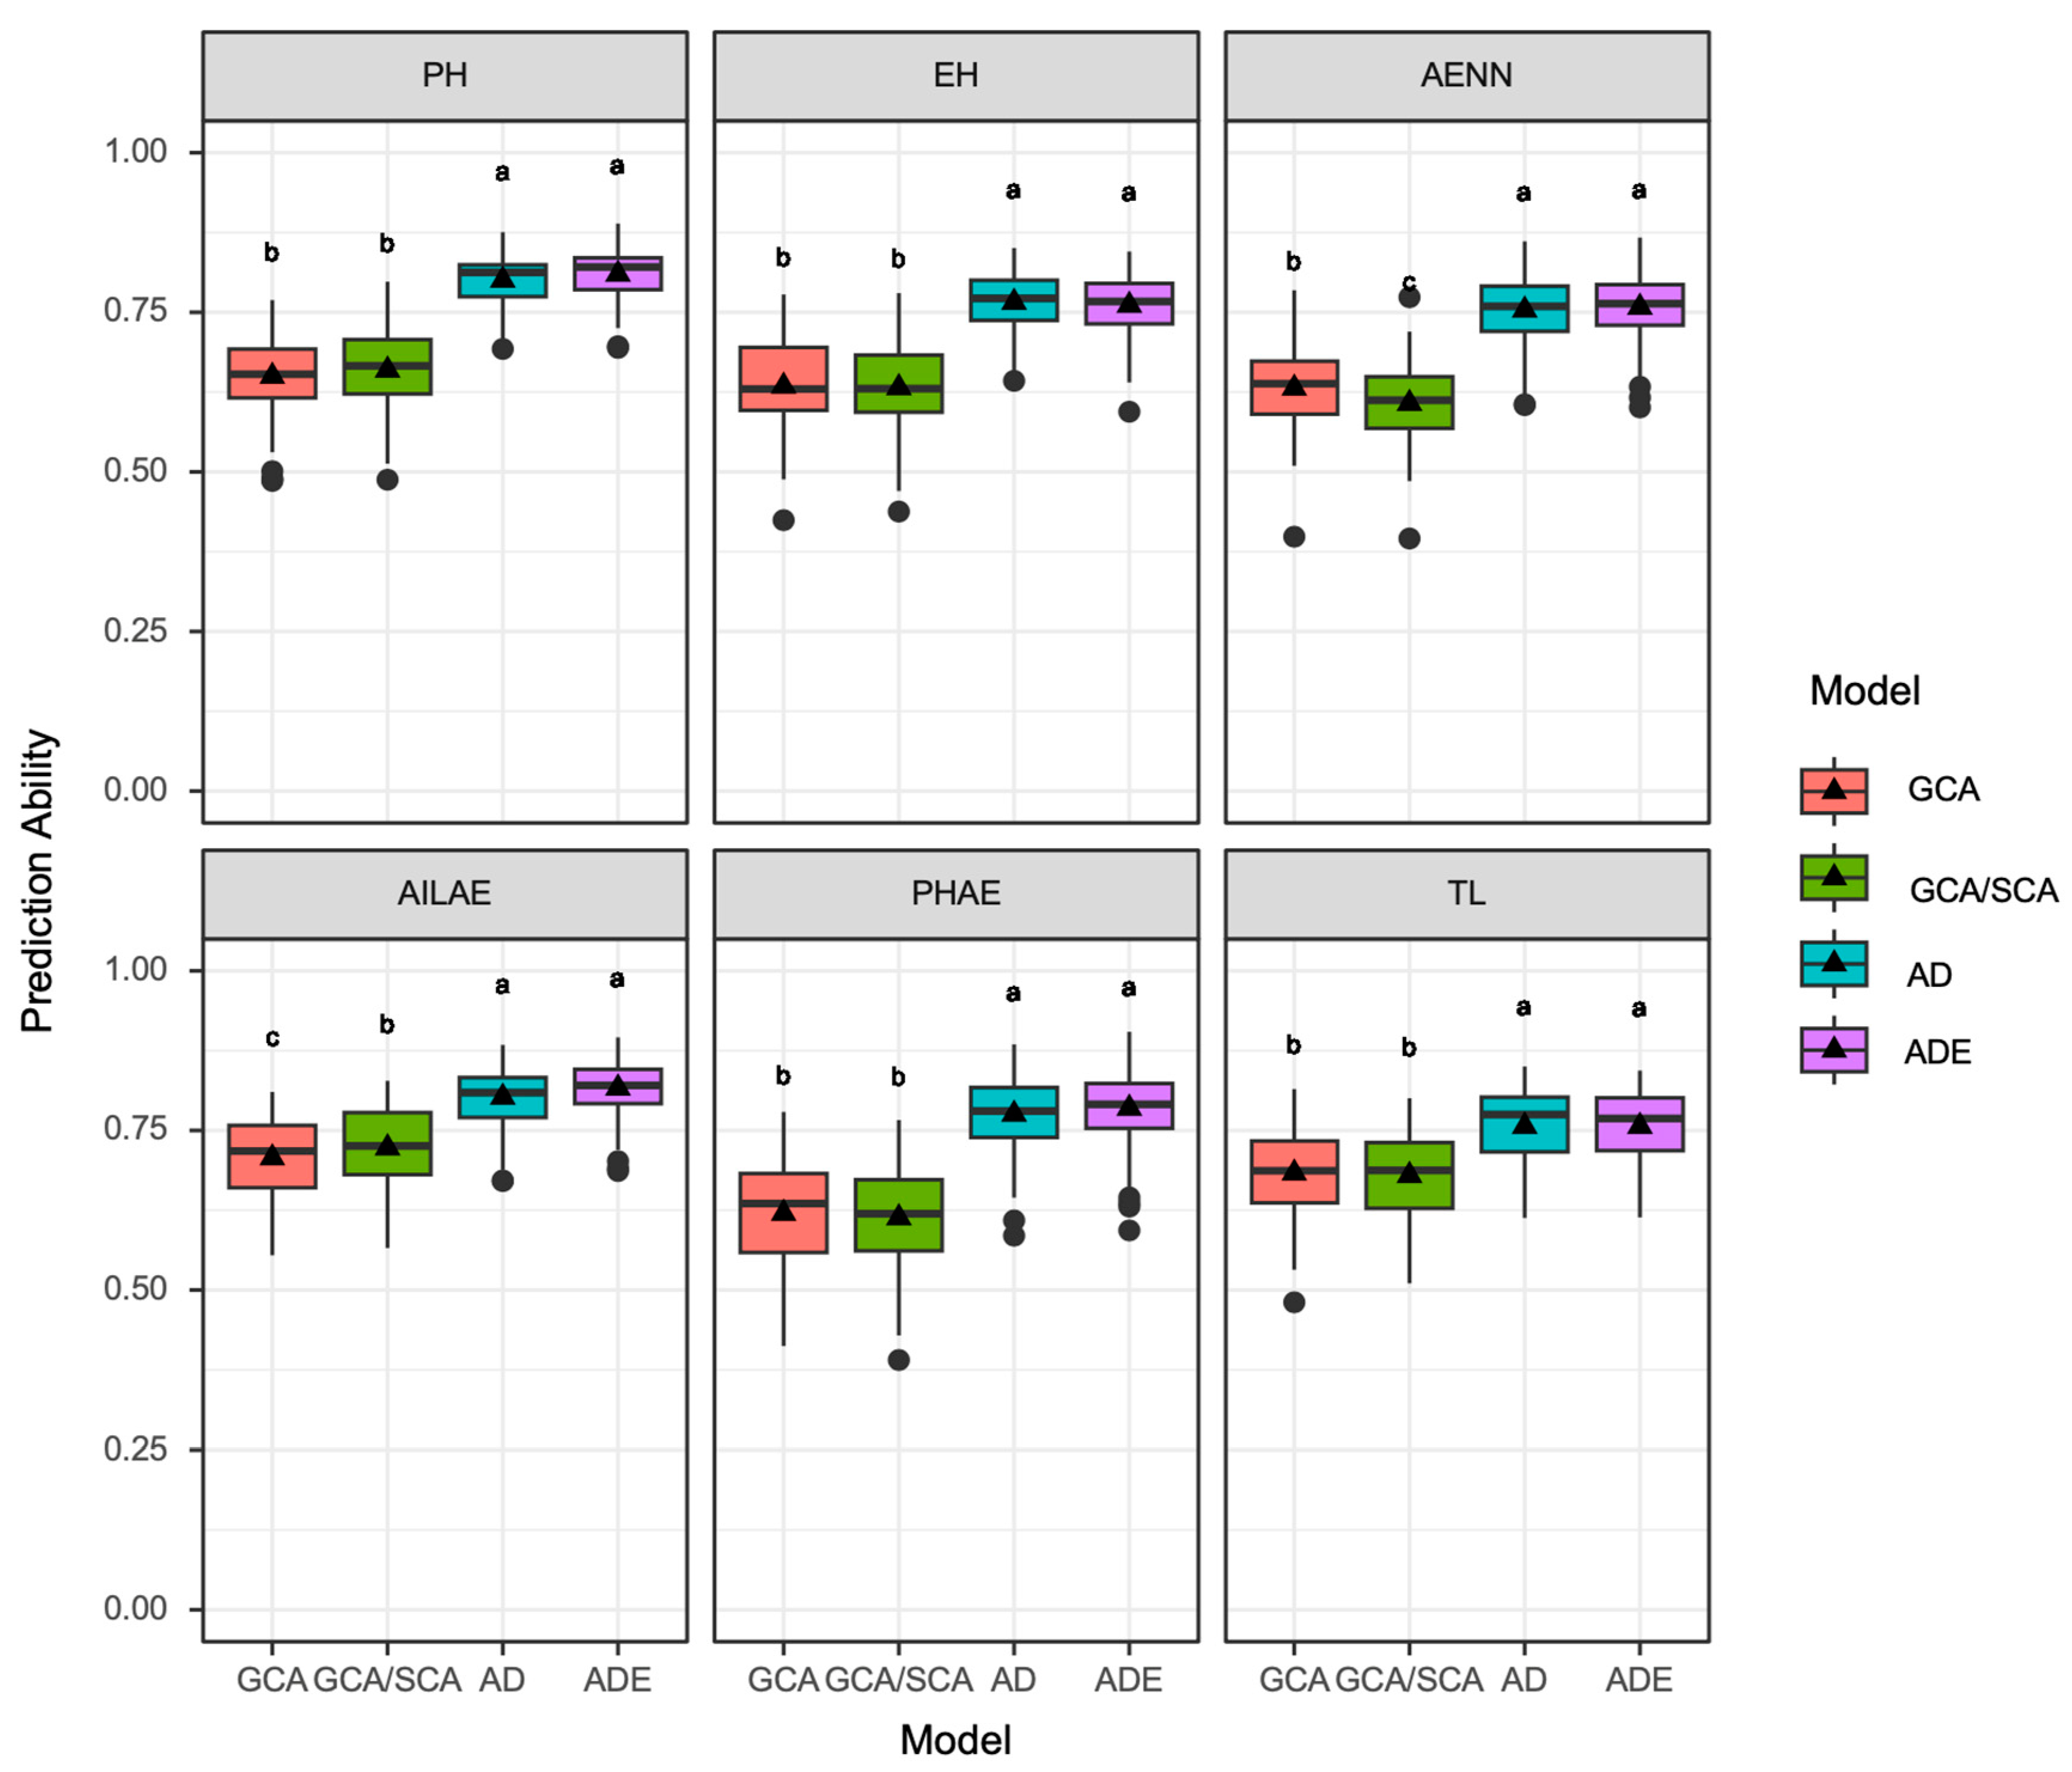
3.4. Comparison of Different Genomic Prediction Models

To evaluate the prediction accuracy in hybrid population, two genomic prediction (GP) methods were applied by partitioning the performance into different components (additive, dominance, and epistasis effects or GCA and SCA effects). The prediction accuracy ranged from 0.756 for TL to 0.816 for AILAE when considering the additive, dominance, and epistasis (ADE) effects simultaneously, whereas the prediction accuracy ranged from 0.753 for AENN to 0.802 for AILAE when only considering the AD effect (Figure 5). Furthermore, no significant difference was observed between the ADE and AD models for all the traits, indicating that the addition of epistatic interactions into the AD model could not significantly improve the prediction accuracy.
From the perspective of the model based on the GCA and SCA effects, the prediction accuracy ranged from 0.607 for AENN to 0.723 for AILAE when considering the GCA and SCA effects simultaneously. The prediction accuracy ranged from 0.620 for PHAE to 0.707 for AILAE when only considering the genetic effect of GCA. Specifically, the prediction accuracy of AENN was significantly decreased when adding SCA into the GCA model, while in contrast, the prediction accuracy of AILAE was significantly increased (Figure 5). Except for these two traits, the prediction accuracies of the other four traits were not significantly changed with the addition of SCA into the GCA model (Figure 5).
In addition, our results also demonstrated that the prediction accuracy of the ADE and AD models was significantly higher than that of the GCA/SCA and GCA models for all six traits (Figure 5). This indicates that the genotypic information of hybrid per se is more powerful in the GP of hybrid performance.

3.5. The Identified Fine-Tuning QTLs Are Essential for GP of Hybrid Performance

To further study the role of QTLs identified in the GP of traits, we took PH as an example by analyzing the overlap of the confidence intervals with previously reported PH genes (Table S1). Only 1 of the 16 identified QTLs for BLUE values of PH in IMF2 overlapped with a reported PH gene-CNR13, leaving the other 15 ones as fine-tuning QTLs (Figure 6). To further evaluate whether these fine-tuning QTLs are essential for the GP of hybrid performance, the LOD value, additive effect, and dominance effect of the fine-tuning QTLs for PH were compared with the marker effect of GS in the IMF2 population (Figure 6). In general, the additive effect showed the same trend with the LOD values of fine-tuning QTLs, whereas the marker effect of GS also exhibited obvious changes when reaching the regions containing these fine-tuning QTLs. The results suggested that the identified fine-tuning QTLs are essential for the GP of PH hybrid performance.

4. Discussion

4.1. Strong Additive Effects Contribute to Hybrid Performance

The great differences between inbred lines and hybrids lie in their genetic constitutions. Hybrids contain more genetic information provided by heterozygous genomes, leading to their superior hybrid performance. Genetically, the performance of inbred lines was determined by additive and additive-by-additive effects. The situation is much more complex for hybrids, including additive, dominance, and epistasis effects [40]. Although there are studies of IMF2 populations in maize stating that epistasis is the main contributor to hybrid performance and heterosis [23,41], we found that additive effects were the main genetic basis in our population. This result is supported by a previous finding in rice that additive variance plays a major role in grain number and 1000 grain weight [29]. This might be due to the different population structures or distinct parental lines used in these studies. We also discovered that most QTLs are additive QTLs or partial dominance QTLs, indicating the strong additive effects in determining the hybrid performance of the IMF2 population.

4.2. Fine-Tuning QTLs Could Improve the Prediction Accuracy

We took PH as an example to identify QTLs that affect agronomic traits and further assessed their roles in GP. So far, 40 genes controlling PH in maize have been reported using mutant cloning or QTL cloning (Table S1). However, among the 16 identified QTLs of PH in the IMF2 population, only 1 QTL overlapped with a reported PH-related gene at the specified confidence interval (Figure 6). It has been suggested that alleles with large effects tend to be fixed during the adaptation of landraces [42]. Since the IMF2 population was constructed based on two elite lines (Zheng58 and PH6WC), the majority of the favorable alleles with large-effect size for most agronomic traits have been fixed during the long history of breeding processes. The remaining 15 QTLs were defined as fine-tuning QTLs, which allow minor adjustment of traits. Intriguingly, GP using the AD model found that these fine-tuning QTLs had large genetic effects in enhancing the prediction accuracy (Figure 6), serving as major loci for determining the hybrid performance.
Although the concept of fine-tuning QTLs has not been introduced before, a number of studies have proved that the soft manipulation of gene expression or protein activity could influence plant traits. For example, in rice, the slightly accumulated gibberellin level in anthers regulated by WRKY53 could increase cold tolerance without a yield penalty [43]; the receptor kinase OsWAK11 monitors cell wall pectin changes to fine-tune brassinosteroid signaling and regulate cell elongation [44]; and the fine-tuning of OsCPK18/OsCPK4 activity improves rice yield and immunity [45]. In maize, signaling networks among multiple phytohormones fine-tune plant defense responses to insect herbivore attack [46]. And fine-tuning the expression of genes controlling drought adaptive traits has become a prospect in wheat breeding [47]. Therefore, we hypothesized that the fine-tuning QTLs with small-effect size have the potential for future plant improvement, and it is also important to modulate these fine-tuning QTLs for the GP of hybrid performance in breeding populations.

4.3. Models Fitting Different Genetic Factors Influence the Prediction Accuracy

Hybrid performance not only displays a linear relationship with GCA and SCA but is also related to genetic effects (additive, dominance, and epistasis effects) [48,49]. A comparison of the two models is advisable for GP-assisted plant breeding. In this study, we used the GBLUP model fitting the two types of effects to compare their performances. We found that the AD model and the ADE model have similar performances in GP, which is consistent with previous studies [29,50]. However, the prediction accuracies of both models were higher than those of both the GCA model or the GCA/SCA model (Figure 5). We speculated that the differences between the independent variables of the two models might account for the differences in the prediction accuracy. For both the AD model and the ADE model, the independent variables are the genetic basis, i.e., real QTLs. In contrast, for either the GCA model or the GCA/SCA model, the independent variables are the phenotypic data controlled by QTLs [51]. Therefore, it is reasonable that prediction using real QTLs is more accurate and meaningful than using phenotypic data alone.
Moreover, we noticed that the addition of SCA into the GCA model led to a significant increase in the prediction accuracy of AILAE but a decrease in AENN (Figure 5), suggesting the necessity of model selection referring to different traits. We also detected similar prediction abilities for PH using the GCA model and the GCA/SCA model. But a previous study using the same method reported an enhanced prediction accuracy for the same trait, when dominance effects (SCA) were added to a pure additive model (GCA) [30]. This might be explained by the differences in genetic variations of the founders and population structures of the tested populations. These results addressed the importance of the choice of models when considering specific traits and population structures in GP. Nevertheless, our study did not incorporate other effects such as the genotype-by-environment interaction into the prediction model, which might further improve the prediction accuracy.

5. Conclusions

In this study, QTL mapping and GS of six traits related to plant architecture were conducted using an IMF2 population, and the main contribution effect of additive variance to phenotypic variation (ranging from 52.1% for AILAE to 69.3% for EH) was revealed. The prediction accuracies of GP models fitting genetic effects (AD and ADE) were shown to be higher than those fitting GCA and GCA/SCA effects for all six traits. We further identified 15 fine-tuning QTLs for PH and demonstrated their essential genetic effect in GP. Our study provides new insights into the identification of fine-tuning QTLs and their crucial roles in the GP of hybrid performance.

Supplementary Materials

The following supporting information can be downloaded at: https://www.mdpi.com/article/10.3390/agriculture14030340/s1, Figure S1: The flow chart of population development of RILs and IMF2; Figure S2: The marker distribution of genetic map and physical map in the IMF2 population; Table S1: Reported genes related with PH in maize; Table S2: The distribution of markers on the linkage map of the IMF2 population; Table S3: Variance components and proportion of the phenotypic variance contributed by each variance component in the hybrid population; Table S4: QTL mapping results of the six traits in the IMF2 population; Table S5: Epistatic QTL identified for the traits of BLUE values in the IMF2 population.

Author Contributions

Conceptualization, P.W. and H.Z. (Hongwei Zhang); Data curation, P.W. and X.M.; Investigation, P.W. and X.J.; Methodology, X.M., X.J., X.W. and H.W.; Resources, H.Z. (Huaisheng Zhang); Software, X.Z. and H.Z. (Huaisheng Zhang); Supervision, Y.X. and S.C.; Validation, X.W., X.Z. and H.W.; Writing—original draft, H.Z. (Hongwei Zhang) and Y.X.; Writing—review & editing, J.F. and S.C. All authors have read and agreed to the published version of the manuscript.

Funding

This research was funded by Key Scientific and Technological Research Project of Henan Province, grant number 222102110091; Joint Research on Agricultural Improved Seed of Henan Province, grant number 2022010204; Shennong Laboratory First-rate Research Subject, grant number SN01-2022-02; Key Public Welfare Project of Henan Province, grant number 201300111100; Key Scientific and Technological Research Project of Xinxiang City, grant number 21ZD004; and the Agricultural Science and Technology Innovation Program of CAAS.

Institutional Review Board Statement

Not applicable.

Data Availability Statement

The data reported in this study are contained within the article.

Acknowledgments

We would like to express our gratitude to our supervisor for their project, funding support and guidance on this paper, as well as to our fellow researchers for their help and support.

Conflicts of Interest

The authors declare that there are no conflict of interest.

References

  1. Xu, Y.; Skinner, D.J.; Wu, H.; Palacios-Rojas, N.; Araus, J.L.; Yan, J.; Gao, S.; Warburton, M.L.; Crouch, J.H. Advances in maize genomics and their value for enhancing genetic gains from breeding. Int. J. Plant Genom. 2009, 2009, 957602. [Google Scholar] [CrossRef]
  2. Hickey, L.T.; Hafeez, A.N.; Robinson, H.; Jackson, S.A.; Leal-Bertioli, S.C.M.; Tester, M.; Gao, C.; Godwin, I.D.; Hayes, B.J.; Wulff, B.B.H. Breeding crops to feed 10 billion. Nat. Biotechnol. 2019, 37, 744–754. [Google Scholar] [CrossRef] [PubMed]
  3. Tian, J.; Wang, C.; Xia, J.; Wu, L.; Xu, G.; Wu, W.; Li, D.; Qin, W.; Han, X.; Chen, Q.; et al. Teosinte ligule allele narrows plant architecture and enhances high-density maize yields. Science 2019, 365, 658–664. [Google Scholar] [CrossRef]
  4. Wang, P.; Yang, Y.; Li, D.; Xu, J.; Gu, R.; Zheng, J.; Fu, J.; Wang, J.; Zhang, H. Cloning of a new allele of ZmAMP1 and evaluation of its breeding value in hybrid maize. Crop J. 2023, 11, 157–165. [Google Scholar] [CrossRef]
  5. Duvick, D.N. The contribution of breeding to yield advances in maize (Zea mays L.). Adv. Agron. 2005, 86, 83–145. [Google Scholar] [CrossRef]
  6. Assefa, Y.; Prasad, P.V.V.; Carter, P.; Hinds, M.; Bhalla, G.; Schon, R.; Jeschke, M.; Paszkiewicz, S.; Ciampitti, I.A. Yield responses to planting density for US modern corn hybrids: A synthesis–analysis. Crop. Sci. 2016, 56, 2802–2817. [Google Scholar] [CrossRef]
  7. Liang, Y.; Liu, H.-J.; Yan, J.; Tian, F. Natural variation in crops: Realized understanding, continuing promise. Annu. Rev. Plant Biol. 2021, 72, 357–385. [Google Scholar] [CrossRef] [PubMed]
  8. Peng, J.; Richards, D.E.; Hartley, N.M.; Murphy, G.P.; Devos, K.M.; Flintham, J.E.; Beales, J.; Fish, L.J.; Worland, A.J.; Pelica, F.; et al. ‘Green revolution’ genes encode mutant gibberellin response modulators. Nature 1999, 400, 256–261. [Google Scholar] [CrossRef] [PubMed]
  9. Sasaki, A.; Ashikari, M.; Ueguchi-Tanaka, M.; Itoh, H.; Nishimura, A.; Swapan, D.; Ishiyama, K.; Saito, T.; Kobayashi, M.; Khush, G.S.; et al. A mutant gibberellin-synthesis gene in rice. Nature 2002, 416, 701–702. [Google Scholar] [CrossRef]
  10. Yano, M.; Katayose, Y.; Ashikari, M.; Yamanouchi, U.; Monna, L.; Fuse, T.; Baba, T.; Yamamoto, K.; Umehara, Y.; Nagamura, Y.; et al. Hd1, a major photoperiod sensitivity quantitative trait locus in rice, is closely related to the Arabidopsis flowering time gene CONSTANS. Plant Cell 2000, 12, 2473. [Google Scholar] [CrossRef]
  11. Zhang, Z.H.; Wang, K.; Guo, L.; Zhu, Y.J.; Fan, Y.Y.; Cheng, S.H.; Zhuang, J.Y. Pleiotropism of the photoperiod-insensitive allele of Hd1 on heading date, plant height and yield traits in rice. PLoS ONE 2012, 7, e52538. [Google Scholar] [CrossRef]
  12. Wojciechowski, T.; Gooding, M.; Ramsay, L.; Gregory, P. The effects of dwarfing genes on seedling root growth of wheat. J. Exp. Bot. 2009, 60, 2565–2573. [Google Scholar] [CrossRef] [PubMed]
  13. Salvi, S.; Sponza, G.; Morgante, M.; Tomes, D.; Niu, X.; Fengler, K.A.; Meeley, R.; Ananiev, E.V.; Svitashev, S.; Bruggemann, E.; et al. Conserved noncoding genomic sequences associated with a flowering-time quantitative trait locus in maize. Proc. Natl. Acad. Sci. USA 2007, 104, 11376–11381. [Google Scholar] [CrossRef] [PubMed]
  14. Teng, F.; Zhai, L.; Liu, R.; Bai, W.; Wang, L.; Huo, D.; Tao, Y.; Zheng, Y.; Zhang, Z. ZmGA3ox2, a candidate gene for a major QTL, qPH3.1, for plant height in maize. Plant J. 2013, 73, 405–416. [Google Scholar] [CrossRef] [PubMed]
  15. Xing, A.; Gao, Y.; Ye, L.; Zhang, W.; Cai, L.; Ching, A.; Llaca, V.; Johnson, B.; Liu, L.; Yang, X.; et al. A rare SNP mutation in Brachytic2 moderately reduces plant height and increases yield potential in maize. J. Exp. Bot. 2015, 66, 3791–3802. [Google Scholar] [CrossRef] [PubMed]
  16. Wei, L.; Zhang, X.; Zhang, Z.; Liu, H.; Lin, Z. A new allele of the Brachytic2 gene in maize can efficiently modify plant architecture. Heredity 2018, 121, 75–86. [Google Scholar] [CrossRef]
  17. Wang, F.; Yu, Z.; Zhang, M.; Wang, M.; Lu, X.; Liu, X.; Li, Y.; Zhang, X.; Tan, B.; Li, C.; et al. ZmTE1 promotes plant height by regulating intercalary meristem formation and internode cell elongation in maize. Plant Biotechnol. J. 2021, 20, 526–537. [Google Scholar] [CrossRef]
  18. Lv, H.; Zheng, J.; Wang, T.; Fu, J.; Huai, J.; Min, H.; Zhang, X.; Tian, B.; Shi, Y.; Wang, G. The maize d2003, a novel allele of VP8, is required for maize internode elongation. Plant Mol. Biol. 2013, 84, 243–257. [Google Scholar] [CrossRef]
  19. Birchler, J.A.; Yao, H.; Chudalayandi, S. Unraveling the genetic basis of hybrid vigor. Proc. Natl. Acad. Sci. USA 2006, 103, 12957–12958. [Google Scholar] [CrossRef]
  20. Lippman, Z.B.; Zamir, D. Heterosis: Revisiting the magic. Trends Genet. 2007, 23, 60–66. [Google Scholar] [CrossRef]
  21. Wang, H.; Xu, C.; Liu, X.; Guo, Z.; Xu, X.; Wang, S.; Xie, C.; Li, W.-X.; Zou, C.; Xu, Y. Development of a multiple-hybrid population for genome-wide association studies: Theoretical consideration and genetic mapping of flowering traits in maize. Sci. Rep. 2017, 7, 40239. [Google Scholar] [CrossRef] [PubMed]
  22. Hua, J.; Xing, Y.; Wu, W.; Xu, C.; Sun, X.; Yu, S.; Zhang, Q. Single-locus heterotic effects and dominance by dominance interactions can adequately explain the genetic basis of heterosis in an elite rice hybrid. Proc. Natl. Acad. Sci. USA 2003, 100, 2574–2579. [Google Scholar] [CrossRef] [PubMed]
  23. Tang, J.; Ma, X.; Teng, W.; Yan, J.; Wu, W.; Dai, J.; Li, J. Detection of quantitative trait loci and heterotic loci for plant height using an immortalized F2 population in maize. Chin. Sci. Bull. 2007, 52, 477–483. [Google Scholar] [CrossRef]
  24. Li, D.; Zhou, Z.; Lu, X.; Jiang, Y.; Li, G.; Li, J.; Wang, H.; Chen, S.; Li, X.; Würschum, T.; et al. Genetic dissection of hybrid performance and heterosis for yield-related traits in maize. Front. Plant Sci. 2021, 12, 774478. [Google Scholar] [CrossRef] [PubMed]
  25. Meuwissen, T.H.; Hayes, B.J.; E Goddard, M. Prediction of total genetic value using genome-wide dense marker maps. Genetics 2001, 157, 1819–1829. [Google Scholar] [CrossRef] [PubMed]
  26. Bernardo, R.; Yu, J. Prospects for genome wide selection for quantitative traits in maize. Crop. Sci. 2007, 47, 1082–1090. [Google Scholar] [CrossRef]
  27. Hickey, J.M.; Chiurugwi, T.; Mackay, I.; Powell, W. Genomic prediction unifies animal and plant breeding programs to form platforms for biological discovery. Nat. Genet. 2017, 49, 1297–1303. [Google Scholar] [CrossRef]
  28. Xu, Y.; Liu, X.; Fu, J.; Wang, H.; Wang, J.; Huang, C.; Prasanna, B.M.; Olsen, M.S.; Wang, G.; Zhang, A. Enhancing genetic gain through genomic selection: From livestock to plants. Plant Commun. 2019, 1, 100005. [Google Scholar] [CrossRef]
  29. Xu, S.; Zhu, D.; Zhang, Q. Predicting hybrid performance in rice using genomic best linear unbiased prediction. Proc. Natl. Acad. Sci. USA 2014, 111, 12456–12461. [Google Scholar] [CrossRef]
  30. Covarrubias-Pazaran, G. Genome-assisted prediction of quantitative traits using the R package sommer. PLoS ONE 2016, 11, e0156744. [Google Scholar] [CrossRef]
  31. Li, D.; Li, G.; Wang, H.; Guo, Y.; Wang, M.; Lu, X.; Luo, Z.; Zhu, X.; Weiß, T.M.; Roller, S.; et al. Genetic dissection of phosphorus use efficiency and genotype-by-environment interaction in maize. Int. J. Mol. Sci. 2022, 23, 13943. [Google Scholar] [CrossRef]
  32. Bernal-Vasquez, A.-M.; Utz, H.-F.; Piepho, H.-P. Outlier detection methods for generalized lattices: A case study on the transition from ANOVA to REML. Theor. Appl. Genet. 2016, 129, 787–804. [Google Scholar] [CrossRef]
  33. Cullis, B.R.; Smith, A.B.; Coombes, N.E. On the design of early generation variety trials with correlated data. J. Agric. Biol. Environ. Stat. 2006, 11, 381–393. [Google Scholar] [CrossRef]
  34. Butler, D.G.; Cullis, B.R.; Gilmour, A.R.; Gogel, B.J.; Thompson, R. ASReml-R Reference Manual Version 4; VSN International Ltd.: Hemel Hempstead, UK, 2017. [Google Scholar]
  35. Doyle, J.J.; Doyle, J.L. A rapid DNA isolation procedure for small quantities of fresh leaf tissue. Phytochem. Bull. 1987, 19, 11–15. [Google Scholar]
  36. Baurley, J.W.; Edlund, C.K.; Pardamean, C.I.; Conti, D.V.; Bergen, A.W. Smokescreen: A targeted genotyping array for addiction research. BMC Genom. 2016, 17, 145. [Google Scholar] [CrossRef]
  37. Furuta, T.; Ashikari, M.; Jena, K.K.; Doi, K.; Reuscher, S. Adapting genotyping-by-sequencing for rice F2 populations. G3 Genes|Genomes|Genet. 2017, 7, 881–893. [Google Scholar] [CrossRef]
  38. Meng, L.; Li, H.; Zhang, L.; Wang, J. QTL IciMapping: Integrated software for genetic linkage map construction and quantitative trait locus mapping in biparental populations. Crop J. 2015, 3, 269–283. [Google Scholar] [CrossRef]
  39. Pérez, P.; de los Campos, G. Genome-wide regression and prediction with the BGLR statistical package. Genetics 2014, 198, 483–495. [Google Scholar] [CrossRef]
  40. Wang, B.; Hou, M.; Shi, J.; Ku, L.; Song, W.; Li, C.; Ning, Q.; Li, X.; Li, C.; Zhao, B.; et al. De novo genome assembly and analyses of 12 founder inbred lines provide insights into maize heterosis. Nat. Genet. 2023, 55, 312–323. [Google Scholar] [CrossRef]
  41. Yi, Q.; Liu, Y.; Hou, X.; Zhang, X.; Li, H.; Zhang, J.; Liu, H.; Hu, Y.; Yu, G.; Li, Y.; et al. Genetic dissection of yield-related traits and mid-parent heterosis for those traits in maize (Zea mays L.). BMC Plant Biol. 2019, 19, 392. [Google Scholar] [CrossRef]
  42. Mayer, M.; Hölker, A.C.; González-Segovia, E.; Bauer, E.; Presterl, T.; Ouzunova, M.; Melchinger, A.E.; Schön, C.-C. Discovery of beneficial haplotypes for complex traits in maize landraces. Nat. Commun. 2020, 11, 4954. [Google Scholar] [CrossRef]
  43. Tang, J.; Tian, X.; Mei, E.; He, M.; Gao, J.; Yu, J.; Xu, M.; Liu, J.; Song, L.; Li, X.; et al. WRKY53 negatively regulates rice cold tolerance at the booting stage by fine-tuning anther gibberellin levels. Plant Cell 2022, 34, 4495–4515. [Google Scholar] [CrossRef]
  44. Yue, Z.L.; Liu, N.; Deng, Z.P.; Zhang, Y.; Wu, Z.M.; Zhao, J.L.; Sun, Y.; Wang, Z.Y.; Zhang, S.W. The receptor kinase OsWAK11 monitors cell wall pectin changes to fine-tune brassinosteroid signaling and regulate cell elongation in rice. Curr. Biol. 2022, 32, 2454–2466. [Google Scholar] [CrossRef]
  45. Li, H.; Zhang, Y.; Wu, C.; Bi, J.; Chen, Y.; Jiang, C.; Cui, M.; Chen, Y.; Hou, X.; Yuan, M.; et al. Fine--tuning OsCPK18/OsCPK4 activity via genome editing of phosphorylation motif improves rice yield and immunity. Plant Biotechnol. J. 2022, 20, 2258–2271. [Google Scholar] [CrossRef]
  46. Louis, J.; Basu, S.; Varsani, S.; Castano-Duque, L.; Jiang, V.; Williams, W.P.; Felton, G.W.; Luthe, D.S. Ethylene contributes to maize insect resistance1-mediated maize defense against the phloem sap-sucking corn leaf aphid. Plant Physiol. 2015, 169, 313–324. [Google Scholar] [CrossRef]
  47. Khadka, K.; Raizada, M.N.; Navabi, A. Recent progress in germplasm evaluation and gene mapping to enable breeding of drought-tolerant wheat. Front. Plant Sci. 2020, 11, 1149. [Google Scholar] [CrossRef]
  48. Xu, S. Mapping quantitative trait loci by controlling polygenic background effects. Genetics 2013, 195, 1209–1222. [Google Scholar] [CrossRef]
  49. Jiang, Y.; Schmidt, R.H.; Zhao, Y.; Reif, J.C. A quantitative genetic framework highlights the role of epistatic effects for grain-yield heterosis in bread wheat. Nat. Genet. 2017, 49, 1741–1746. [Google Scholar] [CrossRef]
  50. Zhao, Y.; Li, Z.; Liu, G.; Jiang, Y.; Maurer, H.P.; Würschum, T.; Mock, H.-P.; Matros, A.; Ebmeyer, E.; Schachschneider, R.; et al. Genome-based establishment of a high-yielding heterotic pattern for hybrid wheat breeding. Proc. Natl. Acad. Sci. USA 2015, 112, 15624–15629. [Google Scholar] [CrossRef]
  51. Sprague, G.F.; Tatum, L.A. General vs. specific combining ability in single crosses of corn. Agron. J. 1942, 34, 923–932. [Google Scholar] [CrossRef]
Figure 1. Genetic network and phenotype distributions of the traits in the IMF2 population. (A) Genetic network for the six traits. (BG) Phenotype distributions for the six traits. (B) PH, plant height; (C) EH, ear height; (D) PHAE, plant height above-ear; (E) TL, tassel length; (F) AENN, above-ear node number; and (G) AILAE, average internode length above-ear. The vertical dashed lines in (BG) indicate the mean values.
Agriculture 14 00340 g001
Figure 2. Proportion of the phenotypic variance contributed by each variance component in the hybrid population. (A) PH, plant height; (B) EH, ear height; (C) PHAE, plant height above-ear; (D) TL, tassel length; (E) AENN, above-ear node number; and (F) AILAE, average internode length above-ear. A, additive effect; D, dominance effect; AA, additive-by-additive effect; AD, additive-by-dominance effect; and DD, dominance-by-dominance effect.
Agriculture 14 00340 g002
Figure 3. QTL mapping for BLUE values of the six traits in the IMF2 population. PH, plant height; EH, ear height; PHAE, plant height above-ear; TL, tassel length; AENN, above-ear node number; and AILAE, average internode length above-ear.
Agriculture 14 00340 g003
Figure 4. Cyclic graph for epistatic QTLs identified for PH in the IMF2 population. The 10 colors in the ring represent the 10 chromosomes in maize. The numbers in the ovals indicate the positions of markers (cM) on chromosomes. The dotted lines indicate the interacting marker pairs of epistatic effect. The numbers on the dotted lines indicate the LOD scores of the QTLs.
Agriculture 14 00340 g004
Figure 5. Prediction accuracy of the two prediction models by partitioning the performance into different components in hybrid population. AD, additive and dominance effect; ADE, additive, dominance, and epistasis effect; GCA, general combining ability; and SCA, specific combining ability. a, b, c indicated significance at 0.05 level. PH, plant height; EH, ear height; PHAE, plant height above-ear; TL, tassel length; AENN, above-ear node number; and AILAE, average internode length above-ear.
Agriculture 14 00340 g005
Figure 6. The LOD and additive and dominance effect of QTLs and marker effect of GS for PH BLUE values in the IMF2 population. The red horizontal line in the uppermost part of the figure indicates the threshold value (4.3) of the identified fine-tuning QTLs. The solid vertical lines indicate the boundary of chromosomes. The dashed black vertical lines indicate the identified fine-tuning QTLs for PH. The dashed red vertical lines indicate the identified QTL overlapped with the reported PH gene-CNR13.
Agriculture 14 00340 g006
Table 1. Summary statistics for the traits in the IMF2 population.
TraitsMeanMinMaxSDCV (%)σ2Gσ2G×ENEh2
PH220.0173.0267.917.067.75271.76 **28.13 **30.94
EH78.658.8104.18.3610.6463.13 **8.37 **30.91
PHAE141.697.2174.812.708.97148.54 **17.17 **30.93
TL30.718.740.33.3410.899.41 **2.23 **30.85
AENN6.75.78.90.426.280.15 **0.01 **30.86
AILAE17.313.221.11.458.411.85 **0.22 **30.89
Notes: SD, standard deviation; CV, coeffificient of variance; σ2G, genotypic variance; σ2G×E, genotype-by-environment interaction variance; NE, the number of environments; h2, broad-sense heritability; **, significance at 0.01 level; PH, plant height; EH, ear height; PHAE, plant height above-ear; TL, tassel length; AENN, above-ear node number; and AILAE, average internode length above-ear.
Table 2. The pleiotropic loci identified for the tested traits under various environments.
Env.TraitChr.Pos.Left MarkerRight MarkerLODPVE (%)Add.Dom.
BLUEPH1141S1_110002889S1_1434440267.92.4−4.040.84
BLUEPHAE1141S1_110002889S1_1434440269.96.4−4.150.48
BLUEAILAE1141S1_110002889S1_14344402614.56.6−0.500.13
21XTPH1141S1_110002889S1_14344402672.424.3−21.760.65
21XTPHAE1141S1_110002889S1_14344402613.26.7−6.690.53
21XTAILAE1141S1_110002889S1_1434440264.23.2−0.350.12
BLUEPH1289S1_269329879S1_27032958526.29.3−8.230.91
BLUEPHAE1289S1_269329879S1_27032958520.213.7−6.081.53
21XTPH1289S1_269329879S1_27032958516.93.3−8.201.13
21XTPHAE1289S1_269329879S1_27032958538.523.8−12.841.78
BLUETL1290S1_273002635S1_27383645026.515.8−1.990.28
21XTTL1290S1_273002635S1_27383645012.58.0−1.550.21
BLUEAILAE1292S1_273608504S1_27516459010.94.7−0.430.11
21LYPH1292S1_273608504S1_2751645909.78.4−6.712.30
21LYPHAE1292S1_273608504S1_2751645905.45.3−4.040.75
21LYTL1295S1_279919454S1_2799825556.03.0−1.240.50
21LYPH2184S2_190810969S2_1914626339.07.9−6.682.63
21LYPHAE2184S2_190810969S2_1914626336.16.3−4.461.26
BLUEAILAE2185S2_190810969S2_1914626338.53.7−0.41−0.03
21XTAILAE2188S2_193721872S2_1938148246.65.0−0.460.19
BLUEEH2189S2_194070269S2_1949534359.57.3−2.941.29
21XTPH2190S2_194070269S2_19495343520.94.2−9.243.24
21XXEH2190S2_194070269S2_1949534356.54.9−2.250.63
BLUEPH2191S2_194953435S2_19589508811.23.4−4.892.16
21XXTL2271S2_241126960S2_2417905784.73.8−1.14−0.12
BLUETL2272S2_241126960S2_2417905787.54.0−0.97−0.37
BLUEPHAE2273S2_241126960S2_24179057810.36.8−4.45−0.45
21XTTL2274S2_241126960S2_2417905788.95.5−1.31−0.32
21XXPHAE2274S2_241126960S2_2417905788.46.5−4.531.31
BLUEEH2277S2_242359991S2_24317728911.28.93.241.31
21XTEH2277S2_242359991S2_2431772897.83.43.421.42
BLUEAENN2278S2_243537180S2_24410974612.62.0−0.17−0.03
21LYAENN2278S2_243537180S2_2441097465.61.2−0.14−0.01
21XTAENN2278S2_243537180S2_24410974613.93.0−0.18−0.04
Notes: PH, plant height; EH, ear height; PHAE, plant height above-ear; TL, tassel length; AENN, above-ear node number; and AILAE, average internode length above-ear. Pop., population; Env., environment; Chr., chromosome; Pos., position; PVE, phenotypic variance explained the QTL; Add., additive effect; Dom., dominance effect. Negative and positive values in add. and dom. Indicate that the effects are from the parents Zheng58 and PH6WC, respectively.
Disclaimer/Publisher’s Note: The statements, opinions and data contained in all publications are solely those of the individual author(s) and contributor(s) and not of MDPI and/or the editor(s). MDPI and/or the editor(s) disclaim responsibility for any injury to people or property resulting from any ideas, methods, instructions or products referred to in the content.

