Article

An Optimal Model to Improve Genomic Prediction for Protein Content and Test Weight in a Diverse Spring Wheat Panel

Department of Plant Sciences, University of Idaho Aberdeen R & E Center, Aberdeen, ID 83210, USA
*
Author to whom correspondence should be addressed.
Agriculture 2024, 14(3), 347; https://doi.org/10.3390/agriculture14030347
Submission received: 4 January 2024 / Revised: 13 February 2024 / Accepted: 19 February 2024 / Published: 22 February 2024
(This article belongs to the Section Crop Genetics, Genomics and Breeding)

Abstract

:
In recent years, genomic selection has been widely used in plant breeding to increase genetic gain. Selections are based on breeding values of each genotype estimated using genome-wide markers. The present study developed genomic prediction models for grain protein content (GPC) and test weight (TW) in a diverse panel of 170 spring wheat lines phenotyped in five environments. Five prediction models (GBLUP, RRBLUP, EGBLUP, RF, RKHS) were investigated. The population was genotyped for genome-wide markers with the Infinium iSelect 90 K SNP assay. Environmental variation was adjusted by calculating BLUPs across environments using the complete random effect GxE model. Both GPC and TW showed high heritability of 0.867 and 0.854, respectively. When using the five-fold cross-validation scheme in the five statistical models, we found that the EGBLUP model had the highest mean prediction accuracy (0.743) for GPC, while the RRBLUP model showed the highest mean prediction accuracy (0.650) for TW. Testing various proportions of the training population indicated that a minimum of 100 genotypes were required to train the model for optimum accuracy. Testing the prediction across environments showed that BLUPs outperformed 80% of the tested environments, even though at least one of the environments had higher prediction accuracies for each trait. Thus, the optimized GS model for GPC and TW has the potential to predict trait values accurately. Implementing GS would aid breeding through accurate early generation selection of superior lines, leading to higher genetic gain per breeding cycle.

1. Introduction

Bread wheat (Triticum aestivum L.), a common staple in the human daily diet, is cultivated worldwide on 220 million hectares, yielding more than 770 million metric tons [1]. It serves as a vital food source, providing around 21% of the protein and 19% of the calories for one-third of the world’s population [2]. In the global wheat market, exports contribute significantly to global food security [3]. The United States (US) has contributed substantially to the worldwide wheat market and, in 2022, exported wheat worth 8.49 billion US dollars [3]. Recent market trends show a worldwide increase in demand for high-quality wheat. This demand is driven by the stringent flour yield and functional quality requirements of millers and bakers, compelling nations globally to prioritize the cultivation of superior wheat varieties [4]. Achieving consistent, high-quality final products, however, requires the measurement of distinct quality attributes across various growing environments [5]. Developing high-yielding cultivars with exceptional end-use quality is a challenging yet vital objective for wheat breeding programs around the globe [6]. Achieving this goal, necessitates a comprehensive understanding of trait genetics and its interaction with the environment [7]. Determining grain quality attributes, influenced by the cultivar’s genetics and environmental factors, requires a profound knowledge of wheat grain at both the molecular and field levels [8,9].
Test weight (TW), the weight of a particular volume of grain [10,11], and grain protein content are two important grain quality traits that have been used in the grain trade market, milling, and baking industries [12]. Researchers have demonstrated a significant correlation between TW and total flour extracted, thus verifying the trait’s economic value [5,13]. However, environmental factors greatly influence TW and it also varies among cultivars grown in a single environment [14].
Grain Protein content (GPC) in wheat is a key aspect of grain composition and a measure of the end-use quality of wheat products. Higher GPC is desired for hard wheat, while lower protein is desired for soft wheat [15,16,17,18]. Wheat flour quality is determined by GPC and protein quality, which, together with consistent flour composition, are desired characteristics in the wheat flour sector [14].
Both TW and GPC are complex traits and are highly influenced by the Genotype (G) × Environment (E) interaction (GEI) [14,19]. Assessing and quantifying the contributions of (GEI) to the phenotypic variance is of utmost importance. Due to high GEI, environmental influences make phenotypic selection challenging, necessitating evaluations over multiple locations and years [20,21]. TW and GPC can only be measured when grains mature and after harvesting. Phenotypic evaluation of TW and GPC is costly. Molecular markers can improve the efficiency of a breeding program when used in marker-assisted selection (MAS), enhancing precision and speed in identifying and selecting moderate to large-effect QTLs (quantitative trait loci). However, MAS has limitations when dealing with complex traits such as TW and GPC controlled by many QTLs with small effects [22,23,24].
Recent advancements in low-cost, high-throughput genotyping technologies have revolutionized wheat breeding, providing an extensive collection of molecular markers spanning the entire wheat genome [25,26]. These markers facilitate genomic selection (GS) by enabling the prediction of genomic estimated breeding values (GEBVs) for wheat individuals lacking phenotypic records [27,28]. The comprehensive phenotyping and genotyping of the training population, which is used to estimate the GEBV of the genotypes in the actual test set, is necessary for highly accurate GEBV estimations and model calibration. The prediction accuracy of various GP models is influenced by the kind and quantity of genotypes present in the training population [27,29,30]. Genomic prediction studies have used a wide range of materials, including landrace, bi-parental, multi-parental, and diverse panels [31,32,33,34]. One approach to indirect selection in crop variety development is the incorporation of genetic data using different prediction models [20,35,36]. There have been several prediction models created and tested in the past. In general, the models differ in how they treat marker effects and how they take population structure into consideration. Plant breeding programs have used various parametric linear regression and non-parametric models for genomic prediction. While genomic selection (GS) has been extensively applied in wheat for yield and disease resistance, there is limited research on quality traits [31], particularly for spring wheat.
The present study aims to fill this gap by assessing the genomic prediction accuracy of different models, including parametric and semi-parametric approaches, to predict GPC and TW of wheat. Conducted in a diverse spring wheat panel across multiple environments, this research advances precision wheat breeding for improved GPC and TW.

2. Materials and Methods

2.1. Plant Genetic Material

A diverse panel of 170 spring wheat cultivars and elite lines was used in the present study [37,38]. This panel was developed by breeding programs in the Pacific Northwest region of the United States and by the International Maize and Wheat Improvement Center (CIMMYT, Mexico City, Mexico) (Table S1). The panel constitutes three market classes cultivated in the Americas (soft white spring, hard white spring, and hard red spring) and most of the lines (>50%) are the founder lines in cultivar development programs in the region.

2.2. Phenotypic Evaluation

The panel was planted in five environments, E1 to E5, where each year–location combination is considered an environment (E1 = 2016–Aberdeen, E2 = 2017–Aberdeen, E3 = 2017–Soda Springs, E4 = 2021–Aberdeen, and E5 = 2022–Aberdeen). Aberdeen, Idaho is located at 42°56′36″ N 112°50′22″ W and Soda Springs, Idaho is located at 42°39′29″ N 111°35′46″ W. The field design was a randomized complete block with two replications. Each genotype was planted in 3.0 m plots of 7 rows with a row-to-row distance of 21 cm. After harvest, the clean air-dried grains were processed through a Perten IM9500 Near Infra-red (NIR) whole grain analyzer (Perkin Elmer, Mölndal, Sweden). The grain analyzer uses near-infrared (570–1100 nm) to scan the wheat grains and quantify various constituent molecules. The percent moisture content, percent protein content, and test weight in lb/bu were calculated. The test weight was further converted to kg/hL using the formula (http://www.cawheat.org/resources/unit-conversion-factors/, accessed on 7 July 2023).
lb/bu to kg/hL (common wheat) = 1.292 × lb/bu + 1.419

2.3. Phenotypic Data Analysis

The replications were combined by fitting fixed effects models in single environments and mixed effects linear models across environments using META-R version 6.4 [39]. The fixed effect model was fitted considering genotypes as fixed effect (Equation (1)), and BLUPs (best linear unbiased prediction) were calculated as adjusted means across environments considering all effects as random (Equation (2)).
Yik = μ + Ri + Gk + εik
where Yik is the trait of interest, μ is the mean effect, Ri is the effect of the ith replicate, Gk is the effect of the kth genotype, and εik is the error associated with the ith replication and the kth genotype, which is assumed to be normally and independently distributed, with mean zero and homoscedastic variance σ2.
Yijk = μ + Ej + Ri (Ej) + Gk + Ej × Gk + εijk
where Yijk is the trait of interest, μ is the mean effect, Ej is the jth environment, Ri (Ej) is the effect of the ith replicate in the jth environment, Gk is the effect of the kth genotype, Ej × Gk is the effect of the jth environment by kth genotype interaction, and εijk is the error associated with the ith replication, the jth environment, and the kth genotype, which is assumed to be normally and independently distributed, with mean zero and homoscedastic variance σ2.
The broad-sense heritability was estimated using the formula
H2 = σ2g/(σ2g + σ2ge/(nEnvs + σ2e/(nreps × nEnvs)))
where σ2g is genotypic variance, σ2ge is G × E variance, σ2e is error variance, nEnvs is the number of environments, and nreps is the number of replications. The least significant difference (LSD) and coefficient of variation (CV) were also calculated across environments. The trait values across the five environments and BLUPs were plotted using ggplot2 v3.4.2 [40] and ggpubr v0.6.0 [41] in R v4.3.0 to study the distribution across environments.

2.4. Correlation and Principal Component Analyses

Correlation across the environments (including BLUPs) was calculated for the respective traits in R-studio using corrplot v0.92 [42]. The bivariate correlation analysis was completed to understand the effect of different environments on the traits. Furthermore, principal component analysis was performed to identify the number of principal components required to explain the variation across the environments along with BLUPs using FactoMineR v2.8 [43] and factoextra v1.0.7 [44] in R v4.3.0. The first two dimensions of the principal components were studied for both traits combined to establish the relationship between the traits in the present panel.

2.5. Genotyping

The panel was genotyped using a 90 K ISelect SNP chip by Illumina and is available at [37]. The raw data provided by the USDA/ARS cereal crop research unit were analyzed using Genome Studio [45]. Polymorphic markers were identified, showing clear distinctive clusters in Genome studio with a minimum distance between the polar coordinates of normalized theta intensity of 0.20. The markers were further filtered for missing data (>10%) and minor allele frequency (≥5%) using TASSEL version 5.2.89 [46].

2.6. Genomic Prediction Model Selection

Five statistical models, along with different ratios of training to validation sets, were employed to identify a suitable genomic prediction model for the traits. These models were chosen because of the assumption that they are appropriate for a range of trait genetic architectures [35]. Initially, using BLUPs across environments, both traits (TW and GPC) underwent assessment by statistical models, with genomic prediction accuracies calculated. The BWGS pipeline [47] was used to implement these five models in 50 replications. The most effective statistical model was then employed to predict the optimal size of the training set using various ratios of training to validation sets.

2.6.1. Genomic Best Linear Unbiased Prediction (GBLUP)

GBLUP predicts breeding values using a marker-based association matrix [25,48]. It is a parametric technique for estimating breeding values that makes use of the additive effect of the markers [49]. The baseline model is represented as
y = 1μ + Zg + e
where y is the vector of adjusted means of phenotypes, μ is the fixed effect vector of overall population mean, g is a vector of additive effects of genotypic values with normally distributed random marker effects with constant variance as g~N(0, 2g) where G is the matrix of genomic relationships, Z is an N × N matrix of markers, and e is the residual error distributed as e~N(0, 2e) where I is the identity matrix.

2.6.2. Epistatic Genomic Best Linear Unbiased Prediction (EGBLUP)

Epistatic Genomic Best Linear Unbiased Prediction (EGBLUP), a modification of G-BLUP, employs a “squared” relationship matrix to model epistatic 2 × 2 interactions [50] and is described as
y = 1μ+ Zg1 + Zg2 + e
where g1 is a vector of additive effects of genotypic values and g2 is a vector of additive × additive effects. The additive × additive effect matrix is defined as the Hadamard product of the additive effect matrix where H = G#G.

2.6.3. Ridge Regression Best Linear Unbiased Prediction (RRBLUP)

Theoretically, RR-BLUP (Ridge Regression) is equal to GBLUP, but in the GBLUP, marker information is included in the model using genomic relationships between individuals as determined by markers/SNPs. The RRBLUP model includes all markers and their effects are shrunken toward zero. The assumption of this model is that every marker has an equal contribution to the genetic variance. Based on phenotypic and marker data, a restricted estimated maximum likelihood (REML) function is used to assess marker effects and variance patterns. RR-BLUP incorporates ridge regression to account for multicollinearity among markers. The model is defined as
y = 1b + Zu + e
where b is the fixed effect vector, u is a random effect vector of additive effects of genotypic values with normally distributed random marker effects with constant variance as u~N(0, 2u) where G is the genomic relationship matrix and e is the vector of residual errors, assumed to follow a multivariate normal distribution with e~N(0, 2e) where I is the identity matrix. The ridge regression parameter is defined as σ2e2g.

2.6.4. Reproducing Kernel Hilbert Space (RKHS)

RKHS is a semiparametric regression technique that accounts for both additive and nonadditive effects. It uses mathematical functions called “kernels” to capture complex relationships between genetic markers and the trait of interest [51,52]. RKHS is of the same form as GBLUP where g = k and can be represented as follows:
y = 1μ + + e
where K is an n × n kernel matrix whose entries are functions of the marker profiles of pairs of genotypes, whereas e is the random effects vector of genotypic values. As implemented in the BWGS package using the BGLR library, the additive genetic effects are μ~N(0, 2g), where K is the Gaussian reproducing kernel, K(xi,xj) = exp{−[(xixj), (xixj)]/ℎ}, and σ2g is the additive genetic variance. RKHS models are flexible and can adapt to different data patterns but can be computationally expensive.

2.6.5. Random Forest (RF)

In the RF model, a multitude of trees is generated from an array of independent observations [53], and the tree average is used for the final prediction. The method introduces randomness by selecting a variable at each split in the tree, with this variable originating from a randomized subset of all predictor variables. Over the training set, several bootstrap samples are run to determine which feature subsets are most effective in dividing the tree nodes. According to [54], reducing the loss function for each bootstrapped sample is one of the primary requirements for splitting at the node. The equation for the RF model is
y ^ = 1 B b = 1 B y b ( x i )
where y ^ is the predicted value of the individual with genotype xi, y is the total number of trees, and B is the number of bootstrap samples.

2.7. Cross-Validation

A five-fold cross validation scheme was implemented during model selection. The whole set was randomly divided into five equal parts, and four parts were individually used as training sets, and the fifth part was used as a validation set. An optimal model was selected, and genomic prediction accuracies were tested for all the environments individually and across environments. For individual environments, model prediction accuracies were calculated by training and predicting in the same environment using sparse testing. For across environments, prediction accuracies were calculated by training the model in one environment and predicting in another.

3. Results

3.1. Phenotypic Evaluation

When compared across the environments, the randomized block design trial showed significant variation for both traits for each environment. The trial planted at soda springs (E3) showed highly skewed variation. For GPC, the BLUPs ranged from 11.93 to 15.67% with a mean of 13.82%, while E2 showed the highest range from 10.90 to 17.40%, and E3 showed the lowest but highly skewed range of 10.10 to 14.30% (Figure 1, Table S2). The IQR (interquartile range) values were relatively consistent (1.00–1.80) across the environments for GPC, reflecting the stability of the distribution within each environment. The coefficient of variation (CV) was low (0.06–0.11), indicating relatively low variability around the mean. The skewness values were mostly negative (−0.34 to 0.04), showing a slight leftward asymmetry in the distributions with environment E3 being the most skewed, while the kurtosis values suggest light-tailed distributions with values below zero ranging from −0.5 to −0.19. Similarly, for TW, BLUPs ranged from 74.46 to 80.29 kg/hl with a mean of 77.52 kg/hl, while E2 showed the highest range from 72.48 to 82.43 kg/hl and E3 showed the lowest but highly skewed range of 77.78 to 83.33 kg/hl. Across environments, for GPC, E3 showed the lowest mean of 12.21%, and E4 showed the highest mean of 15.31%. Across environments for TW, E1 showed the lowest mean of 76.02 kg/hl, and E3 showed the highest mean of 80.80 kg/hl. The range of values was relatively narrower for TW, and the IQR values indicated moderate dispersion (1.59–2.69). The CV was relatively low (0.01–0.03), reflecting consistency in variability. Skewness values were negative (−0.46 to −0.05), implying slight leftward skewness, while kurtosis values range from −0.69 to −0.02, suggesting distributions with relatively light tails. Broad sense heritability across the environments for both the traits was high, with GPC showing H2 of 0.867 and TW showing H2 of 0.854 with high genotypic significance (>10–50) (Table S3).

3.2. Correlation and Principal Component Analysis

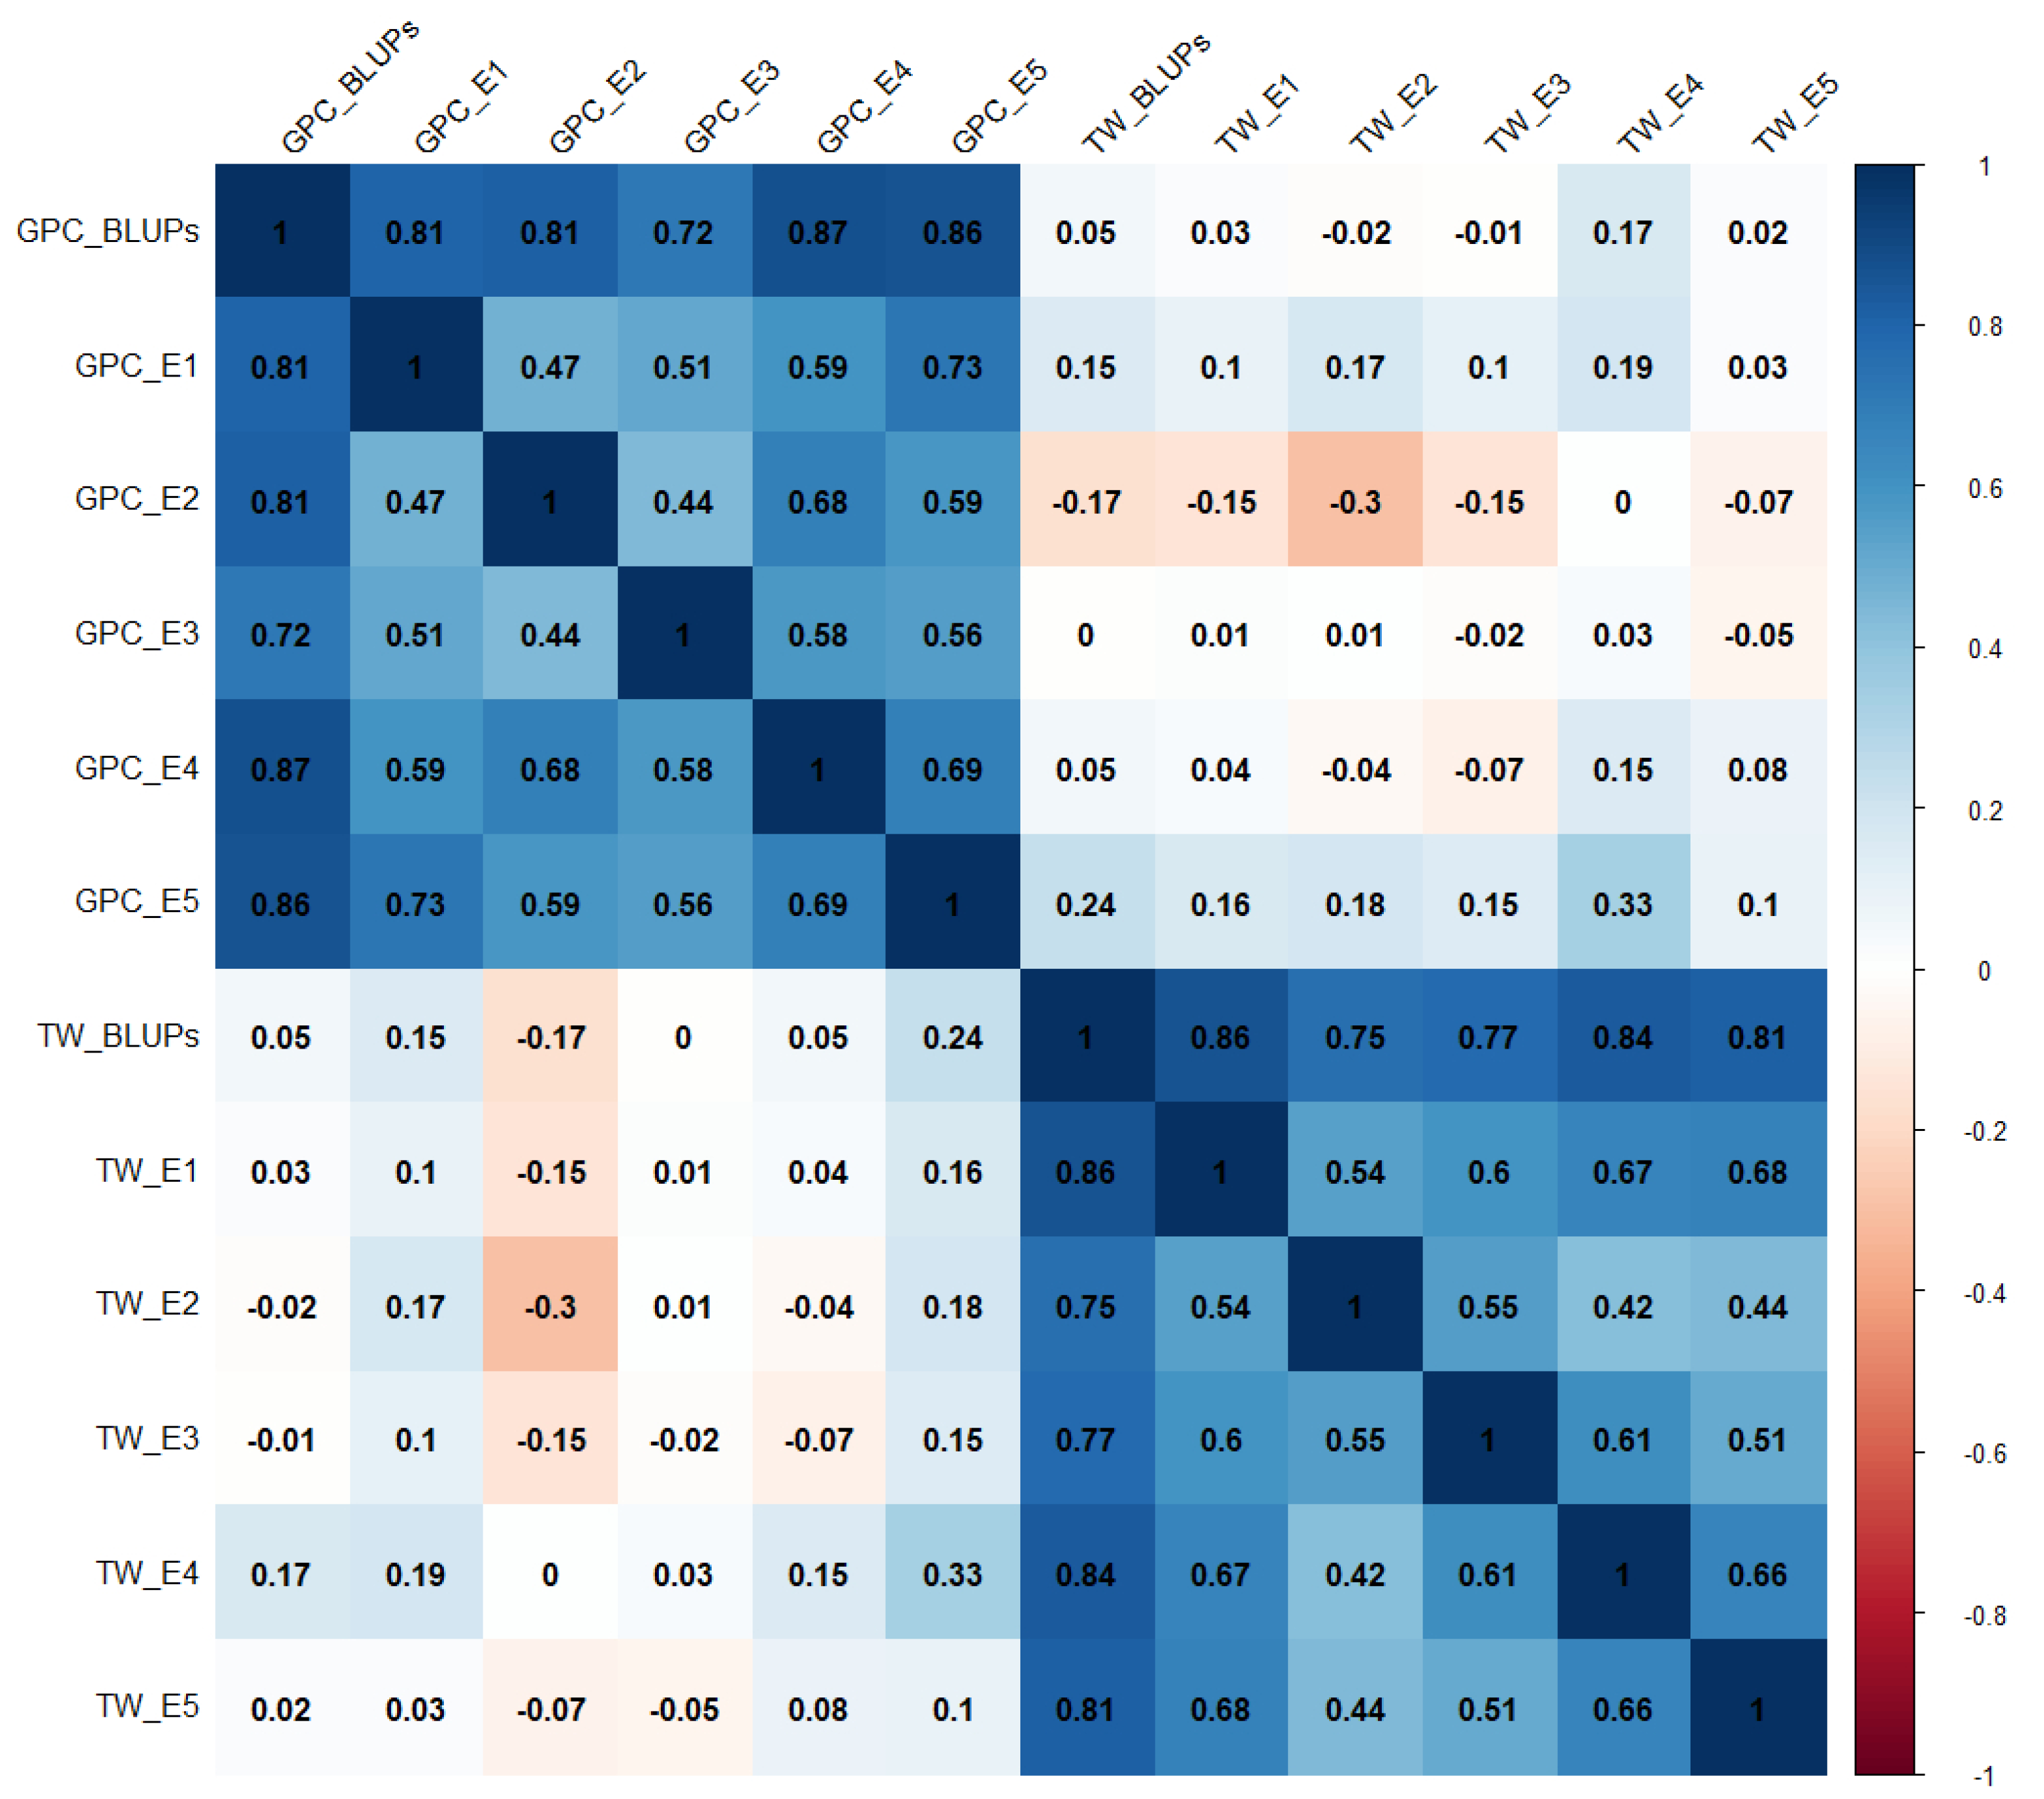
Both correlation and principal component analysis (PCA) were performed to evaluate phenotypic traits stability across environments and their relationship with the BLUPs calculated. BLUPs showed a significantly high positive correlation across the environments for both GPC (0.72–0.87) and TW (0.75–0.86), while E2 showed the lowest correlation of the trait values across the environments for both the traits (Figure 2). No significant correlation was observed among the traits for any of the environments by trait combinations. This result signifies that both traits were independent and cannot be used for indirect selection of each other. The PCA helps to understand the effect and networks among different components of variation, such as environments and traits.
When the multi-environment data for GPC and TW were analyzed for the first two dimensions of principal components, both traits were orthogonal indicating that they were independent and uncorrelated (Figure 3). Variations were observed among different environments, with E2 having the highest degree of variability. In contrast, E3 deviated from the patterns observed in other environments. Subsequent investigation into the BLUPs distribution for the traits indicated a reduction in variation when compared with the constituent environments (Figure 3). This reduction underscores the efficacy of the BLUPs in capturing and summarizing the genetic components underlying the traits across diverse environments.

3.3. Genotypic Data

When genotyped using the 90 K iSelect SNP chip and filtered for missing data and MAF, the wheat panel had 10,098 bi-allelic SNPs (Table S4). The positions for these SNPs were retrieved from the hexaploid wheat reference genome of Chinese spring wheat assembly Ref seq v2.1. A total of 9973 SNPs were mapped to the 21 chromosomes of the wheat genome, 94 were mapped on the unallocated scaffolds, and 31 SNPs were not mapped uniquely to either. Chromosome 2B had the most SNPs (843) and 4D had the fewest (115). About 40% of the SNPs were on the A genome, 34% on the B genome, with both genomes showing well distributed SNPs. Fewer SNPs were observed on the D genome (23%). Chromosome 4D had the lowest SNP density (0.223) and chromosome 5B had the highest (1.056). Most chromosomes showed an average distance between SNPs of 1 Mb. This distribution was skewed for the D genome chromosomes which showed a lower marker density with a higher average marker to the marker distance of 1.7 Mb (Table S5).

3.4. Genomic Prediction Model Selection

Five different statistical models were studied using the five-fold cross validation scheme to identify the optimal model for the respective traits. The EGBLUP model showed the highest mean prediction accuracy (0.743) with lowest IQR (0.019) for GPC, whereas the RRBLUP model showed the highest mean prediction accuracy (0.650) with a low IQR (0.032) for TW (Figure 4, Table S6). For GPC, RKHS (0.743) and RRBLUP (0.742) showed similar mean prediction accuracies to EGBLUP (0.743) and EGBLUP showed a more stable distribution of accuracies with low deviations. Similarly, TW GBLUP (0.634) and RF (0.638) showed similar mean prediction accuracies to RRBLUP (0.650).
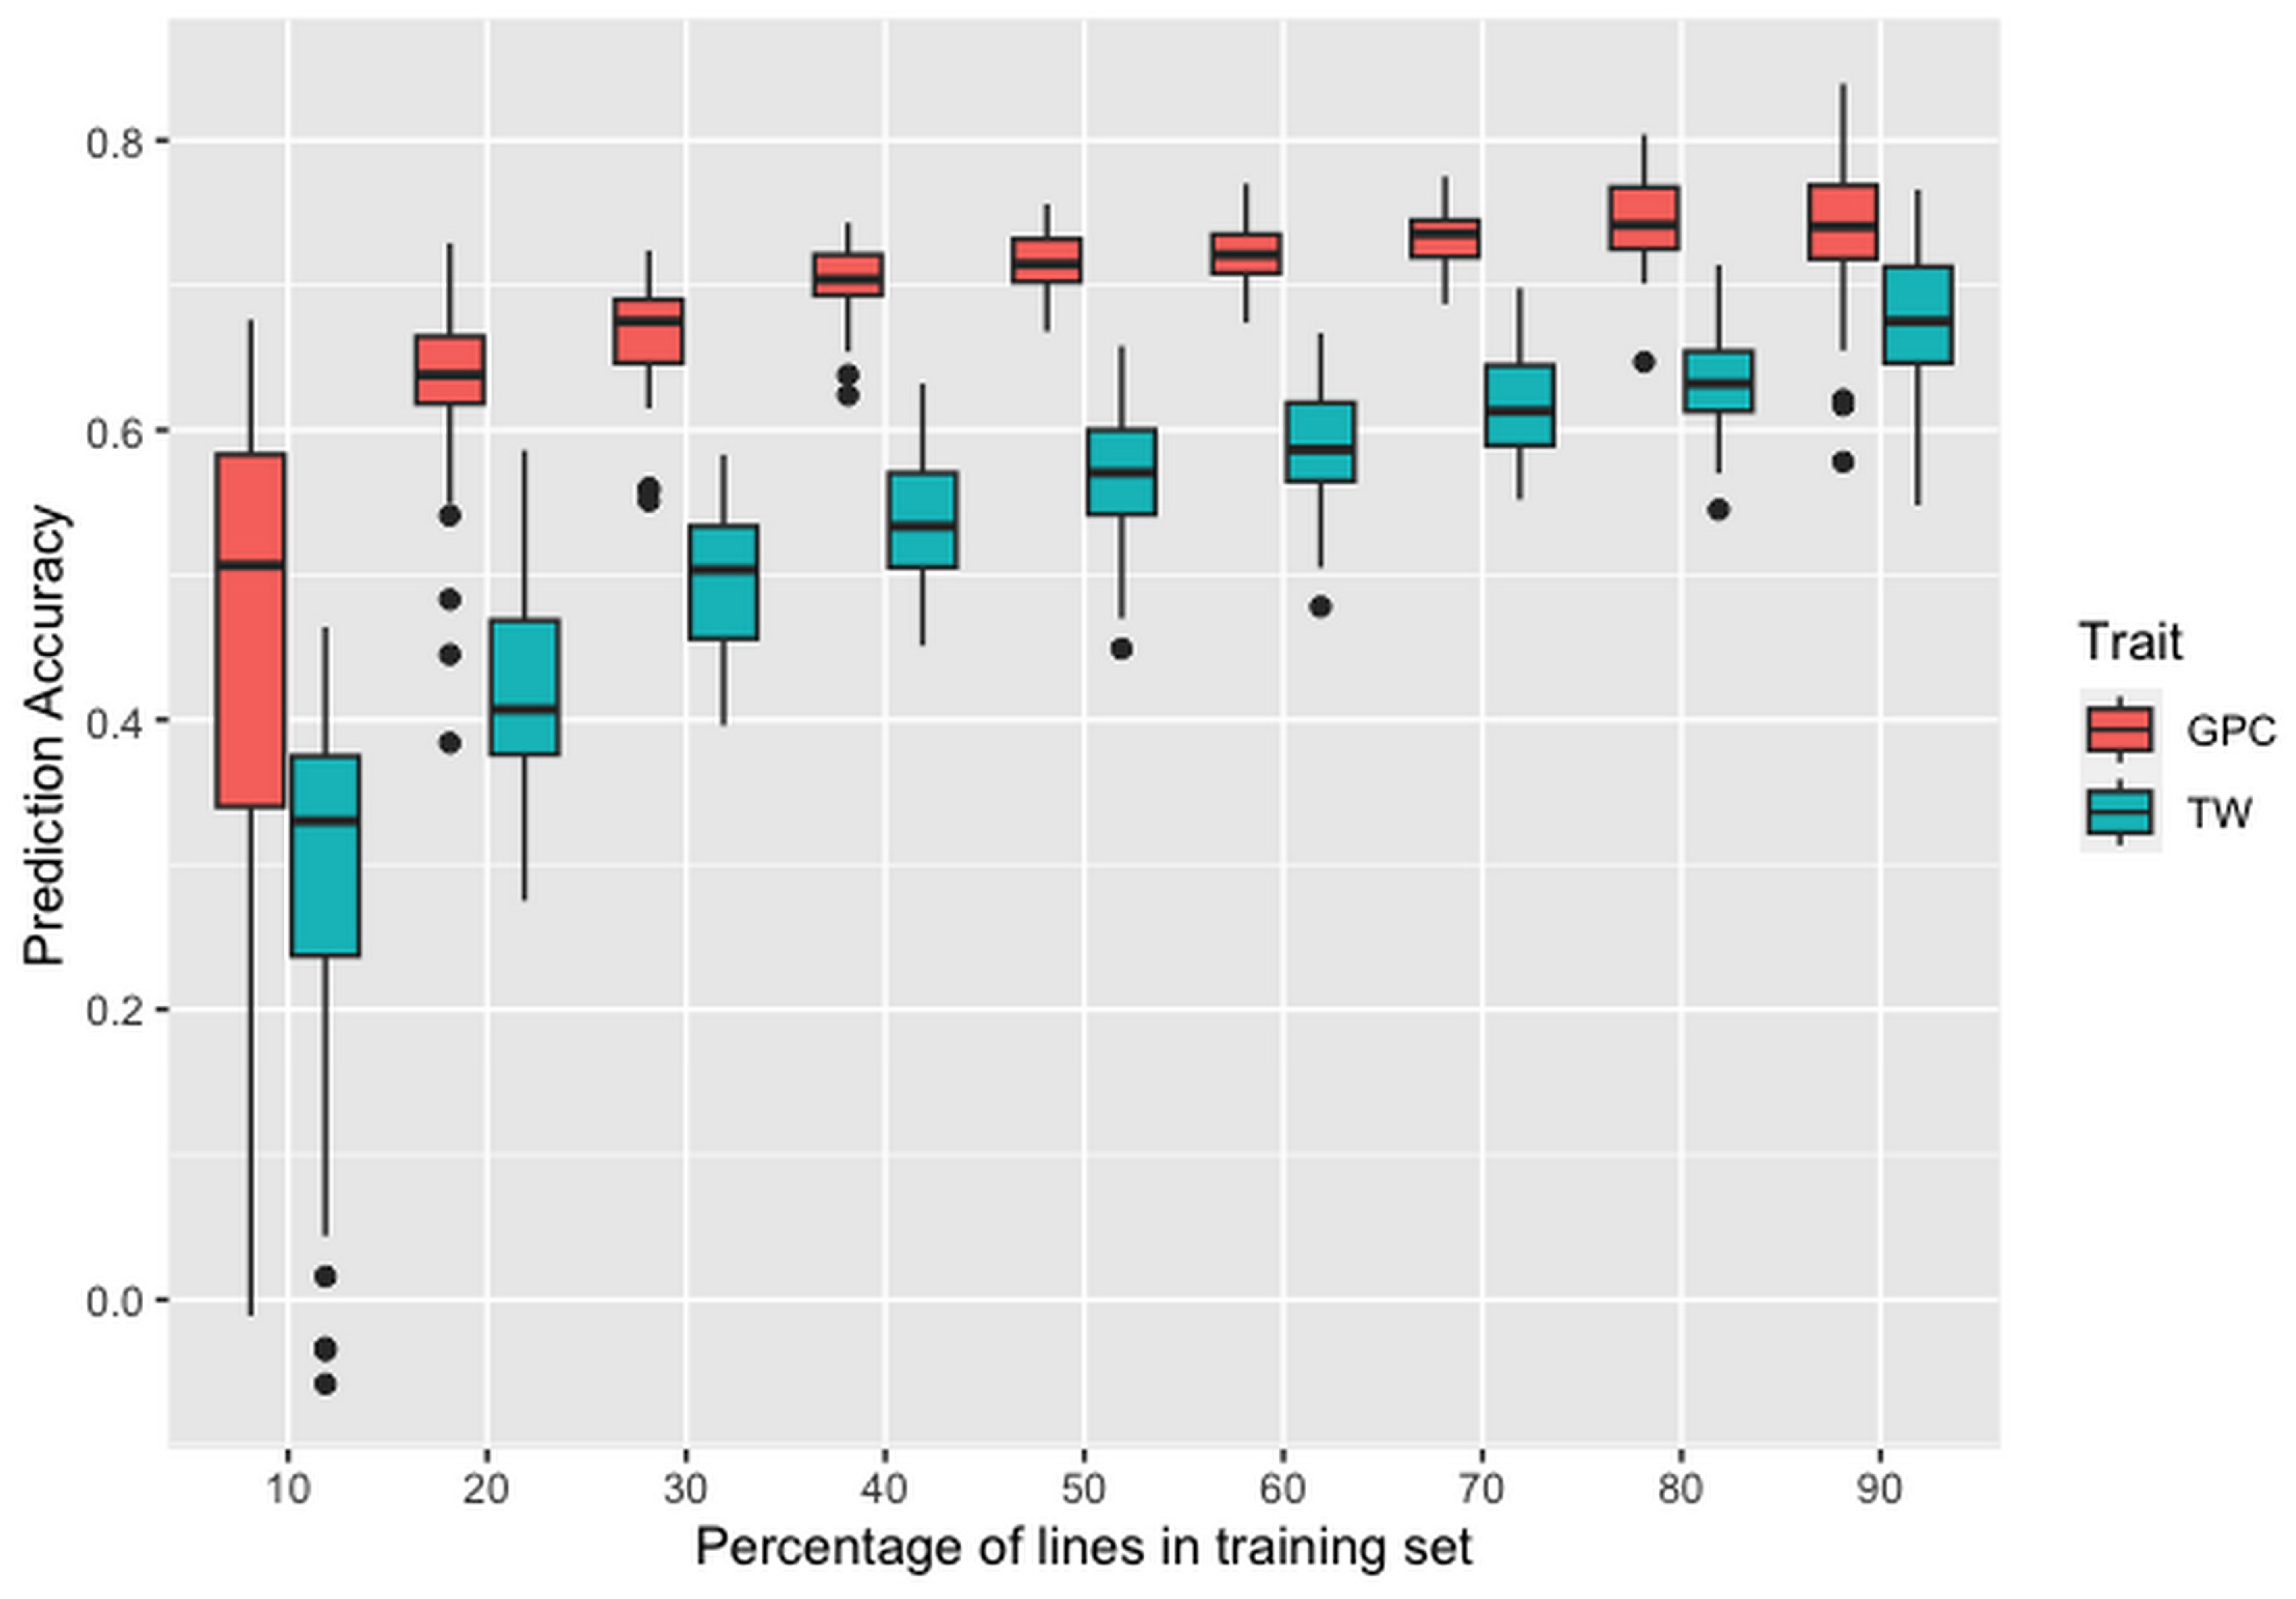
After selecting the optimum statistical model, the size (percentage proportion) of the training population was optimized for the respective traits with the respective models. Increasing the proportion of the training population for GPC from 40 (68) to 90% (153) increased the mean prediction accuracy ranging from 0.5 to 0.8 (Figure 5). The average prediction accuracies increased with increased training population proportions from 10 to 90. A similar trend was observed for TW but with a sharper increase in prediction accuracies. The mean prediction accuracies were above 60% when at least 70% of the individuals were used to train the model. Using 90% of the population for training produced the highest mean prediction accuracy of 68%. Populations with more than 100 genotypes produced prediction accuracies sufficient for use in breeding.

3.5. Testing Prediction across Environment

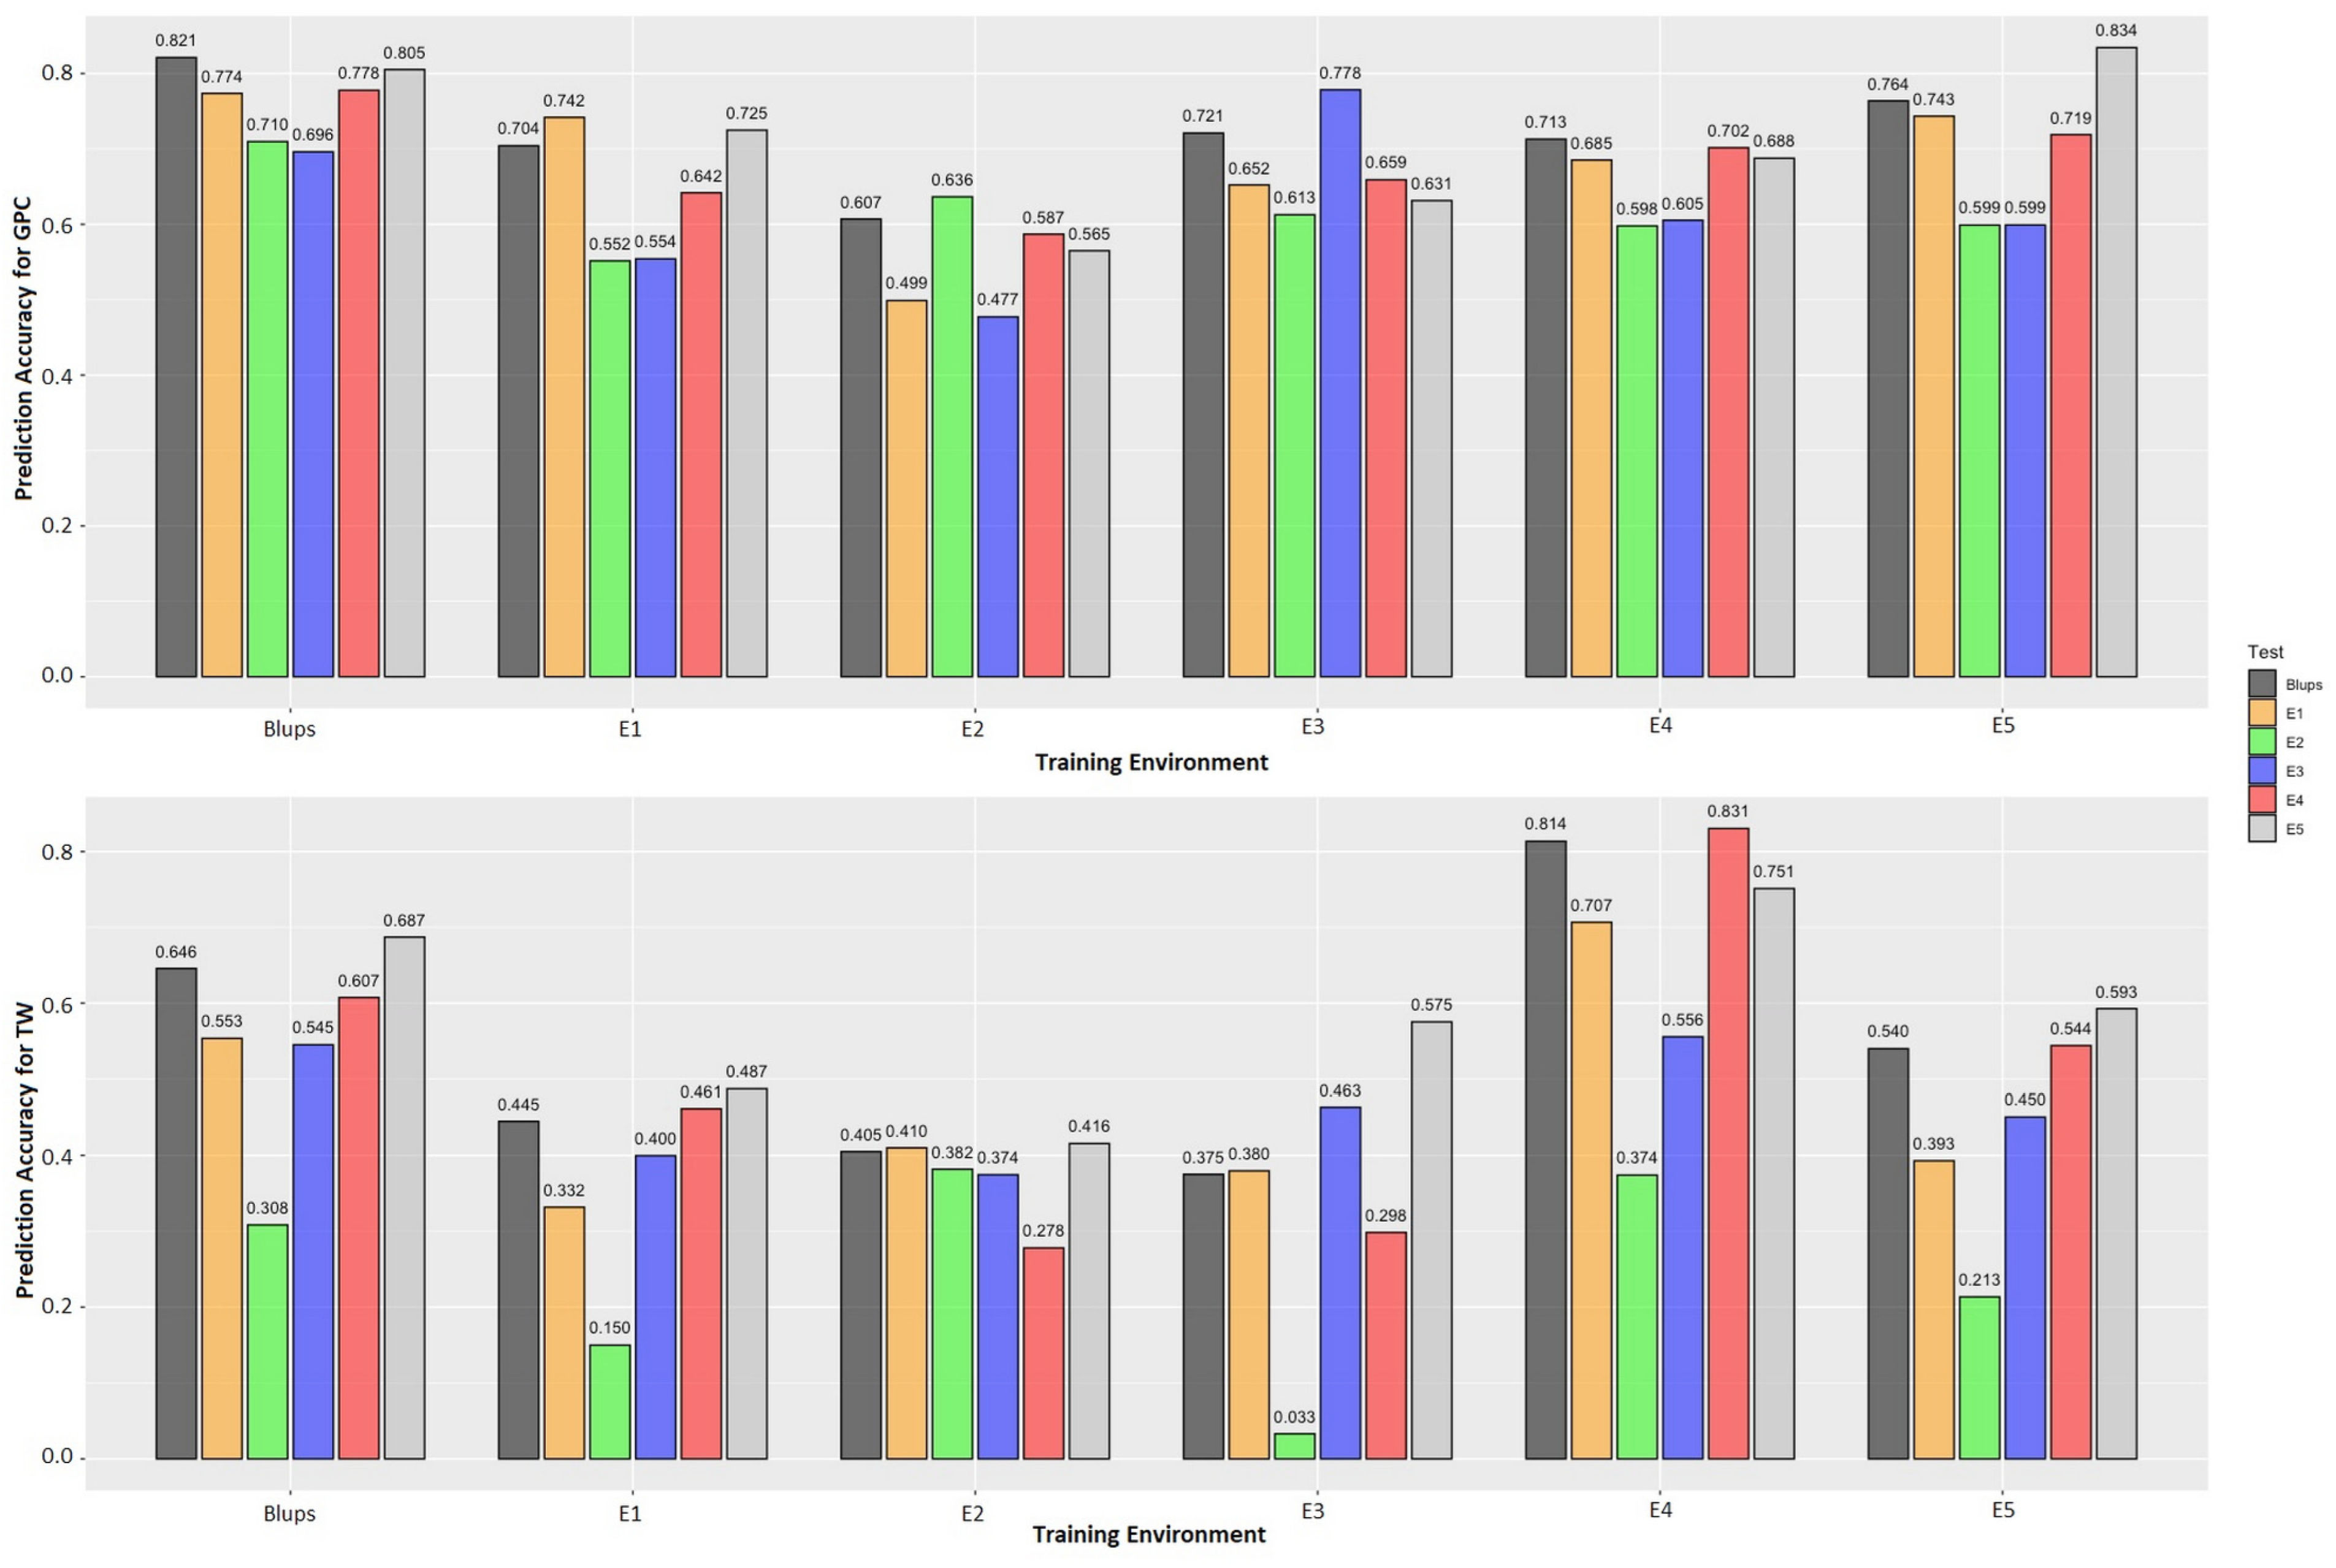
The optimal model was defined as a combination of the statistical model and proportion of training population (80%) with highest prediction accuracies and was used to train single environment models by training and predicting in the same environment. For GPC, environment E5 and BLUPs showed the highest predicting accuracy of 0.834 and 0.821, respectively. For TW, environment E4 and BLUPs showed the high predicting accuracy of 0.831 and 0.646, respectively. For each trait, at least one environment had a higher prediction accuracy than BLUPs, the BLUPs were better in 80% of the evaluated environments. (Figure 6).
When the models were trained in one environment and used to predict in different environments, large variations in environment combinations were observed for both the traits. For GPC, the range of prediction accuracies varied from 47.72 to 83.43% for different training-testing environment combinations and when the models were trained using BLUPs, the prediction accuracy ranged from 69.61 to 82.12%. Similarly, for TW, the range of prediction accuracies varied from 3.30 to 83.05% for different training-testing environment combinations and when the models were trained using BLUPs, the prediction accuracy ranged from 30.82 to 68.71% (Figure 6). Overall, using either single environment models or inter-environment models, the BLUPs were best for training the models to predict values for unknown environments.

4. Discussion

The success of a breeding program depends on the availability of genetic diversity, successful transfer of traits to different genetic backgrounds, and high efficiency of selection methods in selecting the trait combination [55,56]. Conventionally, selection has been based on visual field assessments. Phenotypic characters are greatly influenced by the production environment and by genotypic interaction [19,57]. Thus, breeding using phenotypic selection alone is challenging but progress can be enhanced greatly using genomic data. With the advent of low-cost sequencing technologies and the development of new statistical models using high-performance computing systems, genomics assisted breeding (GAB) has become an integral part of modern-day breeding programs [18,58]. GAB enables selection of phenotypes based on genotypic information. Since unlike phenotypic data, the genotypic data of an organism remains constant and independent of environment, the selection efficiencies are higher than with conventional methods. Genome-wide association studies (GWAS) and genomic prediction (GP) are crucial tools of GAB, enabling high efficiency selection in genetically diverse germplasm [59,60]. Genomic selection increases genetic gain thus reducing the breeding cycle time for highly quantitative traits with complex trait architecture [7,61]. Genomic selection efficiency depends on the accuracy of the genomic prediction model generated. Key model components include a statistical algorithm suited to the specific trait, an optimum sized training population, a training population that adequately represents the prediction population, and model stability across the environments [27,29,48,62].
In the present study, two important quality traits, GPC and TW, were studied across five environments in a diverse panel of 170 spring wheat genotypes. As found in previous work [5,63], phenotypic evaluation across environments showed normal distribution for both traits suggesting quantitative inheritance. The trait values across the environments were consistent except in environment E3 where lower GPC and higher TW occurred. Variation within the normal distribution may stem both from differences in genetic makeup and interactions with environmental conditions. However, the observed deviation in environment E3 could be due to the unique interaction between certain genotypes and the specific conditions present in that environment. The two quantitative traits showed high heritability indicating the possibility of high selection efficiency. High heritability has been reported previously for GPC and protein stability [31,64,65]. The two traits were independent of each other, with no correlation across environments and with a near 90-degree angle between the traits in the PCA biplot study. Other studies of GPC and TW in wheat have also concluded that the traits are independent [66,67]. BLUPs calculated across the environments to incorporate GXE interactions in the models reduced the overall unexplained variation in the respective environments. Using random effect models to calculate BLUPs reduced the error effect bias arising either from erroneous data recording, or from uncontrollable environmental effects on a few genotypes or on the trial as a whole [68]. This conclusion is supported by the fact that the BLUPs explained the traits by including the GxE and ExR effects, reducing the overall unexplained variation and the environmental variation and adjusting results for environment E3 [20,69,70]. We utilized phenotype BLUPs in the GS analysis. While some researchers [21] have recommended the use of BLUEs, considering them more appropriate; whereas, in numerous genomic prediction studies for wheat traits, BLUPs have been commonly utilized to assess genomic prediction accuracy [35,71,72,73,74]. We calculated for BLUEs across environment for the traits as well and observed a strong correlation between BLUEs and BLUPs, with a correlation coefficient of 1 and 0.99 for GPC and TW, respectively (Table S1), indicating a strong alignment between the two estimators in our specific context which can further be explained by similar ranking of the genotypes for both BLUEs and BLUPs. It is well established that in cases of high heritability, BLUEs tend to exhibit a high correlation with BLUPs as in our study [21].
Model optimization is key to any genomic prediction study. To optimize model selection, five statistical algorithms were tested for GPC and TW. For GPC, EGBLUP was found to be the best performing model. The EGBLUP model considers epistatic interactions in the genotypes by using a squared relationship matrix for marker effects [36]. Accounting for these interactions likely enhanced the capacity to model the intricate genetic architecture underlying GPC. For TW, RRBLUP best explained the variability in the phenotypic expression. RRBLUP uses a simple marker effect matrix with ridge regression over the smoothing parameter, explaining the variance as λ [75]. Genomic selection efficiency relies on both major and minor marker effects to be included in the model with weighted effects. Major marker/alleles are given more weight than minor effect alleles [76]. By incorporating both major and minor marker effects with appropriate weighting, these models can further be improved to more accurately account for the contribution of different genetic factors, ultimately leading to improved predictive accuracy and model performance. Despite this, RRBLUP showed decent and high accuracies for both the traits and can be used as a time and computation effective model. However, using different models was emphasized in our study to increase prediction accuracy and thus, potentially increase selection efficiency. If the traits studied are highly and positively correlated, then the same model can be used for simultaneous selection. However, developing separate models for different traits enables independent selection of each trait regardless of their segregation pattern in the population.
Training population size is not only dependent on the number of the individuals in the population, but also on the relationship with the testing population [29,77,78]. The diversity panel used in the present study mostly comprised breeding programs with similar objectives and had many common founder parents. Optimal prediction efficiencies were achieved with the panel when the models were trained with 100 or more genotypes. GPC showed excellent prediction accuracy when training population proportions of 70 to 90% were used and there was more than 70% prediction accuracy when at least 50% of the genotypes were used for training the model. Similarly, TW showed high accuracies with training population sizes of 70 to 90%.
Since phenotypically BLUPs explain more of the variation across environments, using BLUPs for training the models and predicting across environments results in higher prediction accuracies [21]. For both traits, models trained using BLUPs showed higher prediction accuracies in four out of the five environments when tested within the environments. Testing across the environments, BLUPs showed a higher prediction accuracy than models trained in other environments [5]. For TW, however, models trained in environment E4 showed an exceptionally high accuracy with up to 15% higher efficiencies than the model trained using BLUPs (Figure 6). This result suggests a higher complexity of TW [10,11,13]. Creating models using BLUPs, on the other hand, would perhaps be more reliable for predictions in unknown environments, and this hypothesis should be explored further in additional spring wheat panels across different environments [7]. The promising prediction accuracies observed in the present study are a first step in optimizing genomic selection models for GPC and TW in spring wheat. The robustness and applicability of these models should be confirmed with other genetically diverse wheat populations in other production environments to test the generalizability of our findings.

5. Conclusions

The present study compared five statistical models for their ability to predict breeding values for two quality traits, GPC and TW, across five environments. Prediction accuracy was variable based on the trait and model used, indicating the importance of optimizing the models used specific to the trait. Five-fold cross-validation and across-environment prediction scenarios were applied to compare model performance, resulting in moderate to high accuracy. A comparison of different statistical methods for GPC prediction indicated that EGBLUP was superior to RR-BLUP, G-BLUP, RKHS, and RF, whereas for predicting TW, RRBLUP outperformed other models. The size of the training population significantly affected prediction accuracy and optimal accuracies were reached when at least 100 genotypes were used to train the models. Higher relatedness of the training and predicting sets led to high selection accuracies using genomic prediction. The model optimization with high accuracies of the models indicates genomic selection can be used for wheat quality traits. These findings highlight the potential for genomic selection for improving wheat breeding efficiency.

Supplementary Materials

The following supporting information can be downloaded at https://www.mdpi.com/article/10.3390/agriculture14030347/s1, Table S1: List of 170 spring wheat lines used in this study with their phenotype; Table S2: Phenotypic variation in Grain Protein Content (GPC) and Test Weight (TW) across five environments and BLUPs across environments; Table S3: Genotypic variation in Grain Protein Content (GPC) and Test Weight (TW) for BLUPs across five environments; Table S4: Genotypic data used in this study; Table S5: Distribution of SNP markers across chromosomes in the wheat genome; Table S6: Prediction accuracies using five-fold cross-validation for different genomic prediction models for grain protein content (GPC) and test weight (TW) BLUPs across five environments.

Author Contributions

J.C.: conceptualized and supervised the experiments. P.J., J.W. and J.C.: performed the field trials. P.J. and G.S.D.: performed data curation, data analysis, software implementation, and wrote the original manuscript. Y.G. assisted in data collection. P.J., G.S.D., Y.G., A.K. and J.C. contributed to the interpretation of results and revision of the manuscript. All authors have read and agreed to the published version of the manuscript.

Funding

This project has been supported by the Idaho Wheat Commission, the Idaho Agricultural Experimental Station Project IDA01627, the Agriculture and Food Research Initiative Competitive Grants 2017-67007-25939 and 2022-68013-36439 (WheatCAP) from the USDA National Institute of Food and Agriculture.

Institutional Review Board Statement

Not application.

Data Availability Statement

All data generated during this study can be found in this article and its supplementary information file.

Conflicts of Interest

The authors declare no conflicts of interest.

References

  1. FAOSTAT—Statistical Databases. Food and Agriculture Organization of the United Nations. Available online: https://www.fao.org/faostat/en/#data/QCL (accessed on 7 July 2023).
  2. Shewry, P.R.; Hey, S.J. The Contribution of Wheat to Human Diet and Health. Food Energy Secur. 2015, 4, 178–202. [Google Scholar] [CrossRef]
  3. FAO. Available online: https://www.fas.usda.gov/data/commodities/wheat (accessed on 7 July 2023).
  4. Simons, K.; Anderson, J.A.; Mergoum, M.; Faris, J.D.; Klindworth, D.L.; Xu, S.S.; Sneller, C.; Ohm, J.-B.; Hareland, G.A.; Edwards, M.C.; et al. Genetic Mapping Analysis of Bread-Making Quality Traits in Spring Wheat. Crop Sci. 2012, 52, 2182–2197. [Google Scholar] [CrossRef]
  5. Nehe, A.; Akin, B.; Sanal, T.; Evlice, A.K.; Ünsal, R.; Dinçer, N.; Demir, L.; Geren, H.; Sevim, I.; Orhan, Ş.; et al. Genotype x Environment Interaction and Genetic Gain for Grain Yield and Grain Quality Traits in Turkish Spring Wheat Released between 1964 and 2010. PLoS ONE 2019, 14, e0219432. [Google Scholar] [CrossRef]
  6. Tilley, M.; Chen, Y.R.; Miller, R.A. 9—Wheat Breeding and Quality Evaluation in the US. In Breadmaking, 2nd ed.; Cauvain, S.P., Ed.; Woodhead Publishing Series in Food Science, Technology and Nutrition; Woodhead Publishing: Cambridge, UK, 2012; pp. 216–236. ISBN 978-0-85709-060-7. [Google Scholar]
  7. Wang, X.; Xu, Y.; Hu, Z.; Xu, C. Genomic Selection Methods for Crop Improvement: Current Status and Prospects. Crop J. 2018, 6, 330–340. [Google Scholar] [CrossRef]
  8. Smith, G.P.; Gooding, M.J. Models of Wheat Grain Quality Considering Climate, Cultivar and Nitrogen Effects. Agric. For. Meteorol. 1999, 94, 159–170. [Google Scholar] [CrossRef]
  9. Nuttall, J.G.; O’Leary, G.J.; Panozzo, J.F.; Walker, C.K.; Barlow, K.M.; Fitzgerald, G.J. Models of Grain Quality in Wheat—A Review. Field Crops Res. 2017, 202, 136–145. [Google Scholar] [CrossRef]
  10. Yamazaki, W.T.; Briggle, L.W. Components of Test Weight in Soft Wheat. Crop Sci. 1969, 9, 457–459. [Google Scholar] [CrossRef]
  11. Yabwalo, D.N.; Berzonsky, W.A.; Brabec, D.; Pearson, T.; Glover, K.D.; Kleinjan, J.L. Impact of Grain Morphology and the Genotype by Environment Interactions on Test Weight of Spring and Winter Wheat (Triticum aestivum L.). Euphytica 2018, 214, 125. [Google Scholar] [CrossRef]
  12. USDA; GIPSA; FGIS. Book II Grain Grading Procedures. In Grain Inspection Handbook; United States Department of Agriculture, Agricultural Marketing Service, Federal Grain Inspection Service: Washington, DC, USA, 2020. [Google Scholar]
  13. Schuler, S.F.; Bacon, R.K.; Finney, P.L.; Gbur, E.E. Relationship of Test Weight and Kernel Properties to Milling and Baking Quality in Soft Red Winter Wheat. Crop Sci. 1995, 35, 949–953. [Google Scholar] [CrossRef]
  14. Bordes, J.; Branlard, G.; Oury, F.X.; Charmet, G.; Balfourier, F. Agronomic Characteristics, Grain Quality and Flour Rheology of 372 Bread Wheats in a Worldwide Core Collection. J. Cereal Sci. 2008, 48, 569–579. [Google Scholar] [CrossRef]
  15. Shewry, P.R.; Halford, N.G.; Tatham, A.S.; Popineau, Y.; Lafiandra, D.; Belton, P.S. The High Molecular Weight Subunits of Wheat Glutenin and Their Role in Determining Wheat Processing Properties. Adv. Food Nutr. Res. 2003, 45, 219–302. [Google Scholar] [CrossRef] [PubMed]
  16. Uauy, C.; Brevis, J.C.; Dubcovsky, J. The High Grain Protein Content Gene Gpc-B1 Accelerates Senescence and Has Pleiotropic Effects on Protein Content in Wheat. J. Exp. Bot. 2006, 57, 2785–2794. [Google Scholar] [CrossRef] [PubMed]
  17. Shewry, P.R. Wheat. J. Exp. Bot. 2009, 60, 1537–1553. [Google Scholar] [CrossRef] [PubMed]
  18. Michel, S.; Löschenberger, F.; Ametz, C.; Pachler, B.; Sparry, E.; Bürstmayr, H. Combining Grain Yield, Protein Content and Protein Quality by Multi-Trait Genomic Selection in Bread Wheat. Theor. Appl. Genet. 2019, 132, 2767–2780. [Google Scholar] [CrossRef]
  19. Heslot, N.; Jannink, J.-L.; Sorrells, M.E. Perspectives for Genomic Selection Applications and Research in Plants. Crop Sci. 2015, 55, 1–12. [Google Scholar] [CrossRef]
  20. Tomar, V.; Singh, D.; Dhillon, G.S.; Chung, Y.S.; Poland, J.; Singh, R.P.; Joshi, A.K.; Gautam, Y.; Tiwari, B.S.; Kumar, U. Increased Predictive Accuracy of Multi-Environment Genomic Prediction Model for Yield and Related Traits in Spring Wheat (Triticum aestivum L.). Front. Plant Sci. 2021, 12, 720123. [Google Scholar] [CrossRef]
  21. Piepho, H.P.; Möhring, J.; Melchinger, A.E.; Büchse, A. BLUP for Phenotypic Selection in Plant Breeding and Variety Testing. Euphytica 2008, 161, 209–228. [Google Scholar] [CrossRef]
  22. Arruda, M.P.; Lipka, A.E.; Brown, P.J.; Krill, A.M.; Thurber, C.; Brown-Guedira, G.; Dong, Y.; Foresman, B.J.; Kolb, F.L. Comparing Genomic Selection and Marker-Assisted Selection for Fusarium Head Blight Resistance in Wheat (Triticum aestivum L.). Mol. Breed. 2016, 36, 84. [Google Scholar] [CrossRef]
  23. Kumar, A.; Jain, S.; Elias, E.M.; Ibrahim, M.; Sharma, L.K. An Overview of QTL Identification and Marker-Assisted Selection for Grain Protein Content in Wheat. In Eco-Friendly Agro-Biological Techniques for Enhancing Crop Productivity; Sengar, R.S., Singh, A., Eds.; Springer: Singapore, 2018; pp. 245–274. ISBN 978-981-10-6933-8. [Google Scholar]
  24. Beukert, U.; Thorwarth, P.; Zhao, Y.; Longin, C.F.H.; Serfling, A.; Ordon, F.; Reif, J.C. Comparing the Potential of Marker-Assisted Selection and Genomic Prediction for Improving Rust Resistance in Hybrid Wheat. Front. Plant Sci. 2020, 11, 594113. [Google Scholar] [CrossRef]
  25. Bernardo, R. Molecular Markers and Selection for Complex Traits in Plants: Learning from the Last 20 Years. Crop Sci. 2008, 48, 1649–1664. [Google Scholar] [CrossRef]
  26. He, J.; Zhao, X.; Laroche, A.; Lu, Z.-X.; Liu, H.; Li, Z. Genotyping-by-Sequencing (GBS), an Ultimate Marker-Assisted Selection (MAS) Tool to Accelerate Plant Breeding. Front. Plant Sci. 2014, 5, 484. [Google Scholar] [CrossRef] [PubMed]
  27. Combs, E.; Bernardo, R. Accuracy of Genomewide Selection for Different Traits with Constant Population Size, Heritability, and Number of Markers. Plant Genome 2013, 6, 1–7. [Google Scholar] [CrossRef]
  28. Meuwissen, T.H.; Hayes, B.J.; Goddard, M.E. Prediction of Total Genetic Value Using Genome-Wide Dense Marker Maps. Genetics 2001, 157, 1819–1829. [Google Scholar] [CrossRef] [PubMed]
  29. Zhang, A.; Wang, H.; Beyene, Y.; Semagn, K.; Liu, Y.; Cao, S.; Cui, Z.; Ruan, Y.; Burgueño, J.; San Vicente, F.; et al. Effect of Trait Heritability, Training Population Size and Marker Density on Genomic Prediction Accuracy Estimation in 22 Bi-Parental Tropical Maize Populations. Front. Plant Sci. 2017, 8, 1916. [Google Scholar] [CrossRef] [PubMed]
  30. Bassi, F.M.; Bentley, A.R.; Charmet, G.; Ortiz, R.; Crossa, J. Breeding Schemes for the Implementation of Genomic Selection in Wheat (Triticum Spp.). Plant Sci. 2016, 242, 23–36. [Google Scholar] [CrossRef] [PubMed]
  31. Sandhu, K.S.; Mihalyov, P.D.; Lewien, M.J.; Pumphrey, M.O.; Carter, A.H. Genomic Selection and Genome-Wide Association Studies for Grain Protein Content Stability in a Nested Association Mapping Population of Wheat. Agronomy 2021, 11, 2528. [Google Scholar] [CrossRef]
  32. Juliana, P.; Singh, R.P.; Braun, H.-J.; Huerta-Espino, J.; Crespo-Herrera, L.; Govindan, V.; Mondal, S.; Poland, J.; Shrestha, S. Genomic Selection for Grain Yield in the CIMMYT Wheat Breeding Program—Status and Perspectives. Front. Plant Sci. 2020, 11, 564183. [Google Scholar] [CrossRef] [PubMed]
  33. Brauner, P.C.; Müller, D.; Molenaar, W.S.; Melchinger, A.E. Genomic Prediction with Multiple Biparental Families. Theor. Appl. Genet. 2020, 133, 133–147. [Google Scholar] [CrossRef] [PubMed]
  34. Guzman, C.; Peña, R.J.; Singh, R.; Autrique, E.; Dreisigacker, S.; Crossa, J.; Rutkoski, J.; Poland, J.; Battenfield, S. Wheat Quality Improvement at CIMMYT and the Use of Genomic Selection on It. Appl. Transl. Genom. 2016, 11, 3–8. [Google Scholar] [CrossRef]
  35. Haile, T.A.; Walkowiak, S.; N’Diaye, A.; Clarke, J.M.; Hucl, P.J.; Cuthbert, R.D.; Knox, R.E.; Pozniak, C.J. Genomic Prediction of Agronomic Traits in Wheat Using Different Models and Cross-Validation Designs. Theor. Appl. Genet. 2021, 134, 381–398. [Google Scholar] [CrossRef]
  36. Martini, J.W.R.; Gao, N.; Cardoso, D.F.; Wimmer, V.; Erbe, M.; Cantet, R.J.C.; Simianer, H. Genomic Prediction with Epistasis Models: On the Marker-Coding-Dependent Performance of the Extended GBLUP and Properties of the Categorical Epistasis Model (CE). BMC Bioinform. 2017, 18, 3. [Google Scholar] [CrossRef] [PubMed]
  37. Wang, R.; Chen, J.; Anderson, J.A.; Zhang, J.; Zhao, W.; Wheeler, J.; Klassen, N.; See, D.R.; Dong, Y. Genome-Wide Association Mapping of Fusarium Head Blight Resistance in Spring Wheat Lines Developed in the Pacific Northwest and CIMMYT. Phytopathology 2017, 107, 1486–1495. [Google Scholar] [CrossRef] [PubMed]
  38. Dong, H.; Wang, R.; Yuan, Y.; Anderson, J.; Pumphrey, M.; Zhang, Z.; Chen, J. Evaluation of the Potential for Genomic Selection to Improve Spring Wheat Resistance to Fusarium Head Blight in the Pacific Northwest. Front. Plant Sci. 2018, 9, 911. [Google Scholar] [CrossRef] [PubMed]
  39. Alvarado, G.; Rodríguez, F.M.; Pacheco, A.; Burgueño, J.; Crossa, J.; Vargas, M.; Pérez-Rodríguez, P.; Lopez-Cruz, M.A. META-R: A Software to Analyze Data from Multi-Environment Plant Breeding Trials. Crop J. 2020, 8, 745–756. [Google Scholar] [CrossRef]
  40. Wickham, H. Ggplot2: Elegant Graphics for Data Analysis, 2nd ed.; Wickham, H., Ed.; Springer: New York, NY, USA, 2016; ISBN 978-3-319-24275-0. [Google Scholar]
  41. Kassambara, A. Ggpubr: ‘Ggplot2′ Based Publication Ready Plots. 2020. Available online: https://rpkgs.datanovia.com/ggpubr/ (accessed on 7 July 2023).
  42. Wei, T.; Simko, V. R Package “Corrplot”: Visualization of a Correlation Matrix. 2021. Available online: https://cran.r-project.org/web/packages/corrplot/index.html (accessed on 7 July 2023).
  43. Lê, S.; Josse, J.; Husson, F. FactoMineR: An R Package for Multivariate Analysis. J. Stat. Softw. 2008, 25, 1–18. [Google Scholar] [CrossRef]
  44. Kassambara, A.; Mundt, F. Factoextra: Extract and Visualize the Results of Multivariate Data Analyses. 2020, pp. 1–84. Available online: https://cran.r-project.org/package=factoextra (accessed on 7 July 2023).
  45. Illumina GenomeStudio Genotyping Module 2010. Available online: https://www.illumina.com/techniques/microarrays/array-data-analysis-experimental-design/genomestudio.html (accessed on 7 July 2023).
  46. Bradbury, P.J.; Zhang, Z.; Kroon, D.E.; Casstevens, T.M.; Ramdoss, Y.; Buckler, E.S. TASSEL: Software for Association Mapping of Complex Traits in Diverse Samples. Bioinformatics 2007, 23, 2633–2635. [Google Scholar] [CrossRef] [PubMed]
  47. Charmet, G.; Tran, L.-G.; Auzanneau, J.; Rincent, R.; Bouchet, S. BWGS: A R Package for Genomic Selection and Its Application to a Wheat Breeding Programme. PLoS ONE 2020, 15, e0222733. [Google Scholar] [CrossRef]
  48. Habier, D.; Fernando, R.L.; Dekkers, J.C.M. The Impact of Genetic Relationship Information on Genome-Assisted Breeding Values. Genetics 2007, 177, 2389–2397. [Google Scholar] [CrossRef]
  49. VanRaden, P.M. Efficient Methods to Compute Genomic Predictions. J. Dairy Sci. 2008, 91, 4414–4423. [Google Scholar] [CrossRef]
  50. Jiang, Y.; Reif, J.C. Modeling Epistasis in Genomic Selection. Genetics 2015, 201, 759–768. [Google Scholar] [CrossRef]
  51. Gianola, D.; van Kaam, J.B.C.H.M. Reproducing Kernel Hilbert Spaces Regression Methods for Genomic Assisted Prediction of Quantitative Traits. Genetics 2008, 178, 2289–2303. [Google Scholar] [CrossRef]
  52. de los Campos, G.; Naya, H.; Gianola, D.; Crossa, J.; Legarra, A.; Manfredi, E.; Weigel, K.; Cotes, J.M. Predicting Quantitative Traits with Regression Models for Dense Molecular Markers and Pedigree. Genetics 2009, 182, 375–385. [Google Scholar] [CrossRef]
  53. Breiman, L. Random Forests. Mach. Learn. 2001, 45, 5–32. [Google Scholar] [CrossRef]
  54. Shah, S.H.; Angel, Y.; Houborg, R.; Ali, S.; McCabe, M.F. A Random Forest Machine Learning Approach for the Retrieval of Leaf Chlorophyll Content in Wheat. Remote Sens. 2019, 11, 920. [Google Scholar] [CrossRef]
  55. Tessema, B.B.; Liu, H.; Sørensen, A.C.; Andersen, J.R.; Jensen, J. Strategies Using Genomic Selection to Increase Genetic Gain in Breeding Programs for Wheat. Front. Genet. 2020, 11, 578123. [Google Scholar] [CrossRef]
  56. Cobb, J.N.; Biswas, P.S.; Platten, J.D. Back to the Future: Revisiting MAS as a Tool for Modern Plant Breeding. Theor. Appl. Genet. 2019, 132, 647–667. [Google Scholar] [CrossRef]
  57. Hyles, J.; Bloomfield, M.T.; Hunt, J.R.; Trethowan, R.M.; Trevaskis, B. Phenology and Related Traits for Wheat Adaptation. Heredity 2020, 125, 417–430. [Google Scholar] [CrossRef] [PubMed]
  58. Purugganan, M.D.; Jackson, S.A. Advancing Crop Genomics from Lab to Field. Nat. Genet. 2021, 53, 595–601. [Google Scholar] [CrossRef] [PubMed]
  59. Gondro, C.; Van Der Werf, J.; Hayes, B. (Eds.) Genome-Wide Association Studies and Genomic Prediction; Methods in Molecular Biology; Humana Press: Totowa, NJ, USA, 2013; Volume 1019, ISBN 978-1-62703-446-3. [Google Scholar]
  60. Kumar, M.; Kumar, S.; Sandhu, K.S.; Kumar, N.; Saripalli, G.; Prakash, R.; Nambardar, A.; Sharma, H.; Gautam, T.; Balyan, H.S.; et al. GWAS and Genomic Prediction for Pre-Harvest Sprouting Tolerance in Spring Wheat. Mol. Breed. 2023, 43, 14. [Google Scholar] [CrossRef] [PubMed]
  61. Hayes, B.J.; Bowman, P.J.; Chamberlain, A.C.; Verbyla, K.; Goddard, M.E. Accuracy of Genomic Breeding Values in Multi-Breed Dairy Cattle Populations. Genet. Sel. Evol. 2009, 41, 51. [Google Scholar] [CrossRef] [PubMed]
  62. Dekkers, J.C.M.; Su, H.; Cheng, J. Predicting the Accuracy of Genomic Predictions. Genet. Sel. Evol. 2021, 53, 55. [Google Scholar] [CrossRef]
  63. Semagn, K.; Iqbal, M.; Jarquin, D.; Randhawa, H.; Aboukhaddour, R.; Howard, R.; Ciechanowska, I.; Farzand, M.; Dhariwal, R.; Hiebert, C.W.; et al. Genomic Prediction Accuracy of Stripe Rust in Six Spring Wheat Populations by Modeling Genotype by Environment Interaction. Plants 2022, 11, 1736. [Google Scholar] [CrossRef]
  64. Groos, C.; Robert, N.; Bervas, E.; Charmet, G. Genetic Analysis of Grain Protein-Content, Grain Yield and Thousand-Kernel Weight in Bread Wheat. Theor. Appl. Genet. 2003, 106, 1032–1040. [Google Scholar] [CrossRef]
  65. Miezan, K.; Heyne, E.G.; Finney, K.F. Genetic and Environmental Effects on the Grain Protein Content in Wheat. Crop Sci. 1977, 17, 591–593. [Google Scholar] [CrossRef]
  66. Syltie, P.W.; Dahnke, W.C. Mineral and Protein Content, Test Weight, and Yield Variations of Hard Red Spring Wheat Grain as Influenced by Fertilization and Cultivar. Plant Food Hum. Nutr. 1983, 32, 37–49. [Google Scholar] [CrossRef]
  67. White, J.; Sharma, R.; Balding, D.; Cockram, J.; Mackay, I.J. Genome-Wide Association Mapping of Hagberg Falling Number, Protein Content, Test Weight, and Grain Yield in U.K. Wheat. Crop Sci. 2022, 62, 965–981. [Google Scholar] [CrossRef]
  68. Hadfield, J.; Wilson, A.; Garant, D.; Sheldon, B.; Kruuk, L. The Misuse of BLUP in Ecology and Evolution. Am. Nat. 2009, 175, 116–125. [Google Scholar] [CrossRef] [PubMed]
  69. Dhillon, G.S.; Das, N.; Kaur, S.; Shrivastava, P.; Bains, N.S.; Chhuneja, P. Marker Assisted Mobilization of Heat Tolerance QTLs from Triticum durum-Aegilops Speltoides Introgression Lines to Hexaploid Wheat. Indian J. Genet. Plant Breed. 2021, 81, 186–198. [Google Scholar] [CrossRef]
  70. Tomar, V.; Dhillon, G.; Singh, D.; Poland, J.; Chaudhary, A.; Bhati, P.; Joshi, A. Evaluations of Genomic Prediction and Identification of New Loci for Resistance to Stripe Rust Disease in Wheat (Triticum aestivum L.). Front. Genet. 2021, 12, 710485. [Google Scholar] [CrossRef] [PubMed]
  71. Huang, M.; Cabrera, A.; Hoffstetter, A.; Griffey, C.; Van Sanford, D.; Costa, J.; McKendry, A.; Chao, S.; Sneller, C. Genomic Selection for Wheat Traits and Trait Stability. Theor. Appl. Genet. 2016, 129, 1697–1710. [Google Scholar] [CrossRef] [PubMed]
  72. Rabieyan, E.; Darvishzadeh, R.; Alipour, H. Genetic Analyses and Prediction for Lodging-related Traits in a Diverse Iranian Hexaploid Wheat Collection. Sci. Rep. 2024, 14, 275. [Google Scholar] [CrossRef]
  73. Lozada, D.N.; Carter, A.H. Genomic Selection in Winter Wheat Breeding Using a Recommender Approach. Genes 2020, 11, 779. [Google Scholar] [CrossRef]
  74. Belamkar, V.; Guttieri, M.J.; Hussain, W.; Jarquín, D.; El-basyoni, I.; Poland, J.; Lorenz, A.J.; Baenziger, P.S. Genomic Selection in Preliminary Yield Trials in a Winter Wheat Breeding Program. G3 Genes Genomes Genet. 2018, 8, 2735–2747. [Google Scholar] [CrossRef]
  75. Endelman, J.B. Ridge Regression and Other Kernels for Genomic Selection with R Package rrBLUP. Plant Genome 2011, 4, 255–258. [Google Scholar] [CrossRef]
  76. Wientjes, Y.C.J.; Bijma, P.; Calus, M.P.L.; Zwaan, B.J.; Vitezica, Z.G.; van den Heuvel, J. The Long-Term Effects of Genomic Selection: 1. Response to Selection, Additive Genetic Variance, and Genetic Architecture. Genet. Sel. Evol. 2022, 54, 19. [Google Scholar] [CrossRef]
  77. Cericola, F.; Jahoor, A.; Orabi, J.; Andersen, J.R.; Janss, L.L.; Jensen, J. Optimizing Training Population Size and Genotyping Strategy for Genomic Prediction Using Association Study Results and Pedigree Information. A Case of Study in Advanced Wheat Breeding Lines. PLoS ONE 2017, 12, e0169606. [Google Scholar] [CrossRef] [PubMed]
  78. Berro, I.; Lado, B.; Nalin, R.S.; Quincke, M.; Gutiérrez, L. Training Population Optimization for Genomic Selection. Plant Genome 2019, 12, 190028. [Google Scholar] [CrossRef] [PubMed]
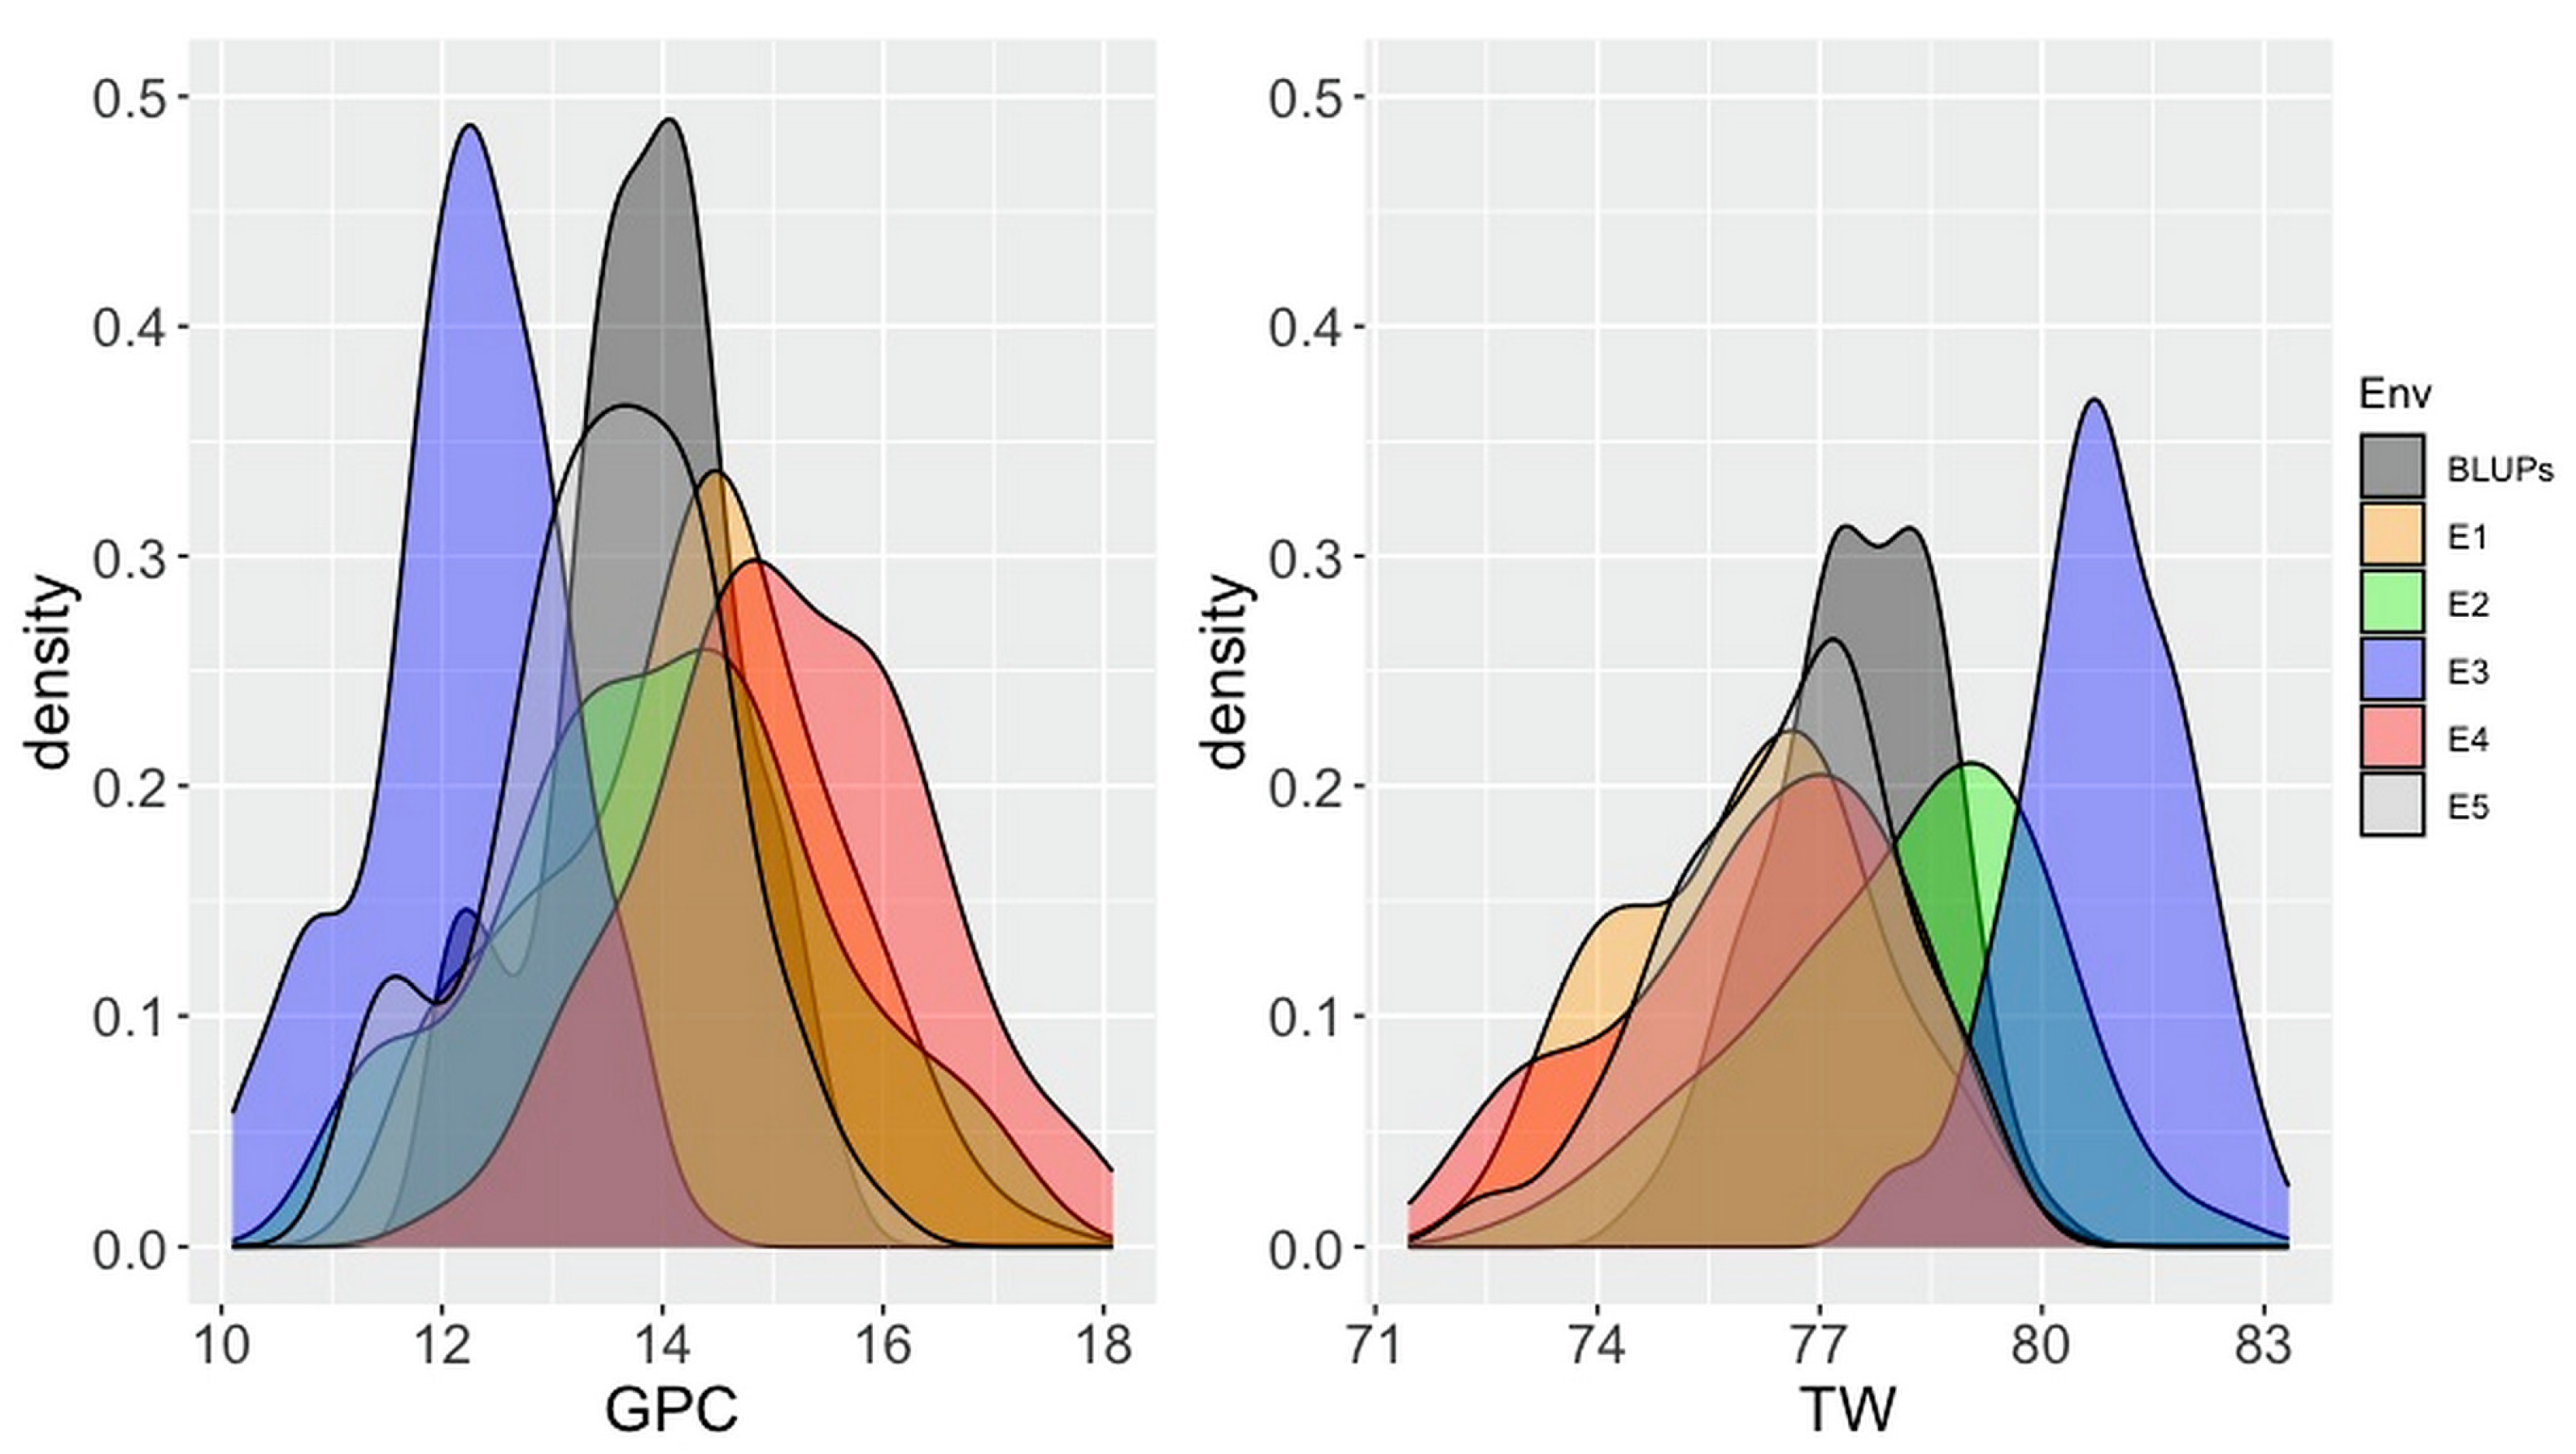
Figure 1. Distribution of grain protein content (GPC%) and test weight (TW kg/hl) across five environments (E1–E5) and BLUPs across environments.
Agriculture 14 00347 g001
Figure 2. Correlation of grain protein content (GPC%) and test weight (TW kg/hl) across five environments (E1–E5) and BLUPs across environments.
Agriculture 14 00347 g002
Figure 3. Principal component-based biplot analysis of grain protein content (GPC%) and test weight (TW kg/hl) across five environments (E1–E5) and BLUPs across environments.
Agriculture 14 00347 g003
Figure 4. Prediction accuracies for grain protein content (GPC%) and test weight (TW kg/hl) of five genomic prediction methods for the BLUPs calculated across environments.
Agriculture 14 00347 g004
Figure 5. Prediction accuracies for grain protein content (GPC%) and test weight (TW kg/hl) of the optimal method for BLUPs calculated across environments for different percentages of lines in the training set.
Agriculture 14 00347 g005
Figure 6. Prediction accuracies of the optimized model when tested within and across environments. X-axis denotes the environment in which the model was trained, and colors represent the predicted accuracy in each environment.
Agriculture 14 00347 g006
Disclaimer/Publisher’s Note: The statements, opinions and data contained in all publications are solely those of the individual author(s) and contributor(s) and not of MDPI and/or the editor(s). MDPI and/or the editor(s) disclaim responsibility for any injury to people or property resulting from any ideas, methods, instructions or products referred to in the content.