Article

The Quantitative Inhibition Effects of Meteorological Drought on Sugarcane Growth Using the Decision Support System for Agrotechnology Transfer-CANEGRO Model in Lai-bin, China

1
State Key Laboratory of Featured Metal Materials and Life-Cycle Safety for Composite Structures, Guangxi University, Nanning 530004, China
2
Guangxi Key Laboratory of Disaster Prevention and Engineering Safety, Guangxi University, Nanning 530004, China
3
Guangxi Provincial Engineering Research Center of Water Security Intelligent Control for Karst Region, College of Civil Engineering and Architecture, Guangxi University, Nanning 530004, China
*
Author to whom correspondence should be addressed.
Agriculture 2024, 14(3), 395; https://doi.org/10.3390/agriculture14030395
Submission received: 27 December 2023 / Revised: 17 February 2024 / Accepted: 27 February 2024 / Published: 1 March 2024
(This article belongs to the Section Agricultural Water Management)

Abstract

:
Sugarcane is the most important cash crop for producing sugar and the most promising high-yield bioenergy crop in China. Lai-bin is a major sugarcane growing and karst area in the Guangxi Province of China. However, frequent droughts over the years have caused huge losses on sugarcane production in this region. Therefore, the daily quantitative response mechanisms of sugarcane growth to multiple meteorological drought scenarios were discovered in Lai-bin using the DSSAT−CANEGRO model. The daily Standardized Precipitation Evapotranspiration Index (SPEI) was developed to detect the possible scenarios of meteorological drought events over the sugarcane growth periods. The results indicate that, in general, the inhibitory effect on sugarcane growth is enhanced by the increase in the intensity and duration of meteorological drought, which involved cane yield (CY), stem height (SH), leaf area index (LAI), and evapotranspiration (ET). Additionally, a light drought at the seedling stage and a light, moderate, and severe drought at the maturity stage give a promotion effect on sugarcane growth, but its overall CY increase rate is less than 5%. The stem elongation stage is the most sensitive period of sugarcane growth to all scenarios of meteorological drought, and the CY reduction rates reached 7.12%, 16.48%, 18.80%, and 29.05%, when the plants suffered from light, moderate, severe, and extreme meteorological droughts, respectively. Alternate drought–flood scenarios presented a facilitating or an inhibiting effect on sugarcane growth during different periods, which cannot be ignored. In conclusion, the quantitative function relationships between meteorological drought and sugarcane growth are revealed by this study.

1. Introduction

Drought can be comprehensively defined as the degree of water deficit of a certain region in a certain period relative to the average (such as precipitation, evapotranspiration, soil moisture, etc.) or specific target value (such as water demand of crops, water requirement for life, production, and ecology, etc.). The formation and evolution mechanism of drought is very complicated, and its influence is also extremely extensive. In recent years, climate change has increased the risk and severity of drought in most parts of the world, with more prominent and complex impacts on agriculture, especially for the crop growth process and yield accumulation [1,2]. Furthermore, the influence mechanism has the characteristics of multi-stage chain transmission from meteorological drought to soil drought, and then to the physiological and ecological response of crops [1,3,4]. The latest research shows that drought intensification is most prominent in southwest China [5,6]. It especially occurs in areas where mountains, hills, and karst are widely distributed, slope farmland is numerous and broken, and crop growth is mainly rain-fed [7]. Unfortunately, there is a lack of detailed and systematic research on the chain transmission process of drought and its quantitative impact on crops in this region [8]. This has resulted in huge losses in regional crop yields due to droughts over the years. Therefore, the development of a multi-scenario, day-by-day drought response mechanism for the growth of water-intensive crops (such as sugarcane) in the region is of vital scientific significance and socio-economic value for agricultural production, food, and bioenergy security in China, and even the world.
Sugarcane in this study is the most promising high-yielding bioenergy crop with high-water consumption and is used in sugar manufacturing all over the world [9,10]. Guangxi is located in the subtropical humid monsoon climate zone in China, with sufficient rainfall and heat conditions suitable for sugarcane growth. It has become the largest sugarcane economic production area and sucrose safe area of China. Its annual sugarcane planting area and sucrose production account for more than 60% of the total national output [11]. However, Guangxi has suffered huge losses in sugarcane production due to frequent meteorological droughts in recent decades. A number of factors have contributed to this result, such as the spatio-temporal heterogeneity of rainfall, numerous rocky hills, widely distributed karst, the poor water retention capacity of the soil, and inadequate irrigation [12]. Thus, it is urgently needed to clarify the mechanism of sugarcane growth response to multiple meteorological drought scenarios at a daily scale in Lai-bin, one of the main sugarcane producing areas in Guangxi, which will provide important scientific support for regional refined drought dynamic risk regulation, early warning, and the effective intelligent management of sugarcane to achieve the purpose of effectively reducing yield losses.
Most recent studies on sugarcane have focused on the effects of physiological and biochemical indicators and morphological characteristics under water deficit stress [13,14,15,16]. Relatively few studies have revealed the inhibition effect(s) of meteorological and soil drought on sugarcane growth and development using crop growth models, which reflect the interaction between crop growth and environmental conditions [17]. Several studies have utilized the DSSAT−CANEGRO model to simulate sugarcane growth processes [18]. Marin [19] used the local parametric DSSAT−CANEGRO model to simulate the growth of sugarcane in southern Brazil, and found that the model had good simulation accuracy for stalk and aboveground mass. Singels [20] employed GCMs and DSSAT models to reveal the effects of climate change scenarios (such as CO2 change, temperature rise, etc.) on sugarcane canopy development (such as photosynthesis, respiration, transpiration, etc.) in Australia, South Africa, and Brazil. It was found that rising temperature would promote canopy development, but also cause drought pressure on rain-fed sugarcane. The study points out that the interaction mechanism of the above factors needs to be further explored. Murilo and Sentelhas [21] adopted the DSSAT model to reveal the effect of complementary irrigation strategies on the yield of rain-fed sugarcane in Brazil. The study found that the response of sugarcane to water mainly depended on the amount of water, soil type, and planting date. The average yield of sugarcane in this region was not increased by more than 30% under various irrigation scenarios. Jones and Singels [18,22] revised the algorithms of the DSSAT−CANEGRO model for tillering, respiration, and crop water relations to achieve a more realistic simulation of the response of sugarcane to climate change in Brazil and South Africa. These studies demonstrated that the DSSAT−CANEGRO model is useful for evaluating sugarcane growth and development. However, the DSSAT−CANEGRO model has limited application in China, which needs to be strengthened.
In addition, the meteorological drought scenarios of crop (sugarcane) response have presented a multi-factor and multi-dimensional representation, such as intensity, duration, area, concentration point, and migration rate [23]. And many regional drought monitoring studies have been refined to daily time scales [24,25], and have spatially integrated sky (satellite), air (UAV), and ground (ground monitoring) multi-source fusion datasets for heterogeneity analysis [26]. Consequently, the agricultural drought response mechanism is nowadays refined for smart agricultural management [27]. Wang [28] proposed the daily SPEI that can precisely quantify the daily accumulation of meteorological drought intensity, duration, and influential area. It is also suitable for the response expression of daily sugarcane growth for this study target, involved yield, stalk, leaf area, biomass, etc.
The main objective of this study was to quantify the inhibition effects of several meteorological drought scenarios, specified on the daily time scale with different intensities and durations, during various stages of sugarcane growth and development. In other words, the quantitative function relationships between meteorological drought (daily SPEI) and sugarcane growth (e.g., cane yield, stalk height, leaf area index, and evapotranspiration) on the daily scale are the focus of this work. The results can provide quantitative scientific support for sugarcane drought early warning and intelligent dynamic water supply regulation in Guangxi, China.

2. Materials and Methods

2.1. Study Area

Lai-bin city, located between 108°24′–110°28′ E and 23°16′–24°29′ N, is a subtropical monsoonal humid climate zone of China, with the predominant landform types being mountains, hills, and karst (Figure 1). Its annual average sunshine reaches 1300–1700 h and the annual average temperature ranges from 19 to 26 degrees Celsius. Adequate light and heat conditions are compatible with the requirements for sugarcane growth and maturity. Lai-bin is not only the second largest sugarcane planting area of Guangxi, with 140,000 hm2 annual planted area [29,30], but its sugarcane yields are also most negatively affected due to meteorological drought events [12,31]. Although its annual precipitation of 1200–1900 mm is mainly concentrated during April-August, the karst features within and surrounding Lai-bin result in shallow soils with weak water-holding capacity, and a fragile ecological environment, all of which contribute to the occurrence of flash soil drought events [32]. Therefore, frequent meteorological and agricultural drought events in Lai-bin have resulted in significant losses of sugarcane yield in recent decades. Inadequate irrigation has exacerbated the sugarcane yield losses under drought conditions.

2.2. Datasets

This study utilized three types of datasets, meteorological, soil, and field experimental data. The meteorological data were obtained from the daily scale China Meteorological Forces Dataset (CMFD), which is a 0.1° spatial resolution grid dataset developed by Chinese scholars, and it includes daily rainfall, maximum temperature, minimum temperature, average temperature, relative humidity, wind speed, and solar radiation, for 40 consecutive years between 1979 and 2018 [26]. This data combination of remote-sensing products, reanalysis datasets, and in situ station data, with continuous-time coverage and constant quality, makes it one of the most commonly utilized climatic meteorological datasets currently available in China. Its reliability has already been confirmed in southern China [33]. In this study area, the CMFD datasets achieved good accuracy, with a Pearson’s correlation coefficient of 0.8 and 0.98 for daily rainfall and temperature, respectively, compared to the data of ground meteorological stations. These data can support the input requirement of weather information for the DSSAT−CANEGRO model.
Soil data were obtained from the China Soil Database based on the World Soil Database (HWSD), which is provided by the National Cryosphere Desert Data Center [34] (http://www.ncdc.ac.cn (accessed on 26 December 2023)). The spatial and temporal resolution of these grid soil data is 1:100 million (corresponding to a 1000 m grid) and daily (corresponding to a daily time series), respectively. Specifically, the data include soil type and soil profile characteristics, i.e., soil name, color, farmland slope, mineralization, soil texture (percentage of clay, powder, and sand), soil capacity, field water-holding capacity, wilting coefficient, saturated water content, organic carbon content, total nitrogen content, and pH value. These data can support the input requirement of soil information for the DSSAT−CANEGRO model.
Two sugarcane field experiment monitoring datasets were used for the parameter calibration and simulation verification of the DSSAT−CANEGRO model in this work (Figure 1d). One was obtained from the experimental station of the Agricultural Academy of Xing-bin District in Lai-bin during 2011–2012a by Li [35]. Another was derived from sugarcane in situ monitoring in Qian-jiang town and Long-pan village of Lai-bin during 2015–2016a by Ou [36]. The former was used to calibrate model parameters, and the latter was used to verify model simulation results. These datasets include several crop growth parameters, such as cane yield, stalk height, leaf area index, and aerial dry biomass. Their quantified data are shown in Section 4.1 and can support the model applicability evaluation.

2.3. Methodology

(1)
Daily SPEI
The daily scale SPEI proposed by Wang [28] was used to describe meteorological drought characteristics in this study during the period from 1979a to 2018a. The first step was to calculate the daily evapotranspiration (ET) using the Penman–Monteith formula based on daily meteorological data. Next, the daily cumulative water deficit time series was derived by using a daily sliding accumulation of a certain number of days, such as 30d [28] or 90d [37], based on the daily difference of precipitation and ET. The daily SPEI results were finally achieved by fitting a Log-logistic function and standardizing [24]. In this study, a 30d period was selected for the water deficit time series calculation, which took into account the frequent alternation between meteorological droughts and floods in Guangxi. Herein, the statistical characteristics of the meteorological drought events in Lai-bin and the possible drought scenarios for each growth period of sugarcane could be quantified, such as occurrence frequency, intensity, affected area, and the duration of meteorological drought events. Table 1 illustrates the drought intensity classification based on daily SPEI threshold values. Standardized Precip-ET cumulative frequency distribution was used to classify the SPEI drought grade.
Based on the daily SPEI of 119 grid points with 0.1° spatial resolution during 1979a–2018a, the sliding model proposed by Yevjevich [38] was employed to identify the onset and end times of a whole drought event, and thus to determine its integrated intensity and duration in the study area. Considering the characteristics of seasonal and flash drought coexisting in Lai-bin [39], a drought event was identified using SPEI values less than −0.5 for 5 consecutive days or more, and its total cumulative days were considered as the duration of the drought event. The integrated intensity is the sum of the SPEI values (less than −0.5) during this drought event period, and the drought frequency is the number of drought events that occur over a certain period. The annual values of drought statistical parameters, such as intensity, duration, and affected area, can be obtained by the accumulation of drought event occurrences during the year [24].
Table 1. The drought intensity classification based on daily Standardized Precipitation Evapotranspiration Index threshold values [40] (The thresholds are obtained based on the Standardized Precip-ET cumulative frequency distribution.).
Grade12345
SPEISPEI ≥ −0.5−1 < SPEI < −0.5−1.5 < SPEI ≤ −1−2 < SPEI ≤ −1.5SPEI ≤ −2
TypeNo droughtLight droughtModerate droughtSevere droughtExtreme drought
(2)
Parameterization method of the DSSAT−CANEGRO Model
DSSAT (Decision Support System for Agrotechnology Transfer) includes a module (CANEGRO) designed specifically for sugarcane growth [21]. Compared to other crop models, DSSAT−CANEGRO is better suited to simulate the water balance stress of sugarcane with more theoretical precision [41]. The model can simulate the growth and maturation processes (e.g., SH and LAI), water consumption mechanisms, yield, and the bioaccumulation of sugarcane during its growth periods under different climatic, soil, and field management conditions with a time step of days [18,19,22]. Hence, DSSAT-CANEGRO is suitable for the objective of this study.
Sensitivity analysis and the calibration of model parameters are an important part of improving the accuracy of model simulations and the key to ensuring the reliability of simulation results. Global sensitivity analysis can reflect the effects of individual parameters on output variables and can integrate the effects of interactions among multiple parameters of the model; it can also analyze the entire parameter space to produce accurate results [42]. For this purpose, the Morris method was employed to calculate the sensitivity of each parameter in this study [43,44]. This method is based on the one-variation method of experimental design and is a compromise between accuracy and efficiency in the case of a large number of model parameters and a large number of model operations [44,45]. The sensitivity of each parameter was calculated by the differential method. The calculation formula is as follows.
Q i ( x 1 , x 2 , , x n , Δ ) = y ( x 1 , x 2 , , x i 1 , x i + Δ , x i + 1 , , x n ) y ( x 1 , x 2 , , x n ) Δ
X = ( x 1 , x 2 , , x n , Δ )
where Qi(x,∆) is the sensitivity index of the parameter i, y(x) is the output results of the model, X is the n-dimensional vector of the parameter to be analyzed, and Δ is the value between 1/(p−1) and 1−1/(p−1). p is the discretization level of the parameter.
The Morris approach first sets each parameter value range to 0–1 and discretizes it into p levels, creating an n-dimensional p-level sampling space, and then randomly samples the parameters using the experimental design of the one-time variation method. Due to the randomness of the Morris method, errors are prone to occur in the process of one random sampling and randomization, so t repetitions are needed. In the 20 parameters of sugarcane varieties, this study sets t = 10; i.e., 10 repetitions are conducted, 190 groups are sampled, the model is run 190 times, and finally, the mean μ and standard deviation σ of each parameter are calculated. A larger μ indicates a stronger sensitivity of the parameter to the output variable; otherwise, the opposite is true. The standard deviation σ is an indicator to evaluate the strength of the interaction between the parameters. A greater σ indicates a strong interaction between the parameters; otherwise, the opposite is true. The mean and standard deviation of each parameter may be highly variable depending on the simulation object. The objective function sensitivity analysis and the calculation of 20 sugarcane variety parameters in the DSSAT−CANEGRO model were implemented in this study using the Morris technique and the sensitivity analysis by SIMLAB.
In the calibration of model parameters, the CY, SH, LAI, and aerial dry biomass (ADB) of sugarcane in Lai-bin were employed. The parameter values were adjusted manually multiple times and the model simulation was performed. The simulated value was compared with the target value and analyzed to obtain the best parameter value (see Section 4.1). The objective values were obtained from the field trial data by Li [35] for debugging and the field trial data by Ou [36] for validation. The Root Mean Square Error of homogenization NRMSE, and the consistency index D were used to quantify the validation accuracy. The specific calculation formula is as follows [46].
R M S E = i = 1 n ( Q i P i ) 2 n
N R M S E = R M S E Q ¯ × 100
D = 1 ( P i Q i ) 2 ( | P i Q ¯ | + | Q i Q ¯ | ) 2
where n is the number of samples, P is the simulation value of the model, Q is the observed value of the field trial, and Q ¯ represents the mean of the observations. Generally, when NRMSE < 10%, the fitting result is excellent; when 10% ≤ NRMSE < 20%, the fitting result is good; when 20% ≤ NRMSE < 30%, the fitting result is average; and when NRMSE < 30%, the fitting result is poor. D is an indicator that reflects the coincidence between the actual value and the simulated value. The larger the D (D is always ≤1), the higher the consistency between the actual value and the simulated value; otherwise, the consistency is lower.

3. Results of Meteorological Drought Characteristics in Lai-bin

3.1. Statistical Characteristics of Meteorological Drought

Figure 2a–c depict the spatial distribution of the multiyear average meteorological drought duration, intensity, and frequency for the entire growth period of sugarcane in Lai-bin from 1979a to 2018a, respectively. Figure 2a shows that the meteorological drought duration by multiyear average SPEI for the entire growth period of sugarcane in Lai-bin, ranging from 110 to 220 days, accounting for 37% to 74% of the whole growth period, respectively. Specifically, in the high mountainous areas (see Figure 2a), the longest drought duration lasted 180 to 220 days in Jinxiu and Xiangzhou County, and 150 to 180 days in most of Xincheng and Heshan County. These durations are longer than 50% of the reproductive period of sugarcane. On the other hand, the drought duration in the central region of Lai-bin and Wuxuan County, where the altitude is normally low, was 110–150 days (37~51%). This region is a contiguous and dense sugarcane planting area (see Figure 1b).
Figure 2b shows that the cumulative daily intensity of the multiyear average SPEI varies from −70 to −240 in Lai-bin; the highest intensity is −200 to −240 in Jinxiu County with high altitude, followed by −150 to −200 in nearby Xiangzhou and Wuxuan County, while the intensity in other counties, where sugarcane is densely cultivated, is generally −100 to −150 and is evenly distributed. Figure 2c demonstrates that the frequency of the multiyear average SPEI in Lai-bin is primarily within the range of 1.5~3 times a year, with drought events occurring 3~5 times/year only in scattered locations.
The above statistics show that the duration, intensity, and frequency of meteorological drought in Lai-bin during the entire growth period of sugarcane are unevenly distributed over the region, with significant differences, while they are relatively evenly distributed in the central dense sugarcane planting area. The statistical findings also indicate the frequent occurrence of meteorological drought in Lai-bin, which can have an inevitable significant impact on sugarcane yield.
Figure 2d,e present the duration and intensity of meteorological drought during each growth stage of sugarcane in Lai-bin from 1979a to 2018a. It is easy to observe that the growth period most prone to drought is maturity and stem elongation, followed by the seedling stage. However, there are few meteorological drought occurrences in the tiller stage of sugarcane. This phenomenon is due to the short duration of the tillering stage and the rainy season in the study area. Concretely, light droughts are dominant in the seedling stage from March 10 to May 10 (a total of 62 days), with three primary drought durations of 10–30 days (e.g., 2014 and 2018), 30–60 days (e.g., 1978), and 60–100 days (e.g., 1991, 2015), and with daily cumulative intensity primarily in the −10 to −50 range. The stem elongation stage (12 June to 12 November, a total of 154 days) and maturity periods (13 November to 31 December, a total of 49 days) were the main periods of frequent meteorological droughts, mostly light droughts that lasted 30–60 days, with daily cumulative intensities within the range of −10–100. However, moderate drought, severe drought, and extreme drought events still occurred in the past 40 years in these two growth periods. For instance, the drought event in 1989 during the stem elongation period lasted more than 100 days and had a cumulative daily intensity between −100 and −150 (moderate drought), which is similar to Chen’s findings [12]. Meteorological droughts occurred over a wide range of durations (10–220 days) and cumulative intensities (−10–300) throughout the entire growth period of sugarcane, indicating that meteorological drought events in Lai-bin typically spanned multiple growth periods of sugarcane with varying intensities.

3.2. Drought Simulation Scenario Setting in the Sugarcane Growth Period

Sugarcane growth period is often divided into four stages: seedling stage, tiller stage, stem extension stage, and mature harvest stage. In this study, with reference to Chen [47], the specific dates of each growth period in Lai-bin were determined (see Table 2), and the actual possible scenarios of meteorological drought for each sugarcane growth period were established based on the analysis results in Section 3.1.
Considering flash drought in Lai-bin, the initial drought duration was set to 5 days and the increased time step also to 5 days within 30 days; thereafter, the increased time step was changed to 10 days within more than 30 days of each growth period, which aimed to reflect the effect of seasonal drought duration differences on sugarcane growth and CY accumulation. Thus, the actual possible meteorological drought scenarios were presented in Lai-bin from 1979a to 2018a (Table 2), such as setting only light and moderate drought scenarios at the seedling stage, and scenarios of all drought intensity types in the stem extension stage and mature harvest stage. There is a no drought scenario in some growth periods because of essentially no drought in the actual conditions with reference to the results of Section 3.1. The maximum drought duration of 40 or 60 days was also set considering the actual drought duration statistics in Section 3.1. In each meteorological drought simulation scenario, the average values of 119 grid point meteorological elements were taken as the input and the simulated results were used as reference standards for accuracy evaluation in Section 4.

4. Results of Model Parameterization and Sugarcane Response Simulation to Historical Meteorological Drought

4.1. Parameter Sensitivity Analysis and Calibration of the DSSAT−CANEGRO Model

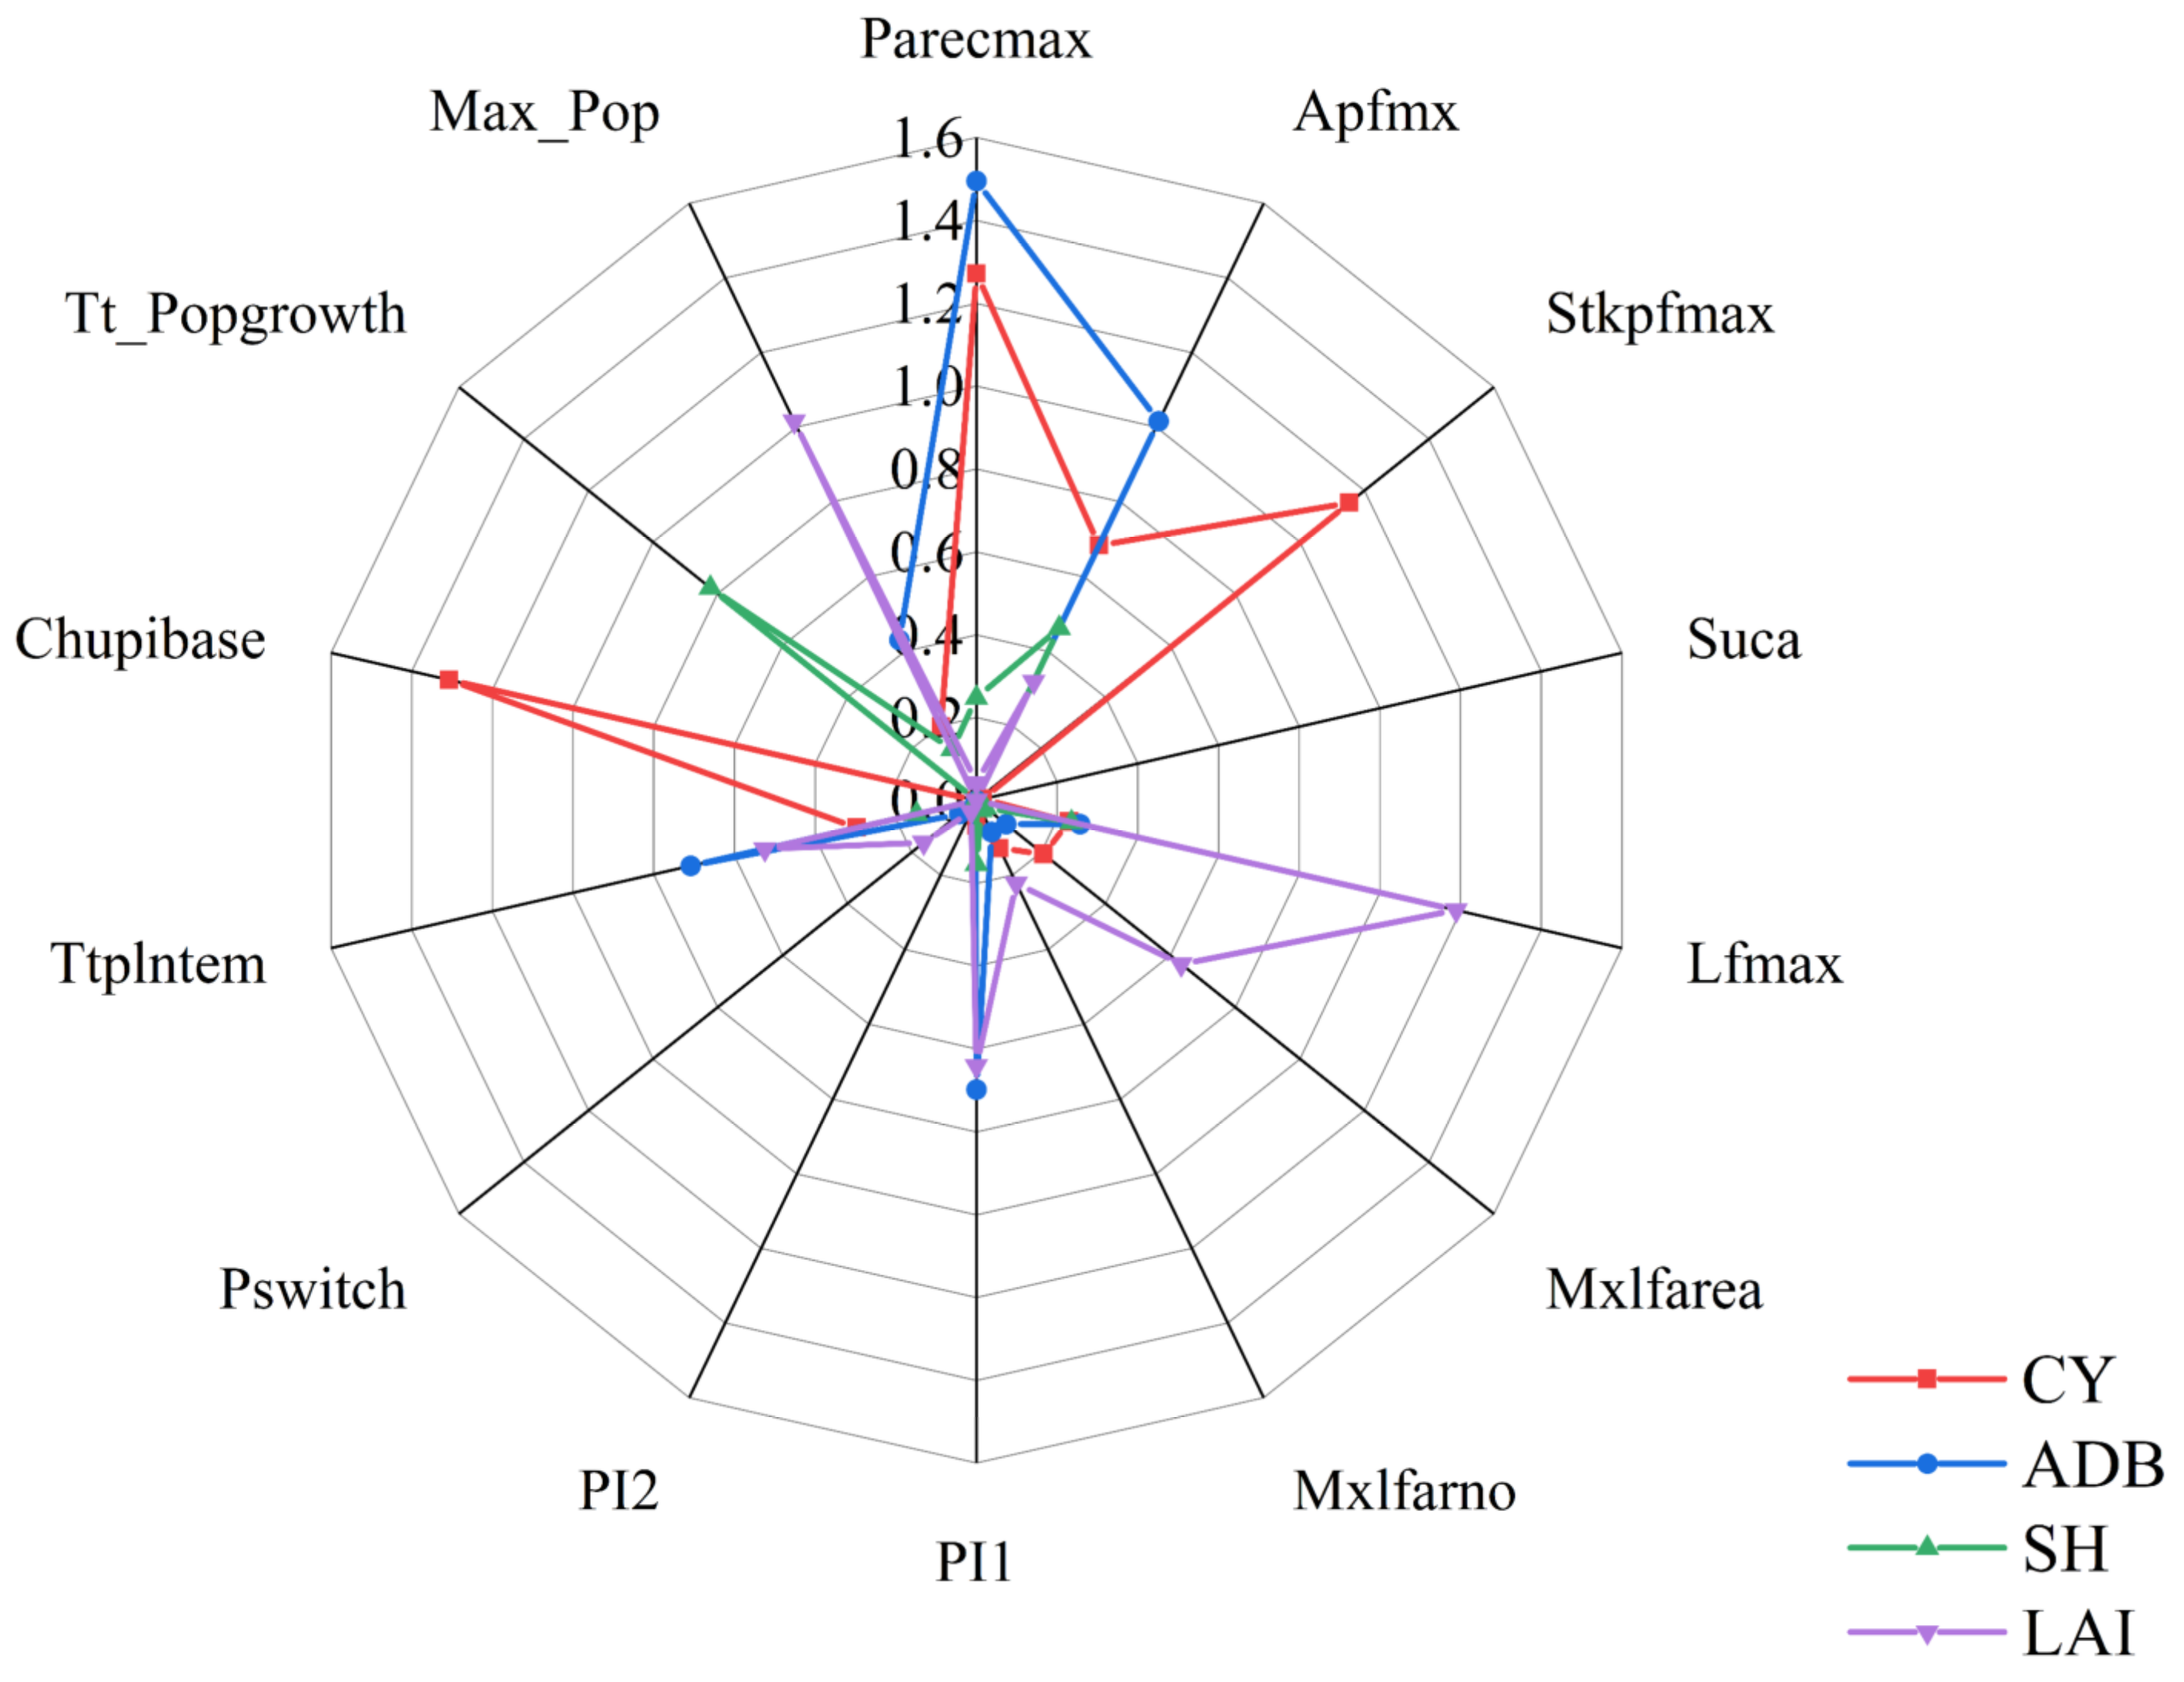
According to the parameter sensitivity method described in Section 2.3, this section focuses on the sugarcane variety parameter sensitivity analysis of the DSSAT−CANEGRO model for Xin-tai No.16, a major variety of sugarcane in Lai-bin. As shown in Table 3, the model has a total of 20 parameters to determine the optimal threshold. Of these, six parameters, marked with asterisks in the table, are not sensitive, and their values are directly determined according to the meteorological data of the study area. The other 14 parameters have varying degrees of sensitivity in Figure 3. As shown in Figure 3, the parameter values of Parcemax, Stkpfmax, and Chupibase are the most sensitive to CY, and their sensitivities all reach 1.2. The parameter Tt_Popgrowth has the most sensitive effect on SH, with a sensitivity of 0.85. Parameters Parcemax and Apfmx were the most sensitive to ADB, with sensitivities of 1.5 and 1.0, respectively. Lfmax and Max_Pop were the most sensitive to the changes in LAI, and their sensitivities reached 1.2 and 1.0. Further, as indicated in Table 3, the debugging results of all cultivar parameter values of sugarcane in the DSSAT−CANEGRO model were generated by combining the effects of the sensitive parameters and performing repeated debugging tests until the simulated values were as close as possible to the measured values.
Based on the calibrated parameters of the DSSAT−CANEGRO model (Table 3), the sugarcane leaf area index (LAI), cane yield (CY), aboveground dry biomass (ADB), and stalk height (SH) responses were simulated, fitted, and validated for a typical historical drought during 2015−2016a in Lai−bin city, compared to the field trial datasets during the same period. As shown in Figure 4, with the consistency index D of the simulated sugarcane, the LAI, CY, ADB, and SH of the DSSAT−CANEGRO model for Lai-bin reached 0.971, 0.996, 0.994, and 0.959, respectively, and their fitted NRMSE values were 18.21%, 9.78%, 9.11%, and 20.3%, respectively. This result shows that the calibrated parameters of the DSSAT−CANEGRO model can be used to simulate the response mechanism of sugarcane growth in meteorological drought scenarios in Lai-bin city with high simulation accuracy.

4.2. Simulation of Sugarcane Response to Historical Meteorological Drought in Typical Years

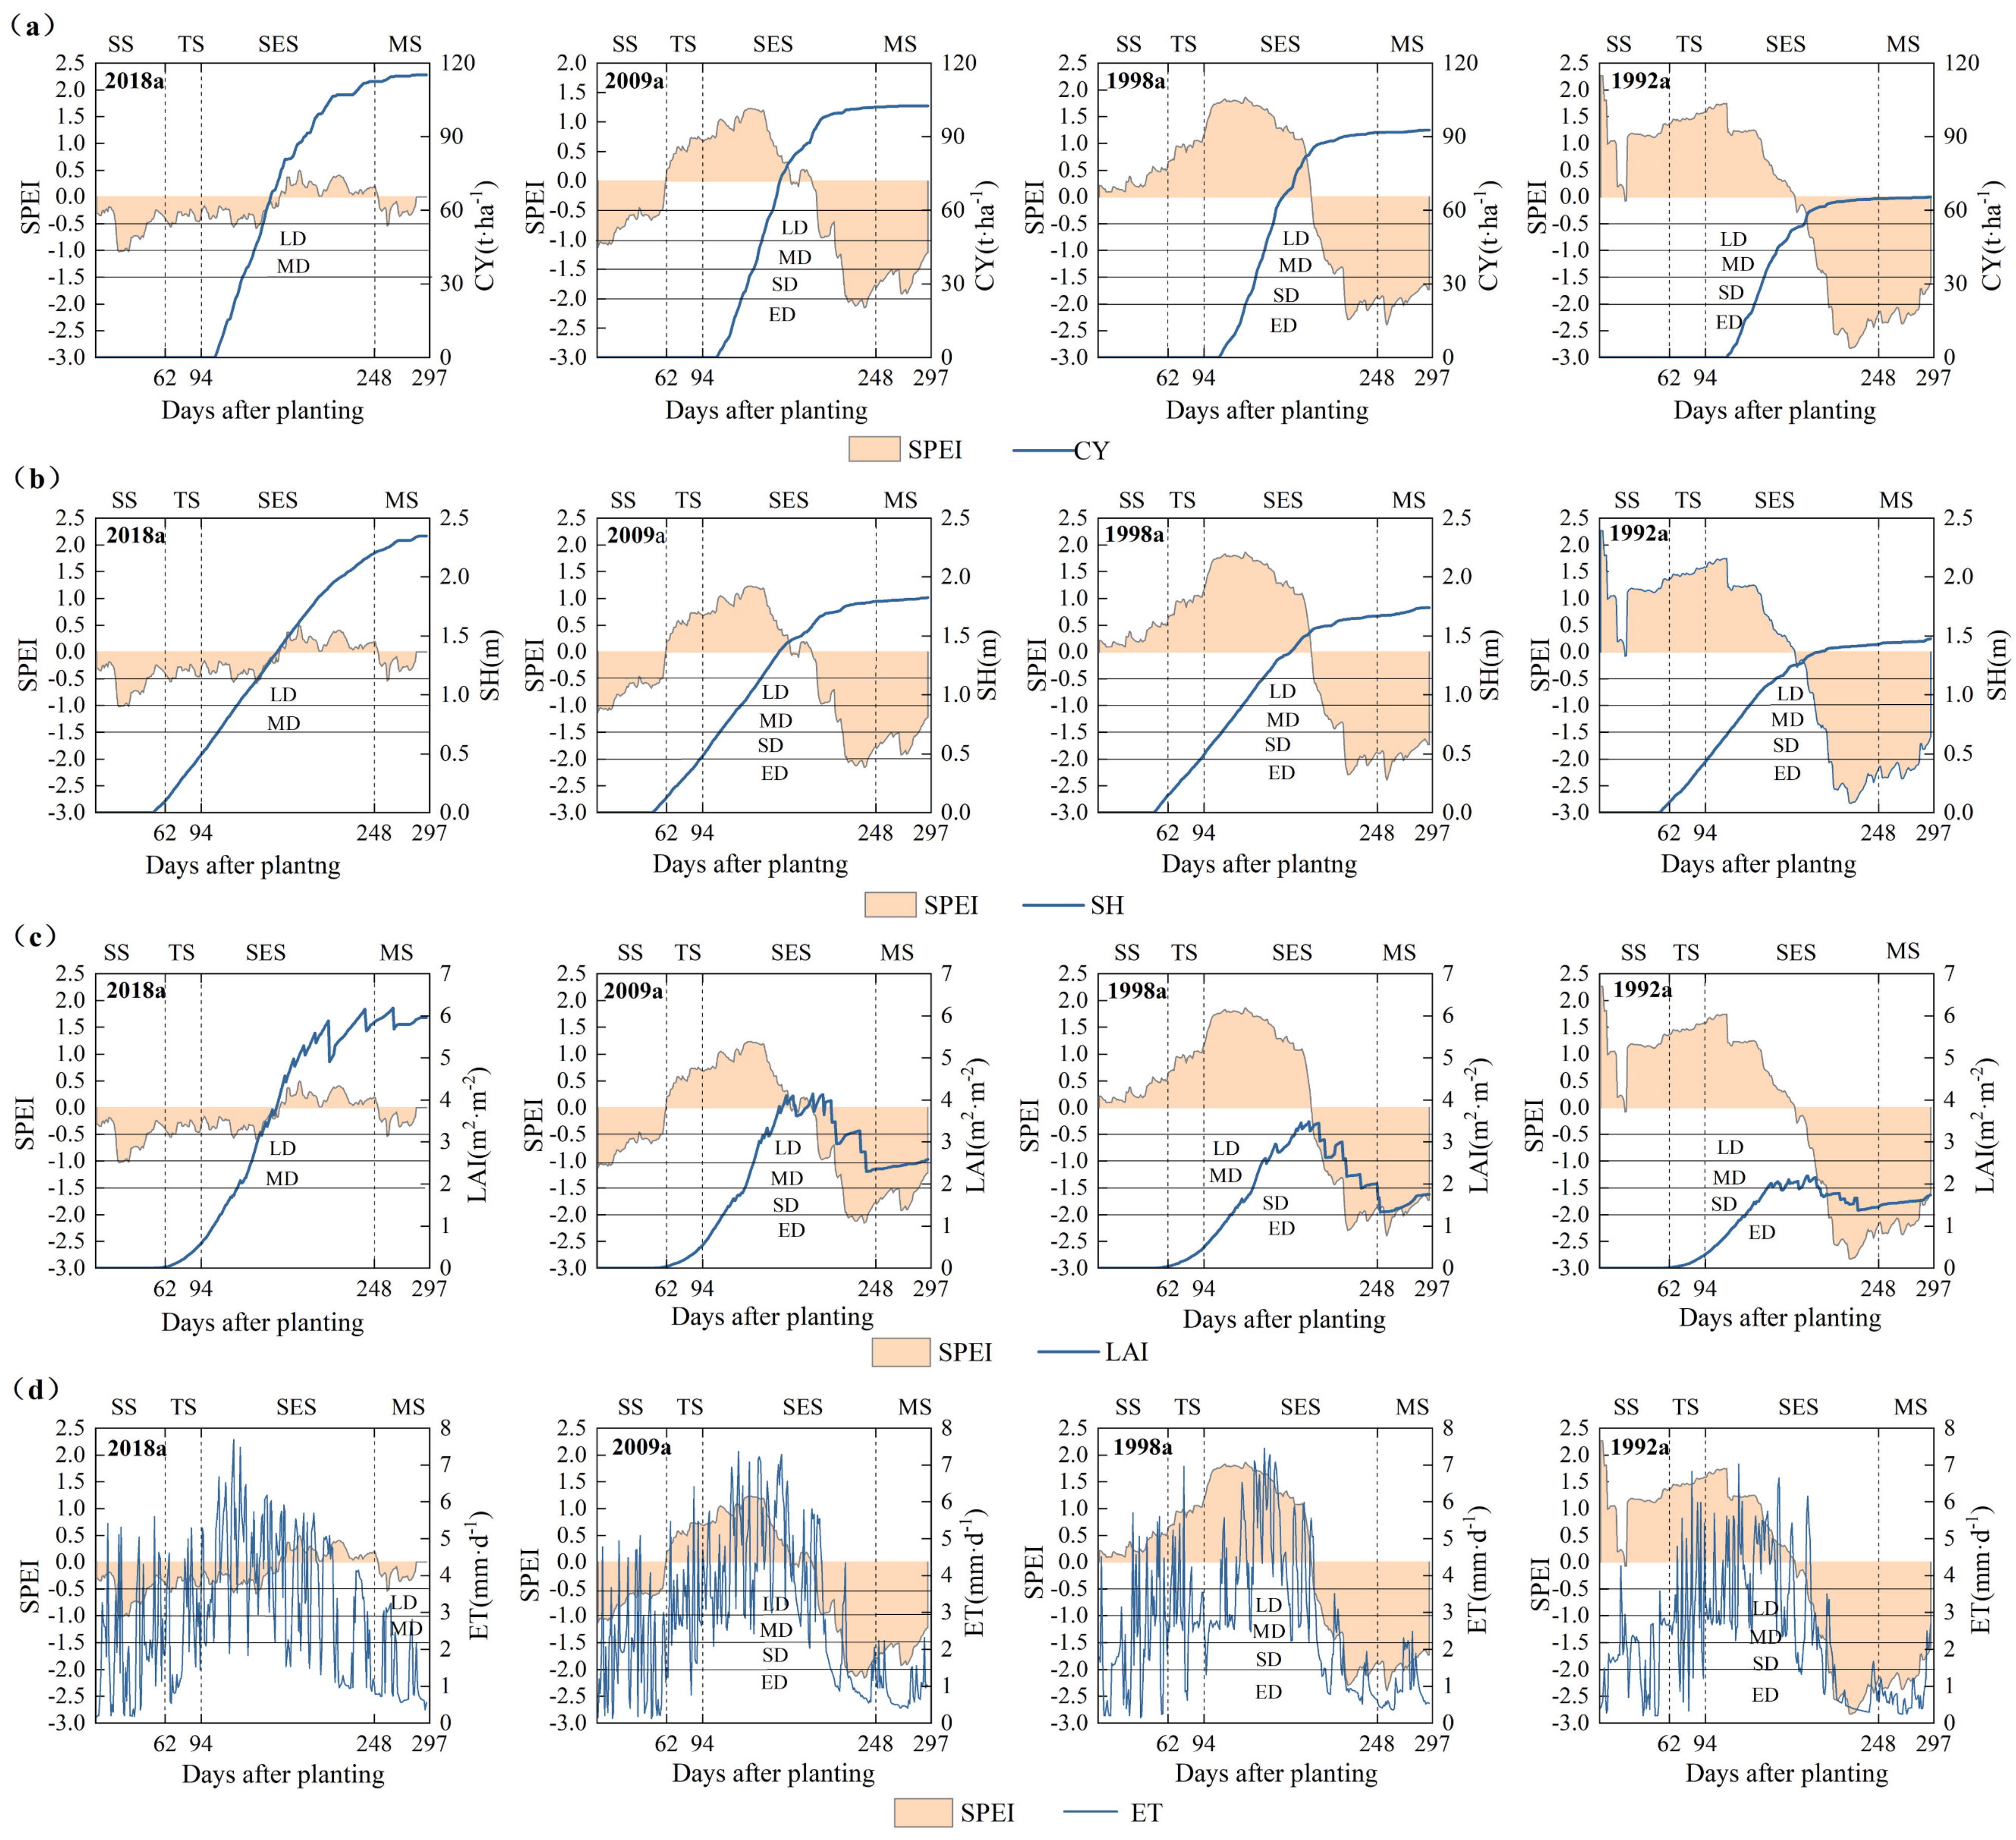
Section 4.1 confirmed that the DSSAT−CANEGRO model and its calibration parameters simulated the response mechanism of sugarcane growth to meteorological drought in Lai-bin city with good accuracy. In this section, based on the daily SPEI results of the 1979–2018a grid points in Lai-bin city, the average intensity (i.e., the ratio of drought intensity to drought duration) was used to select typical light drought years (2018a), moderate drought years (2009a), severe drought years (1998a), and extreme drought years (1992a). The response mechanisms of sugarcane CY, SH, LAI, and ET for meteorological drought were simulated and the key characteristics were illustrated; the findings are displayed in Figure 5.
Figure 5a demonstrates that the final cumulative CY in Lai-bin has significant difference with changes in drought intensity and duration. Concretely, the accumulation process of CY mainly occurs at the stem elongation stage, and meanwhile, the inhibition effects of meteorological drought on the sugarcane yield accumulation process are completely present during this growth period. For instance, the occurrence of light drought (2018a), moderate drought (2009a), severe drought (1998a), and extreme drought (1992a) in this period caused the cumulative values of CY to significantly slow down or even stop (Figure 5a). The more intense the meteorological drought was, the sooner the accumulation ceased and the lower the final accumulation value of the CY was. For example, the CY in each year was 115.21 t/ha (2018a), 102.57 t/ha (2009a), 92.73 t/ha (1998a), and 65.49 t/ha (1992a), among which the CY in 1992a was 27.24 t/ha lower than that in 1998a. Further, the meteorological drought events of above-moderate intensity which occurred in the first half of the stem elongation period show a minor impact on CY accumulation, but in the second half of the period, they present a significant impact on it. In addition, there are almost no obvious impacts on the accumulation of CY throughout the maturity period when meteorological drought occurs. This phenomenon is due to the fact that the accumulation of CY in this growth stage has been basically complete.
Figure 5b shows that the growth of sugarcane SH occurred across all growth periods but was extremely significant in the first three growth periods. In general, the meteorological drought events of above-moderate intensity had significant inhibition effects on sugarcane SH growth during the second half of the stem elongation period and maturity period. For example, an extreme drought event which occurred in 1992a caused the SH to generally stop growing. The final SH values were stable at 2.35 m (2018a), 1.83 m (2009a), 1.74 m (1998a), and 1.48 m (1992a), respectively under the historical drought scenario years.
It can be seen from Figure 5c that the LAI value of sugarcane displayed a significant increase during the early stages of seedling, tiller, and stem elongation in Lai-bin, with relatively abundant rainfall or the light drought scenario (e.g., 2018a). This phenomenon reflected the dominant feature of sugarcane tiller growth under these environmental conditions. However, the LAI increase suffered a remarkable inhibition, such as significant slowdown or basic cessation and obvious decrease, during the second half of the stem elongation and maturity periods when the precipitation was in significant decline (e.g., 2009a and 1992a) or the meteorological drought events of above-moderate intensity were in occurrence (e.g., 2009a, 1998a, and 1992a). In addition, the LAI value exhibited a decrease to 1~3 m2/m2 at the stem elongation stage and then generally stabilized in the maturity period in 2009a, 1998a, and 1992a, with the water deficit accompanying drought persistence eventually reduced. In contrast, the LAI of sugarcane still showed a fluctuation change response to minor precipitation increases or decreases during the middle or late stages of the stem elongation period in 2018a, while there were no significant decreases during the maturity period under the light meteorological drought scenario. In four typical drought years, the final sugarcane LAI at the end of maturity reached 5.96 m2/m2 (2018a), 2.6 m2/m2 (2009a), 1.8 m2/m2 (1998a), and 1.74 m2/m2 (1992a).
Figure 5d shows that although there were sawtooth oscillations of sugarcane ET from the seedling stage to the middle of the stem elongation period, the overall trend of daily ET in all historical drought years emerged as an increase and achieved a maximum value of 6 mm/d (e.g., 2009a and 1998a). Inversely, the overall trend of daily ET steadily decreased from the middle of the stem elongation stage to the end of the maturity period in all historical drought years, with a lowest decrease of less than 1 mm/d. The above result suggests that the physiological characteristics of sugarcane growth predominate the general trend of daily ET increase and decrease during the entire growth period of sugarcane in Lai-bin. For example, the ET value increased despite the persistent light drought which emerged in the first half of the whole growth period of sugarcane in 2018a; inversely, the ET value decreased despite the fact that no drought event occurred and there was even abundant rainfall in 1998a during the second half of the entire growth period. Nevertheless, the effect of water deficit accumulation caused by persistent drought on the daily ET of sugarcane should not be neglected. For example, the ET value displayed a significant slowdown in the increasing trend or even a short period of decrease during the seedling stages in 2018a and 2009a under persistent drought, and also showed a rapid decrease to the lowest value under the high-intensity long-duration drought in the second half of the stem elongation period in 2009a, 1998a, and 1992a, while there was no such phenomenon in the corresponding period of 2018a without drought. Overall, the significant short-term increase and decrease fluctuations in the daily ET of sugarcane at each growth period indicated that, in addition to growth physiology and drought effects, they were also due to the combined effect of multiple factors, such as light, temperature, and CO2 concentration, altering the stomatal opening and closing, photosynthesis, and respiration efficiency of sugarcane leaves.
In summary, the stem elongation stage is the most important and significant growth period to quantify the inhibition effects of meteorological drought on multiple elements of sugarcane growth process, and the seedling and maturity stages of sugarcane growth have a relatively smaller response to meteorological drought. The tiller stage is just a rainy season and has no drought stress for sugarcane growth. This conclusion is generally consistent with the results of previous studies [48,49]. Among the above four sugarcane growth factors, LAI shows the most sensitive and rapid response to the intensity of meteorological dry and wet changes. Combining the changes in LAI with soil moisture dynamics is an effective way to reveal the dynamic risk and the quantitative early warning of sugarcane drought, and also to realize intelligent control to reduce the drought loss of sugarcane.

5. Results of Sugarcane Growth Response to Meteorological Drought Scenarios

5.1. Scenario Simulation of Meteorological Drought in Different Sugarcane Growth Periods

Figure 6(a1–a4) show the response mechanism of sugarcane growth in different periods to meteorological drought of all intensity scenarios with a duration ranging from 5 to 60 days. Figure 6(a1) shows that light drought with a duration from 5 to 30 days during the seedling stage stimulated the CY to increase to 113.61 t/hm2 (compared to 110.34 t/hm2 in the control group), whereas light drought with a duration from 30 to 60 days decreased the CY to 107.53 t/hm2. Similarly, light drought that lasted between 5 and 40 days had the same cumulative effect of increasing the CY at the maturity stage to a maximum value of 115.1 t/hm2. In the most drought-sensitive period of stem elongation, light drought had no significant stimulating effect on CY accumulation and showed a suppressive effect when the duration reached 20–60 days, with the final CY decreasing to 102.48 t/hm2 (Figure 6(a1)). Under the moderate drought scenario (Figure 6(a2)), the CY began to decrease during the seedling stage when the drought duration increased to 25 days, reaching a minimum value of 97.82 t/hm2 at 60 days (the CY of the control group was 110.34 t/hm2). Furthermore, moderate drought only inhibited the accumulation of CY in the seedling and the stem elongation stages, and the inhibition was reinforced as the drought duration increased; however, in the maturity stage, the CY still increased from 5 to 40 days as the drought duration increased. Under severe (Figure 6(a3)) and extreme (Figure 6(a4)) drought conditions, which lasted 5 to 60 days, there was significantly inhibition to CY accumulation during the stem elongation period, and the CY gradually decreased to 89.6 t/hm2 (Figure 6(a3)) and 78.29 t/hm2 (Figure 6(a4)). On the contrary, the slight promoting effect of CY accumulation was maintained at the maturity stage under severe drought with a duration of 5 to 40 days, and its values reached a maximum of 114.72 t/hm2 (Figure 6(a3)). In contrast, there was no significant promotion of CY under extreme drought at the maturity stage.
The SH variation of sugarcane in Figure 6(b1) demonstrates that light drought which occurred during the seedling stage had a weak promotion effect with a duration of 5–30 days and an inhibition effect with a duration of 30–60 days on SH in Lai-bin. In the stem elongation period, light drought showed an inhibitory effect when its duration reached 10–60 days, eventually reducing SH to 2.3 m (the control SH was 2.39 m). SH growth was stimulated during the maturity period when light drought lasted from 5 to 40 days, with a maximum SH of 2.43 m. Figure 6(b2) indicates that when moderate drought with a duration of 5 days to 60 days occurred during the seedling stage and the stem elongation stage of sugarcane, an inhibitory effect gradually emerged on SH growth, resulting in SH decreasing to 2.02 m. When moderate drought occurred during the maturity stage, the SH of sugarcane has a slight reduction from 2.38 m to 2.32 m with the duration of drought increasing from 5 days to 40 days. Figure 6(b3,b4) show that under both the severe drought and extreme drought scenarios during the stem elongation stage with a duration from 5 to 60 days, a significant inhibition effect was observed on SH growth, with its value decreasing to 1.96 m (Figure 6(b3)) and 1.50 m (Figure 6(b4)), respectively. When the severe or extreme drought scenarios occurred during the maturity period, there was a slight inhibition effect on the SH, with a minimum value of 2.25 m.
As shown in Figure 6(c1), when light drought occurred during the seedling stage, the LAI of sugarcane in Lai-bin increased gradually with a drought duration of 5 to 40 days, and then decreased significantly with a drought duration of 40 to 60 days, with its final value lowered to 720.2 m2/m2 (the control group was 815.95 m2/m2). There was no significant promotion or inhibition during the stem elongation stage and the maturity stage when light drought occurred. Under the moderate drought scenario (Figure 6(c2)), the LAI suffered a significant inhibition effect during the seedling stage and the stem elongation stage, especially when drought lasted more than 30 days, and the LAI gradually decreased to the minimum value of 642.71 m2/m2. However, there was a weak inhibitory effect of moderate drought on the LAI during the maturity stage. Figure 6(c3,c4) explain that when both severe and extreme drought occurred during the stem elongation and maturity stages, a significant inhibition effect on LAI emerged, and a gradual decrease in LAI to 635.63 m2/m2 and 517.86 m2/m2 at 60 days with increasing drought duration, respectively, was observed. The impact of severe and extreme drought during the maturity stage on LAI should also not be ignored.
Figure 6(d1) indicates that light drought which occurred at the seedling stage or the maturity stage had a facilitating effect on ET, with its value increased with a drought duration from 5 to 30 days, and an inhibiting effect on ET, with its value decreased with a drought duration from 30 to 60 days. The corresponding values of total ET were highest at 1047.82 mm (1030.56 mm in the control group) and lowest at 1024.1 mm. In comparison, there was no significant impact of moderate, severe, and extreme drought on ET at the seedling stage or the maturity stage (Figure 6(d2–d4)). In contrast, all intensities of drought which occurred at the stem elongation stage showed a significant suppression on ET (Figure 6(d1–d4)), the values of which decreased rapidly with the increase in duration and intensity, and the final ET value reached 968.5 mm (d1), 955.7 mm (d2), 928.37 mm (d3), and 905.72 mm (d4), respectively, corresponding to light, moderate, severe, and extreme droughts.

5.2. Scenario Simulation of Meteorological Drought in a Certain Sugarcane Growth Period

From Figure 7(a1), it can be observed that light drought at the seedling stage had a CY increasing effect when its duration was within 5–40 days, with a maximum gaining rate of 2.96%, but when its duration reached 40–60 days, it had a CY decreasing effect, with a maximum decrement rate of −2.17%. When the duration of moderate drought at the seedling stage was greater than 10 days, it showed a significant CY decreasing effect, and the final decrement rate reached −11.35% with a duration of 60 days. Figure 7(a2) shows that sugarcane CY in Lai-bin was reduced when light, moderate, severe, and extreme drought occurred during the stem elongation stage, and the decrement rate was increased with the increase in drought intensity and duration. The final decrement rate values were as follows: extreme drought (−29.05%), severe drought (−18.80%), moderate drought (−16.48%), and light drought (−7.12%). In contrast, Figure 7(a3) presents a significant CY increase effect with increasing drought duration when light, moderate, and severe drought occurred during the maturity stage, and there were almost the same trends and quantitative values of its changing curves, with a maximum CY increase rate of 4.30%, while there was no obvious CY increase or decrease effect when extreme drought occurred at the maturity stage. The above results are similar to previous findings, such as those of Zu, who discovered that due to a lack of water, the average actual sugarcane output in southern China was reduced by 15% of the potential yield; and Devi, who found that drought caused a maximum reduction of 31.7% in the average actual yield of sugarcane in India. In this study, a further quantitative mapping relationship between the CY accumulation process at different growth stages and the various intensities and durations of meteorological droughts is revealed. Wu Wei-xiong analyzed the scenarios of normal irrigation, light drought, moderate drought, and severe drought based on the differences in the lower limit of the average water content of the soil wet layer in each growth period of sugarcane in Guangxi. He concluded that water deficit had the greatest effect on CY during the seedling and stem elongation stages. In conclusion, this paper’s findings are credible and can provide significant scientific support for elucidating the sequence transmission mechanism, dynamic risk regulation, and phased early warning of regional sugarcane drought.
As shown in Figure 7(b1,b2), there is a general similar trend of SH curves and CY curves (Figure 7(a1,a2) during the seedling stage and the stem elongation stage. The SH growth under moderate drought at the seedling stage suffered significant inhibition, with a maximum decrement rate of −9.84%. Figure 7(b2) shows that drought exerted remarkable inhibition to SH and its minimum values were as follows: extreme drought (−32.40%), severe drought (−17.66%), moderate drought (−15.24%), and light drought (−2.43%). The difference is that light drought during the maturity stage had no obvious impact on SH (Figure 7(b3)), while moderate drought, severe drought, and extreme drought maintained a relatively weak inhibitory effect on SH growth, with change rates as follows: extreme drought (−5.94%), severe drought (−3.52%), and moderate drought (−2.93%).
Figure 7(c1) demonstrates that light drought during the seedling stage had a promoting effect on the total LAI with a drought duration of 5–40 days, with a maximum increasing rate of 14.66%. And then, the total LAI decreased when the light drought duration reached 40 to 60 days, with a minimum rate of −11.73%. Furthermore, the total LAI showed a significant decline trend, with a minimum value of −21.23%, when the duration of moderate drought was 60 days. Figure 7(c2) demonstrates that the total LAI of sugarcane suffered a consistent and significant inhibition effect during the stem elongation stage under light, moderate, severe, and extreme drought. The final decrement rate was as follows: extreme drought (−36.53%), severe drought (−22.01%), moderate drought (−9.87%), and light drought (−2.82%). Figure 7(c3) demonstrates that light, moderate, severe, and extreme drought at the maturity stage inhibited the LAI of sugarcane, with a maximum decreasing rate of −5.88% under an extreme drought duration of 40 days.
Figure 7(d1) reveals similar promotion or inhibition effects and variation trends of ET to those of CY and SH mentioned above during the seedling stage of sugarcane in Lai-bin. The same significant inhibitory effects of drought on ET occurred during the stem elongation stage as with CY and SH (Figure 7(d2)), but the final ET values of decline rate were different: extreme drought (−12.07%), severe drought (−9.87%), moderate drought (−7.21%), and light drought (−5.97%). At the maturity stage (Figure 7(d3)), although meteorological drought of varying intensities boosted and then inhibited ET with increasing duration, the changing rate of each type of drought on ET ranged from 2% to −1%, a variation which could be ignored.

6. Discussion of Drought and Flood Alternation Effects on Cane Growth

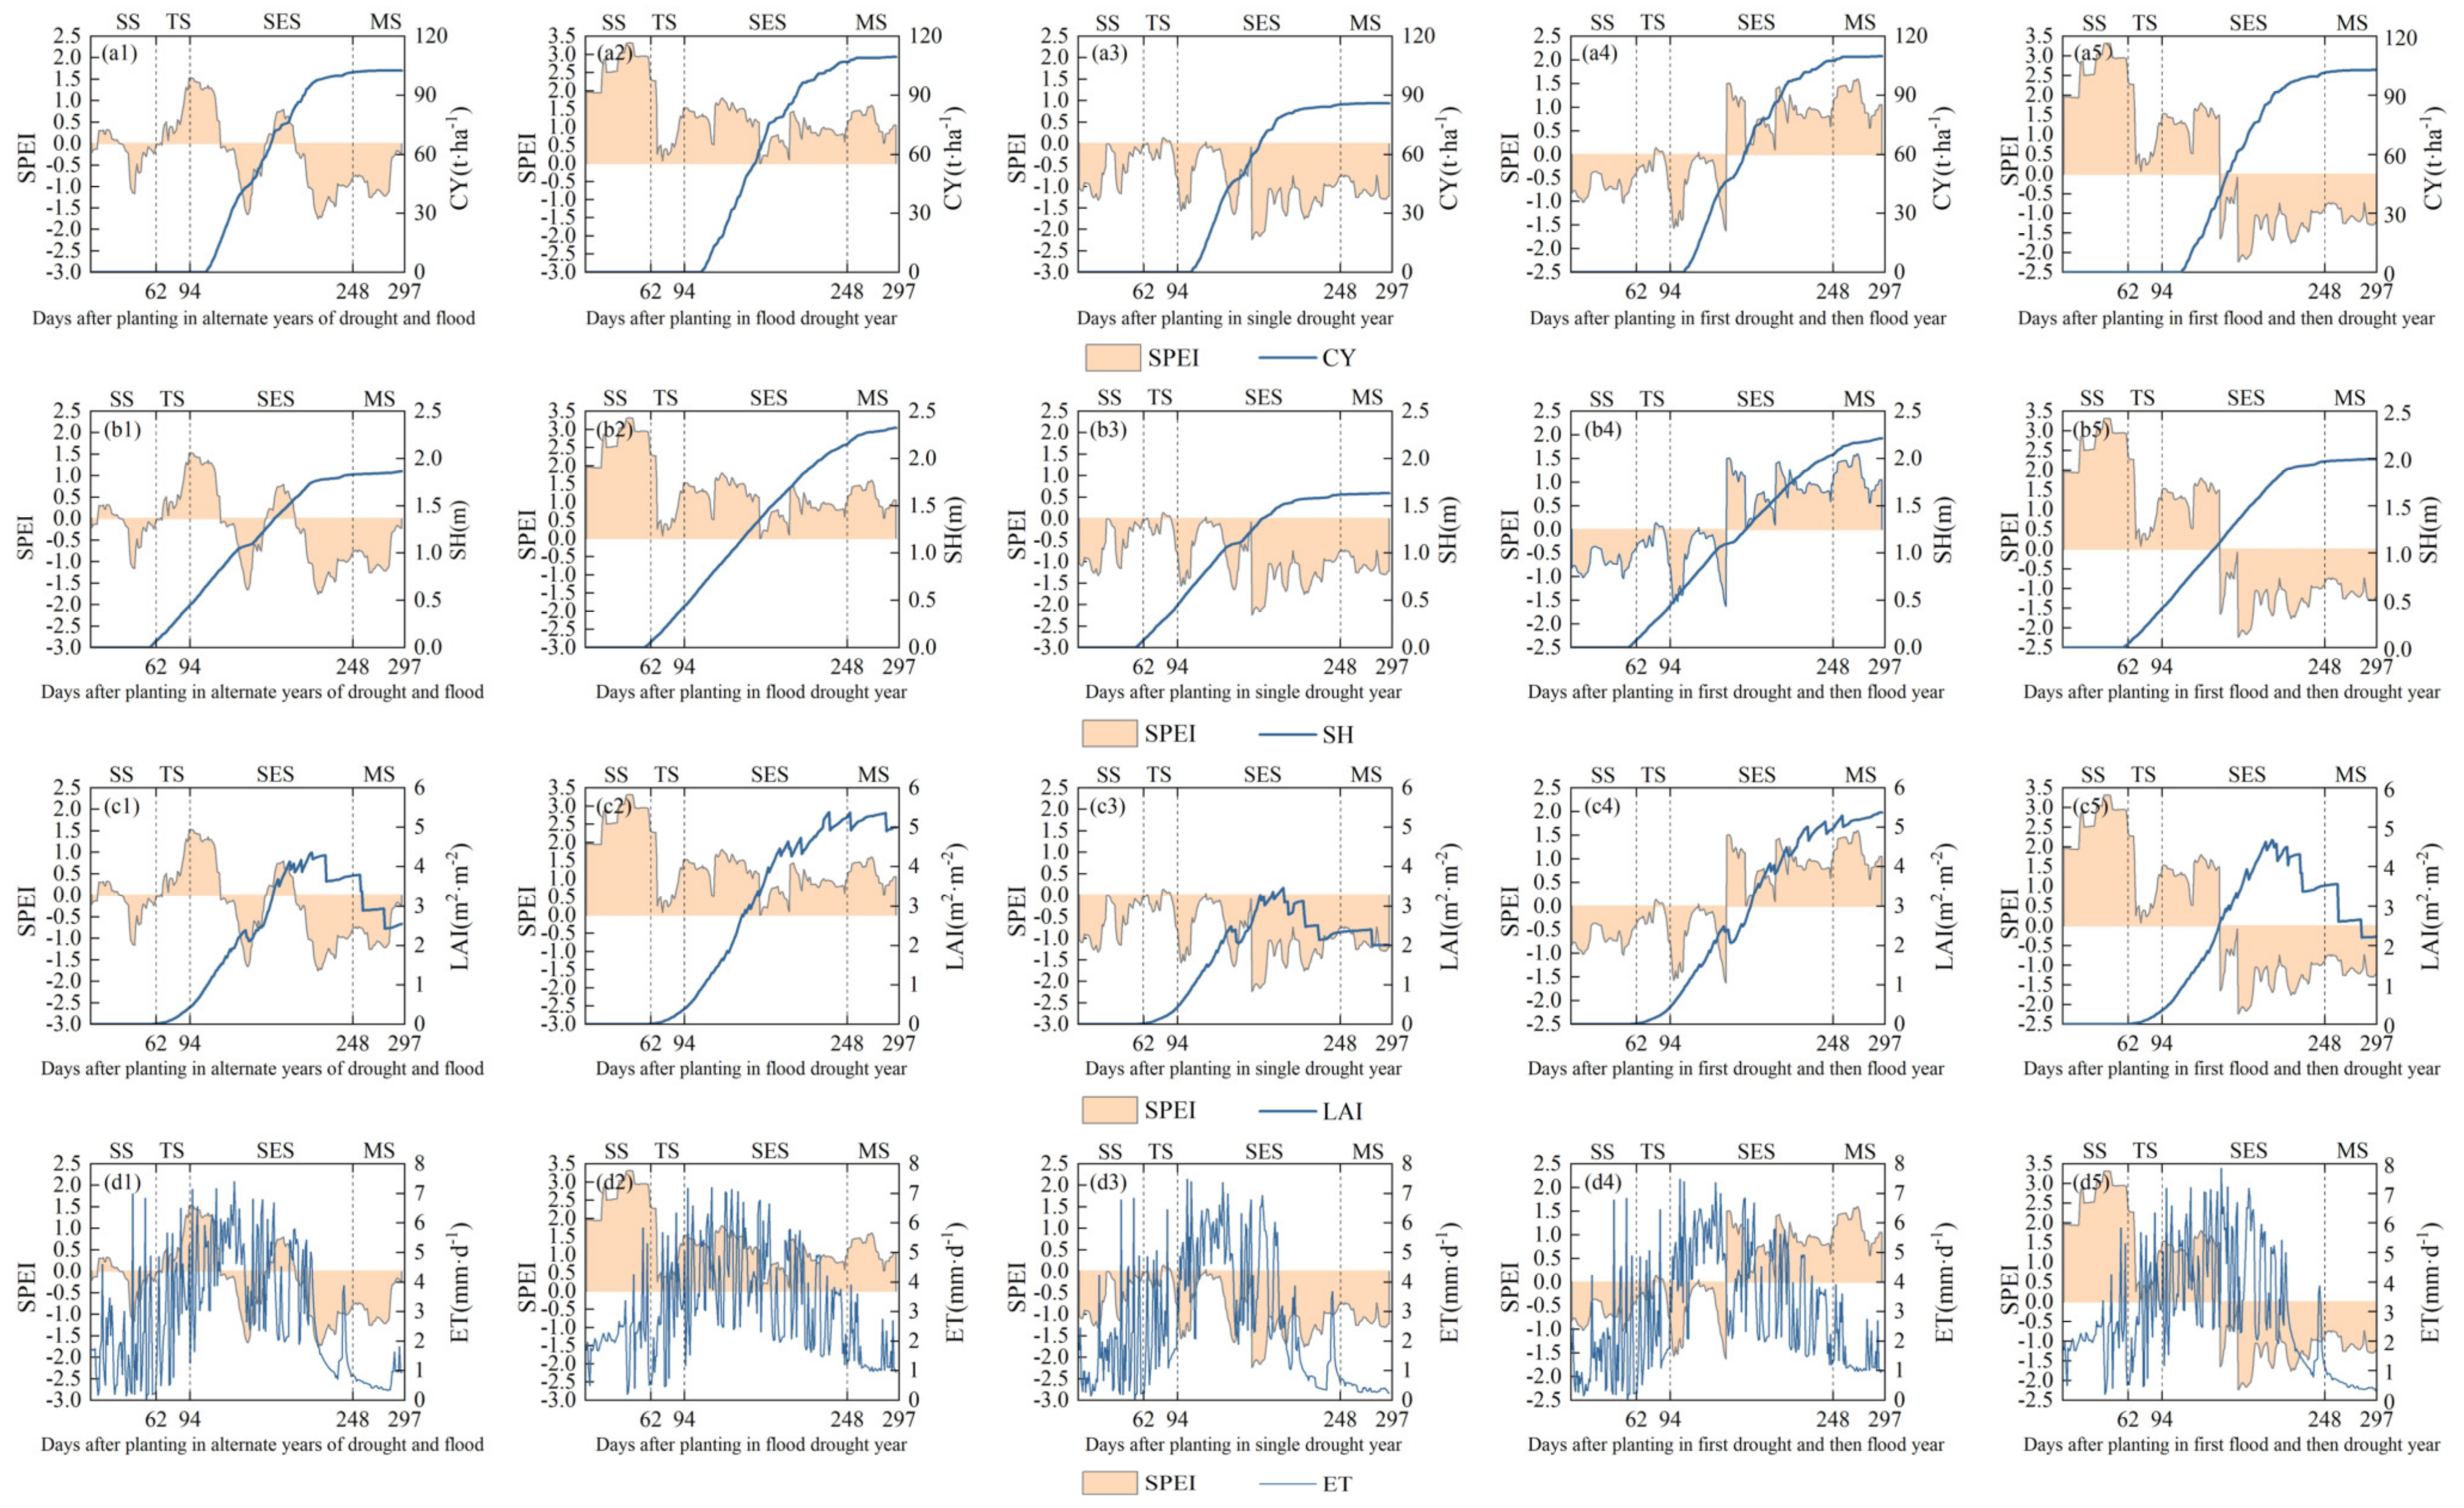
The underlying surface of Lai-bin is dominated by low stone mountains and hills, and a large karst development, and the soil layer has inadequate water-holding capabilities, which leads to drought and flood events coexisting and alternating throughout the years. Studies have shown that the mean annual frequency of its monthly scale drought-to-flood (flood-to-drought) events is approximately 0.5 times/a (0.3 times/a), while that of the intra month scale (5 d to 30 d) of flash drought-flood alternations is higher [50]. These results are also confirmed in Section 3 of this study. Therefore, based on the above simulated scenarios, the SPEI sequences for typical drought and flood events were extracted and concatenated in this section to generate the scenarios of multiple drought and flood event alternation, full flood, full drought, one drought to flood, and one flood to drought. The sugarcane growth responses to these drought and flood scenarios are given in Figure 8.
Figure 8(a1–a5,b1–b5) demonstrate that there are no obvious inhibition effects on CY or on SH during the period of sugarcane from the seedling stage to the middle of stem elongation stage, because only light drought or short-duration moderate drought events occurred. To some extent, a slight promotion effect might emerge, especially at the seedling stage, which is proved in Section 5 of this study. Ultimately, from the second half of the stem elongation stage to the maturity stage, drought had an inhibition effect on CY accumulation or on SH, while flood had a promotion effect on them. The higher the intensity and the longer the duration of drought or flood, the stronger the inhibition or the promotion effect. The final value order of CY accumulation under the above scenarios at the end of the maturity stage is as follows (Figure 8(a1–a5)): control group (110.34 t/ha, Figure 8(a1–a5)) > one drought to flood (110 t/ha) > full flood (109.4 t/ha) > one flood to drought (103.89 t/ha) > multiple alternations of drought and flood (102.5 t/ha) > full drought (86.01 t/ha). Similarly, the final value order of SH is as follows (Figure 8(b1–b5)): control group (2.39 m, Figure 6b) > one drought to flood (2.324 m) > full flood (2.213 m) > one flood to drought (1.993 m) > multiple alternations of drought and flood (1.865 m) > full drought (1.632 m). As Guangxi is in a subtropical monsoonal humid zone, full drought events are uncommon, but short-duration abrupt drought and flood events alternate regularly, and their major impacts on the accumulation of CY and SH in sugarcane must be addressed. On the other hand, it has been shown that drought stress has a positive effect on the accumulation of CY and SH in sugarcane during the seedling, tiller, and even the early part of the stem elongation stage, which eventually leads to higher CY and SH values in the first drought and then flood scenario than in the full flood scenario [51] (Wang et al., 2019).
Figure 8(c1–c5) show that there were no significant inhibition effects on LAI during the period of sugarcane growth from the seedling stage to the early stage of stem elongation, because the physiological characteristics of sugarcane growth dominated and no long-duration moderate drought or higher intensity drought events occurred. However, from the middle stage of stem elongation to the maturity stage, on account of long-duration drought and frequent severe or extreme drought events occurring during this period, the LAI suffered a remarkable inhibition effect (Figure 8(c1–c5)) and some degree of lag effect (Figure 8(c4,c5)) by drought. Finally, the LAI value order is as follows: one drought to flood (5.4 m2/m2) > full flood (5.0 m2/m2) > multiple alternations of drought and flood (2.6 m2/m2) > one flood to drought (2.2 m2/m2) > full drought (2.0 m2/m2).
Figure 8(d1–d5) show that drought (flood) had a visible but not significant inhibition (promotion) effect on the sugarcane daily ET, because there are multiple factors affecting ET variation, such as light, temperature, CO2 concentration, stomatal opening and closing, photosynthesis, and respiration efficiency, which were mentioned in Section 4.2. Furthermore, the daily frequent fluctuation of ET value precisely reflects the growth dynamics of sugarcane, and how to quantitatively analyze the contribution of these factors’ impact is a key scientific mechanism problem for the intelligent management of sugarcane cultivation, which requires more study in the near future.

7. Conclusions

In this paper, the quantitative inhibition effects of possible meteorological drought scenarios on sugarcane growth in Lai-bin were investigated. The primary conclusions are as follows:
(1)
There are significant differences in the spatial distribution of duration, intensity, and frequency of meteorological drought in Lai-bin, with a duration of more than 100 days/year, with an accumulative intensity of −100~−150 a year, and with a frequency of 1.53 times/year. Droughts occurred mostly at the seedling, stem elongation, and maturity stages of sugarcane, but rarely at the tiller stage. Flash droughts within a month and seasonal droughts longer than a month coexisted in the study area.
(2)
The DSSAT−CANEGRO model has a good simulation accuracy concerning the response of sugarcane growth to multiple meteorological drought scenarios in Lai-bin. The greater the intensity and the longer the duration of historical meteorological drought, the stronger the inhibition on the CY, SH, LAI, and ET of sugarcane. The greatest limitation on sugarcane growth occurred during the period of stem elongation, and the LAI responded most sensitively to each level of meteorological dryness.
(3)
The occurrence of light drought at the seedling stage and light, moderate, and severe drought at the maturity stage in Lai-bin had a promotion effect on sugarcane growth, but the overall increase rate of CY was less than 5%. Droughts of all intensities which occurred during the stem elongation stage represented a significant inhibitory effect on CY accumulation, which could lead to final yield reductions of 7.12% (light drought), 16.48% (moderate drought), 18.80% (severe drought), and 29.05% (extreme drought).
(4)
Alternate drought–flood scenarios had a remarkable effect on different periods of sugarcane growth in Lai-bin. The full drought scenario produced the strongest inhibitory effect on sugarcane growth, and the one-drought-to-flood scenario emerged as a facilitation effect on CY and SH more than the full-flood scenario did. The scenario of multiple alternations of droughts and floods led to a superimposed yield reduction on sugarcane, which was a slightly stronger inhibitory effect on sugarcane growth than that of the one-flood-to-drought scenario.
In summary, based on the above research results, the refined dynamic intelligent regulation and multi-period cascade warning of sugarcane drought risks in Guangxi will soon be realized. In other words, the research and development of a digital twin crop model for sugarcane drought risk control in Guangxi has the support of scientific evidence.

Author Contributions

Conceptualization, Y.Y. and X.L.; methodology, Y.Y. and H.Z.; validation, W.W.; formal analysis, W.W. and T.W.; investigation, J.Y. and X.X.; resources, T.W. and X.X.; data curation, T.W. and J.Y.; writing—original draft preparation, Y.Y.; writing—review and editing, Y.Y and W.W.; visualization, H.Z.; supervision, L.L.; project administration, L.L.; language polishing, X.L. All authors have read and agreed to the published version of the manuscript.

Funding

This work was funded by (1) the National Natural Science Foundation of China (Grant No. 42261017, 41901132), and (2) the Natural Science Fund Project in Guangxi, China (Grant No. 2019GXNSFAA185015, 2021GXNSFBA220025).

Institutional Review Board Statement

Not applicable.

Data Availability Statement

The datasets generated during and analyzed during the current study are not publicly available due to the datasets being used for further research.

Conflicts of Interest

The authors declare that they have no conflicts of interest.

References

  1. Gupta, A.; Rico-Medina, A.; Caño-Delgado, A.I. The physiology of plant responses to drought. Science 2020, 368, 266–269. [Google Scholar] [CrossRef] [PubMed]
  2. Li, W.; Pacheco-Labrador, J.; Migliavacca, M.; Miralles, D.; Hoek van Dijke, A.; Reichstein, M.; Forkel, M.; Zhang, W.; Frankenberg, C.; Panwar, A. Widespread and complex drought effects on vegetation physiology inferred from space. Nat. Commun. 2023, 14, 4640. [Google Scholar] [CrossRef] [PubMed]
  3. Veresoglou, S.D.; Li, G.C.; Chen, J.; Johnson, D. Direction of plant–soil feedback determines plant responses to drought. Glob. Chang. Biol. 2022, 28, 3995–3997. [Google Scholar] [CrossRef] [PubMed]
  4. Zhang, X.; Hao, Z.; Singh, V.P.; Zhang, Y.; Feng, S.; Xu, Y.; Hao, F. Drought propagation under global warming: Characteristics, approaches, processes, and controlling factors. Sci. Total Environ. 2022, 838, 156021. [Google Scholar] [CrossRef] [PubMed]
  5. Zhao, R.; Sun, H.; Xing, L.; Li, R.; Li, M. Effects of anthropogenic climate change on the drought characteristics in China: From frequency, duration, intensity, and affected area. J. Hydrol. 2023, 617, 129008. [Google Scholar] [CrossRef]
  6. Zhang, Q.; Miao, C.; Gou, J.; Zheng, H. Spatiotemporal characteristics and forecasting of short-term meteorological drought in China. J. Hydrol. 2023, 624, 129924. [Google Scholar] [CrossRef]
  7. Chen, L.; He, Z.; Pan, S.; Gu, X.; Xu, M.; You, M.; Pi, G. Spatial and Temporal Evolution Characteristics of Karst Agricultural Drought Based on Different Time Scales and Driving Detection-A Case Study of Guizhou Province. J. Soil Water Conserv. 2023, 37, 136–148. [Google Scholar]
  8. Mokhtar, A.; He, H.; Alsafadi, K.; Mohammed, S.; Ayantobo, O.O.; Elbeltagi, A.; Abdelwahab, O.M.; Zhao, H.; Quan, Y.; Abdo, H.G. Assessment of the effects of spatiotemporal characteristics of drought on crop yields in southwest China. Int. J. Climatol. 2022, 42, 3056–3075. [Google Scholar] [CrossRef]
  9. Li, Y.; Yang, L. Sugarcane Agriculture and Sugar Industry in China. Sugar Tech. 2015, 17, 1–8. [Google Scholar] [CrossRef]
  10. Tan, J.; Guo, J.; Wu, J.; Pan, W.; Bai, Y.; Huang, K.; He, L.; Wu, W.; Shao, J. Photosynthetic characteristics of sugarcane under different irrigation modes. Trans. Chin. Soc. Agric. Eng. 2016, 32, 150–158. [Google Scholar]
  11. Guo, C.; Cui, Y.; Li, X.; Su, S. Spatial variation of sugarcane water requirement and irrigation quota in Guangxi. Trans. Chin. Soc. Agric. Eng. 2016, 32, 89–97. [Google Scholar]
  12. Chen, Y.; Meng, L.; Huang, X.; Mo, J.; Feng, L. Spatial and temporal evolution characteristics of drought in Guangxi during sugarcane growth period based on SPEI. Trans. Chin. Soc. Agric. Eng. 2019, 35, 149–158. [Google Scholar]
  13. Gao, S.; Luo, J.; Zhang, H.; Xu, R. Physiological and biochemical indexes of drought resistance of sugarcane (Saccharum spp.). J. Appl. Ecol. 2006, 17, 1051–1054. [Google Scholar] [CrossRef]
  14. Zhao, P.; Zhao, J.; Liu, J.; Zan, F.; Xia, H.; Jackson, P.; Basnayake, J.; Inman-Bamber, N.; Yang, K.; Zhao, L. Genetic variation of four physiological indexes as impacted by water stress in sugarcane. Sci. Agric. Sin. 2017, 50, 28–37. [Google Scholar]
  15. Lu, Z.; Yang, L.; Xing, Y.; Li, Y. Research advances on sugarcane response to Drought stress. Mol. Plant Breed. 2021, 21, 2051–2060. [Google Scholar]
  16. Teng, Z. The Effect of MCP on Improving Drought Resistance in Sugarcane Seedling Stage; Guangxi University: Nanning, China, 2013. [Google Scholar]
  17. Sun, Y.; Shen, S. Research progress in application of crop growth models. Chin. J. Agrometeorol. 2019, 40, 444. [Google Scholar]
  18. Jones, M.R.; Singels, A. Refining the Canegro model for improved simulation of climate change impacts on sugarcane. Eur. J. Agron. 2018, 100, 76–86. [Google Scholar] [CrossRef]
  19. Marin, F.R.; Jones, J.W.; Royce, F.; Suguitani, C.; Donzeli, J.L.; Filho, W.J.P.; Daniel, S.P.N. Parameterization and evaluation of predictions of DSSAT/CANEGRO for Brazilian sugarcane. Agron. J. 2011, 103, 303–315. [Google Scholar] [CrossRef]
  20. Singels, A.; Jones, M.; Marin, F.; Ruane, A.; Thorburn, P. Predicting climate change impacts on sugarcane production at sites in Australia, Brazil and South Africa using the Canegro model. Sugar Tech. 2014, 16, 347–355. [Google Scholar] [CrossRef]
  21. Murilo, D.S.V.; Sentelhas, P.C. Performance of DSSAT CSM-CANEGRO under operational conditions and its use in determining the ‘saving irrigation’ impact on sugarcane crop. Sugar Tech. 2016, 18, 1–12. [Google Scholar] [CrossRef]
  22. Zha, Y.; Wu, X.; He, X.; Zhang, H.; Gong, F.; Cai, D.; Zhu, P.; Gao, H. Basic soil productivity of spring maize in black soil under long-term fertilization based on DSSAT model. J. Integr. Agric. 2014, 13, 577–587. [Google Scholar] [CrossRef]
  23. Fang, G.; Tu, Y.; Wen, X.; Yan, M.; Tan, Q. Study on the development process and evolution characteristics of meteorological drought in the Huaihe River Basin from 1961 to 2015. J. Hydraul. Eng. 2019, 50, 598–611. [Google Scholar] [CrossRef]
  24. Lang, J.; Zhang, B.; Ma, B.; Wei, J.; Zhang, J.; Ma, S. Drought evolution characteristics on the Tibetan Plateau based on daily standardized precipitation evapotranspiration index. J. Glaciol. Geocryol. 2018, 40, 1100–1109. [Google Scholar]
  25. Liu, X.; Leng, X.; Sun, G.; Peng, Y.; Huang, Y.; Yang, Q. Assessment of drought characteristics in Yunnan Province based on SPI and SPEI from 1961 to 2100. Trans. Chin. Soc. Agric. Mach. 2018, 49, 299. [Google Scholar]
  26. He, J.; Yang, K.; Tang, W.; Lu, H.; Qin, J.; Chen, Y.; Li, X. The first high-resolution meteorological forcing dataset for land process studies over China. Sci. Data 2020, 7, 1–12. [Google Scholar] [CrossRef] [PubMed]
  27. Liu, X.; Zhu, X.; Pan, Y.; Li, S.; Liu, Y. Agricultural drought monitor: Progress, challenges and prospect. Acta Geogr. Sin. 2015, 70, 1835–1848. [Google Scholar]
  28. Wang, Q.; Shi, P.; Lei, T.; Geng, G.; Liu, J.; Mo, X.; Li, X.; Zhou, H.; Wu, J. The alleviating trend of drought in the Huang-Huai-Hai Plain of China based on the daily SPEI. Int. J. Climatol. 2015, 35, 3760–3769. [Google Scholar] [CrossRef]
  29. Li, T. High-yielding and stable high-sugar cultivation technology of sugarcane in Laibin. Xiangcun Keiji 2017, 15, 63–64. [Google Scholar] [CrossRef]
  30. Qin, S. Sugarcane pest and disease prevention and control measures for “double-high” sugarcane base in Laibin City. Jiangxi Agric. 2020, 08, 24. [Google Scholar] [CrossRef]
  31. Xie, X.; Yang, Y.; Tian, Y.; Liao, L.; Mo, C.X.W.; Zhou, J. Sugarcane planting area and growth monitoring based on remote sensing in Guangxi. Chin. J. Eco-Agric. 2021, 29, 410. [Google Scholar] [CrossRef]
  32. Deng, Y.H.; Wang, S.J.; Bai, X.Y.; Luo, G.J.; Wu, L.H.; Chen, F.; Wang, J.F.; Li, Q.; Li, C.J.; Yang, Y.J.; et al. Spatiotemporal dynamics of soil moisture in the karst areas of China based on reanalysis and observations data. J. Hydrol. 2020, 585, 124744. [Google Scholar] [CrossRef]
  33. Wang, L.; Zhang, X.; Fang, Y.; Xia, D. Applicability assessment of China meteorological forcing dataset in upper Yangtze River Basin. Water Power 2017, 43, 18–22. [Google Scholar]
  34. Fischer, G.; Nachtergaele, F.; Prieler, S.; Van Velthuizen, H.; Verelst, L.; Wiberg, D. Global Agro-Ecological Zones Assessment for Agriculture (GAEZ 2008); IIASA Laxenburg Austria FAO: Rome, Italy, 2008; Volume 10. [Google Scholar]
  35. Li, Q.; Lan, J.; Qin, Y.; Lian, W. Eighth round of national new sugarcane variety tests. Sugarcane Canesugar 2013, 5, 1–6. [Google Scholar]
  36. OuYang, J.; Quan, M.; Huang, H.; Pan, Z.; Wei, X. Preliminary report on the results of sugarcane variety trials in the Qiangjiang cane area. Guangxi Sugar Ind. 2017, 01, 15–19. [Google Scholar]
  37. Jia, Y.; Zhang, B. Spatial-temporal variability characteristics of extreme drought events based on daily SPEI in the southwest China in recent 55 years. Sci Geogr Sin 2018, 38, 474–483. [Google Scholar] [CrossRef]
  38. Yevjevich, V. Mean Range of Linearly Dependent Normal Variables with Application to Storage Problems; John Wiley Sons Ltd.: Hoboken, NJ, USA, 1967; Volume 3, pp. 663–671. [Google Scholar] [CrossRef]
  39. Yang, X.; Yang, Y.; Tian, Y.; Liao, L.; Xie, X.; Mo, C.; Xiao, L. Characteristics of spatiotemporal distribution of rainfall-deficient flash drought in Guangxi. Res. Soil Water Conserv. 2020, 27, 149–157. [Google Scholar] [CrossRef]
  40. An, Q.; He, H.X.; Gao, J.J.; Nie, Q.W.; Cui, Y.J.; Wei, C.J.; Xie, X.M. Analysis of Temporal-Spatial Variation Characteristics of Drought: A Case Study from Xinjiang, China. Water 2020, 12, 741. [Google Scholar] [CrossRef]
  41. Verma, A.K.; Garg, P.K.; Prasad, K.S.H.; Dadhwal, V.K. Variety-specific sugarcane yield simulations and climate change impacts on sugarcane yield using DSSAT-CSM-CANEGRO model. Agric. Water Manag. 2023, 275, 108034. [Google Scholar] [CrossRef]
  42. Saltelli, A.; Ratto, M.; Andres, T.; Campolongo, F.; Cariboni, J.; Gatelli, D.; Saisana, M.; Tarantola, S. Global Sensitivity Analysis. The Primer; John Wiley & Sons, Ltd.: Hoboken, NJ, USA, 2007. [Google Scholar]
  43. Song, M.; Feng, H.; Li, Z.; Gao, J. Sensitivity analysis of the CERES-Wheat model based on Morris and EFAST. Trans. Chin. Soc. Agric. Mach. 2014, 45, 124–131. [Google Scholar]
  44. Francesca, C.; Jessica, C.; Andrea, S. An effective screening design for sensitivity analysis of large models—ScienceDirect. Environ. Model. Softw. 2007, 22, 1509–1518. [Google Scholar] [CrossRef]
  45. Morris, M.D. Factorial Sampling Plans for Preliminary Computational Experiments. Technometrics 2012, 33, 161–174. [Google Scholar] [CrossRef]
  46. Liu, J.; Chu, Q.; Wang, G.; Chen, B.; Zhang, Y. Simulating yield gap of winter wheat in response to nitrogen management in North China Plain based on DSSAT model. Trans. Chin. Soc. Agric. Eng. 2013, 29, 124–129. [Google Scholar]
  47. Chen, Y.; Meng, L.; Huang, X.; Jian, F.; Wang, Y.; Mo, W. Spatial and temporal evolution of drought in the karst region of Guangxi from 1971–2017 based on SPEI. J. Arid Meteorol. 2019, 37, 353–362. [Google Scholar]
  48. Liu, S.; Yang, Q.; Li, X.; Huang, G.; Xiao, G. Effects of drought stress on morphological index and physiological characteristics of sugarcane at different growth stages. J. South. Agric. 2016, 47, 1273–1278. [Google Scholar]
  49. Luo, S.; Liao, W.; Wei, H.; He, H.; Jiang, Y.; Tang, L. Research progress of drought stress on sugarcane growth. Trop. Agric. 2020, 5, 70–73. [Google Scholar]
  50. Zu, Q.; Mi, C.; Liu, D.L.; He, L.; Kuang, Z.; Fang, Q.; Ramp, D.; Li, L.; Wang, B.; Chen, Y.; et al. Spatio-temporal distribution of sugarcane potential yields and yield gaps in Southern China. Eur. J. Agron. 2018, 92, 72–83. [Google Scholar] [CrossRef]
  51. Wang, M.; Bi, W.; Weng, B.; Yu, Z.; Xu, T. Review on impact from drought-flood abrupt alternation on crop growth and yield. Water Resour. Hydropower Eng. 2019, 50, 189–196. [Google Scholar] [CrossRef]
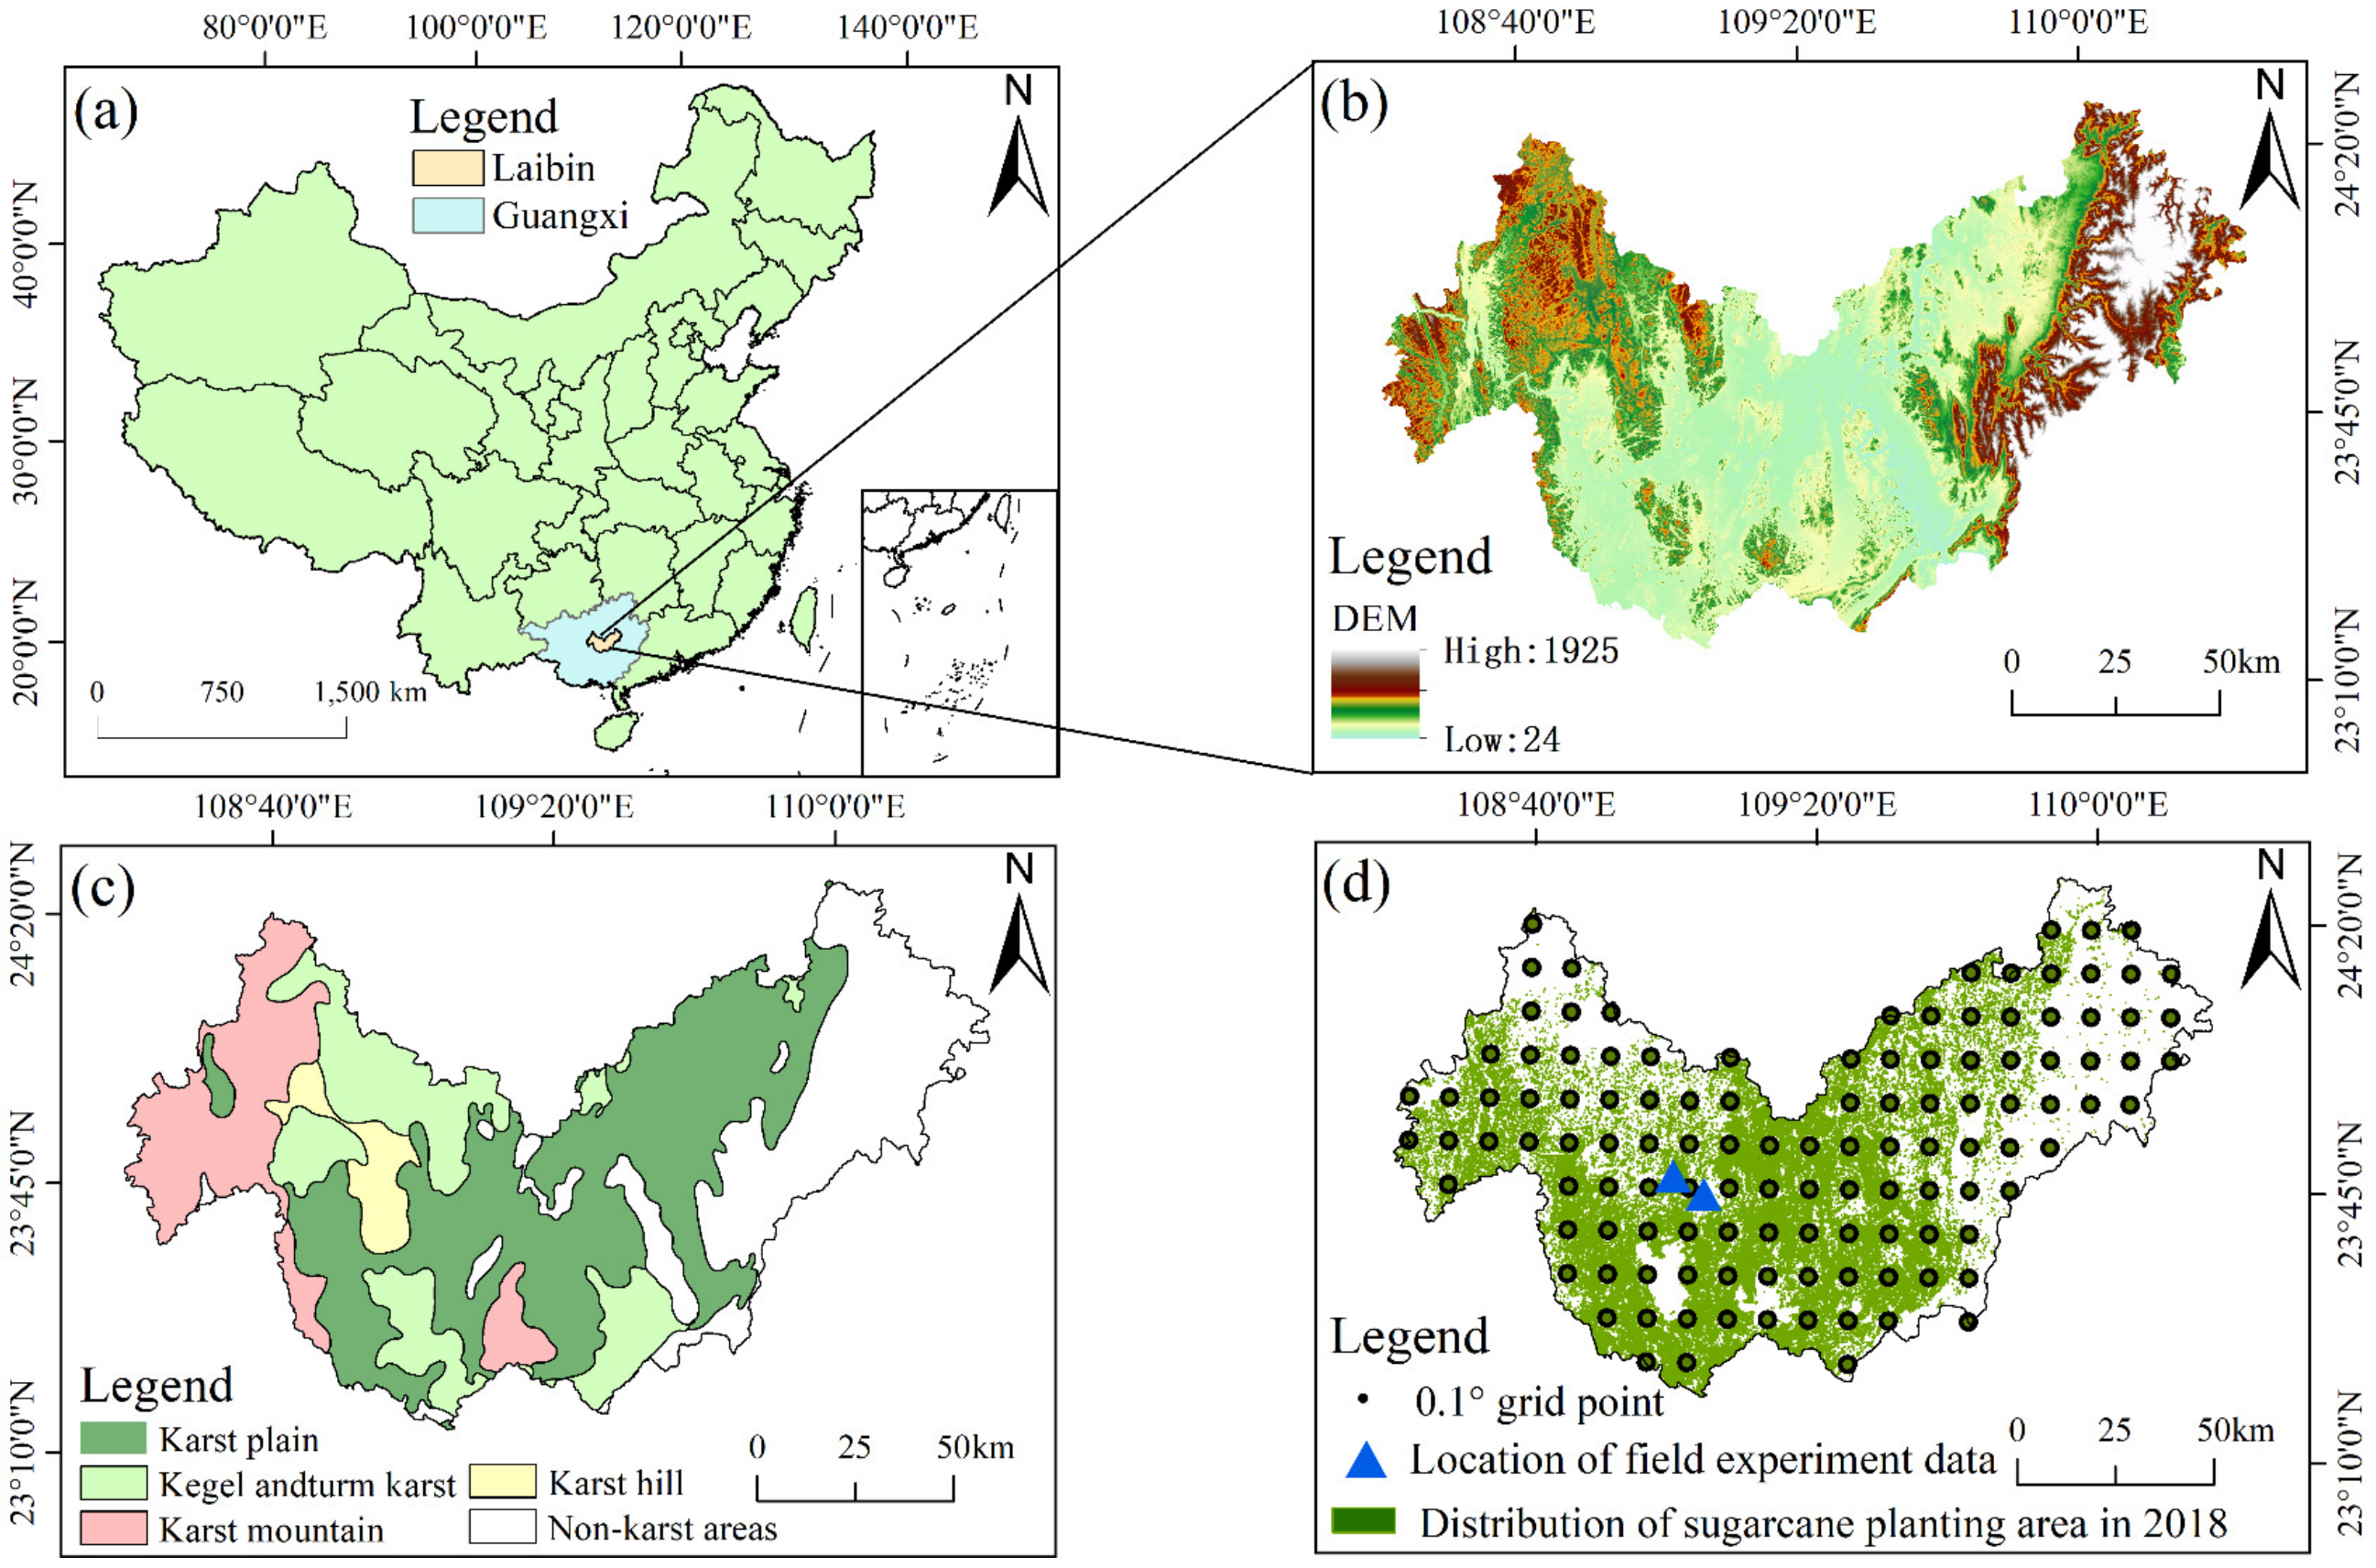
Figure 1. Study area diagram. Situation of Guangxi and sugarcane planting distribution in study area: (a) the location of the study area (Lai-bin city) in China; (b) the DEM distribution of Lai-bin city; (c) the karst landform types and distribution in Lai-bin city; and (d) the sugarcane planting distribution and meteorological data grid points of Lai-bin city.
Agriculture 14 00395 g001
Figure 2. Spatial distribution (which was derived from the drought information of each grid point and is spatially differentiated) of annual mean meteorological drought during 1979–2018 in Lai-bin ((a) drought duration; (b) drought intensity; and (c) drought frequency). Annual distribution of the duration (d) and intensity (e) of meteorological drought during each growth stage of sugarcane in the past 40 years.
Agriculture 14 00395 g002
Figure 3. Sensitivity of sugarcane variety parameters in DSSAT−CANEGRO model. (These 14 parameters have varying degrees of sensitivity. Its best values in the table are obtained using sensitivity 1078 analysis and multiple adjustments (Table 3).) Note: CY: Cane yield (t·ha−1); SH: Stalk height (m); ADB: Aerial dry biomass (t·ha−1); LAI: Leaf area index (m2·m−2).
Agriculture 14 00395 g003
Figure 4. Consistency of simulated and observed sugarcane growth factors of LAI, CY, ADB, and SH values. (The observed values were obtained from field trial datasets during 2015–2016a by Ou [36] and identified on the vertical axis of the graph. The simulated values were derived from the DSSAT−CANEGRO model and identified on the horizontal axis of the graph. The multiple data points are due to the fact that multiple observations were made during different growth periods.) Note: (a) LAI: leaf area index; (b) CY: cane yield; (c) ADB: aboveground dry biomass; (d) SH: stalk height.
Agriculture 14 00395 g004
Figure 5. Simulation of sugarcane growth (such as CY, SH, LAI, and ET; represented by a blue line) response to historical meteorological drought and humid scenarios in typical years (derived from the SPEI of typical years in the study area represented by an orange fill line): (a) CY: cane yield, (b) SH: stalk height, (c) LAI: leaf area index, and (d) ET: evapotranspiration. (Firstly, the typical years of light (2018a), moderate (2009a), severe (1998a), and extreme (1992a) drought were selected and identified by SPEI, according to the characteristics of historical meteorological drought (Section 3.1). Secondly, DSSAT−CANEGRO was used to simulate the daily growth process of sugarcane under the four historical meteorological drought scenarios, and the results of daily CY, SH, LAI, and ET were obtained.) Note: ET: Evapotranspiration (mm/d),LD: Light drought; MD: Moderate drought; SD: Severe drought; ED: Extreme drought; SS: Seedling stage; TS: Tiller stage; SES: Stem elongation stage; MS: Maturity stage.
Agriculture 14 00395 g005
Figure 6. Simulation of sugarcane growth (such as CY, SH, LAI, and ET) response to various meteorological drought scenarios in different cane growth periods. (Firstly, the meteorological drought scenarios were obtained from Table 2 in Section 3.2. Secondly, DSSAT−CANEGRO was used to simulate the sugarcane growth response under different periods. Thirdly, a comparative analysis of the results of CY, SH, LAI, and ET was conducted under different drought intensity scenarios.) Note: (a1a4) CY: cane yield; (b1b4) SH: stalk height; (c1c4) LAI: leaf area index; (d1d4) ET: evapotranspiration; SS: Seedling stage; SES: Stem elongation stage; MS: Maturity stage.
Agriculture 14 00395 g006
Figure 7. Change rate of sugarcane growth factors (such as CY, SH, LAI, and ET) under different meteorological drought scenarios in different cane growth periods. (The implementation steps are the same as in Figure 6. The meteorological drought scenarios here are derived from Table 2 in Section 3.2. A comparative analysis of the change rate of CY, SH, LAI, and ET was conducted under different drought intensity scenarios.) Note: (a1a3) CY: cane yield; (b1b3) SH: stalk height; (c1c3) LAI: leaf area index; (d1d3) ET: evapotranspiration; SS: Seedling stage; SES: Stem elongation stage; MS: Maturity stage.
Agriculture 14 00395 g007
Figure 8. Discussion of sugarcane growth (such as CY, SH, LAI, and ET; represented by a blue line) response to drought, flood, and their alternation scenarios through the whole cane growth period (derived from SPEI in the study area represented by an orange fill line) on the daily scale. (The implementation steps are the same as in Figure 6. The first column (a1d1) is the multiple drought and flood event alternation scenario. The second column (a2d2) is the full flood scenario. The third column (a3d3) is the full drought scenario. The fourth column (a4d4) is the one drought to flood scenario. The fifth column (a5d5) is the one flood to drought scenario). Notes: (a1a5) CY: cane yield; (b1b5) SH: stalk height; (c1c5) LAI: leaf area index; (d1d5) ET: evapotranspiration.
Agriculture 14 00395 g008
Table 2. Simulation meteorological drought scenarios setup in sugarcane growth periods of Lai-bin. (The meteorological drought scenarios in this table were based on the daily SPEI statistical analysis of the study area in Section 3.1. For example, in the past 40 years, there has been no severe or extreme drought in the sugarcane seedling stage. There was no drought event in the whole tillering stage of sugarcane. Days 5 and 60 (or 40) represent the minimum and maximum duration of drought in this sugarcane growth period in the study area, respectively.)
Growth PeriodDates (Days)Light Drought
(Days)
Moderate Drought
(Days)
Severe Drought
(Days)
Extreme Drought
(Days)
Seedling stage3.10–5.10 (62)5–605–60————
Tiller stage5.11–6.11 (32)————————
Stem elongation stage6.12–11.12 (154)5–605–605–605–60
Maturity stage11.13–12.31 (49)5–405–405–405–40
Note: Set 5 days as the starting drought calendar time and change step; increase to 30 days, and then increase to 60 days with a change step of 10 days. “——” means no droughts occurring in this growth period.
Table 3. Parameter description and debugging results of model varieties. (The six parameters marked with asterisks * in the table are not sensitive, and their values are directly determined according to the meteorological data of the study area. The other 14 parameters have varying degrees of sensitivity (Figure 3). Its best values in the table are obtained using sensitivity 1078 analysis and multiple adjustments.)
ParameterDescriptionUnitOptima FittingParameterDescriptionUnitOptimal Fitting
ParcemaxMaximum (no stress) radiation conversion efficiency expressed as assimilate produced before respiration, per unit of PARg·MJ−112.5PI1Phyllocron interval 1 for leaf numbers below Pswitch°Cd89
ApfmxMaximum fraction of dry mass increments that can be allocated to aerial dry masst·t−10.92PI2Phyllocron interval 2 for leaf numbers above Pswitch°Cd179
StkpfmaxFraction of daily aerial dry mass increments partitioned to stalk at high temperatures in a mature cropt·t−10.78PswitchLeaf number at which the phyllocron changes.leaf18
SucaMaximum sucrose contents in the base of stalkt·t−10.58TtplntemThermal time to emergence for a plant crop°Cd488
Tbft *Temperature at which the partitioning of unstressed stalk mass increments to sucrose is 50% of the maximum value°C25Ttratnem *Thermal time to emergence for a ratoon crop°Cd203
Tthalfo *Thermal time to half canopy°Cd250ChupibaseThermal time from emergence to start of stalk growth°Cd1050
Tbase *Base temperature for canopy development°C16Tt_PopgrowthThermal time to peak tiller population°Cd400
LfmaxMaximum number of green leaves a healthy, adequately-watered plant will have after it is old enough to lose some leavesleaves12Max_PopMaximum tiller populationstalks·m−210
MxlfareaMaximum leaf area assigned to all leaves above leaf number MXLFARNOcm2640Poptt16 *Stalk population at/after 1600 °Cd−1stalks·m−213.3
MxlfarnoLeaf number above which leaf area is limited to MXLFAREAleaf15Lg_Ambase *Aerial mass (fresh mass of stalks, leaves, and moisture) at which lodging startst·ha−1220
Disclaimer/Publisher’s Note: The statements, opinions and data contained in all publications are solely those of the individual author(s) and contributor(s) and not of MDPI and/or the editor(s). MDPI and/or the editor(s) disclaim responsibility for any injury to people or property resulting from any ideas, methods, instructions or products referred to in the content.