Article

Spike Device with Worm Gear Unit for Driving Wheels to Improve the Traction Performance of Compact Tractors on Grass Plots

1
Institute of Agricultural Engineering, Transport and Bioenergetics, Faculty of Engineering, Slovak University of Agriculture in Nitra, 949 76 Nitra, Slovakia
2
Information and Coordination Centre of Research, Faculty of Engineering, Slovak University of Agriculture in Nitra, 949 76 Nitra, Slovakia
3
Institute of Statistics, Operation Research and Mathematics, Faculty of Economics and Management, Slovak University of Agriculture in Nitra, Tr. A. Hlinku 2, 949 76 Nitra, Slovakia
4
Department of Geotechnics, Faculty of Civil Engineering, University of Žilina, 010 26 Žilina, Slovakia
5
Institute of Design and Engineering Technologies, Faculty of Engineering, Slovak University of Agriculture in Nitra, 949 76 Nitra, Slovakia
*
Author to whom correspondence should be addressed.
Agriculture 2024, 14(4), 545; https://doi.org/10.3390/agriculture14040545
Submission received: 12 March 2024 / Revised: 26 March 2024 / Accepted: 27 March 2024 / Published: 29 March 2024
(This article belongs to the Section Agricultural Technology)

Abstract

:
In general, energy loss reduction via the interaction of tires with the ground improves tractor traction performance when a drawbar pull is generated. This paper is examines the driving wheels with steel spikes for a tractor equipped with modern radial tires. An improved design of the spike device that allows for the change between an active and inactive position of the spikes is presented. The traction performance of a compact articulated tractor with the spike device was tested on a grass plot with two soil moisture contents (SMC). The highest difference in the drawbar pull in the range from 14.2% to 40.5% and from 17.1% to 36.8% was reached by the spikes in the active position in comparison with the tires without spikes, which were at the slip range from 45% to 5% in the case of the low SMC when the test tractor was in the 3rd and 1st gear. The motion resistance difference between the spikes in the active position and the tires without spikes was 11.8% and 2.5% at the low and medium SMC, respectively. At the low and medium SMC, the highest tractive efficiency of 0.765 (0.721) and 0.757 (0.731) was reached by the spikes in the active position when the test tractor was in the 1st (3rd) gear in comparison with 0.736 (0.7) and 0.723 (0.708) in the case of the tires without spikes. The results indicated that the spike device allowed for the improvement of tractor tractive performance.

1. Introduction

The traction performance of tractors is an important factor influencing agricultural production effectivity, soil damage, and the global environment. It mainly depends on tractor axle load distribution, tractor specifications, soil conditions, and driving wheel properties [1]. Tractor traction performance can be expressed by various parameters [2]. Net traction ratio, an indicator of tractor traction performance, is the ratio of net tractive force to dynamic axle load. Gross tractive force includes net tractive force and motion resistance; therefore, the net traction ratio is equal to the tractor drawbar pull [3]. As mentioned above, motion resistance [4] is another important indicator of tractor traction performance. When the wheel moves, energy is spent to overcome the friction in the wheel bearing, the mechanical parts of the differential, and the deformation of the tire and soil. When motion resistance increases, tractive performance decreases due to a decrease in tractive efficiency. Tractive efficiency, as an important indicator of tractor traction performance, is the ratio of drawbar power to axle power. In addition to drawbar pull, motion resistance, and tractor weight, wheel slip [5] is also needed for an evaluation of tractive efficiency. Driving wheels slip whenever they move because they must overcome the tractor motion resistance. Slip mainly depends on tire–ground force interactions and on the vertical load acting on the driving wheels.
As mentioned above, an increase in the total tractor weight causes an increase in the tractor drawbar pull depending on the actual soil conditions. Ballast weights in the driving wheels or on the front or rear of the tractor are often used [6,7]. On the other hand, the increase in tractor weight requires higher tractor engine effort to drive the tractor, increases the tractor motion resistance due to the tire rolling resistance, and increases the vertical forces acting on the soil [8]. There are many other options to improve tractor traction performance. For example, the use of a four-wheel drive tractor instead of a rear-wheel drive tractor [9,10,11,12], tracks instead of wheels [13,14,15], dual wheels instead of single wheels, high-performance radial ply tires [16] instead of outdated bias ply tires, etc. Finally, tire inflation pressure [17,18,19,20] is a very important operation factor that positively affects tractor tractive performance and soil compaction due to an optimum ratio between the tire contact patch [21,22] and the tire rolling resistance. Today’s modern tractors allow for an automatic change in tire inflation pressure based on the actual operation regime of the tractor, whether working in a field or during road transport. Similarly, steel cage wheels [23], various types of lugged wheels [24], and other special driving wheels [25] improve tractor (or various other vehicles) tractive performance without the need for increased tractor weight or reduced ballast weight. All the solutions improving tractor traction performance should decrease driving wheel slip and increase tractive efficiency.
This study presents the improved design of a spike device and the traction performance of a compact tractor with the device tested on a grass plot at two soil moisture contents. A new control mechanism with a worm gear unit and an optimized shape and placement of the spike segments in the tire tread pattern are the main novelty of the design presented in this study. The drawbar pull, wheel slip, motion resistance, net traction ratio, and tractive efficiency were evaluated to compare the traction performance of tires with the device and tires without the device.

2. Materials and Methods

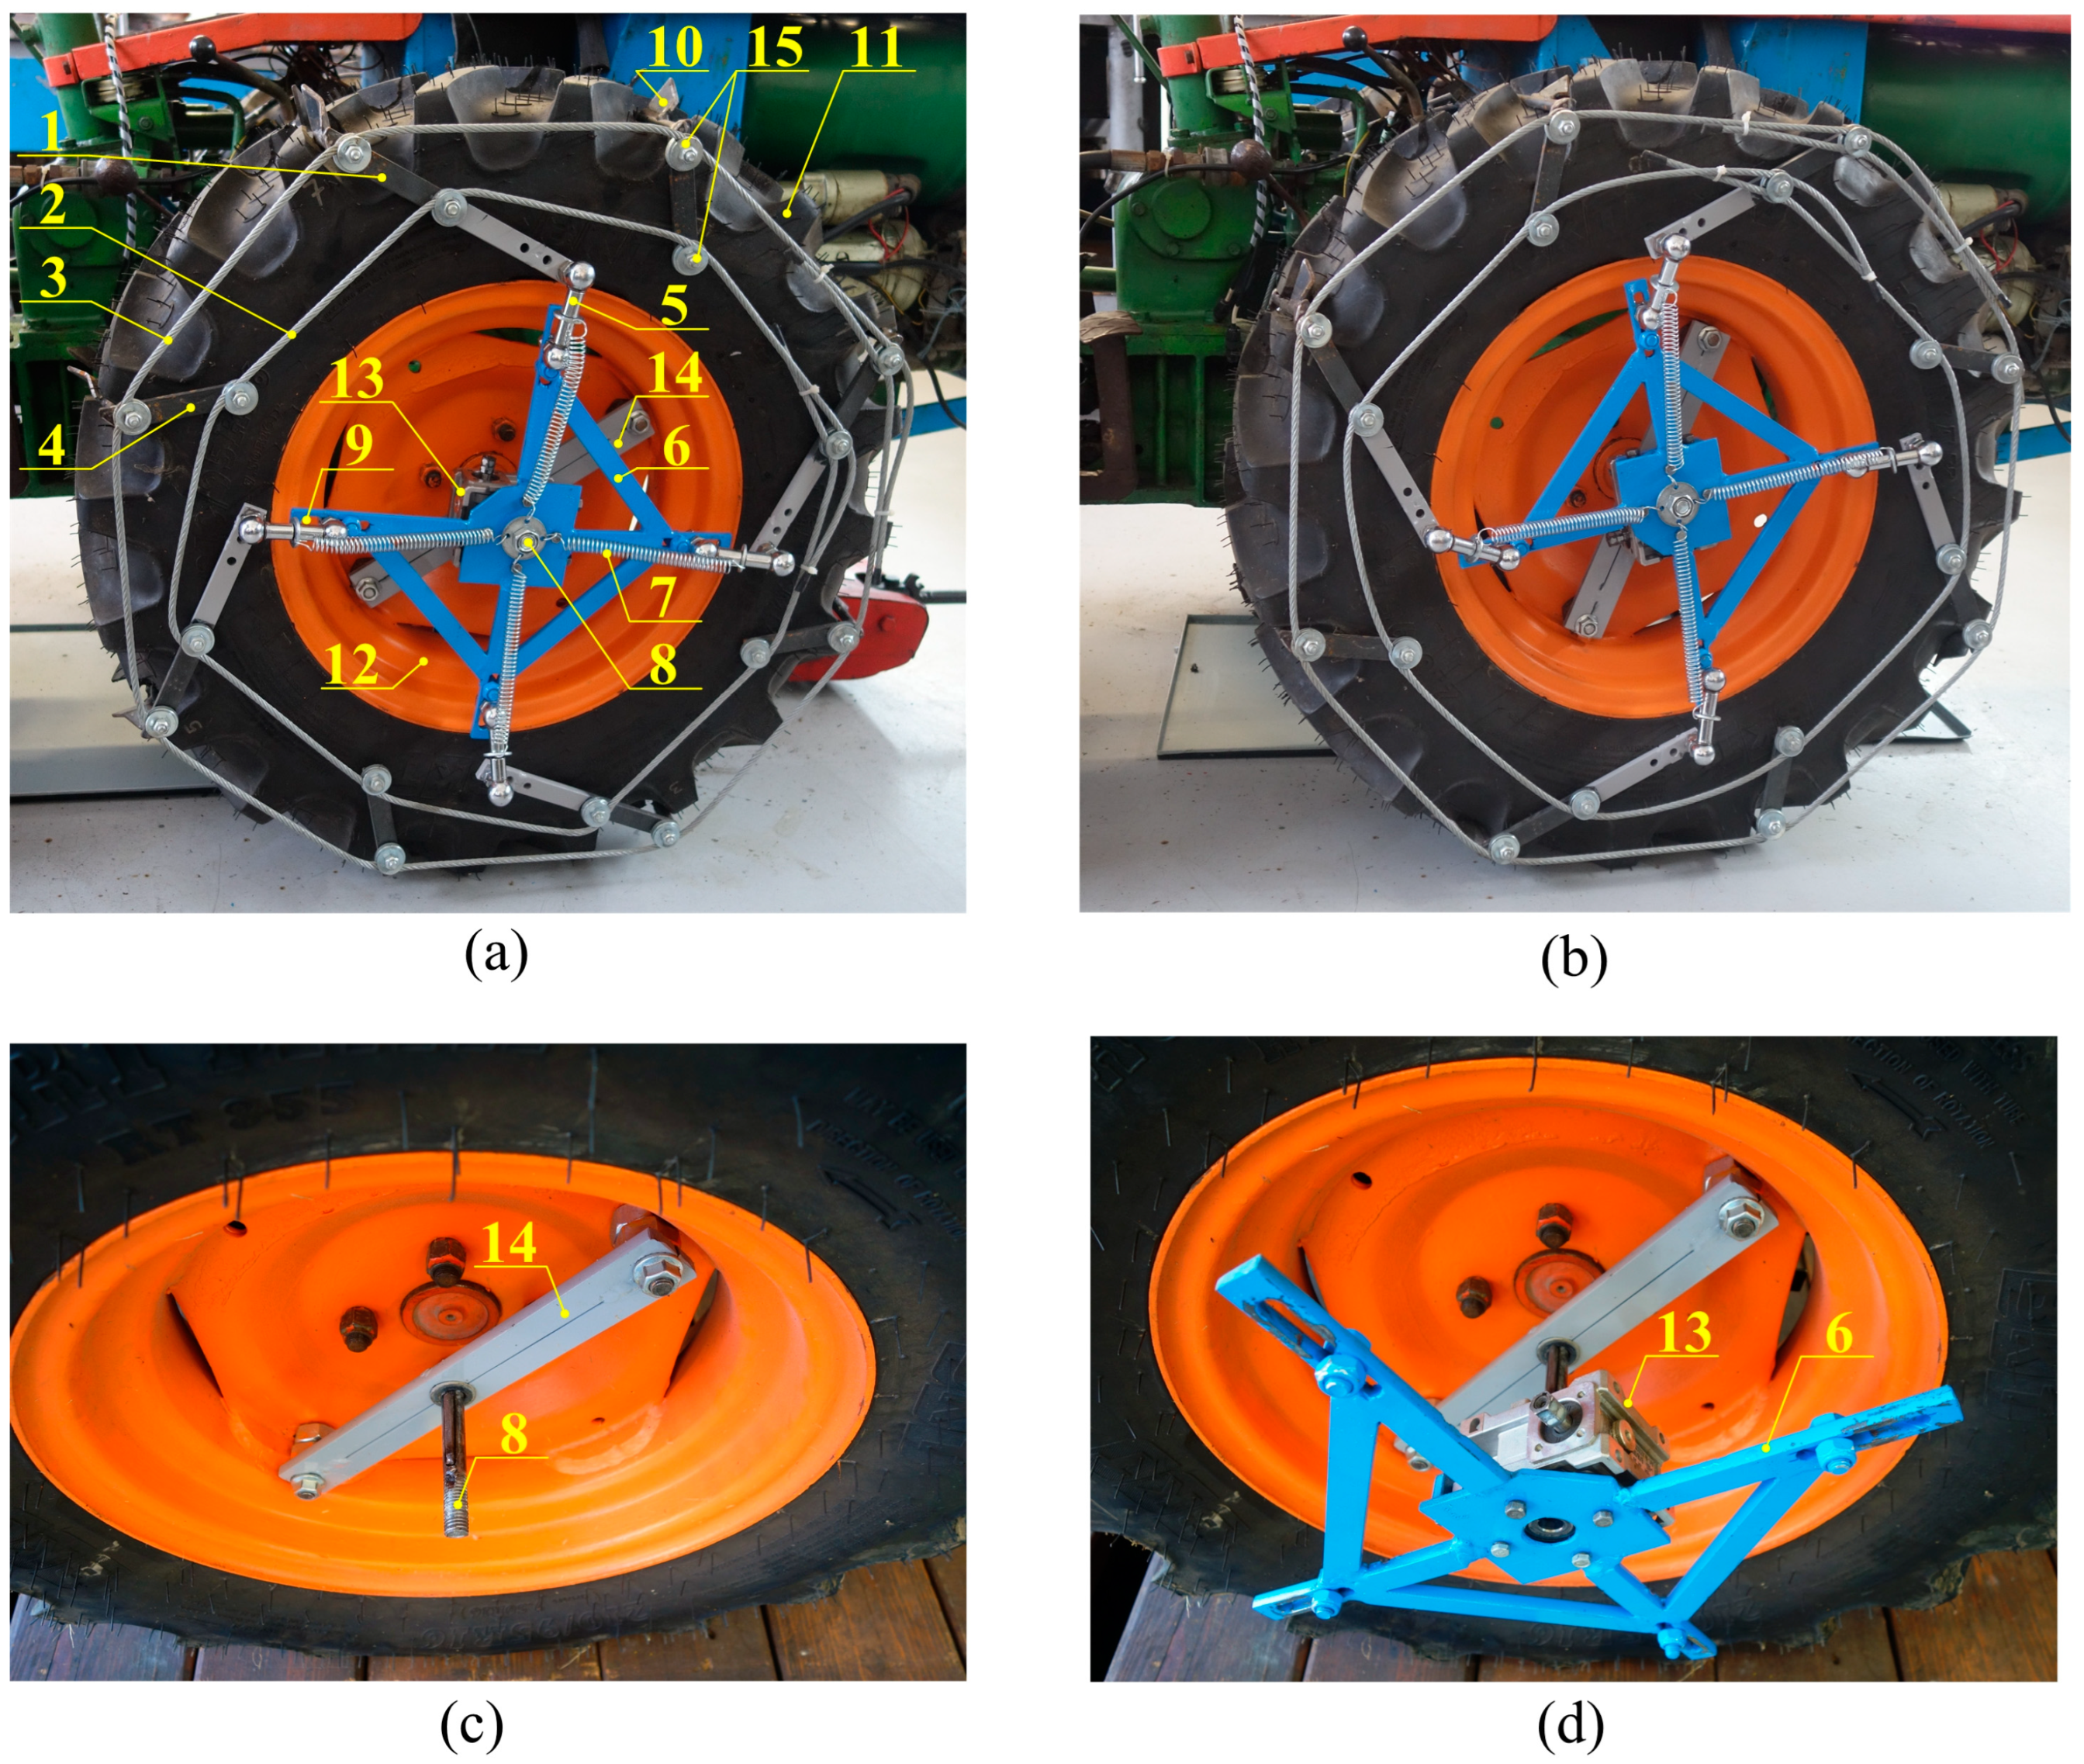
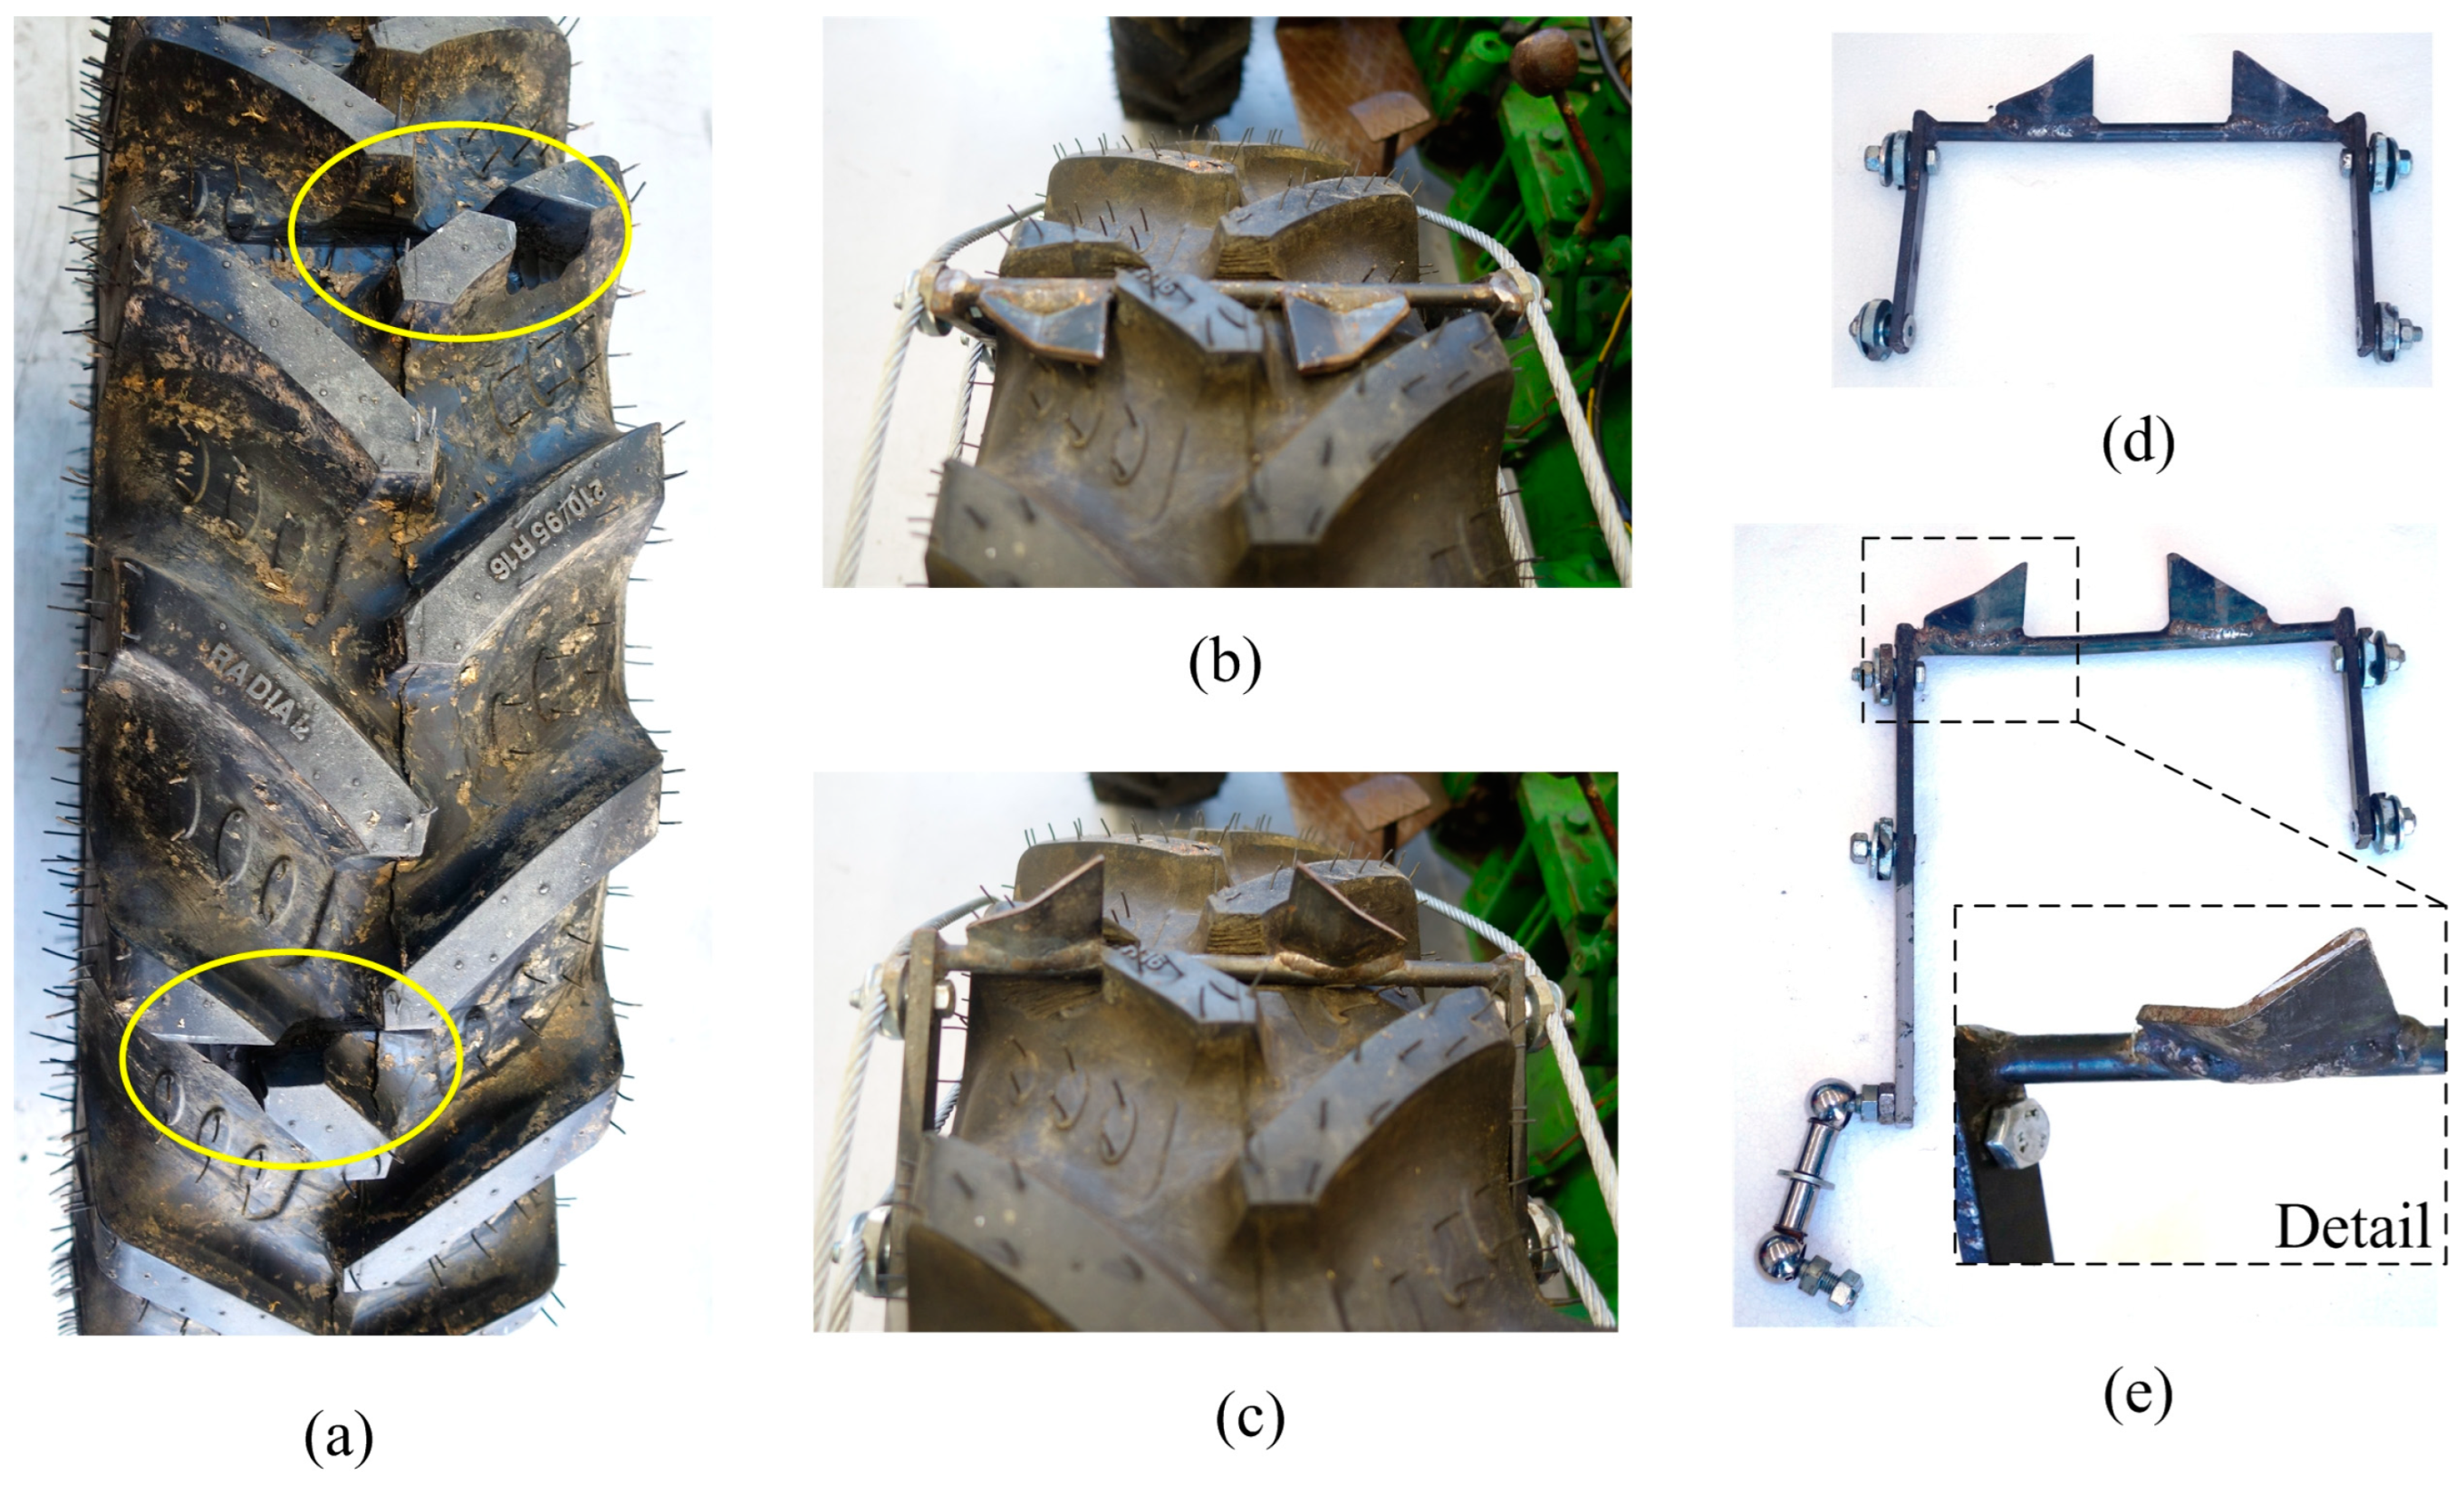
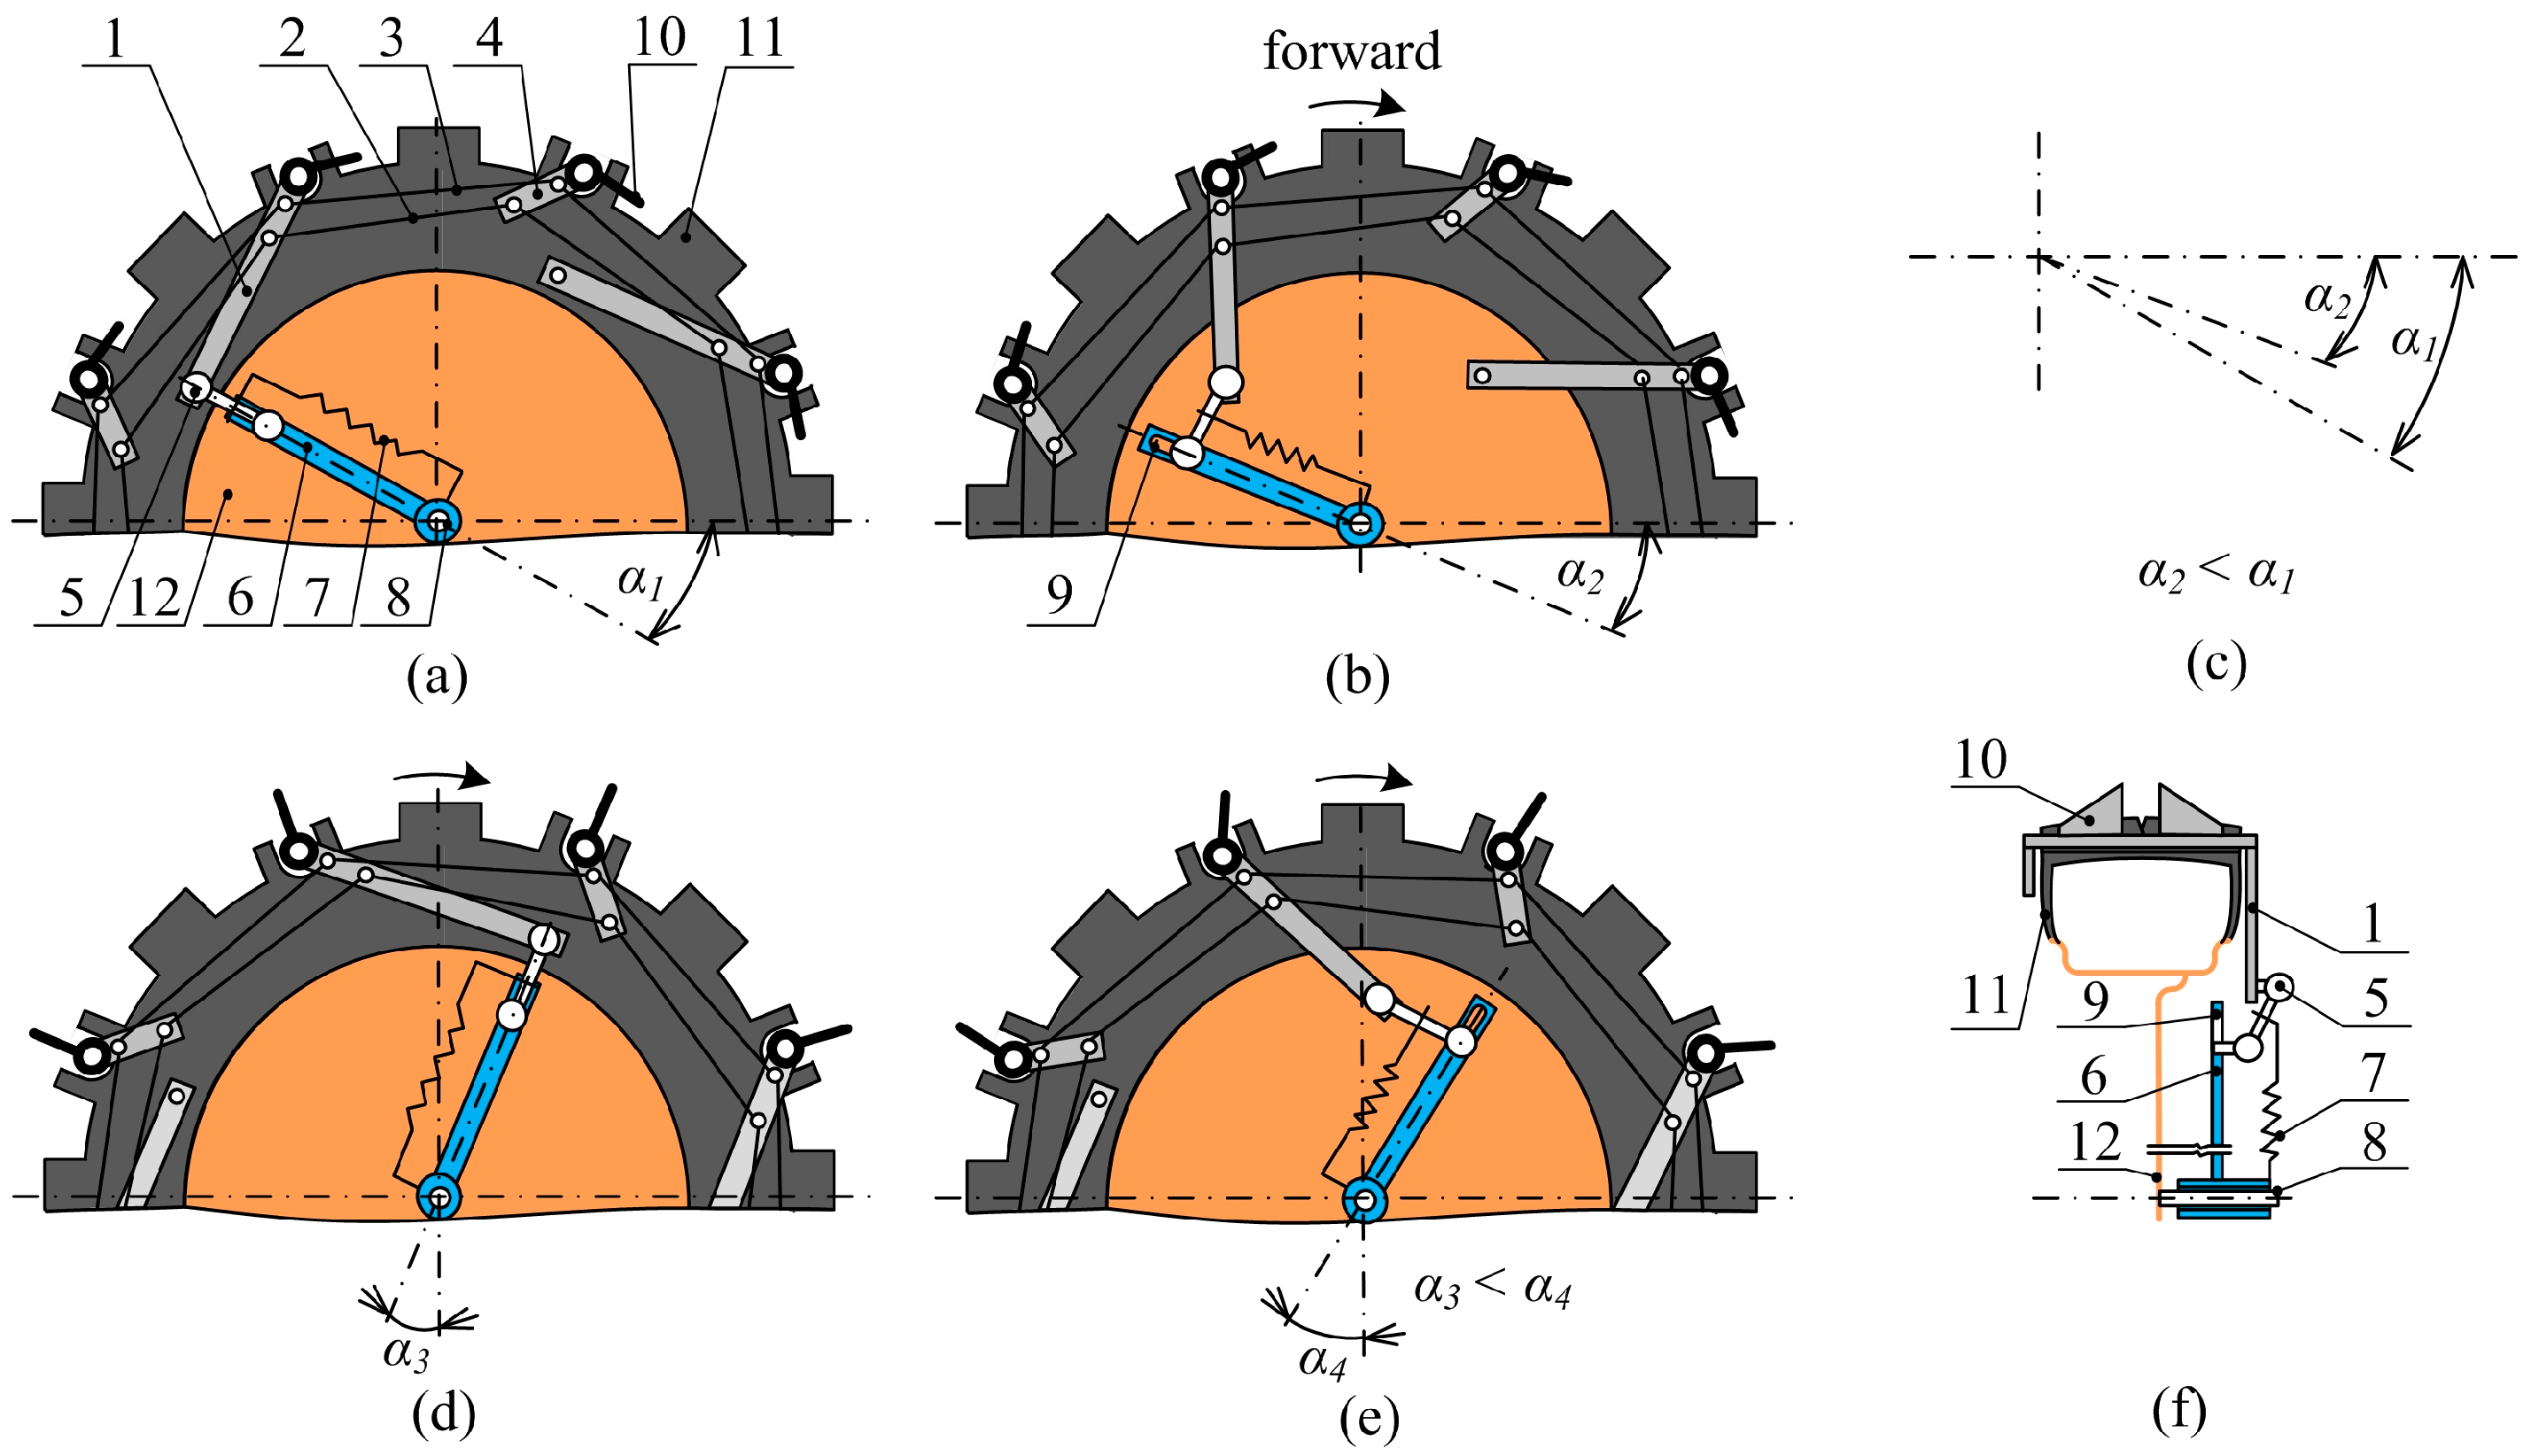
2.1. Spike Device with Worm Gear Unit
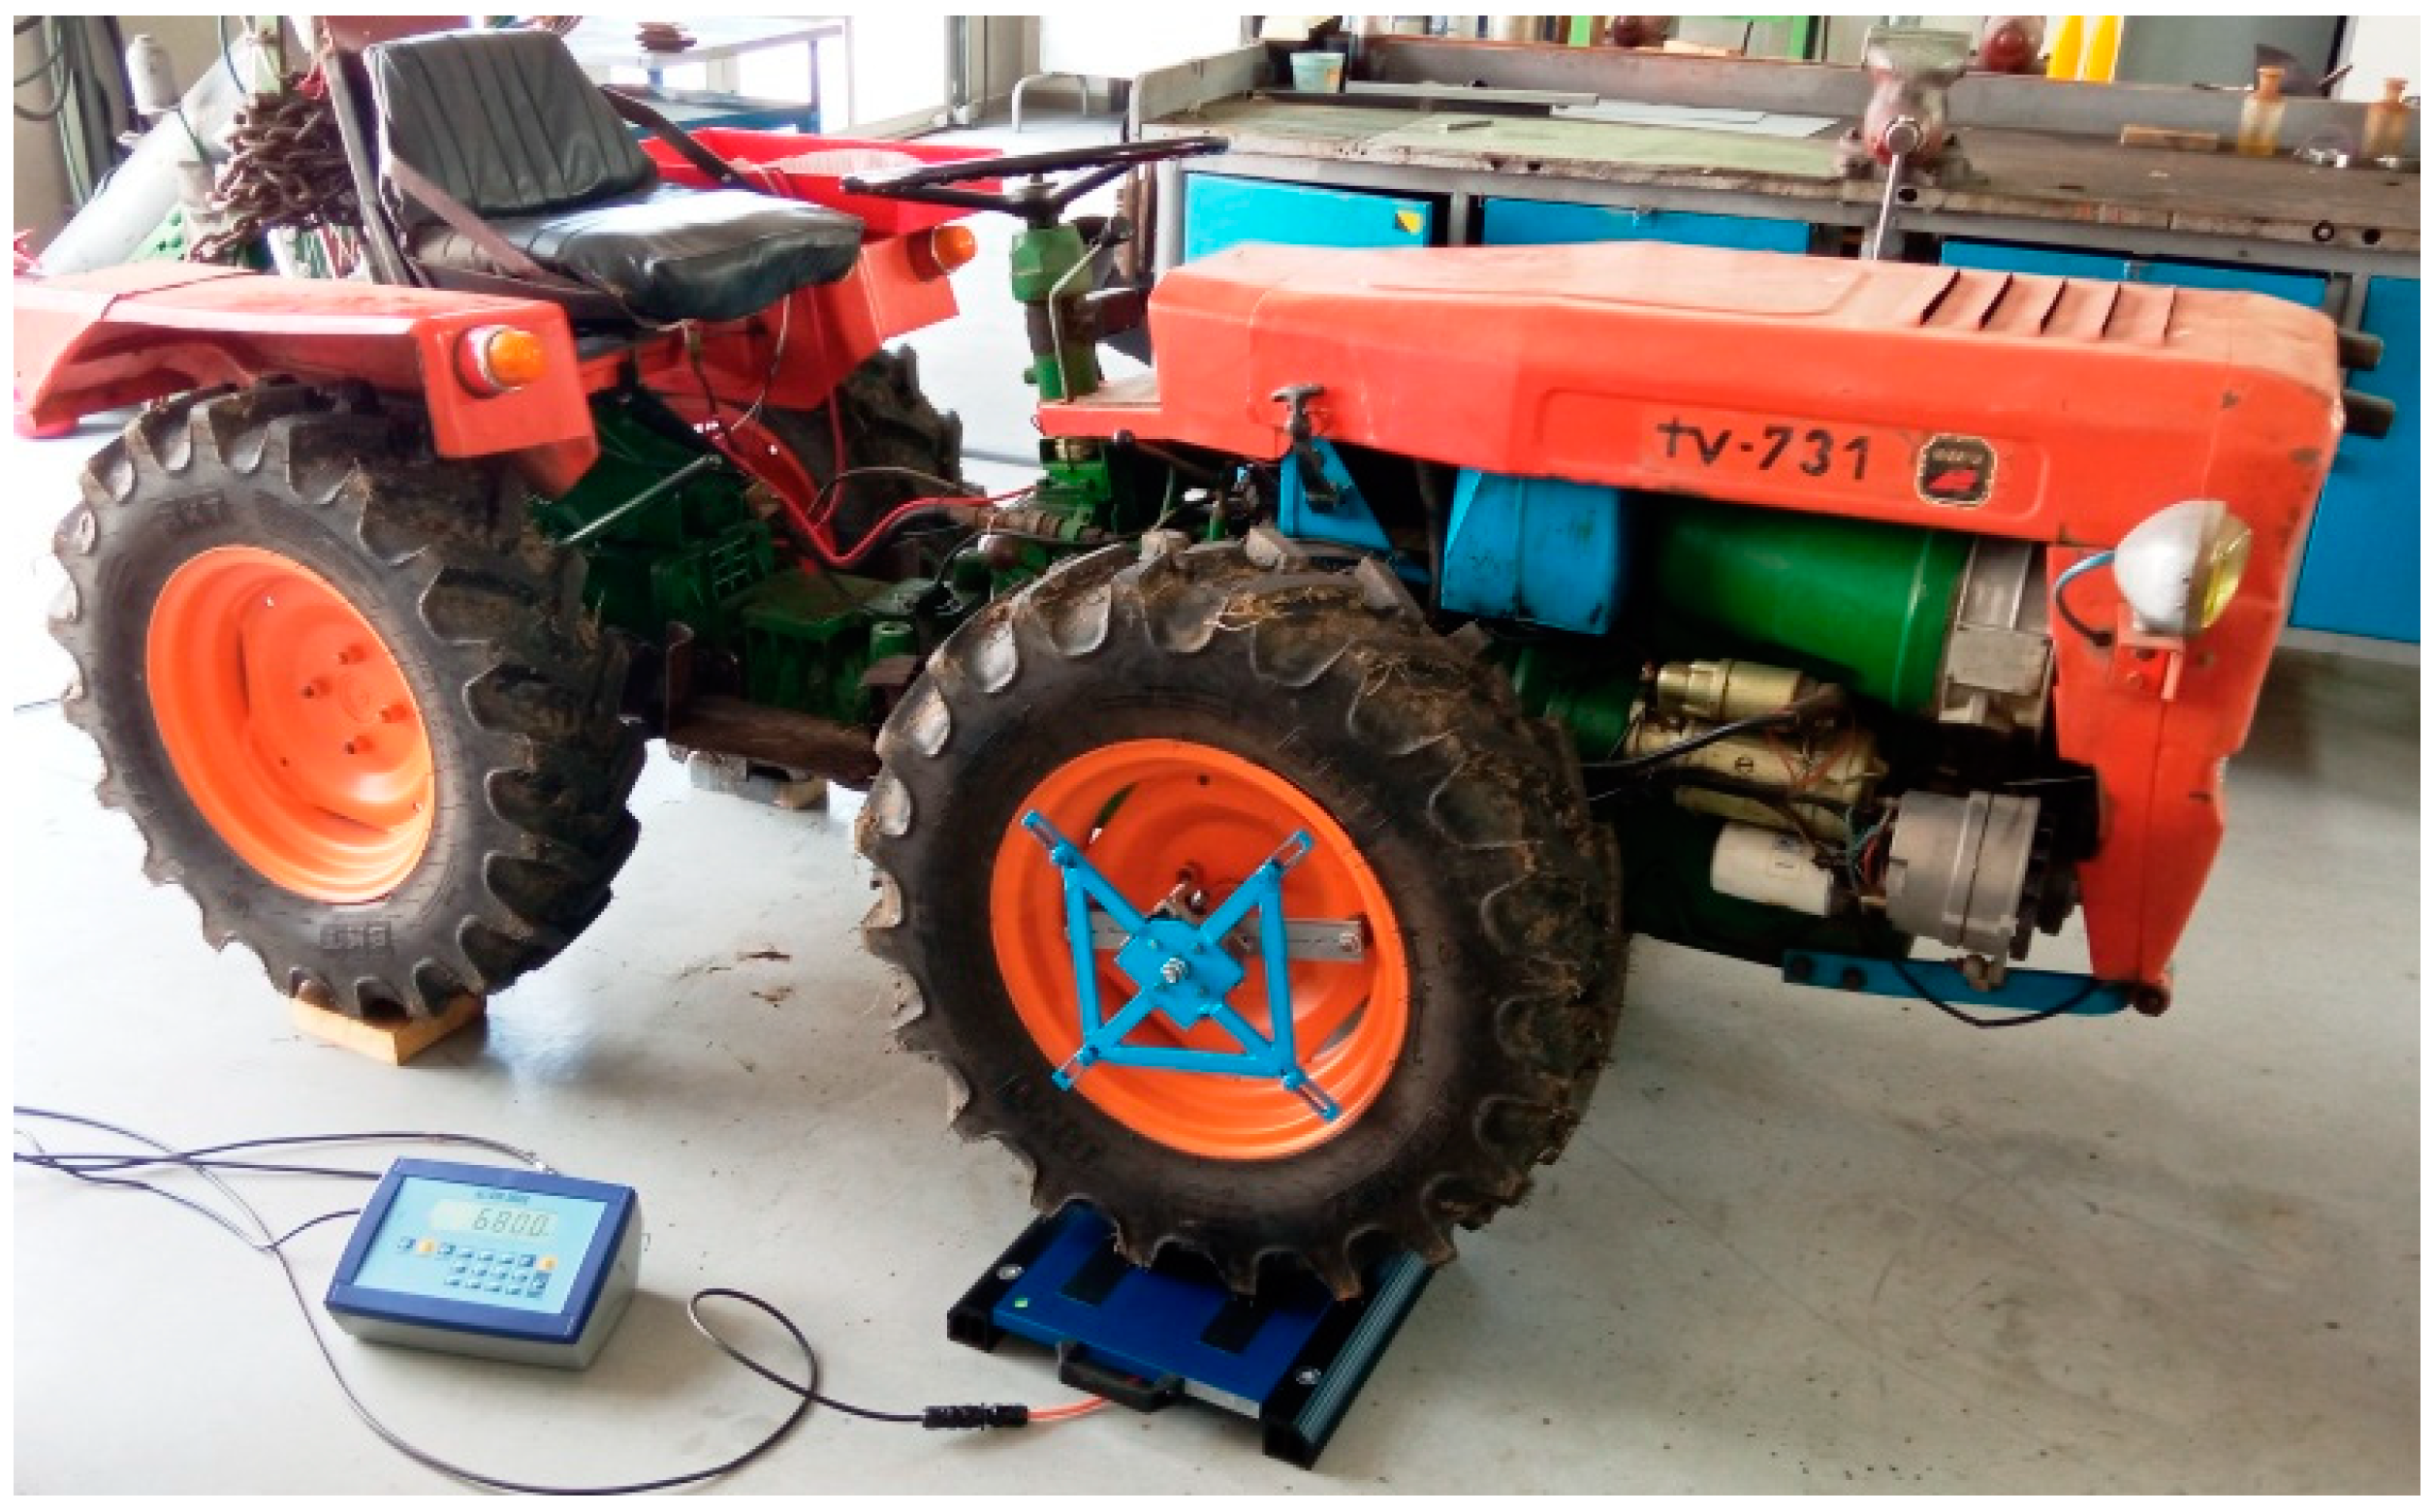
The spike device with a worm gear uses spikes to improve the tractor tractive performance (Figure 1). The device was developed and continuously improved at the Slovak University of Agriculture in Nitra (Slovak Republic) and allows for the setting of the active or inactive spike position. The design of this device is based on the fatigue analysis of a spike segment published in reference [26] and on a previous design version published in reference [27]. The fatigue analysis showed that the diameter of the horizontal rod connecting the left and right arms (Figure 2d,e) can be reduced from 12 mm to 10 mm. The smaller diameter of the spike segment’s horizontal rod was used for the spike device presented in this paper. Spikes in the inactive (base) position are placed in the spaces between the rubber tire lugs, so they do not interact with the ground. Spikes in the active position exceed the maximum tire diameter to interact with the ground. The device has four spike segments with a long arm (1) and four spike segments with a short arm (4). The spike segments with the long arm are connected to a carrier (6) through double ball pivots (5). The carrier is equipped with four steel rods. Four springs (7) are connected with a central shaft (8) on one side and with the double ball pivots on the other side. The carrier is connected to the worm gear unit (13). Using the worm gear unit, the carrier is turned to change between the active or inactive position of the spikes. The central shaft equipped with a key is connected to the wheel discs by a support rod (14). A carry steel wire rope (3) holds the spike segments in the grooves made in a tire-tread pattern. A control steel wire rope (2) turns the spike segments with the short arm (4), together with the spike segments with the long arm (1).
A specific part of the spike device is a worm gear unit of the H/I type (Madler GmbH, Germany) with a gear ratio of 65, output torque of 20 Nm, maximum input speed of 1400 min−1, and weight of 1.4 kg. It allows for the turning of the steel rods of the carrier (6) (change between the active and inactive position of the spikes), increases the torque of drive electric motor, and fixes the spikes in the active or inactive position due to self-locking. The external electric motor (hand accumulator screwdriver), which is not part of the spike device, was used to test the design of the spike device. Therefore, the carrier consists of four carrier steel rods fixed with only three transverse rods. The fourth transverse rod was not used to make a space for the connection of the hand accumulator screwdriver to the worm gear unit drive shaft.
Eight spike segments are placed in grooves made in the tire-tread pattern of the radial tire BKT 210/95 R16 Airmax RT 855 (Balkrishna Industries Ltd., Mumbai, India), corresponding to a 7.50–16 diagonal tire. Four grooves were made in the rubber lugs on one side of the tire and four grooves in the rubber lugs on the other side of the tire, as shown in Figure 2a (grooves are in yellow circles). Because there was only one groove in one rubber lug for one spike segment, a specific triangular shape of the spikes was designed. The number of spike segments (eight) was chosen according to the number of rubber lugs (40) of the tire-tread pattern of this tire type. The groove was made in every fifth rubber lug on the left and right side of the tire. Alternating grooves in the left and right tire rubber lugs evenly load both sides of the tire during the interaction of the spikes with the ground (Figure 2a). The spike segment in the inactive position is shown in Figure 2b and in the active position in Figure 2c. The maximum height of the triangular spike is 41 mm, and the width is 48 mm. The spike segments with the short and long arms are shown in Figure 2d,e. The V-shape of the spikes (detail in Figure 2e) makes it easier to return the spikes back to the base position when the tire-tread pattern is full of soil.
The principle of the spike device is explained by the example of one spike segment (1) and one steel rod of carrier (6), as shown in Figure 3. The spikes (10) are in the inactive (base) position when the arms of spike segments direct against the forward travel direction of the tractor (Figure 3a). The spikes are placed in the spaces between the rubber lugs of the tire-tread pattern. The angle between the carrier steel rod and horizontal axle is α1. The double ball pivot (5) is parallel to the carrier steel rod (6).
To change the inactive (base) position to the active position of the spikes, the carrier steel rod is turned against the forward tractor travel direction (the first phase). The rotation of the carrier steel rod is limited by the minimum angle α2. Angle α1 is higher than α2 (Figure 3c). At this point, rotation cannot continue because of the maximum length between the end of the carrier steel rod and the spike. This position of the double ball pivot allows for the rotation of the long arm of the spike segment due to the rotation of the carrier steel rod in the forward tractor travel direction (the second phase).
The spikes are in the active position when the angle between the carrier steel rod and the horizontal axle is α3. The double ball pivot is parallel to the carrier steel rod (Figure 3d). To change the active position to the inactive position of the spikes, the carrier steel rod is turned in the forward tractor direction (the first phase). When the angle between the carrier steel rod and horizontal axle is α4, the following rotation is not possible because of the maximum length between the end of the carrier steel rod and the spike (Figure 3e). The spikes are placed in the inactive position by the rotation of the carrier steel rod in the opposite direction to the forward tractor direction (the second phase).
The spring (7) eliminates a jam of double ball pivots during the rotation of the carrier (6) when the spike position is changing. The double ball pivot (5) was used to connect the end of the carrier steel rod (6) with the long arm of the spike segment (1). These parts are at different distances from the wheel disc (12) to allow for free motion without the risk of mutual contact (Figure 3f).
The grooves in the carrier steel rods eliminate the forces acting on the worm gear unit due to the interactions between the spikes and the ground. When the spikes in the active position (Figure 3d) penetrate the soil, the steel wire ropes avoid the turning of the spikes back. The grooves in the carrier steel rods allow for the movement of the double ball pivots against spring forces to protect the worm gear unit from overloading.

2.2. Test Tractor

A four-wheel drive test tractor Tomo Vinkovic TV 731 (Tomo Vinkovic d. o. o, Bjelovar, Croatia) was used to test the special spike devices in the active and inactive positions in comparison with the tires without spikes. It represents a compact articulated tractor widely used in the world (Figure 4). The rated power of a four-stroke diesel engine with two cylinders is 22.5 kW at 3000 rpm. The wheelbase of the test tractor is 1.185 m, and the tire tread width is 1.2 m. The spike devices were tested on the front wheels because the tractor is equipped with a front differential lock and the tractor weight on the front axle is higher than on the rear axle. Therefore, the traction performance of the front wheels is higher than that of the rear wheels.
Using the wheel weighting pads WWSB 1500-2 (Dini Argeo s. r. l., Spezzano di Fiorano, Italy), the weight of the test tractor equipped with the spike devices was experimentally measured. The weight on the front axle with the spike devices was 698 kg, and the weight on the rear axle was 317 kg. Regarding the tractor driver’s weight of 115 kg, the total test tractor weight with two spike devices was 1130 kg. The spike segments, double ball pivots, and steel wire ropes were removed from the driving wheels for the test of the tires without spikes. The other parts of the spike devices (carrier, worm gear unit, and support rod with a central shaft) remained on the driving wheels, as shown in Figure 4. The same tractor weight was considered in the test without spikes and in the test with the spikes in the active and inactive positions.

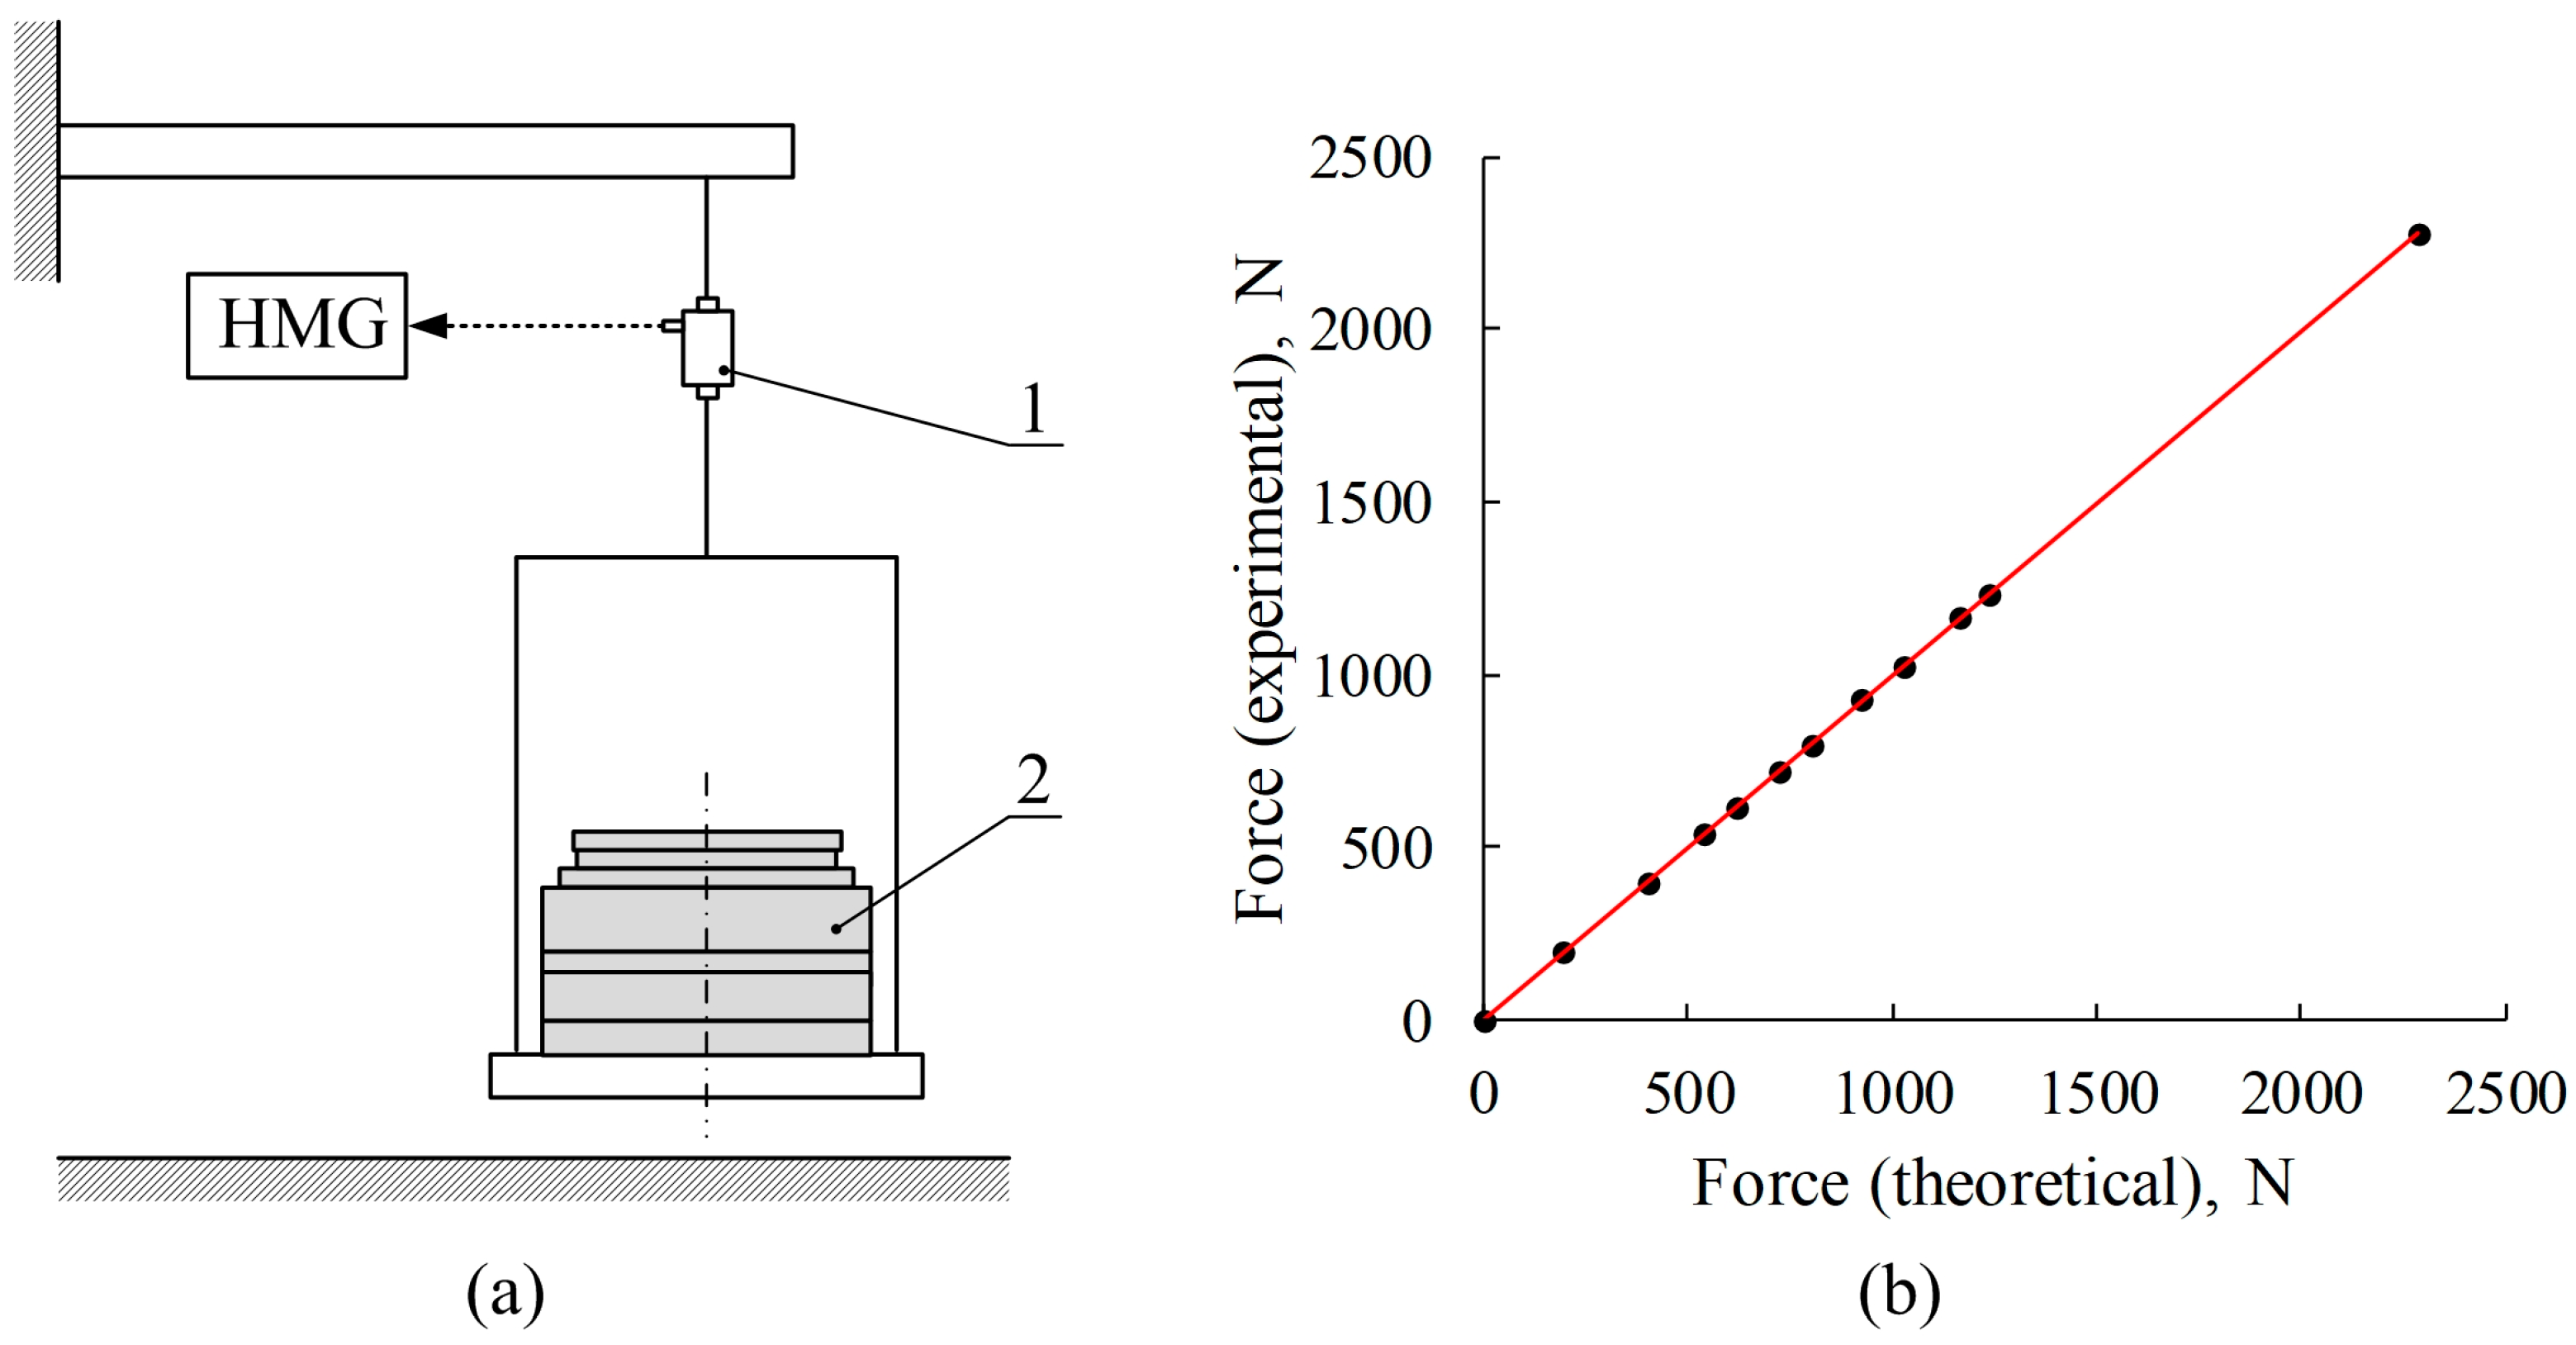
2.3. Measurement Devices for Experimental Field Tests

Drawbar pull tests were performed to evaluate the traction characteristics of the test tractor with various modifications of the front driving wheels. The measurement system needed for the drawbar pull tests is shown in Figure 5. The test tractor was connected to the load tractor using a steel chain. The load tractor Zetor 6321 (Zetor a.s., Brno, Czech Republic) has a higher weight than the test tractor to generate the braking force required.
To record the parameters expressing the tractive performance of the test tractor with various front driving wheels, a portable data recorder HMG 3010 (Hydac GmbH, Sulzbach/Saar, Germany) was used. It recorded digital and frequency input signals from the sensors of the measurement system. The accuracy of the data recorder was ≤±0.1% of the full scale, and the sampling frequency was 100 Hz.
The drawbar pull was measured using a load cell EMS 150 (Emsyst s. r. o., Trenčín, Slovak Republic) connected between the test tractor and the steel chain. The accuracy of this load cell with a strain gauge measuring system was characterized by an accuracy class of 0.2. The error of the load cell with the rated capacity of 20,000 N was 40 N. Digital signals (0–10 V) from the load cell were recorded by the data recorder.
During the drawbar pull tests, the rotation speed of the test tractor engine was set to simulate real operation conditions. The engine rotation speed was measured using a revolution counter MGT-300 EVO (Mahle GmbH, Stuttgart, Germany) (Figure 5). The measurement range of the revolution counter was 300–9990 rpm, with a resolution of 10 rpm. The engine rotation speed was measured by a magnetic vibration transmitter and shown on a display.
Two inductive proximity sensors, Sick IME08-06 (Sick AG, Waldkirch, Germany) were used to measure the slip of the front driving wheels. To measure the theoretical speed, the ring with 20 steel segments was connected to the inner side of the front wheel disc, and the proximity sensor was placed on the front axle near the steel segments [28,29]. The measurement of the actual speed was performed with the fifth wheel connected to the tractor rear axle. The fifth wheel was equipped with 17 steel segments placed on the wheel spokes, generating electric pulses in the second proximity sensor. The steel disc was used as an additional ballast weight to ensure permanent contact of the fifth wheel with the ground. One electric pulse equals 0.05 of one front driving wheel revolution in the case of the theoretical speed and 0.06 of one-fifth wheel revolution in the case of the actual speed. The accuracy of the theoretical and actual speed measurements was adequate for the experimental field tests. The electric pulses from the inductive proximity sensors were processed in an electronic system and recorded in the data logger (HMG 3010). The proximity sensors and electronic system were battery-powered by two 12 V sealed lead–acid batteries with a capacity of 7.2 Ah. The circumference of the front driving wheel was calculated based on the dynamic radius (397 mm) measured experimentally. The front driving wheels’ slip was calculated using the theoretical and actual linear distances per pulse.
Before the experimental tests, the drawbar pull, slip, and engine rotation speed measurement systems with the datalogger were proved. Validation and verification of the data generated by the load cell, the inductive proximity sensors, and the revolution counter were based on a comparison of the theoretical and experimental data under simulated experimental conditions. The data from the load cell (experimental force) was compared with the force of gravity (theoretical force) resulting from test weights. Eleven test weight levels were simulated by the steel discs hanging on the load cell. The weight of each steel disc was measured by the weighting pads. Comparisons between the theoretical force acting on the load cell and the experimental force generated by the load cell are shown in Figure 6.
The differences between the experimental and theoretical data were calculated and are listed in Table 1. Considering the variability of the field experimental data, the influence of the highest difference range (from −0.23% to 0.48%) on the experimental data precision is negligible.
Comparing the pulse quantity recorded by the electronic system with the value resulting from the number of steel segments connected to the wheel (the driving wheel or fifth wheel) multiplied by the number of wheel revolutions, the slip measurement systems were verified. Based on the tractor operation regime during the experiments, the rotation speed of the driving or fifth wheel was simulated. The number of wheel revolutions was visually computed using a contrast mark made on the tire. The verification of the systems confirmed that the distances between the steel segments and proximity sensors were properly designed and the slip measurement system operated correctly.
The data obtained using the revolution counter were compared with a digital stroboscope tachometer (tachometer speed rate from 100 to 10,000 per minute, resolution of 0.1 rpm, sampling time of 1 s, and accuracy of 0.05% ± 1 digit). The accuracy of the tachometer over the measurement range was ensured by a crystal time base and microprocessor circuit. Using the tachometer, the rotation speed of the crankshaft pulley equipped with a reflection strip was measured. Considering only minimal engine rotation speed oscillation due to engine operation, the rotation speed measured by the revolution counter corresponded with the rotation speed measured using the stroboscope tachometer.

2.4. Drawbar Pull Test and Motion Resistance Measurements

Experimental measurements were performed for the spike device in the active position, inactive position, and the tires without spike segments. The tires without spike segments were considered as standard tires regarding a relatively small volume of rubber removed from the grooves in the tire-tread pattern. The transverse direction of the grooves to the direction of tire rotation eliminates the negative impact of the grooves on the traction performance of the tire. It was assumed that the projection of the front area of the tire rubber lugs, by which the tire interacts with the soil, was minimally affected by the transverse grooves.
The drawbar pull test and the motion resistance measurements of the test tractor were performed on the level ground in all directions. In general terms, tractors commonly use a low-speed range for field agrotechnical operations and a high-speed range for transport operations. Therefore, the test tractor in the 1st and 3rd gear (low-speed range) was used for the drawbar pull tests. The front differential lock was activated during the tests. The tractor engine was operated at the highest torque (rotation speed of 2200 rpm) to simulate real tractor operation conditions at the lowest fuel consumption [3]. The highest driving force between the driving wheels and the ground was generated to perform the drawbar pull test at a wide range of wheel slips considering the tractor’s traction performance improvement when the steel spikes were engaged. Considering the gear ratio of 251.4 and 92.9 for the 1st and 3rd gear, the theoretical speed of the unloaded test tractor at the engine rotation speed of 2200 rpm was about 1.3 km h−1 and 3.5 km h−1, respectively.
The load tractor generated braking force to load the test tractor during the drawbar pull test. Selecting an appropriate gear and throttle, the travel speed of the load tractor was synchronized with the test tractor in the 1st or 3rd gear at an engine rotation speed of 2200 rpm. The load on the test tractor was increasing when the throttle of the load tractor was gradually decreasing. During the tests, the wheel slip and drawbar pull also gradually increased. Travel distances of about 75 m and 100 m were needed for the drawbar pull tests of the test tractor in the 1st and 3rd gears. The test tractor load was slowly increased to record in detail the changes in the slip and drawbar pull.
The motion resistances of the test tractor with various front driving wheels were measured by pulling it with the second tractor (load tractor). The test tractor was in neutral and connected with the second tractor by a steel chain and load cell. Motion resistance measurements were performed at the same distances of the experimental plot as the drawbar pull test.
The experimental tests were repeated three times. Considering the variability of the data measured under the field conditions, outliers were removed. Using MAD (median absolute deviation), the robust Z-score method [30] was used to remove outliers from the experimental data file. The data were statistically processed using the SAS EG (version 7.1) statistical analysis software and evaluated at a 5% significance level.

2.5. Tractive Performance Evaluation of Various Front-Driving Wheel Types

To evaluate the various wheel types, the tractive performance of the test tractor was characterized by drawbar pull depending on the wheel slip or net traction ratio, and the tractive efficiency depended on the net traction ratio. The net traction ratio NTR is expressed by Equation (1):
N T R = D P W
where DP is the drawbar pull (N) and W is the total weight of the test tractor (N).
The tractive efficiency TE is expressed by Equation (2):
T E = N T R N T R + M R R ( 1 s 100 )
where MRR is motion resistance ratio, NTR is net traction ratio, and s is front-driving wheels slip (%).
Motion resistance MR is the difference between the gross traction and drawbar pull, and it is measured experimentally. Based on the motion resistance, the motion resistance ratio MRR is calculated and expressed by Equation (3):
M R R = M R W
where MR is motion resistance (N) and W is the total weight of the test tractor (N).
Comparing the actual and theoretical speed (both velocities are determined over paths of the same length) of the test tractor [31,32], the slip of the front-driving wheels s (%) is expressed by Equation (4):
s = v t v a v t 100
where vt is the theoretical speed (m s−1) and va is the actual speed (m s−1).
Various models describing the functional relationship of DP vs. s and TE vs. NTR are useful to determine the test tractor’s tractive performance. The authors of previous research works have used, for example, a quadratic polynomial regression technique [33,34,35] or a nonlinear regression technique [36]. The regression equations for drawbar pull DP and tractive efficiency TE used in reference [36] were applied to evaluate the traction performance of the spike device with the worm gear unit and are expressed by Equations (5) and (6):
D P = C 1 1 e x p C 2 s 100 W
T E = C 1 1 e x p C 2 s C 1 1 e x p C 2 s + M R R 1 s 100
where C1 and C2 are regression coefficients, s is the slip (%), W is the test tractor weight (N), and MRR is the motion resistance ratio.

2.6. Experimental Conditions

The experimental tests were performed in the Slovak Agricultural Museum near the Slovak University of Agriculture in Nitra, Slovakia. The test plot was situated in Danube Lowland (Western Slovakia). The special spike device was tested on a grass plot at two soil moisture contents (SMC). To simulate the real operation conditions, the tests at the low moisture content were performed in March 2023 in sunny weather and in April 2023 under increased rain, which increased the soil moisture to a higher level. Kopecky’s rollers were used to randomly collect three soil samples. The low and medium SMCs were characterized by a gravimetric water content (dry basis) of 27.1% and 33.8%, respectively. The height of the grass was about 10 cm in March and 15 cm in April. The organic matter of 0.4% was also determined, because this parameter affects soil properties. The soil type was Chernozem (World Reference Base for Soil Resources), and the soil texture was loamy sand. The soil composition and physical properties are shown in Table 2.

3. Results and Discussion

3.1. Properties of the Spike Device with a Worm Gear Unit

In addition to the effect of the spikes on tractor traction performance, the operation properties of the spike device with the worm gear unit are important. The device presented in this study is characterized by its main specific features. It allows for operation with spikes in the active position when the spikes interact with the soil, and with spikes in the inactive position when the spikes are placed in the spaces between the tire rubber lugs to transport the tractor without soil–spike interactions. The spikes can be used to perform agrotechnical operations with better tractor traction performance, and tractor transport on roads can be performed as with standard tires. For example, steel cage wheels [37,38,39] and other similar traction aids with steel lugs do not allow for the inactivation of steel lugs–soil interactions. The other advantage is the simple design of the device, which allows for easy removal of the spike segments with steel wire ropes from the driving wheels. The effects of spike–soil interactions are supported by soil compaction due to the tractor weight on the driving wheels. Other traction aids mounted near the driving wheels interact with the soil and are not compacted by tractor weight [40]. A certain disadvantage is the need for the minimum height of the tire rubber lugs necessary for the spike segments in the inactive position. Therefore, the tire should be changed when the tire rubber lugs’ height is decreased due to operational wear, or the tire without spikes should be used.
Another disadvantage is the need for grooves in the tire-tread pattern. The manufacturers of tractor tires must to make these grooves in the tire rubber lugs. Only a small amount of rubber was removed, so it can be assumed that the grooves do not negatively affect the tractive performance of the tire. The tests under operation conditions showed worse self-cleaning properties of the tire with spikes in the active and inactive position at a medium SMC. On the other hand, the self-cleaning properties had no negative effect at a low SMC. Based on previous designs presented by the authors of this study [41,42], the new design of the spike device was improved. A new principle of the control system changing the active and inactive position of the spikes was developed. Previously, the spike device was manually controlled by a lever mechanism. Now, the worm gear unit allows for the change between the active and inactive position of the spikes using an electric motor. The self-locking worm gear unit fixes the spikes in the active or inactive position and increases the torque (high gear ratio) for spike position changes. The spike segments were previously placed only in the tire rubber lugs on the right side of the tire. By applying the rubber lugs to both sides of the tire tread pattern for the spike segments, the design was improved. The new design equally loads the tire-tread pattern due to the forces resulting from interactions between the soil and spikes. A flat triangle or sharp rod design of spikes have been previously used. The actual spike design combines the advantages of both previously tested technical solutions. The V-shape provided better placement to the base position, and the flat triangle area of the spike allowed for better traction performance in comparison with the sharp rod.

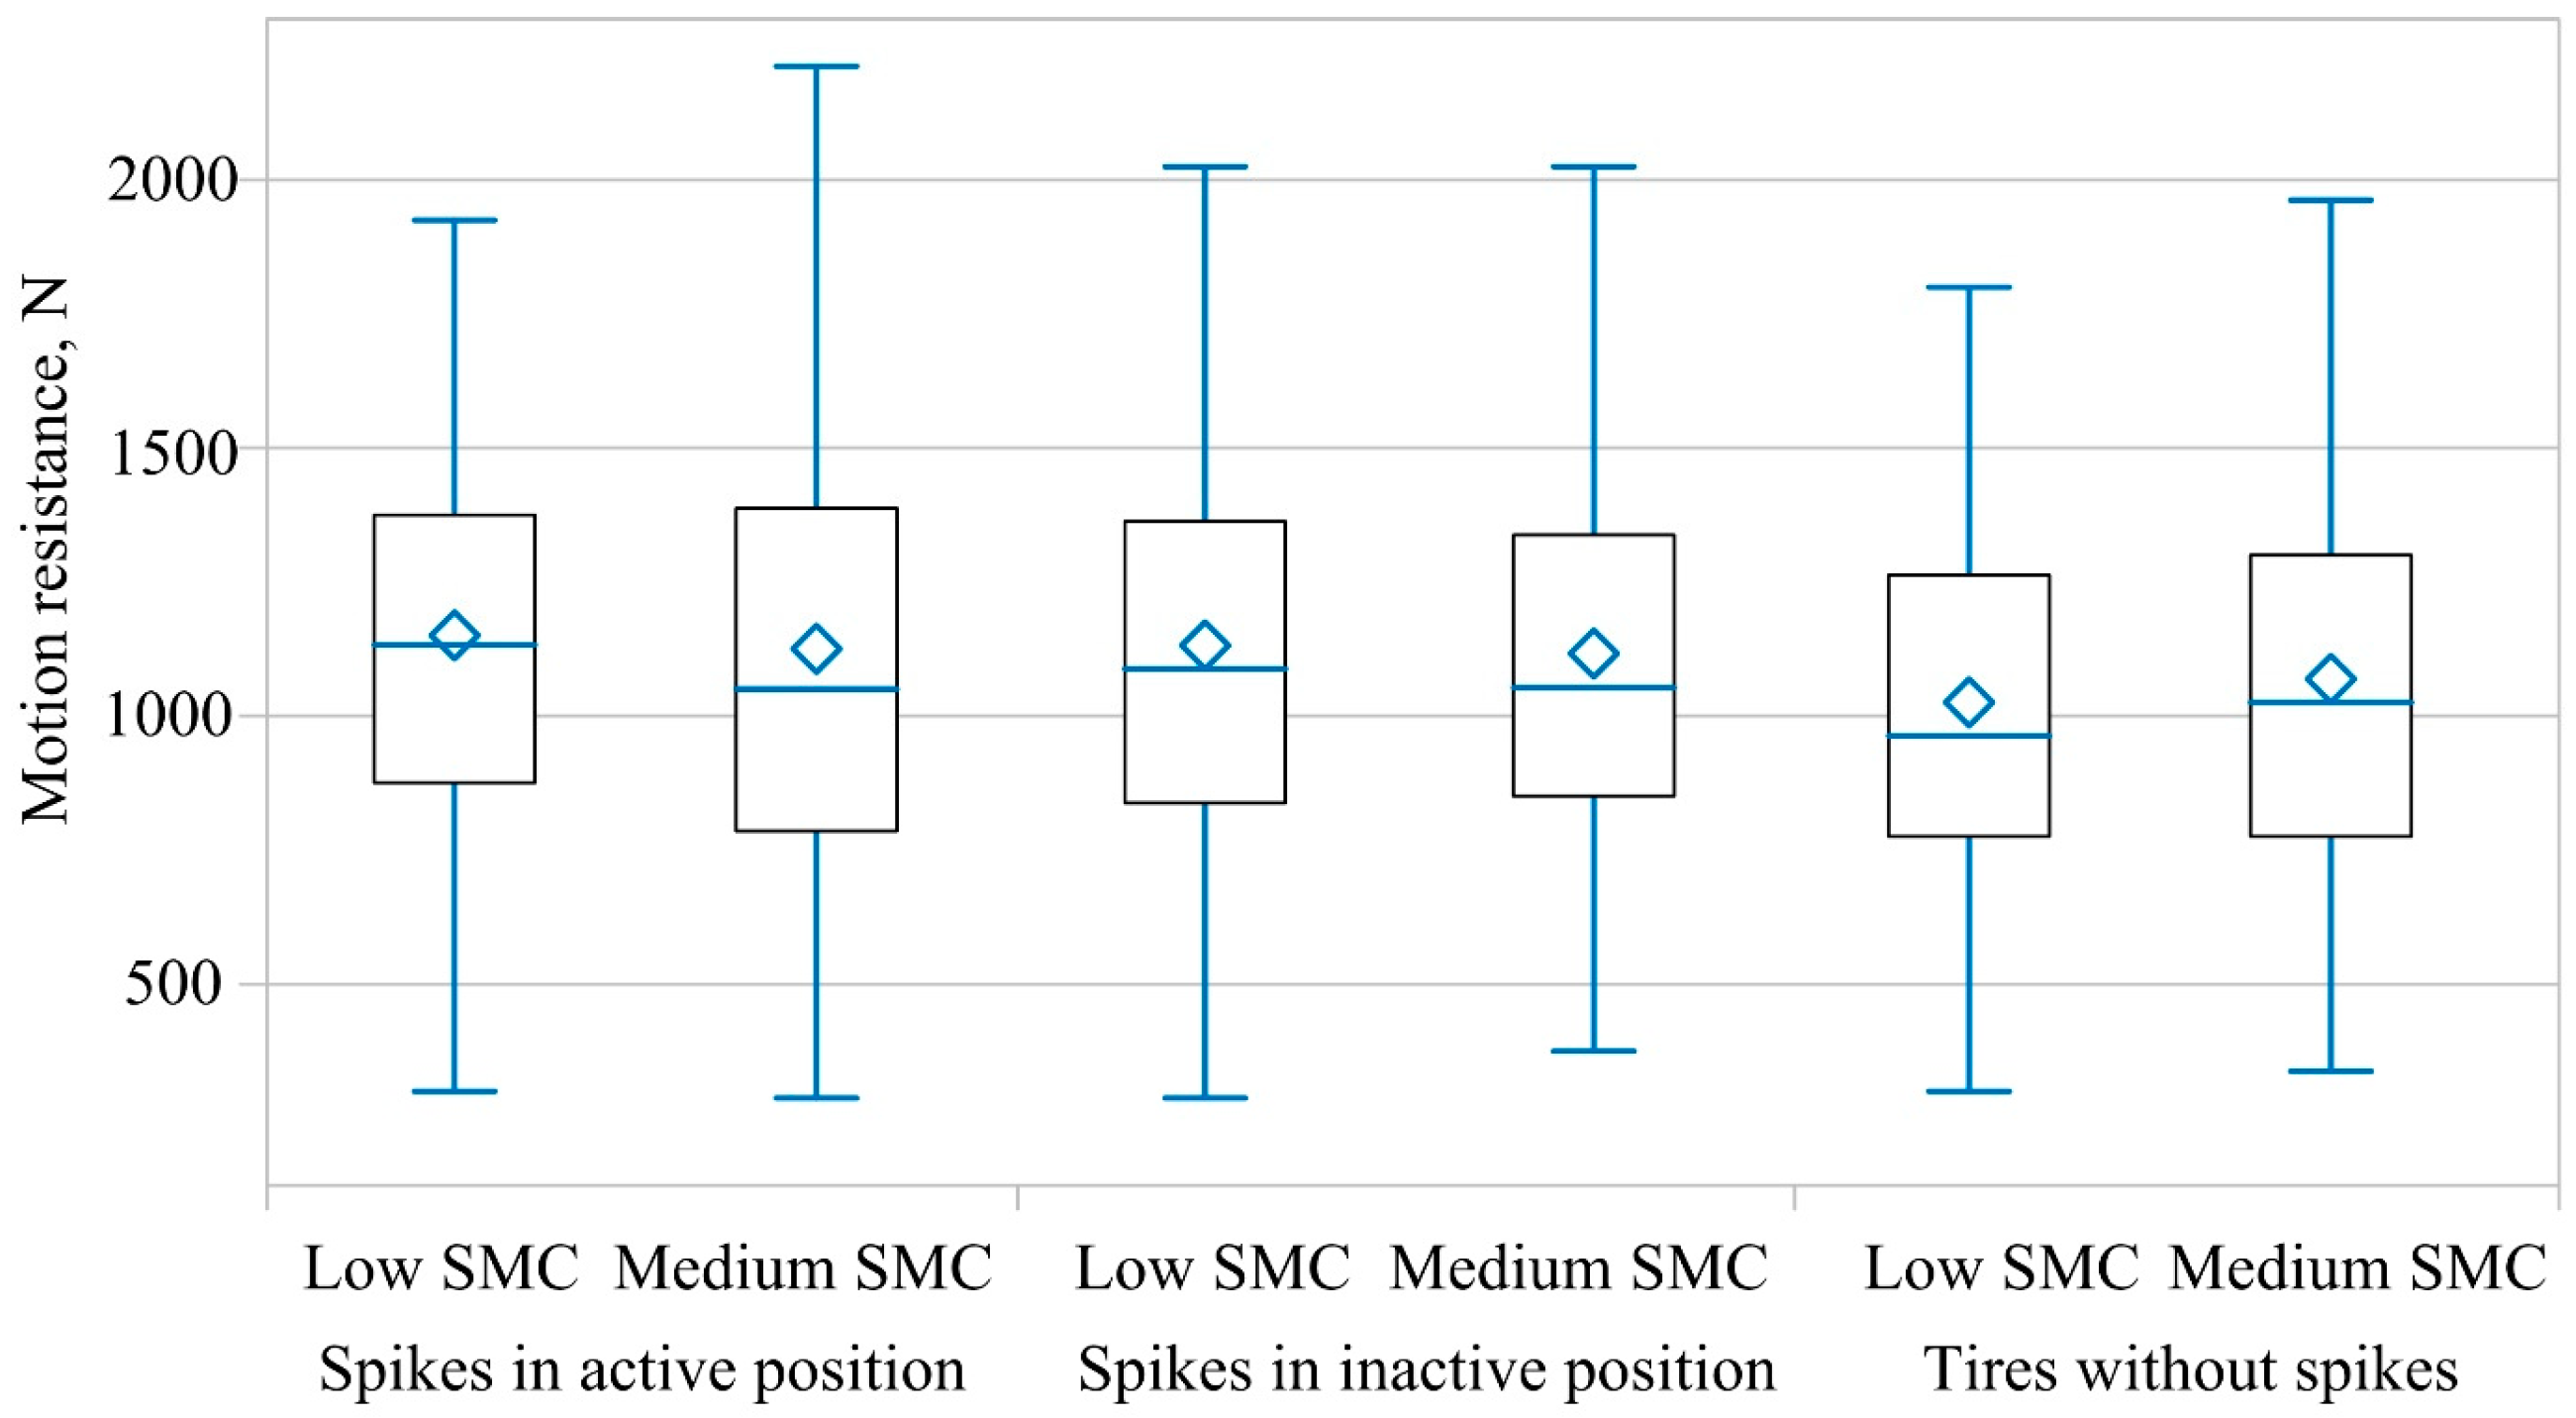
3.2. Motion Resistance
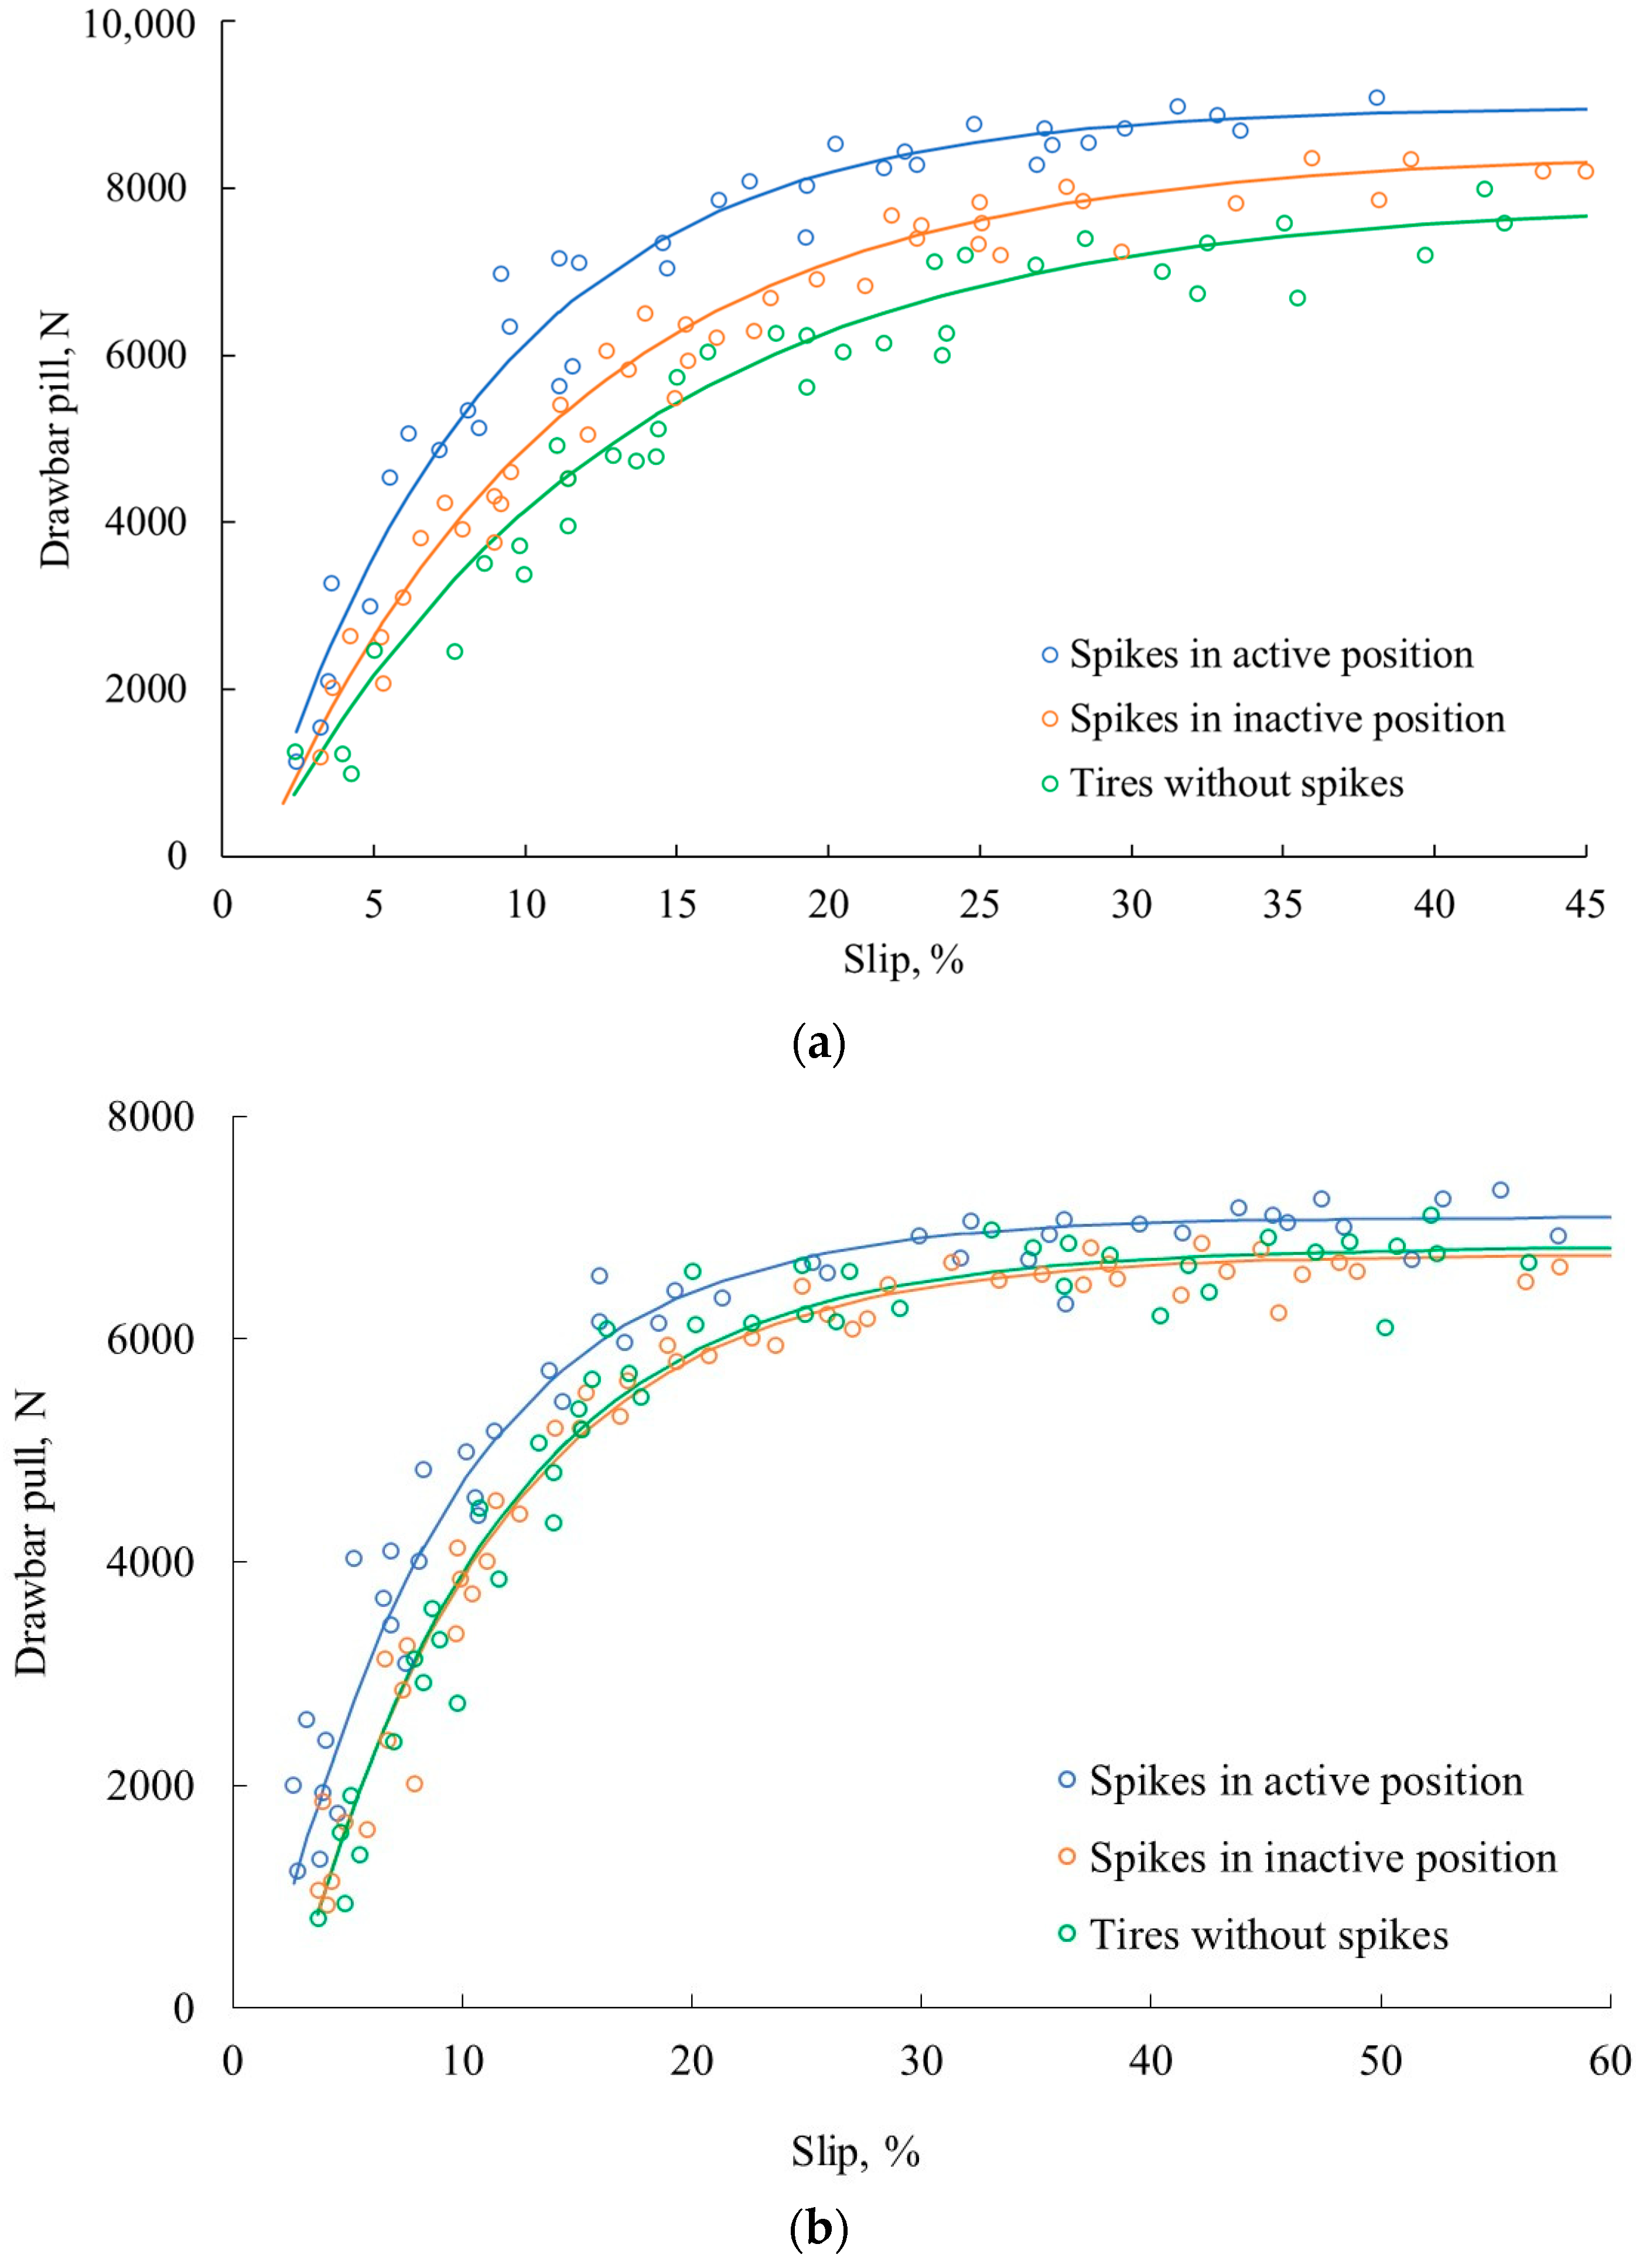
The motion resistances of the test tractor were measured for all the tested types of the front driving wheels (Figure 7). The average values were calculated based on the forces recorded during the pulling of the test tractor by the second one (load tractor). At first, extremes were removed from the data file. The variability of the experimental values was mainly caused by the test tractor’s inertia. It was caused by the low rolling resistance due to a small deformation of the compact grass plot soil. The average motion resistances/standard deviations for the soil at a low SMC were found to be 1155 N/333 N, 1127 N/361 N, and 1018 N/399 N for the spike device in the active position, inactive position, and the tires without spike segments, respectively. These values represent motion resistance ratios of 0.104, 0.101, and 0.091, respectively. In case of the medium SCM, the average motion resistances/standard deviations were 1113 N/434 N, 1105 N/330 N, and 1085 N/363 N for the spike device in the active position, inactive position, and the tires without spike segments, respectively. These values represent motion resistance ratios of 0.101, 0.099, and 0.097, respectively.
The lowest motion resistances were obtained in the case of the tires without spikes in comparison with the spikes in the active and inactive positions at both SMCs. The average motion resistance of the tire without spikes was higher at the medium SMC (1085 N) than at the low SMC (1018 N) due to higher soil deformation at the higher SMC. In the case of the spikes in the active and inactive position, the average motion resistances were lower at the medium SMC (1113 N and 1105 N) than at the low SMC (1155 N and 1127 N). The spike segments in the active and inactive position were pushed to the plastic soil at the medium SMC; therefore, the motion resistance was lower. On the other hand, the spike segments on the topsoil were strengthened by the roots of grass plants at the low SMC, which affected the tire deformation during the wheel rotation; therefore, the motion resistances were higher.
Comparing the spikes in the active and inactive position at the low and medium SMCs, the differences in the average motion resistance were relatively low, i.e., 2.4% and 0.7%, respectively. The highest differences between the spikes in the active and inactive position in comparison with the tires without spikes were 11.8% and 9.6% at the low SMC, respectively, and the lowest differences were 2.5% and 1.8% at the medium SMC, respectively. As mentioned above, the spikes in the active and inactive positions caused higher motion resistances in comparison with the tires without spikes due to the interactions between the spike segments and the tire and soil.
Ref. [36] presented motion resistance ratios of 0.115, 0.144, and 0.187 for a walking tractor with a weight of 550 kg at three levels of soil compaction. The lowest motion resistance was reached on the compacted soil, similar to the grass plot. Using a modern radial tire with a small roller resistance, a similar motion resistance of tractor weight in the case of a two-axle test tractor and single-axle walking tractor may be caused.
The results of the present study are similar to those reported in references [43,44]. The authors measured a minimum coefficient of rolling resistance of 0.1 on a hard, dry soil like the grass plot and a maximum coefficient of rolling resistance of 0.23 on a soft, plastic soil. In that study, the motion resistance depending on the rolling resistance was found to be higher on the soft plastic soil compared to the grassy surface.

3.3. Drawbar Pull

The drawbar pull of the test tractor is the dependent variable, and the wheel slip is the independent variable in the graphs characterizing the tractive properties of the test tractor in the 1st and 3rd gears with the tire with spikes in the active position, inactive position, and without spikes, as shown in Figure 8 and Figure 9.
The variation in drawbar pulls with wheel slip is due to the field nature of the experiments. The nonlinear regression coefficients and the descriptive statistics of the regression models fitting the measured data of drawbar pulls at relevant wheel slips are listed in Table 3. The coefficient of determination, R2; p-value lower than a significance level of 0.05; and root mean squared error, RMSE indicate a significant regression effect; therefore, the models fit well with the experimental data.
A similar trend in the regression models describes the tractive properties of various front-driving wheels. This occurs due to force interactions between the tire and soil in the case of all the driving wheel types. In principle, spike devices are not an independent traction system like, e.g., rigid lugged wheels [24], half-track system [45], or rubber tracks [13], but their tractive properties aid in improving the tractive performance of the tires. Therefore, the tractive performance of the spike device is based on the tire tractive performance. Similar trends of regression models for various front-driving wheels agree with the work presented in reference [46] aimed at innovative radial tire types.
The present study showed the highest values of drawbar pull in the case of the spikes in the active position. It characterizes the improvements in the tractor tractive properties. The drawbar pulls were higher at a low SMC than at a medium SMC in the case of the test tractor in the 1st and 3rd gears. A higher level of soil deformation at higher SMCs caused the effectivity of the interactions among the tire rubber lugs, steel spikes, and soil to decrease. The spikes were less supported when penetrating the soil at higher SMC. The spikes in the inactive position also showed a certain improvement in the tractor drawbar performance, but only at a low SMC. This was caused by the interaction between the spike segments in the inactive position and the soil when the tires were pushed to the soil during the experimental tests. On the other hand, the spikes in the inactive position showed similar drawbar pulls to the tires without spikes at a medium SMC. This was caused by the soil plasticity at the higher SMC. In the cases of the test tractor in both gears, the tires without spikes reached the lowest values in comparison with the spikes in the active position at both SMCs.
To compare the various types of driving wheels, the percentage differences in drawbar pulls Δ were calculated and listed in Table 4. The highest difference in drawbar pull was observed at the lowest wheel slip. The difference in drawbar pull was lower at a higher wheel slip. Generally speaking, the highest difference and highest drawbar pull indicates the best tractive properties of the test tractor, as confirmed in references [47,48]. Considering the low and medium SMCs in the present study, the spikes in the active position reached the highest differences in drawbar pull in the case of the test tractor in the 3rd gear in comparison with the 1st gear, up to a slip of about 35%. On the other hand, the drawbar pull differences were lower at higher slip values, but these differences were not significant. This was caused by the worse tractive efficiency of the spikes at higher wheel slips. The spikes riffled the soil under the driving wheels at a higher slip in comparison with the soil penetration at a lower slip. The results showed that the spikes in the active position had better tractive properties up to a slip of about 35% when the test tractor was in higher gear due to higher tractor dynamics. At slips higher than 35%, the positive influence of tractor dynamics was lower than the negative influence of the riffles under the driving wheels. The spikes in the active position reached the highest difference in drawbar pull in the range from 13.2% to 40.5% and from 16.5% to 36.8% at the wheel slip range from 55% to 5% in case of the low SMC when the test tractor was in the 3rd and 1st gears, respectively.

3.4. Tractive Efficiency

The traction performance of various driving wheels was expressed by the dependence of the tractive performance on the net traction ratio, as shown in Figure 10. At a low or medium SMC, the maximum tractive efficiency in the case of the spikes in the active position, the spikes in the inactive position, and the tires without spikes reached the values of 0.765 resp. 0.721, 0.741 resp. 0.705, and 0.736 resp. 0.70, respectively, when the test tractor was in the 1st gear; and 0.757 resp. 0.731, 0.732 resp. 0.704, and 0.723 resp. 0.708, respectively, when the test tractor was in the 3rd gear. The net traction ratios at the highest tractive efficiencies at a low or medium SMC reached the values of 0.5 resp. 0.43, 0.47 resp. 0.40, and 0.41 resp. 0.38 when the test tractor was in the 1st gear and 0.52 resp. 0.46, 0.47 resp. 0.42, and 0.42 resp. 0.40 when the test tractor was in the 3rd gear. Comparing the spikes in the active position with the tires without spikes, the increase in the tractive efficiency of 3.9% resp. 3% and 4.5% resp. 3.2% was reached by the test tractor in the 1st and 3rd gears, respectively, at low or medium SMCs. The net traction ratios at the low SMC were higher when the test tractor was in the 1st gear than when it was in the 3rd gear. On the other hand, the net traction ratios at the medium SMC were higher when the test tractor was in the 3rd gear than when it was in the 1st gear. This was caused by higher drawbar pulls when the test tractor was in the 1st gear than when it was in the 3rd gear at a low SMC, in contrast with higher drawbar pulls when the test tractor was in the 3rd gear than when it was in the 1st gear at a medium SMC (Table 4).
The authors of reference [49] studied the influence of soil moisture on tractor tractive performance. The tractive efficiency decreased from 0.754 to 0.749 with the increase in SMC (% vol) from the low level (25–30%) to the medium level (35–40%). These results showed a difference in tractive efficiency that was similar to the present study considering the tires without spikes. In the case of the tires with spikes in the active position, the higher difference was caused by the better traction performance of the steel spikes on the soil at a low SMC. Reference [50] demonstrated that tractor tractive efficiency was significantly increased by about 12% as the tractor mode changed from 2WD to 4WD. The special spike device with the worm gear unit allowed us to increase the tractor’s tractive efficiency in the 4WD mode. The actual study can be discussed based on the experiments performed in reference [16]. The methods were aimed at improving the tractive efficiency of the radial tire with various tire inflation pressures and axle loads. The authors presented a maximum tractive efficiency of 0.78 for the radial tire. When the inflation pressure was reduced, the tractive efficiency increased by 3%. The average tractive efficiency values increased by about 6% with an increase of 86% in the dynamic axle load. These values are comparable with the increase in tractive efficiency due to the spikes in the active position when the special spike device with the worm gear unit was tested under field conditions.
The highest values of tractive efficiencies and net traction ratios demonstrated the improved traction performance of the test tractor with spikes in the active position in comparison with the tires without spikes.

4. Conclusions

Currently, wheeled agricultural tractors are an irreplaceable power source for agricultural production. The device with steel spikes presented in this paper in the tire-tread pattern significantly improved the practical operation of the tractor. The actual design of the device is controlled and fixed by the worm gear unit for easy control using an electric motor, symmetrically loading the tire-tread pattern. It uses reduced dimensions of the spike segments and improved shapes of the spikes.
Based on the experimental field tests, the spike device in the active position with the radial tire improved the tractor traction performance in comparison with the tires without spikes. A better traction performance was also observed at a medium SMC when the self-cleaning properties of the tires with the spike devices were worse. At a low SMC, the soil better supported the spikes, but, on the other hand, it caused an increase in motion resistance.
Comparing the maximum drawbar pulls, tractive efficiencies, and net traction ratios at the maximum tractive efficiency of the test tractor with the spikes in the active position and with the tires without spikes, a higher traction performance of the test tractor was obtained at a low SMC than at a medium SMC. The motion dynamics of the test tractor in the 3rd gear moving at a higher velocity than the test tractor in the 1st gear may cause the spikes to better interact with the soil due to the elimination of riffles in the soil made by the rotating steel spikes.
The increase in drawbar pull and tractive efficiency due to the wheel slip reduction demonstrated the improvement in the traction performance of the test tractor with the spikes in the active position. Tractors equipped with spike devices can be used for transport on roads with spikes in the base position and can operate on soil more effectively with spikes in the active position. Based on the above, the spike device with the worm gear unit can be an alternative to other traction aids to improve tractor traction performance without increasing the tractor weight to improve its operation economy and to protect the environment.

Author Contributions

Conceptualization, R.A. and R.M.; methodology, R.A., R.M. and R.D.; software, R.D. and E.M.; validation, Z.T. and K.K.; formal analysis, K.K.; investigation, R.M. and Z.T.; resources, R.M. and S.M.; data curation, S.M., E.M. and R.A.; writing—original draft preparation, R.M.; writing—review and editing, R.A. and K.K.; visualization, R.M.; supervision, R.M.; project administration, K.K. and R.M. All authors have read and agreed to the published version of the manuscript.

Funding

This research received no external funding.

Institutional Review Board Statement

Not applicable.

Data Availability Statement

The data presented in this study are available on request from the corresponding author.

Conflicts of Interest

The authors declare no conflicts of interest.

References

  1. Botta, G.F.; Jorajuria, D.; Draghi, L.M. Influence of the axle load, tyre size and configuration on the compaction of a freshly tilled clayey soil. J. Terramech. 2002, 39, 47–54. [Google Scholar] [CrossRef]
  2. Regazzi, N.; Maraldi, M.; Molari, G. A theoretical study of the parameters affecting the power delivery efficiency of an agricultural tractor. Biosyst. Eng. 2019, 186, 214–227. [Google Scholar] [CrossRef]
  3. Sahay, C.S.; Tewari, V.K. Computer simulation of tractor single-point drawbar performance. Biosyst. Eng. 2004, 88, 419–428. [Google Scholar] [CrossRef]
  4. Botta, G.F.; Tolon-Becerra, A.; Tourn, M.; Lastra-Bravo, X.; Rivero, D. Agricultural traffic: Motion resistance and soil compaction in relation to tractor design and different soil conditions. Soil Tillage Res. 2012, 120, 92–98. [Google Scholar] [CrossRef]
  5. Taghavifar, H.; Mardani, A. Net traction of a driven wheel as affected by slippage, velocity and wheel load. J. Saudi Soc. Agric. Sci. 2015, 14, 167–171. [Google Scholar] [CrossRef]
  6. Damanauskas, V.; Janulevicius, A.; Pupinis, G. Influence of extra weight and tyre pressure on fuel consumption at normal tractor slippage. J. Agric. Sci. 2015, 7, 55–67. [Google Scholar] [CrossRef]
  7. Sharma, A.K.; Pandey, K.P. Matching tyre size to weight, speed and power available for maximising pulling ability of agricultural tractors. J. Terramech. 2001, 38, 89–97. [Google Scholar] [CrossRef]
  8. Malý, V.; Tóth, F.; Mareček, J.; Krčálová, E. Laboratory test of the soil compaction. Acta Univ. Agric. Silv. Mendel. Brun. 2015, 63, 77–85. [Google Scholar] [CrossRef]
  9. Damanauskas, V.; Janulevicius, A. Differences in tractor performance parameters between single-wheel 4WD and dual-wheel 2WD driving systems. J. Terramech. 2015, 60, 63–73. [Google Scholar] [CrossRef]
  10. Moinfar, A.; Shahgholi, G.; Gilandeh, Y.A.; Gundoshmian, T.M. The effect of the tractor driving system on its performance and fuel consumption. Energy 2020, 202, 117803. [Google Scholar] [CrossRef]
  11. Shafaei, S.M.; Loghavi, M.; Kamgar, S. Analytical description of power delivery efficiency of front wheel assist tractor in tillage works. J. Biosyst. Eng. 2021, 46, 236–253. [Google Scholar] [CrossRef]
  12. Semetko, J.; Janoško, I.; Pernis, P. Determination of power of multidrive vehicles. Acta Technol. Agric. 2004, 7, 20–23. [Google Scholar]
  13. Molari, G.; Bellentani, L.; Guarnieri, A.; Walker, M.; Sedoni, E. Performance of an agricultural tractor fitted with rubber tracks. Biosyst. Eng. 2012, 111, 57–63. [Google Scholar] [CrossRef]
  14. Arvidsson, J.; Westlin, H.; Keller, T.; Gilbertsson, M. Rubber track systems for conventional tractors effects on soil compaction and traction. Soil Tillage Res. 2011, 117, 103–109. [Google Scholar] [CrossRef]
  15. Zoz, F.M.; Turner, R.J.; Shell, L.R. Power delivery efficiency: A valid measure of belt and tire tractor performance. Trans. ASAE 2002, 45, 509–518. [Google Scholar]
  16. Ekinci, S.; Çarman, K.; Kahramanlı, H. Investigation and modeling of the tractive performance of radial tires using off-road vehicles. Energy 2015, 93, 1953–1963. [Google Scholar] [CrossRef]
  17. Battiato, A.; Diserens, E. Influence of tyre inflation pressure and wheel load on the traction performance of a 65 kW MFWD tractor on a cohesive soil. J. Agric. Sci. 2013, 5, 197–215. [Google Scholar] [CrossRef]
  18. Čipliené, A.; Gurevičius, P.; Janulevičius, A.; Damanauskas, V. Experimental validation of tyre inflation pressure model to reduce fuel consumption during soil tillage. Biosyst. Eng. 2019, 186, 45–59. [Google Scholar] [CrossRef]
  19. Šmerda, T.; Čupera, J. Tire inflation and its influence on drawbar characteristics and performance-energetic indicators of a tractor set. J. Terramech. 2010, 47, 395–400. [Google Scholar] [CrossRef]
  20. Helexa, M. Monitoring the impact of tyre inflation pressure on tensile properties of forest tractor. Res. Agr. Eng. 2014, 60, 127–133. [Google Scholar] [CrossRef]
  21. Cutini, M.; Costa, C.; Brambilla, M.; Bisaglia, C. Relationship between the 3D footprint of an agricultural tire and drawbar pull using an artificial neural network. Appl. Eng. Agric. 2022, 38, 293–301. [Google Scholar] [CrossRef]
  22. Kučera, M.; Helexa, M.; Molenda, M. Selected tire characteristics and their relation to its radial stiffness. MM Sci. J. 2016, 9, 1524–1530. [Google Scholar] [CrossRef]
  23. Raheman, H.; Snigdharani, E. Development of a variable-diameter cage wheel for walking tractor and its performance evaluation in soil bin (simulating wetland). J. Inst. Eng. Ser. A 2020, 101, 41–48. [Google Scholar] [CrossRef]
  24. Md-Tahir, H.; Zhang, J.; Xia, J.; Zhang, C.; Zhou, H.; Zhu, Y. Rigid lugged wheel for conventional agricultural wheeled tractors—Optimising traction performance and wheel–soil interaction in field operations. Biosyst. Eng. 2019, 188, 14–23. [Google Scholar] [CrossRef]
  25. Yang, Y.; Sun, Y.; Ma, S. Drawbar pull of a wheel with an actively actuated lug on sandy terrain. J. Terramech. 2014, 56, 17–24. [Google Scholar] [CrossRef]
  26. Abrahám, R.; Majdan, R.; Kollárová, K.; Tkáč, Z.; Hajdu, Š.; Kubík, Ľ.; Masarovičová, S. Fatigue analysis of spike segment of special tractor wheels in terms of design improvement for chernozem soil. Agriculture 2022, 12, 471. [Google Scholar] [CrossRef]
  27. Abrahám, R.; Majdan, R.; Kollárová, K.; Tkáč, Z.; Olejár, M.; Matejková, E.; Kubík, Ľ. Frequency spectra analysis of drawbar pulls generated by special driving wheels improving tractive performance. Sensors 2021, 21, 2903. [Google Scholar] [CrossRef] [PubMed]
  28. Moinfar, A.M.; Shahgholi, G. Dimensional analysis of the tractor tractive efficiency parameters. Acta Technol. Agric. 2018, 21, 94–99. [Google Scholar] [CrossRef]
  29. Moinfar, A.; Shahgholi, G. The effect of tractor driving system type on its slip and rolling resistance and its modelling using ANFIS. Acta Technol. Agric. 2019, 22, 115–121. [Google Scholar] [CrossRef]
  30. Terek, M.; Tibenský, M. Outliers and some non-traditional measures of location in analysis of wages. Eur. Sci. J. 2014, 1, 480–486. [Google Scholar]
  31. Shi, Y.; Liu, J.; Huang, D.; Xu, M.; Zhai, S.; Zhang, W.; Jiang, P. Prediction and experimental study of tire slip rate based on chassis sinkage amount. Agriculture 2023, 13, 665. [Google Scholar] [CrossRef]
  32. Fanigliulo, R.; Biocca, M.; Grilli, R.; Fornaciari, L.; Gallo, P.; Benigni, S.; Mattei, P.; Pochi, D. Assessment of the performance of agricultural tires using a mobile test bench. Agriculture 2023, 13, 87. [Google Scholar] [CrossRef]
  33. Shafaei, S.M.; Loghavi, M.; Kamgar, S. An experimental investigation of drawbar pull performance of front wheel assist tractors. Trans. Indian Natl. Acad. Eng. 2022, 7, 1369–1380. [Google Scholar] [CrossRef]
  34. Xue, L.; Xie, B.; Lin, F.; Cheng, S.; Li, L.; Liu, M.; Li, J. Field traction performance test analysis of bionic paddy wheel and vaned wheel. Biomimetics 2022, 7, 185. [Google Scholar] [CrossRef]
  35. Yang, F.; Sun, W.; Lin, G.; Zhang, W. Prediction of military vehicle’s drawbar pull based on an improved relevance vector machine and real vehicle tests. Sensors 2016, 16, 351. [Google Scholar] [CrossRef] [PubMed]
  36. Rasool, S.; Raheman, H. Improving the tractive performance of walking tractors using rubber tracks. Biosyst. Eng. 2018, 167, 51–62. [Google Scholar] [CrossRef]
  37. Nakanishi, R.; Nakashima, H.; Miyasaka, J.; Ohdoi, K. Tractive performance analysis of a lugged wheel by open-source 3D DEM software. J. Terramech. 2020, 92, 51–65. [Google Scholar] [CrossRef]
  38. Hendriadi, A.; Salokhe, V.M. Improvement of a power tiller cage wheel for use in swampy peat soils. J. Terramech. 2002, 39, 55–70. [Google Scholar] [CrossRef]
  39. Watyotha, C.; Salokhe, V.M. PM—Power and machinery: Tractive performance of cage wheels with opposing circumferential lugs. J. Agric. Eng. Res. 2001, 79, 389–398. [Google Scholar] [CrossRef]
  40. Wilson, C.A.; Kushwaha, R.L.; Mehta, A.V. Performance of dyna-bite traction system. SAE Trans. J. Commer. Veh. 1993, 102, 265–271. [Google Scholar]
  41. Abrahám, R.; Majdan, R.; Drlička, R. Special tractor driving wheels with two modification of spikes inclination angle. Agron. Res. 2019, 17, 333–342. [Google Scholar] [CrossRef]
  42. Majdan, R.; Abrahám, R.; Tkáč, Z.; Mojžiš, M. Drawbar parameters of tractor with prototypes of driving wheels and standard tyres. Acta Technol. Agric. 2018, 21, 63–68. [Google Scholar] [CrossRef]
  43. Ferdous, J.; Soni, P.; Keen, A.; Gholkar, M.D. Performance evaluation of a small agricultural tractor on Bangkok clay soil. In Paper No. CSBE13-124, Proceedings of the CSBE/SCGAB 2013 Annual Conference, Montreal, QC, USA, 7–10 July 2013; University of Saskatchewan: Saskatoon, SK, Canada, 2013. [Google Scholar]
  44. Ferdous, J.; Soni, P.; Gholkar, M.D.; Keen, A. The rolling resistance and tractive performance of a small agricultural tractor with different surface and moisture conditions on Bangkok clay soil. In Proceedings of the 18th International Conference of the ISTVS 2014, Seoul, Republic of Korea, 22–25 September 2014. [Google Scholar]
  45. Rabbani, M.A.; Tsujimoto, T.; Mitsuoka, M.; Inoue, E.; Okayasu, T. Prediction of the vibration characteristics of half-track tractor considering a three-dimensional dynamic model. Biosyst. Eng. 2011, 110, 178–188. [Google Scholar] [CrossRef]
  46. Mattetti, M.; Varani, M.; Maraldi, M.; Paolini, F.; Fiorati, S.; Molari, G. Tractive performance of Trelleborg PneuTrac tyres. J. Agric. Eng. 2020, 51, 100–106. [Google Scholar] [CrossRef]
  47. Battiato, A.; Diserens, E.; Sartori, L. Traction performance simulation for mechanical front wheel drive tractors: Towards a practical computer tool. J. Agric. Eng. 2013, 44, 338–343. [Google Scholar] [CrossRef]
  48. Balsari, P.; Biglia, A.; Comba, L.; Sacco, D.; Alcatrão, L.E.; Varani, M.; Mattetti, M.; Barge, P.; Tortia, C.; Manzone, M.; et al. Performance analysis of a tractor—Power harrow system under different working conditions. Biosyst. Eng. 2021, 202, 28–41. [Google Scholar] [CrossRef]
  49. Kim, W.-S.; Kim, Y.-J.; Park, S.-U.; Kim, Y.-S. Influence of soil moisture content on the traction performance of a 78-kW agricultural tractor during plow tillage. Soil Tillage Res. 2021, 207, 104851. [Google Scholar] [CrossRef]
  50. Shafaei, S.M.; Loghavi, M.; Kamgar, S. An extensive validation of computer simulation frameworks for neural prognostication of tractor tractive efficiency. Comput. Electron. Agric. 2018, 155, 283–297. [Google Scholar] [CrossRef]
Figure 1. Design of the spike device with worm gear unit. (a) Active position of the spikes, (b) inactive (base) position of the spikes, (c) fastening of the spike device to the wheel disc, (d) worm gear unit and carrier slide outside along the central shaft. 1—Spike segment with long arm, 2—control steel wire rope, 3—carry steel wire rope, 4—spike segment with short arm, 5—double ball pivot, 6—carrier with four steel rods, 7—spring, 8—central shaft with key, 9—groove in steel carrier rod, 10—spike, 11—tractor tire, 12—wheel disc, 13—worm gear unit, 14—support rod, 15—pivots.
Agriculture 14 00545 g001
Figure 2. Grooves in tire and spike segments. (a) Alternating grooves in the left and rights rubber lugs, (b) spike segment in the inactive position, (c) spike segment in the active position, (d) spike segment with the short arm, (e) spike segment with the long arm, double ball pivot and detail of the V-shaped spike.
Agriculture 14 00545 g002
Figure 3. Principle of the spike device with a worm gear unit. (a) Inactive (base) position, (b) change from the inactive to the active position (the first phase), (c) comparison of carrier steel rod angles, (d) active position, (e) change from the active to the inactive position (first phase), (f) cross-section of the tractor tire with the spike device. 1—Spike segment with the long arm, 2—control steel wire rope, 3—carry steel rope, 4—spike segment with the short arm, 5—double ball pivot, 6—carrier with four steel carrier rods, 7—spring, 8—central shaft, 9—groove in the steel carrier rod, 10—spike, 11—tractor tire, 12—wheel disc.
Agriculture 14 00545 g003
Figure 4. The weight measurement of the test tractor with the spike device without spike segments and steel wire ropes.
Agriculture 14 00545 g004
Figure 5. Measurement system. 1—Test tractor with the spike device, 2—load tractor, 3—steel chain, 4—front driving wheels of the experimental tractor, 5—load cell, 6—proximity sensor for actual speed measurement, 7—proximity sensor for theoretical speed measurement, 8—fifth wheel, 9—ballast weight for the fifth wheel, 10—sensor of the engine revolution counter, B—batteries, ES—electronic system, HMG—data logger, RC—pevolution counter.
Agriculture 14 00545 g005
Figure 6. Verification of drawbar pull measurement system: (a) experimental setup, (b) experimental and theoretical forces. 1—Load cell, 2—test weights, HMG—data logger.
Agriculture 14 00545 g006
Figure 7. Motion resistances of the test tractor with various driving wheels.
Agriculture 14 00545 g007
Figure 8. Drawbar pull vs slip for the test tractor in the 1st gear. (a) Low SMC, (b) medium SMC.
Agriculture 14 00545 g008
Figure 9. Drawbar pull vs slip for the test tractor in the 3rd gear. (a) Low SMC, (b) medium SMC.
Agriculture 14 00545 g009
Figure 10. Tractive efficiency vs net traction ratio. (a) Low SMC, (b) medium SMC.
Agriculture 14 00545 g010
Table 1. Comparison of theoretical and experimental forces generated by the load cell.
Test Weight, kgTheoretical Force, NExperimental Force, NDifference, %
201961960.20
41402403−0.23
555405380.38
63618618−0.02
73.5721722−0.11
828048020.25
94.5927927−0.02
104.5102510210.38
11911671169−0.15
126123612320.29
233228622750.48
Table 2. Physical properties of the soil.
ParameterUnitValue
Gravel%15.3
Sand%45.2
Silt%35.4
Clay%4.1
Plastic limit%24.6
Liquid limit%51.3
Frictional angle°47.5
CohesionkPa8.4
Particle densityg m−32.6
Table 3. Nonlinear regression coefficients and descriptive statistics of regression models.
GearSMCDriving Wheel TypeC1C2R2p-ValueRMSE
1stLowSpikes in active position0.8711.810.967<0.0001429
Spikes in inactive position0.799.880.973408
Tires without spikes0.739.210.948494
MediumSpikes in active position0.6311.680.957401
Spikes in inactive position0.5911.090.965364
Tires without spikes0.6110.180.944448
3rdLowSpikes in active position0.8112.810.962448
Spikes in inactive position0.769.880.972347
Tires without spikes0.718.510.958419
MediumSpikes in active position0.6412.680.958393
Spikes in inactive position0.6111.250.970325
Tires without spikes0.6211.380.961372
Table 4. Comparison of various front-driving wheel types based on drawbar pull.
GearSMCParameter/Specifications, %
51525354555
1stLowDP, N/Spikes in active position398779069110948095949629
/Tires without spikes251758707207773979528036
Δ, %/Difference36.825.720.818.417.116.5
MediumDP, N/Spikes in active position240055966591690069967026
/Tires without spikes166348846048646966216679
Δ, %/Difference30.712.77.56.25.34.9
3rdLowDP, N/Spikes in active position355974748561886389478970
/Tires without spikes211954126820742176797789
Δ, %/Difference40.527.520.316.214.213.2
MediumDP, N/Spikes in active position249159336800702070767090
/Tires without spikes162351536284664767636799
Δ, %/Difference34.813.27.65.34.44.1
Disclaimer/Publisher’s Note: The statements, opinions and data contained in all publications are solely those of the individual author(s) and contributor(s) and not of MDPI and/or the editor(s). MDPI and/or the editor(s) disclaim responsibility for any injury to people or property resulting from any ideas, methods, instructions or products referred to in the content.

