Article

Development of a Modified Method for Measuring the Actual Draft Force Using a Tractor-Attached Dynamometer

1
TYM Co., Ltd., Seoul 06053, Republic of Korea
2
Specialized Machinery and Robotics Group, Korea Institute of Industrial Technology, Gimje 54325, Republic of Korea
3
Department of Industrial Machinery DX, Korea Institute of Machinery and Materials, Daejeon 34103, Republic of Korea
4
Department of Convergence Biosystems Engineering, Chonnam National University, Gwangju 61186, Republic of Korea
5
BK21 Interdisciplinary Program in IT-Bio Convergence System, Chonnam National University, Gwangju 61186, Republic of Korea
6
Department of Bio-Industrial Machinery Engineering, Kyungpook National University, Daegu 41566, Republic of Korea
7
Smart Agri Innovation Center, Kyungpook National University, Daegu 41566, Republic of Korea
8
Upland Field Machinery Research Center, Kyungpook National University, Daegu 41566, Republic of Korea
*
Authors to whom correspondence should be addressed.
Agriculture 2024, 14(4), 544; https://doi.org/10.3390/agriculture14040544
Submission received: 25 October 2023 / Revised: 15 March 2024 / Accepted: 25 March 2024 / Published: 29 March 2024
(This article belongs to the Special Issue Soil Mechanical Systems and Related Farming Machinery)

Abstract

:
In this study, crank-locker kinematic equations were used to analyze the three-point hitch behavior when the dynamometer was connected to the work machine. The dynamometer was statically tested with a hydraulic actuator, and the accuracy of the three-way force and the moment was confirmed to be 96–99%. The calibrated dynamometer was put to the test on a real farm field, and data were collected using a data acquisition system. Using the transport pitch correction equation, the collected data can be transformed into more realistic data. International standards were used to determine the point of connection between the tractor, dynamometer, and implement. The results of this study made it possible to accurately measure force and moment, which will have an important role in future agricultural technologies such as autonomous agricultural operation.

1. Introduction

Modern agriculture is highly specialized and mechanized, and the agricultural workforce is decreasing as rural populations decline and age. As a result, the use of a tractor that can be equipped with a variety of agricultural implements to increase the labor force is becoming more common [1].
The tractor generates forces in various directions during operation. The generated force affects operation performance, the life of the implement, and tractor parts [2]. The tractor interacts with the soil during operation, and the force is changed by various variables, such as the soil properties and the tractor’s shift level.
The traction force generated by the tractor can be estimated from the Wismer–Luth, Brixius equations, etc., which are registered in the ASABE test specification [3,4]. However, since these estimation methods are empirical formulas rather than theory-based methods, the prediction result cannot be considered accurate. Furthermore, because variables such as the soil cone index (CI) cannot be used in real-time formulas, predicting the traction force in real time is inaccurate. As a result, measuring the force with a sensor such as a load cell or strain gage yields the most accurate traction results. To address these issues, dynamometers with sensors have recently been developed to measure the force generated during operation [4].
An adjustable three-point hitch dynamometer with a draft capacity of 50 kN to measure forces on the tractor and mounted implements were developed [5]. With this dynamometer, it was confirmed that all mounted tillage implements in categories II and III such as plows, cultivators, and harrows could be tested [6]. And a bi-axial direct-mount strain gage lower link system calibrated for coincident and perpendicular loads up to 10 kN for measuring tractor–implement forces were developed [7]. The strain gage test method was confirmed to be the most appropriate when medium-type equipment is used with a tractor. However, because all of the tests were conducted in a lab, field validation is required.
A mathematical model was developed to determine the forces and the moments at the different couplers between bodies of the tractor–dynamometer–implement system, taking into account the mechanical characteristics of the dynamometer as well as the inclination of the terrain on which the tractor is working [8]. This model allows you to evaluate the dynamometer’s destructive effect on the forces acting on the tractor. However, the effect of the connection between the dynamometer and the power take-off (PTO) was not considered. To measure traction forces, a dynamometer made up of three telescopic beams connected to a central T-shaped box was developed [9]. A three-point hitch-attached dynamometer basic conceptual diagram was presented. Different strain gage sets can be attached and arranged in the bridge to measure only lateral or vertical forces. However, because it was developed for use in a specific region, the use of the device presented is bound to be limited. Additionally, there is a lack of evidence that the measured force was exact using dynamometer.
A six-component load cell was developed to measure the tractor’s traction force, and the accuracy of the load measurement using a six-component load cell was validated using a static load test [10]. In addition, a field test was conducted by installing the developed six-component load cell on the multi-tasking agricultural implement and measuring the working load. A method was presented for acquiring and post-processing traction force data while performing tillage operations using a three-point hitch [11]. The developed system is capable of running a large number of carried and partially carried machines in the II and III categories. In two past studies, a research was conducted to measure forces and moments using a hitch dynamometer, but it cannot be considered that accurate forces and moments were analyzed because changes in size and angle due to installation of the dynamometer were not considered.
Many research cases support the use of a three-point hitch dynamometer to measure the force applied to a three-point hitch during agricultural work confirmed [12,13]. To increase the precision of force measurement, the three-point hitch dynamometer primarily employs a six-component load cell. However, there are only a few cases where the geometrical change caused by the installation of the dynamometer is considered. Furthermore, no research has been conducted on how to correct the actual data that change depending on the angle of the dynamometer.
In this study, a modified method was presented to increase the accuracy of traction force prediction for tractors equipped with dynamometers. Using the existing equations, a modified equation considering the geometry of the dynamometer was developed. The equation’s accuracy has been demonstrated through static load tests and a field test. By correcting the error of the measurement data that may occur due to the installation of the dynamometer, a modified method that can obtain data close to the actual is presented.
Securing realistic traction force data enables accurate measurement of the traction force. And it will enable the development of algorithms for performing autonomous agricultural operation through accurate traction measurement.

2. Materials and Methods

2.1. Three-Point Hitch

As shown in Figure 1, the three-point hitch is the most representative method used to connect the tractor and various implements [14]. The three-point hitch consists of two lower links and one upper link, and there are other devices to drive these links. The lift arm rotates by hydraulic power and is connected to the lift rod. The lift rod is connected to the lower link to pull up the lower link. The upper link moves dependently as the lower link moves up and down. The upper link is adjustable in length, and the upper and lower links each have a link point attached to the tractor and a hitch point attached to the implement. ISO 730 [15] defines mast height as the height of the triangle formed by the three hitch points.
When the three-point hitch ascends and descends, a height element with the ground and transport pitch of the implement occur. The transport pitch is defined as the angle between the working machine and the virtual vertical line. Transport pitch is determined by the range of use of the implement, which has a significant impact on load and traction. The transport pitch is measured when the minimum transport height is reached. The transport height is the vertical distance from the ground to the lower hitch point when the three-point hitch is ascended. The lower hitch point height is the vertical distance between the ground and the lower hitch point when the hitch descends. The movement range is actually the vertical displacement of the three-point hitch and is the transport height minus the lower hitch point height [16,17,18,19]. Transport pitch, transport height, lower hitch point height, and mast height are all specified by the ISO 730.

2.2. Three-Point Hitch-Type Dynamometer

2.2.1. Specification of Load Cell and DAQ

The dynamometer used in this study is a combination of triangular frame and one-axis load cell. The triangular shape was chosen for this study because it is known to be more structurally stable and easy to design. Because each link of the three-point hitch is connected one to one, the triangular geometry is relatively stable in terms of dynamics.
Single-axis load cells (CAS, SBA-2) are installed in 6 locations. Three load cells mounted in the tractor driving direction measure only the traction force. Two load cells mounted on the slope of a triangle measure longitudinal and vertical forces. Load cells mounted in the horizontal direction measure only longitudinal forces. The specifications of the load cell used in this study are shown in Table 1.
Six load cells connected to the dynamometer are connected to the data acquisition system (DAQ) with a Wheatstone bridge. The data from each measured load cell are independently output and finally converted into target elements via equations. Output data are transferred to a PC via Ethernet and stored. The specifications of DAQ used for data acquisition are shown in Table 2. Each load cell is connected to the switch box by a connector and then from the switch box to the DAQ.

2.2.2. Dynamometer Component Force and Moment

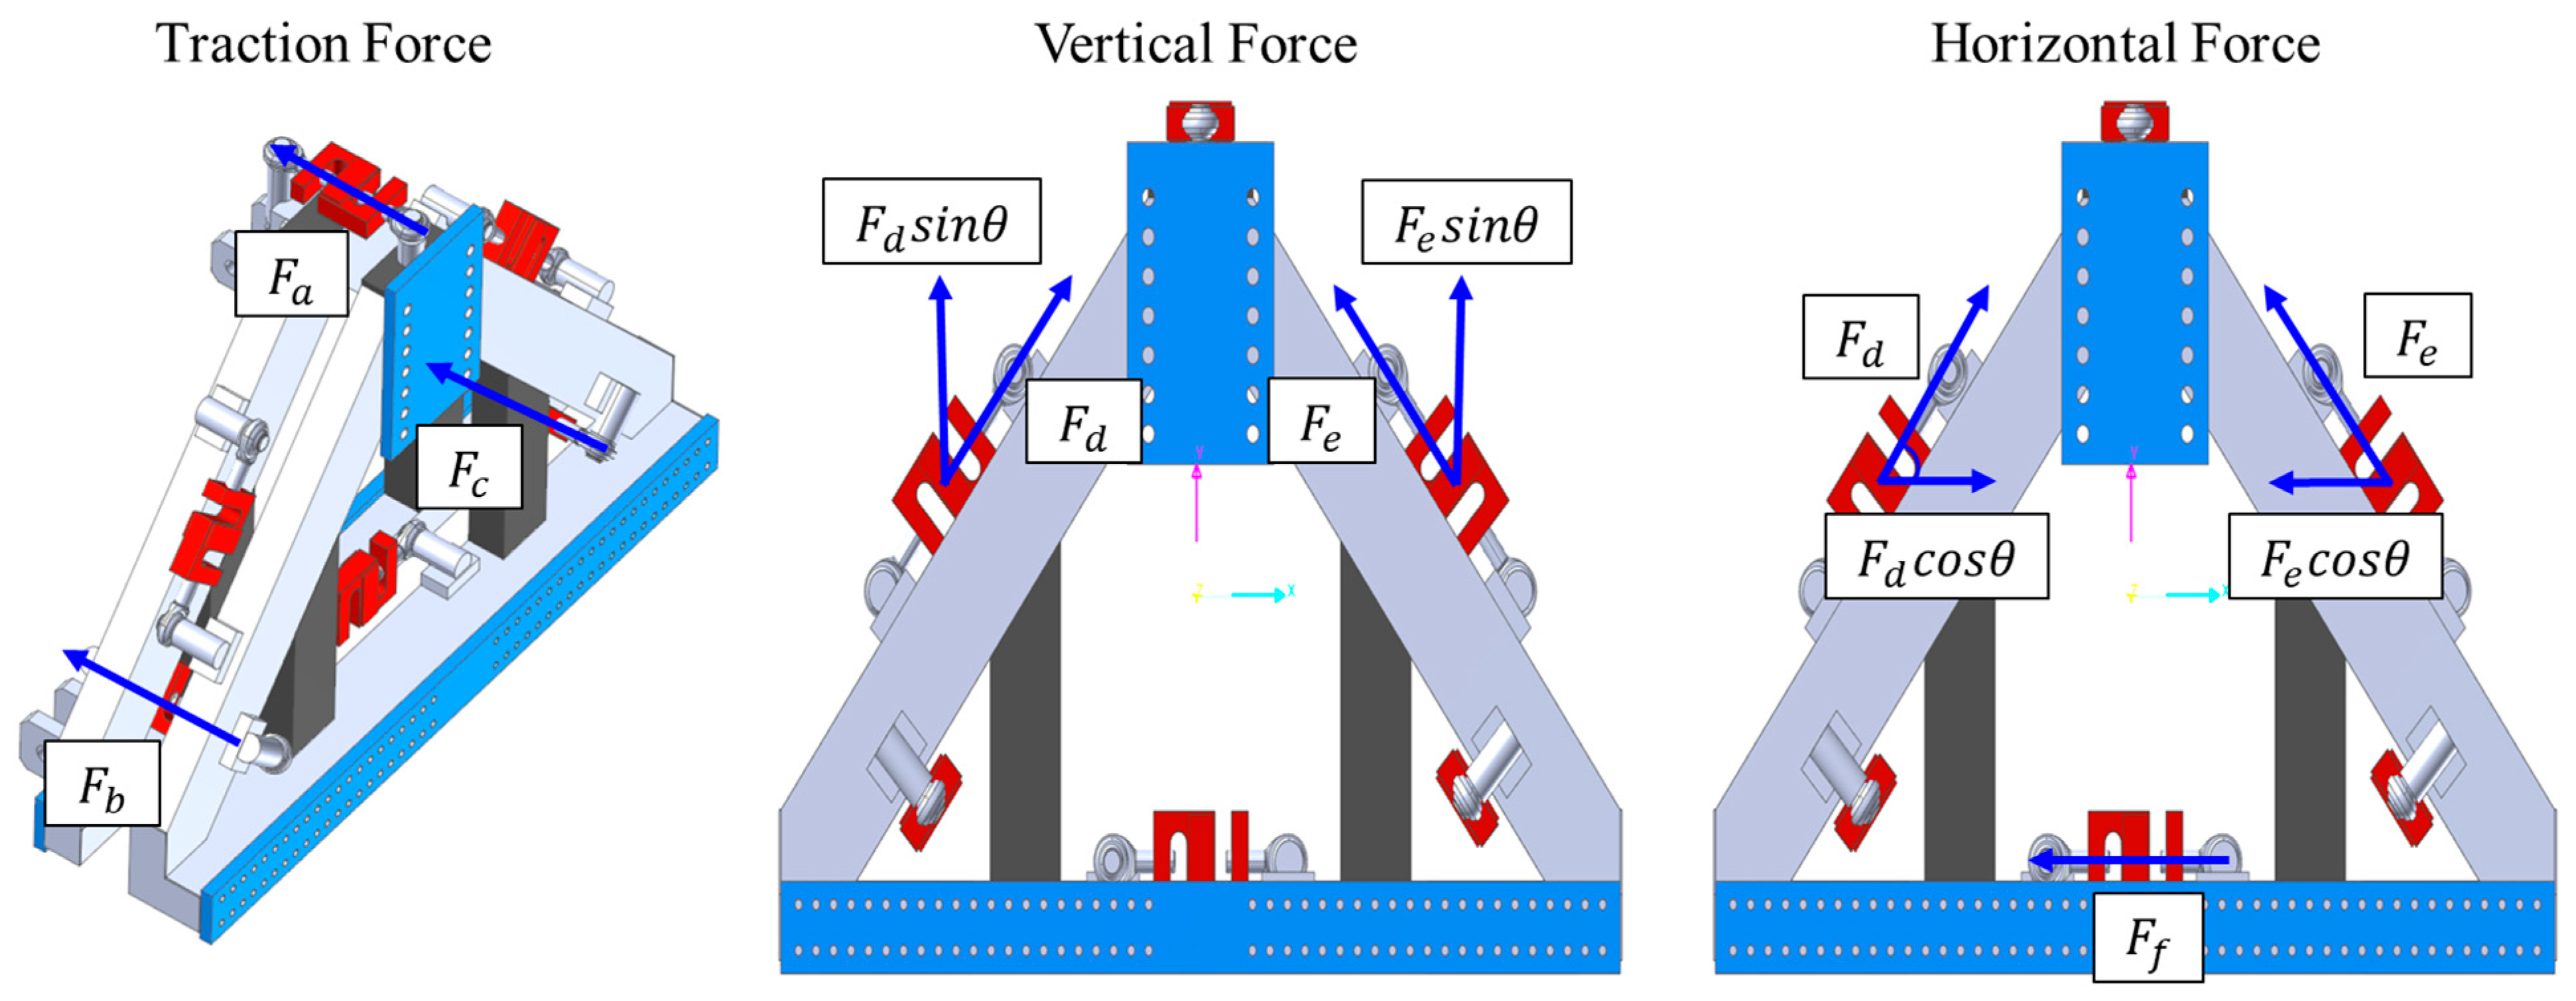
Because the dynamometer’s load cell can only detect force in one direction, it must be converted to the needed factor using the combined load cell. The traction force is measured on F a , F b and F c load cells mounted in the tractor’s driving direction. Figure 2 shows a free body diagram of the load cell’s three-direction force.
Vertical force is calculated by multiplying the value measured by the F d and F e load cells mounted on the inclined plane of the triangle and the sine of the triangle. The longitudinal force is calculated by multiplying the values of the load cells F d and F e by the cosine of the triangle, and adding F f which measures the longitudinal force.
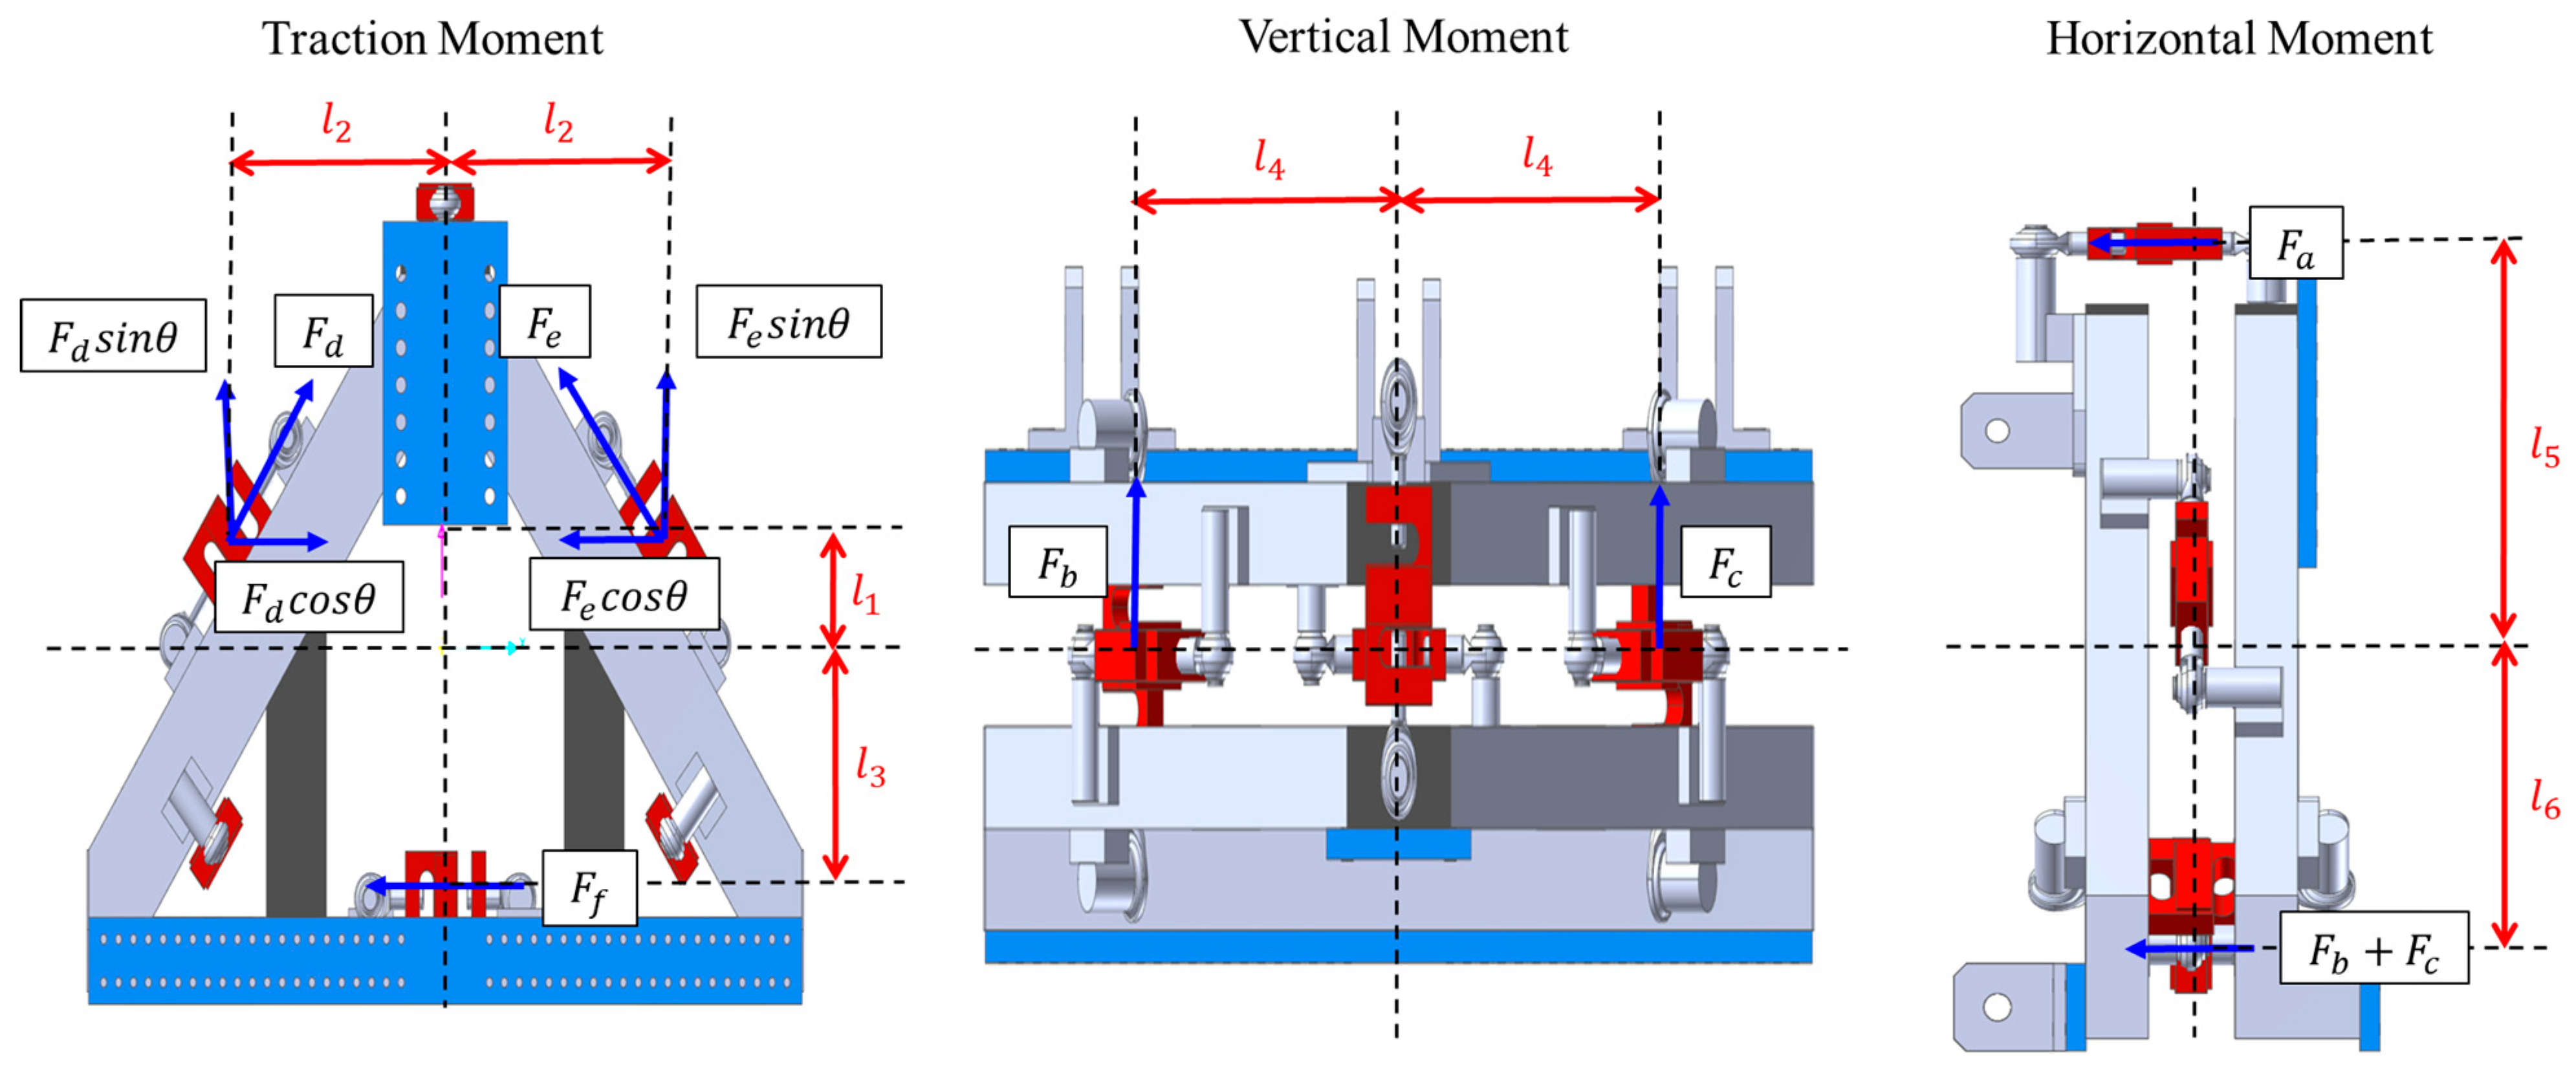
The traction moment is calculated from the front of the dynamometer’s geometric center. Forces F d and F e are converted to perpendicular components and recalculated as moments. Forces of F a , F b and F c in the same moment, direction does not affect the traction moment. Force F f is added to the moment in the tension direction.
The vertical direction moment is calculated based on the center of the dynamometer from above. F a , F f , which make up the center, and F d and F e , which are not in the plane, do not affect the vertical direction moment. Vertical moments are calculated simply with F b and F c , as well as a horizontal distance away from the center.
The horizontal direction moment is also calculated based on the side of the dynamometer from above. F d , F e , which make up the center, and F f not in the plane, do not affect the horizontal direction moment. Horizontal moments are calculated only with F a , F b and F c , and with a vertical distance away from the center.
Once the component force and moment are determined, the component force and moment may be calculated using the dynamometer shape and center point. P h is the sum of the traction forces. P v is the sum of the vertical forces, and P s is the sum of the horizontal forces. M h is the torsional moment acting in the traction direction? M v is the torsional moment acting in the vertical direction, M s is the torsional moment acting in the horizontal direction.

2.3. Tractor and Implement

The dynamometer was mounted on the 26 kW tractor and linked to the 2440 mm-long plows. Figure 3 shows the dynamometer and associated components attached to the tractor. The implement used in this study was category 1 type, and detailed information was omitted.

2.4. Test

Static load tests and field tests were performed to compare the results measured by the dynamometer with those calculated by modified equation.
In the static load tests, the method was used to apply static load and moment through a hydraulic actuator to compare the input value with the actual input load. In field tests, the force was measured by performing the plow operation while maintaining the operating depth of the plow constant [20].

3. Results and Discussion

3.1. Modified Equation

The component force–moment equation for the triangular three-point hitch dynamometer was developed based on these considerations. Figure 4 summarizes the direction and magnitude of moments. The location information where the load cells are mounted on the dynamometer is shown in Figure 4. This is very important information regarding moment calculations. The location values in this study are as follows.
l 1 = 0.0506   m
l 2 = 0.2878   m
l 3 = 0.2461   m
l 4 = 0.3081   m
l 5 = 0.3233   m
l 6 = 0.1938   m
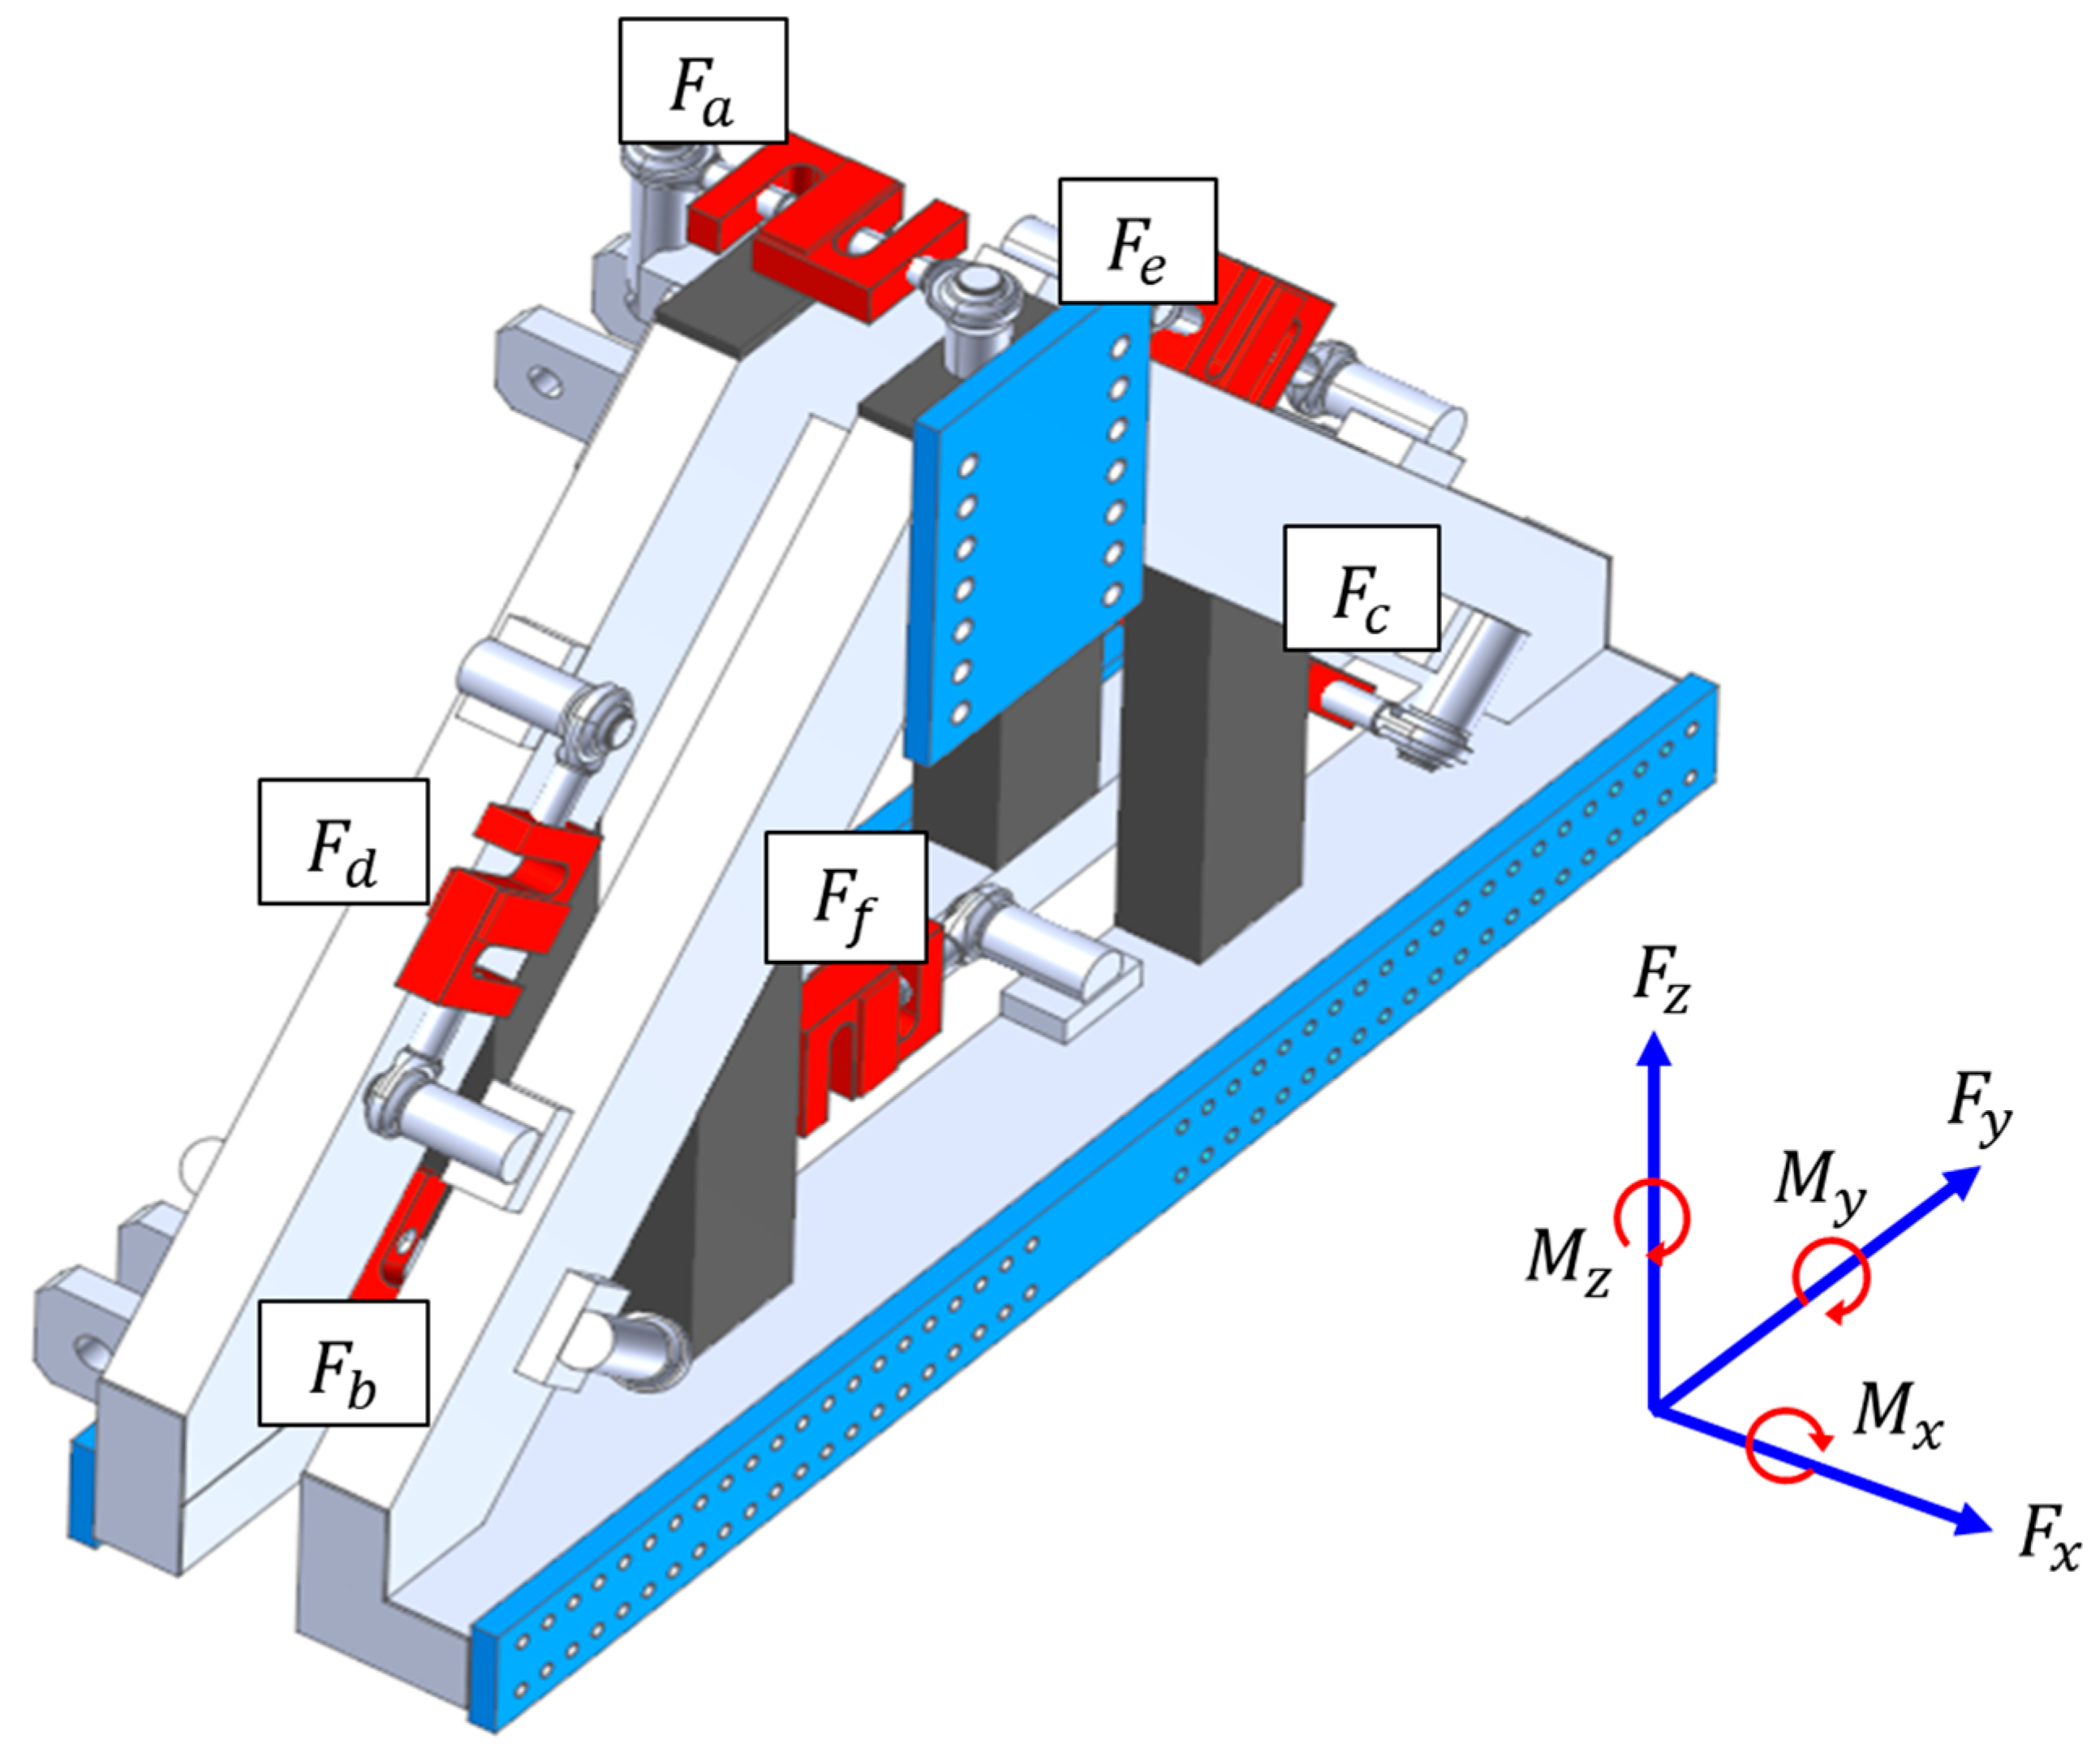
Figure 5 shows the direction of each force and moment, and the dynamometer equation developed is represented by Equations (1)–(6). The coordinate system for calculation was set based on the end point of the dynamometer axis connected to the PTO axis. The tractor’s forward direction was set to the x-axis, the left and right directions were set to the y-axis, and the vertical direction was set to the z-axis. This system is local coordinate system [21].
F x = F a + F b + F c
F z = F d s i n θ + F e s i n θ
F y = F e c o s θ F d c o s θ + F f
M x = F d F e × l 2 s i n θ + l 1 c o s θ + l 3 × F f
M z = F b F c × l 4
M y = F a l 5 F b + F c × l 6
The dynamometer consists of a single-axis load cell, its value should be modified according to the pitch angle of the dynamometer. Since the dynamometer was initially connected vertically to the lower link, the transport pitch is the dynamometer’s angle.
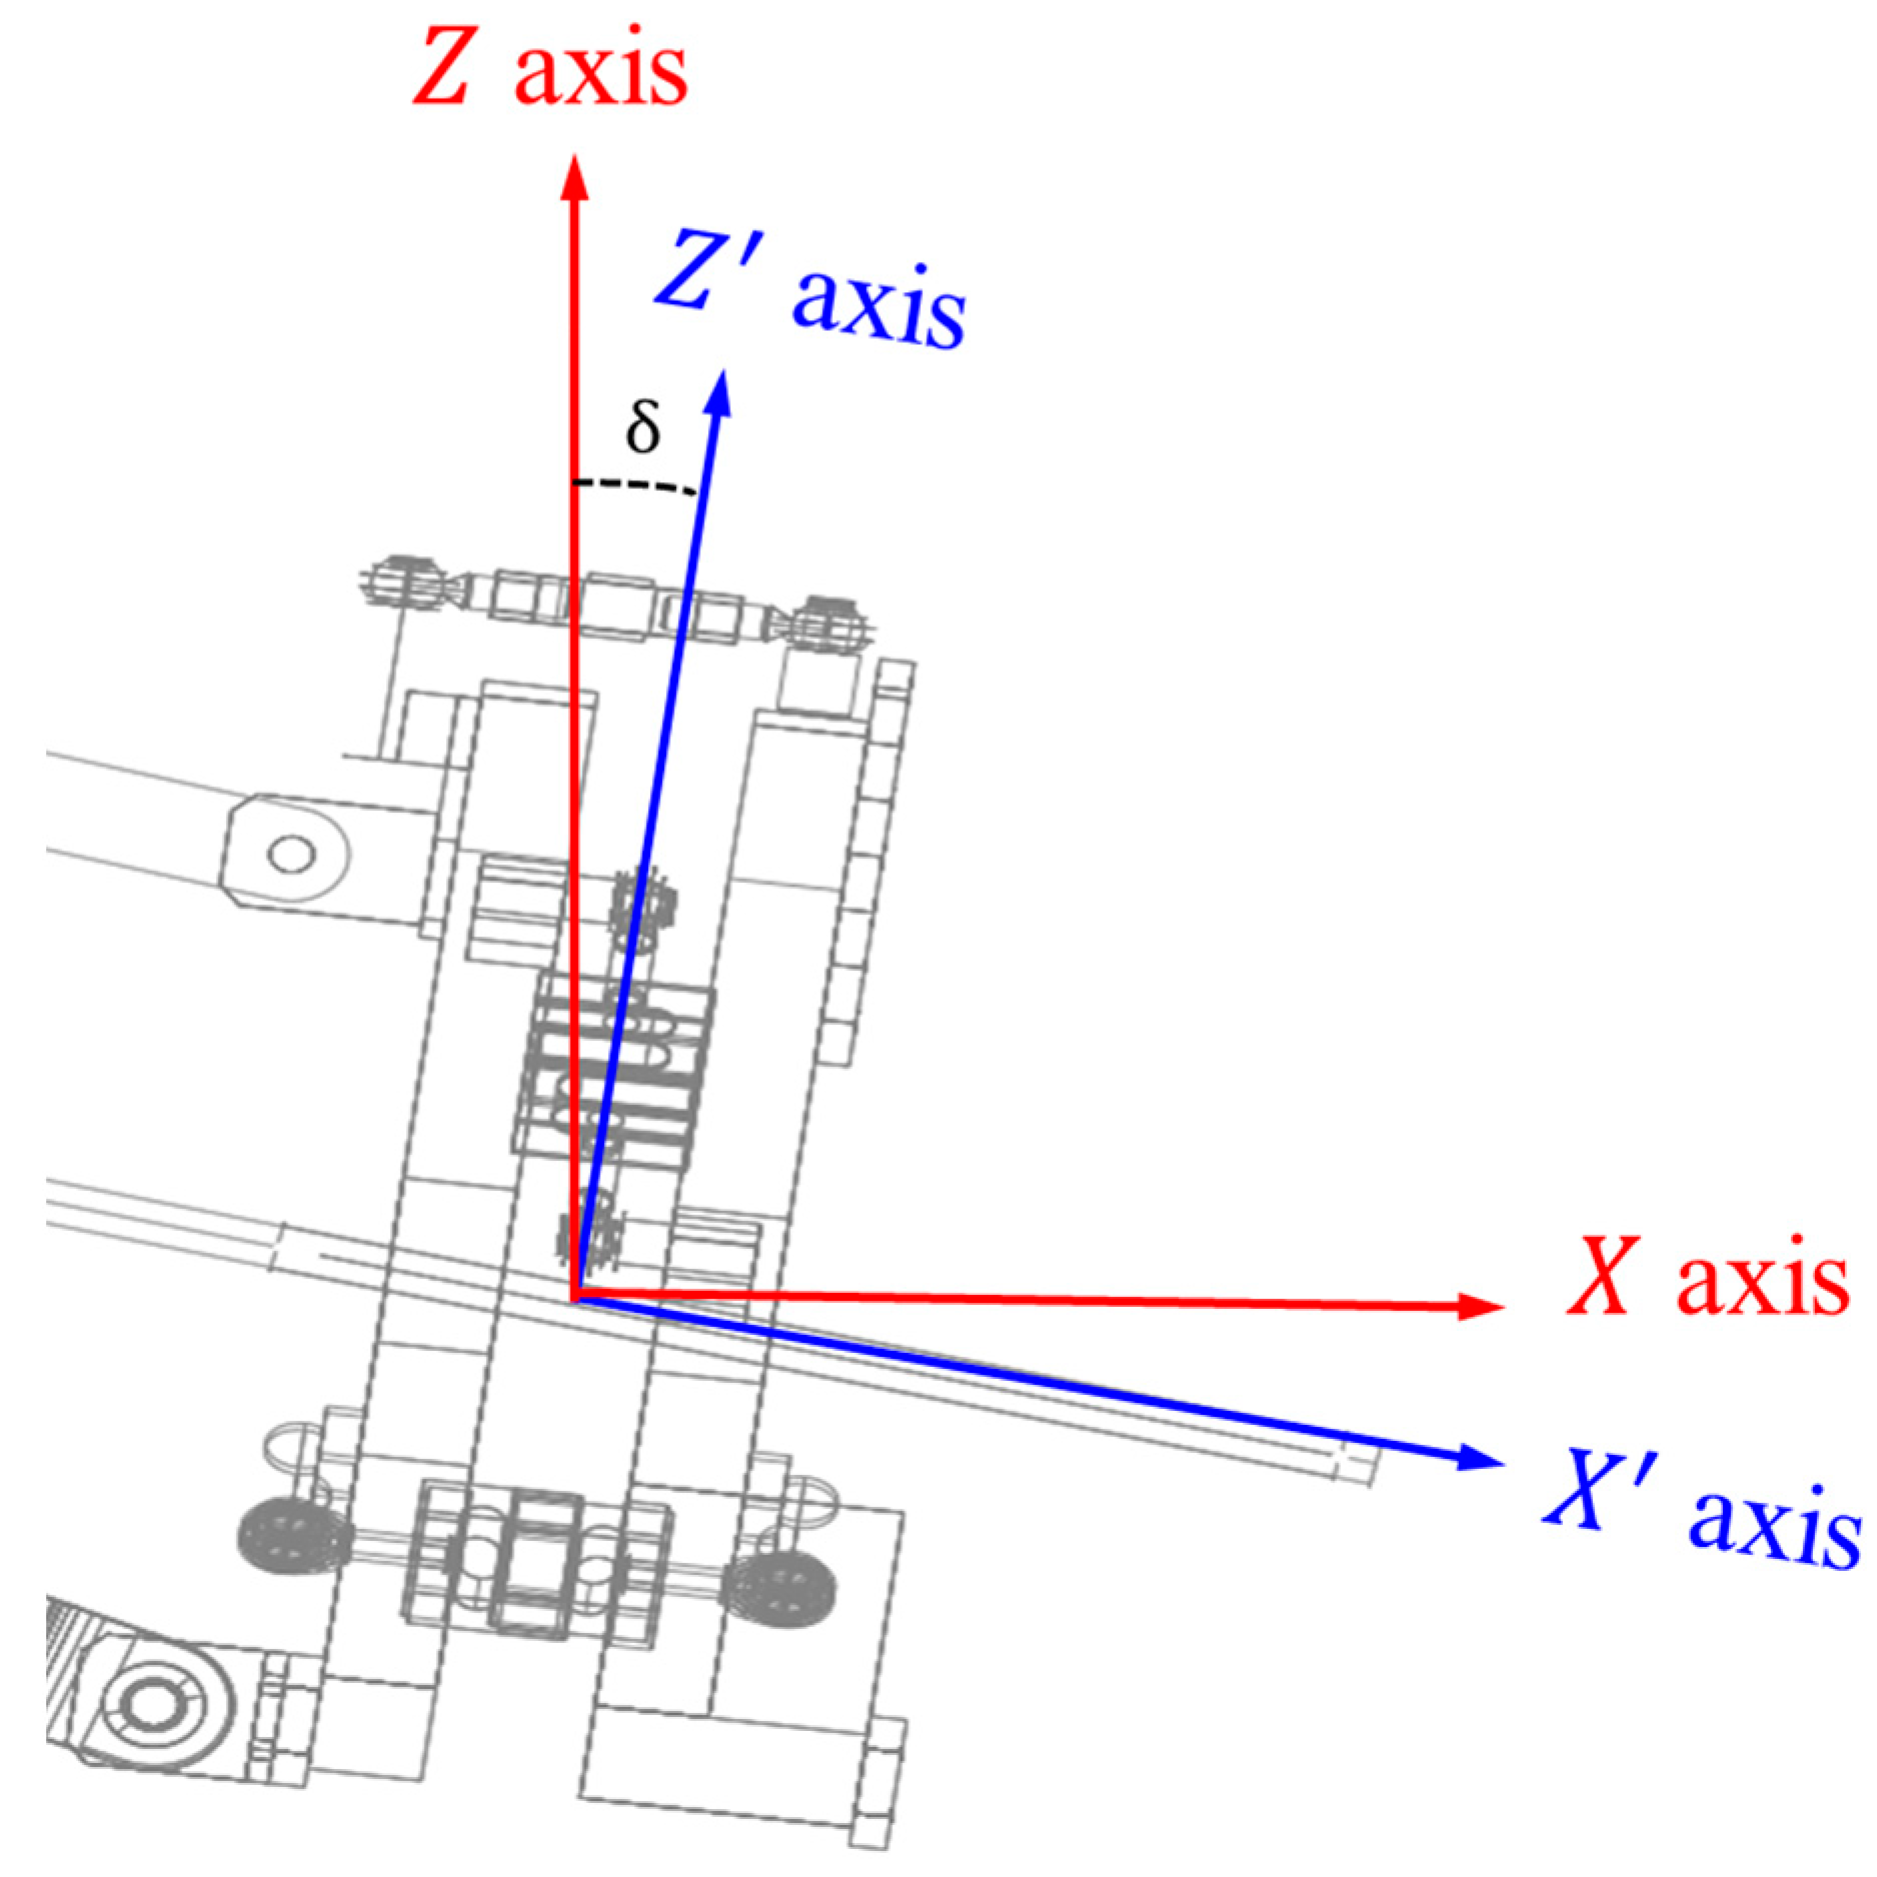
Let the x′y′z′ coordinate system move and rotate with the dynamometer such that the load cells are always in the y′z′ plane and with the same y′z′ coordinates (x′ coordinate of all load cells is zero since all load cells are in the y′z′ plane). Since the x′y′z′ coordinate system moves with the dynamometer, any forces and moments measured by the dynamometer load cells will be expressed in the x′y′z′ coordinate system by Equations (1)–(6), irrespective of the orientation of the dynamometer, even if it is upside down. The xyz coordinate system and x′y′z′ coordinate system can be simplified through Figure 6.
Transform these forces and moments in the x′y′z′ coordinate system at transport pitch, δ , to the global coordinate system, xyz. The transport pitch used in this study is −7.52° at lowest hitch point. All that is required to achieve this is a to pre-multiply the force and moment vectors by a standard 2-D coordinate transformation matrix.
Equation (7) rotates the x′y′z′ coordinate system about the y′ axis by an angle δ. Whether the signs for s i n δ are positive or negative depends on whether the rotation angle is measured from x′y′z′ to xyz, or from xyz to x′y′z′ coordinate systems. The same rotation matrix can be used to transform the three moments, M x , M y and M z to M x , M y and M z in the global xyz coordinate system. In fact, the three orthogonal forces and moments as measured by the dynamometer load cells, can be combined into a six dimensional load vector, and transformed from the x′y′z′ coordinate system by pre-multiplying by a single 6 × 6 partitioned transformation matrix.
F x F y F z = c o s δ 0 s i n δ 0 1 0 s i n δ 0 c o s δ F x F y F z

3.2. Result of the Static Load Test

Table 3 and Table 4 show the calculated force and moment when the static force and moment are applied. The moment is calculated by multiplying the vertical distance between the hydraulic actuator and the center of the dynamometer. And the error rate was calculated by comparing the calculated data and the input data.
The component force test yielded an accuracy of 97.4% or higher in all regions, as well as satisfactory reliability. The component force tests have modest errors, which are predicted to be caused by manufacturing errors and misalignment when attaching the surface plates.
The error of the moment test is expected to be the measurement error and the moment arm length. The maximum accuracy of 98.2% and the minimum accuracy of 96.5% were calculated for the whole test, and the dynamometer is considered reliable even considering the error rate.

3.3. Result of the Field Test

To ensure that the dynamometer operates accurately in the field, the dynamometer was tested in the field. The test site is a test field located in Gimje-si, Korea. The force was measured by performing the plow operation while maintaining the operating depth of the plow constant. The operation velocity was set to 3 km/h, and the hitch height lever was set to the same value during all test conditions. During plow work, the power of the tractor was mainly consumed by the traction force, and the vertical force supporting the machine was second. Horizontal forces occurred insignificantly, and the effects of torsion were not considered in this study.
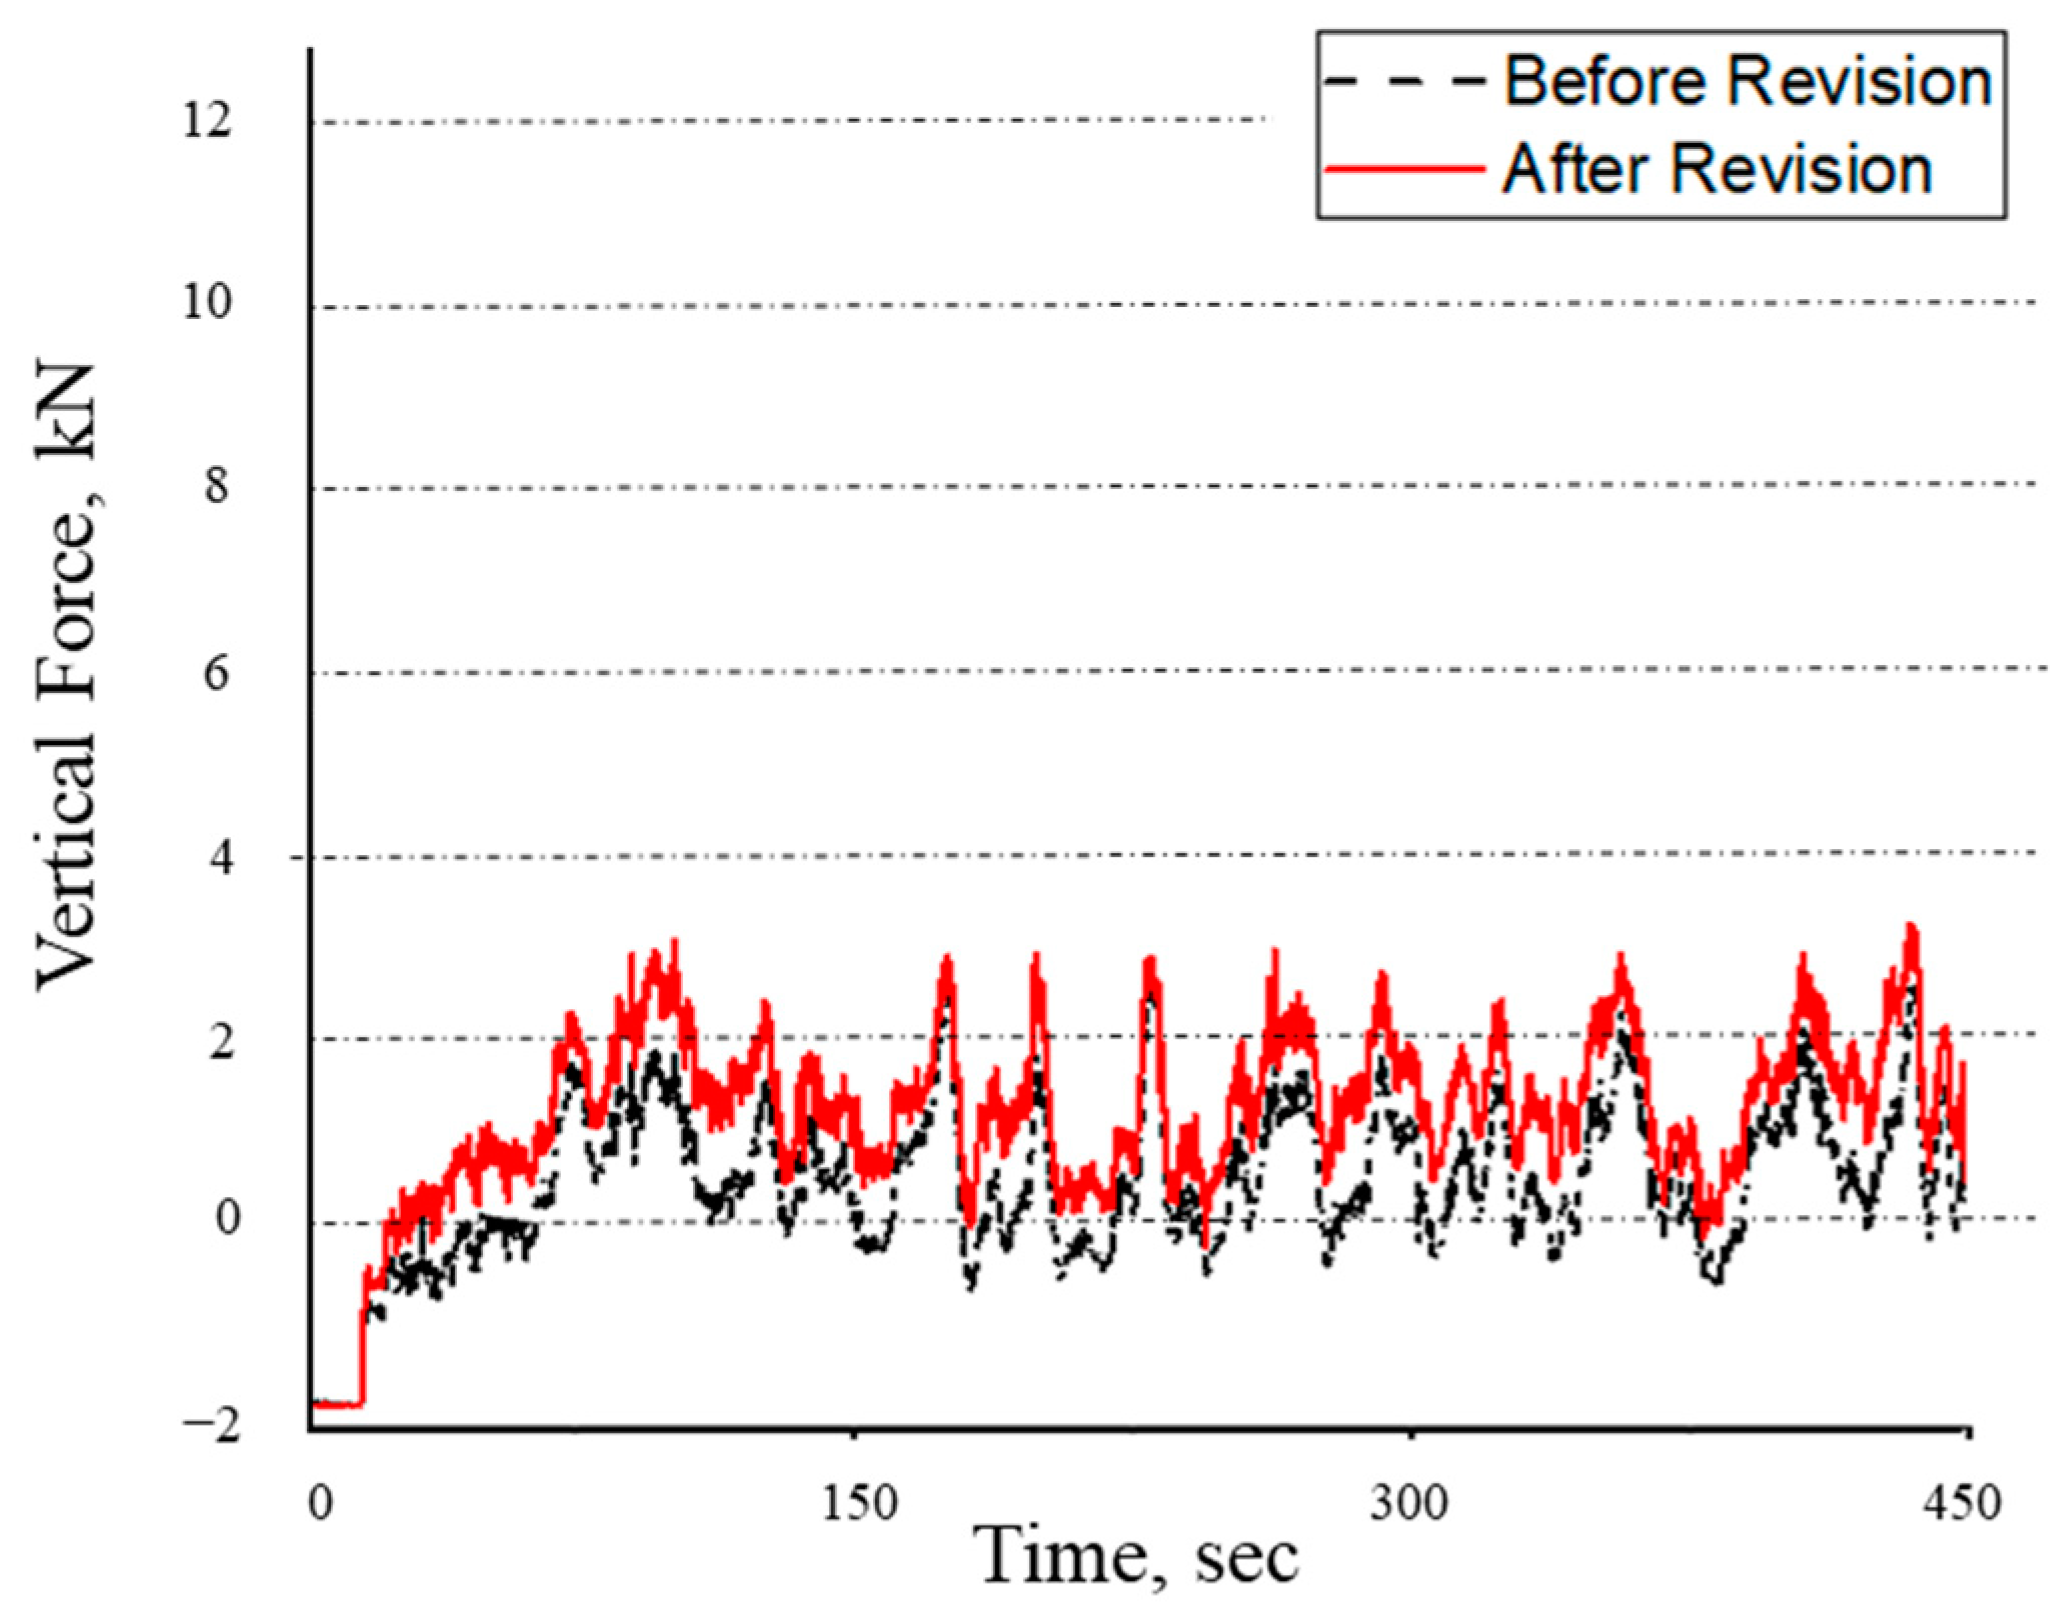
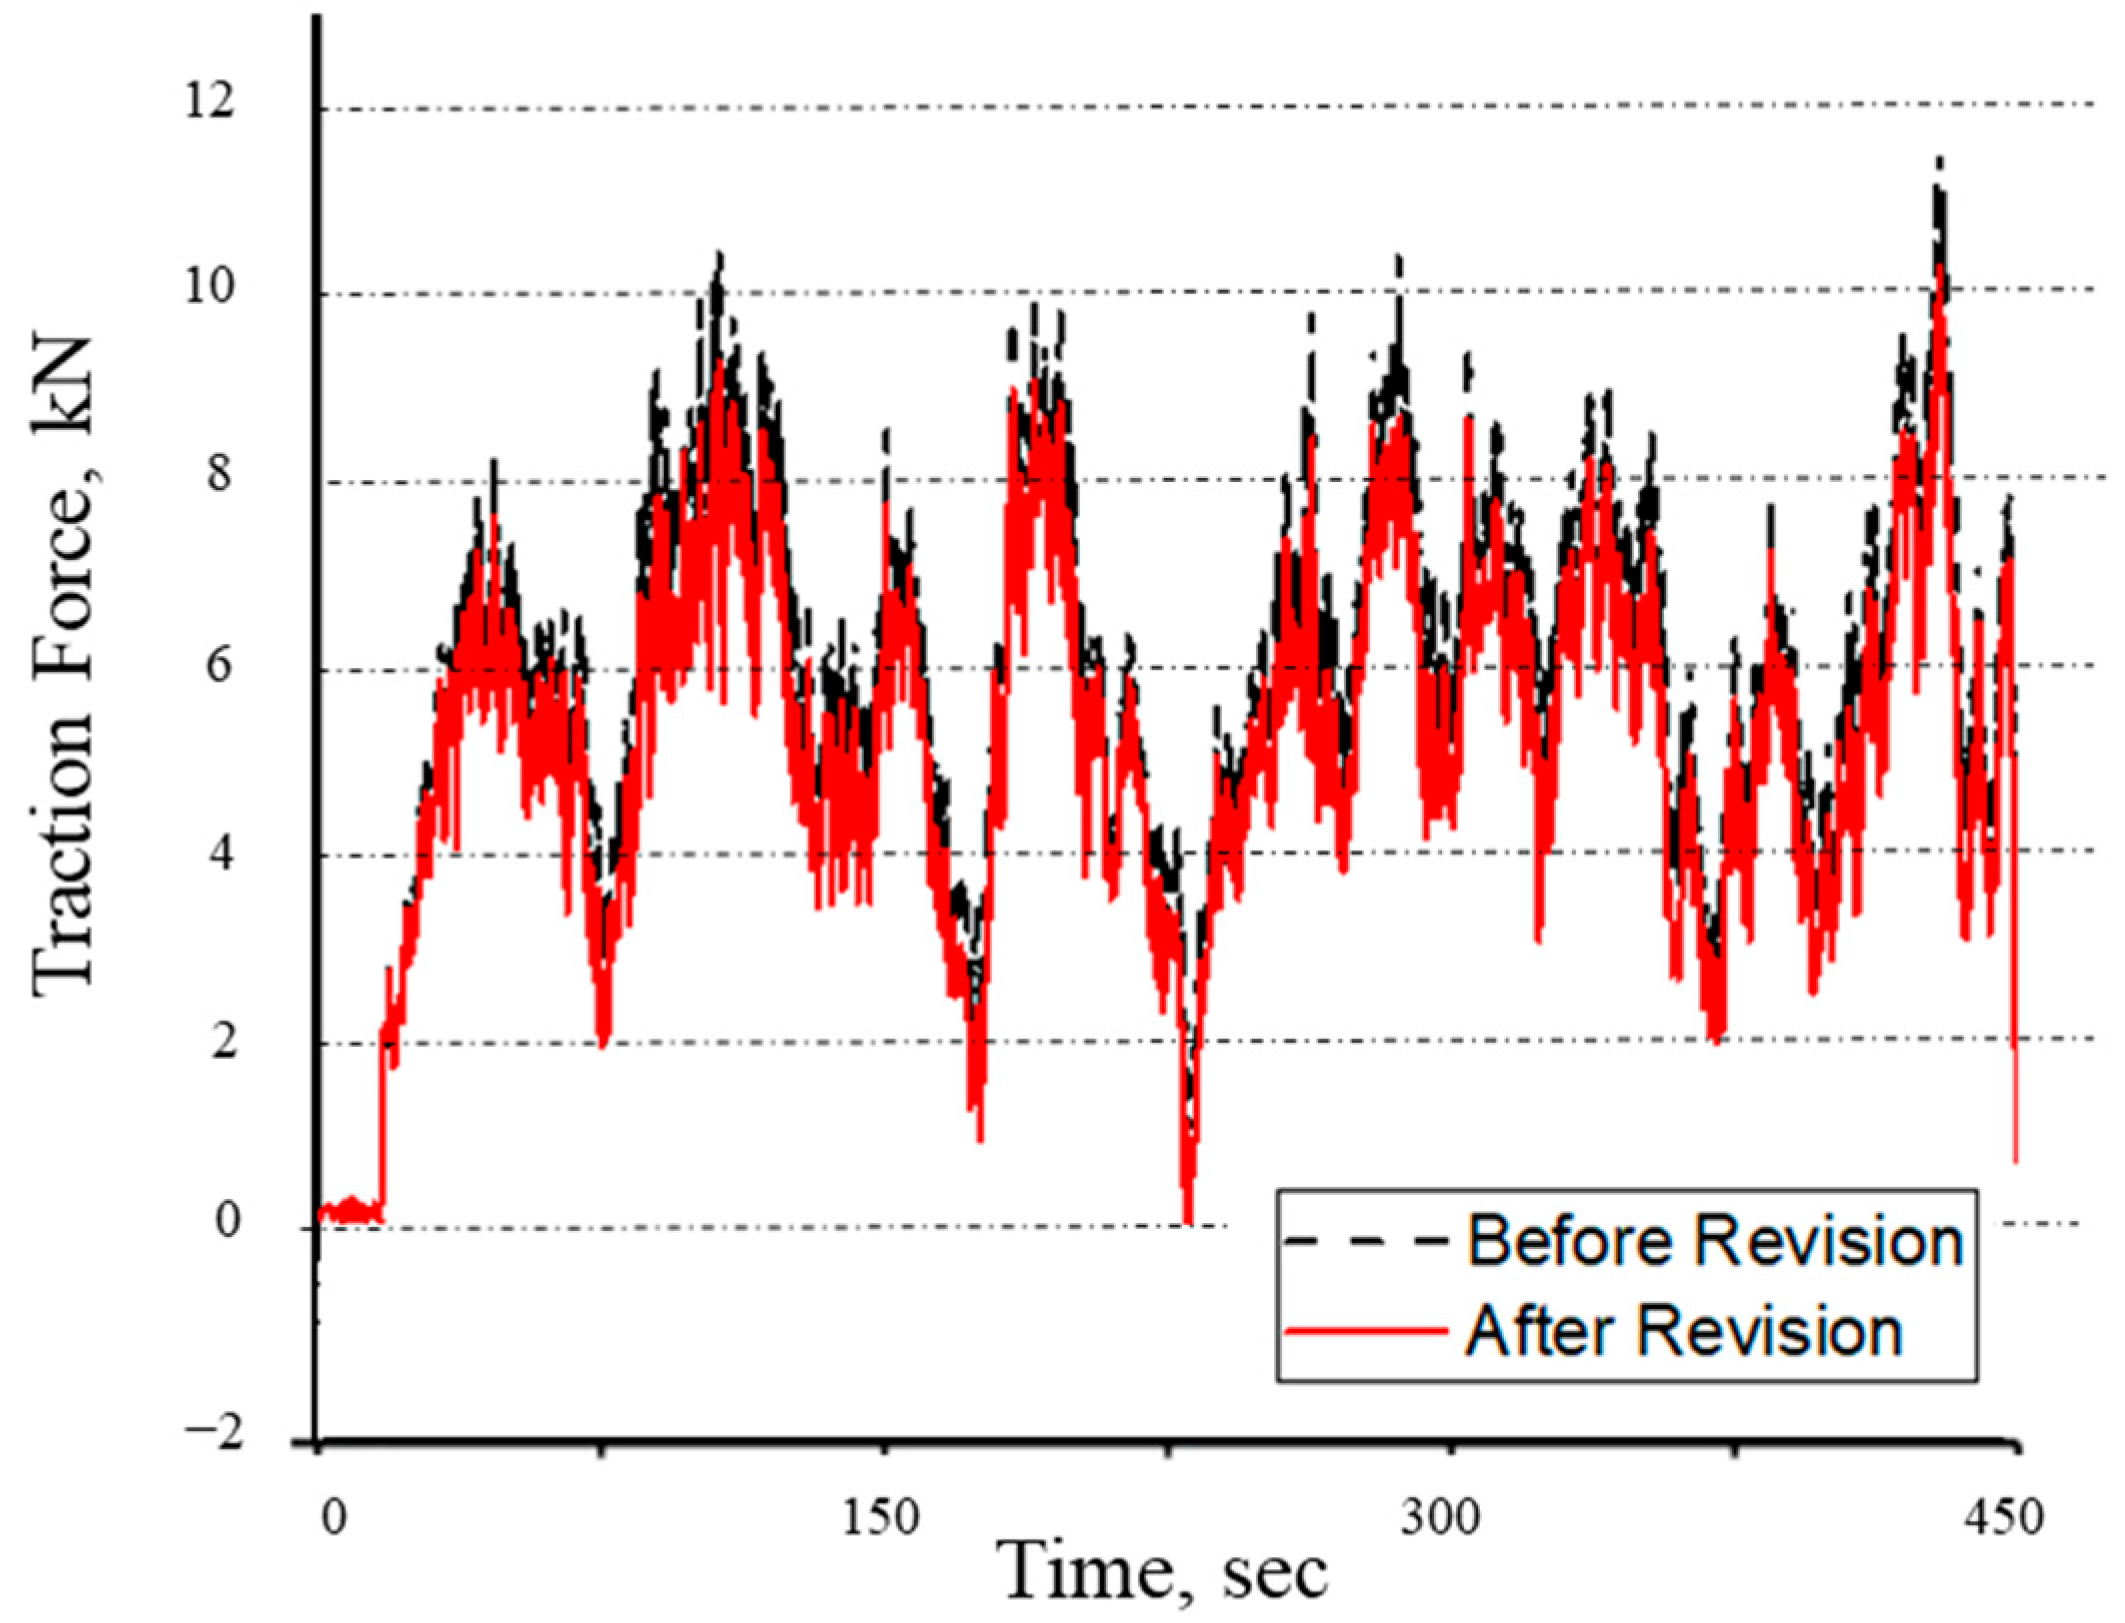
Figure 7 shows the traction force corrected by dynamometer installation, while Figure 8 shows the vertical force. When the implement descends due to the horizontal connection condition of the initial implementation, the transport pitch occurs in the negative direction, so the traction force decreases by the transport pitch sine value of the vertical force.
The measured values of the traction force and vertical force itself are also changed by the transport pitch, but the transport pitch generated at the actual working depth is 0.994–0.99, and the difference value is insignificant, 0.06–1%, so there is virtually no difference.
When the transport pitch value occurs anticlockwise when the implement is lowered, the traction force increases in part with the vertical force and decreases in part with the traction force, resulting in a traction-vertical component force that differs from the initial measured force. The larger the transport pitch, the larger the difference between the correction value and the measured value is because the value of the traction force to be converted to the vertical force is greater than the vertical force to be converted to the traction force. When lowering the implement to the desired operation depth, the transport pitch affects this difference. In addition, the initial connection angle is thought to be important. As a result, net traction increased by approximately 11.4%.
As a result, the difference in vertical force is greater while operating with plows, cultivators, and sub-soilers, which demand a high traction force. When working with a rotavator or agricultural roller under conditions that demand little traction or have a high vertical force due to the weight of the implement itself, the difference in the traction force is expected to be greater.
Through this study, a method to accurately measure traction forces and moments was proposed. Static tests were performed in which known values were applied to the dynamometer, and the effectiveness of the method was proven as a result of low errors. It was confirmed that the results of applying this method to the field test showed a difference of 11.4% compared to the value measured using the existing method.
In order to realize open-field smart farms, which are in the spotlight as one of future agriculture, autonomous farming must be carried out. For autonomous agricultural operation, it is necessary to accurately measure the load applied to the three-point hitch during agricultural operation, and this study can contribute. In addition, it is necessary to correct the measurement results using a dynamometer and verify the effectiveness of this study through various field tests.

4. Conclusions

This study was conducted to design a three-point hitch dynamometer with an easy connection to the implement and to propose a calibration equation to obtain realistic data. The conclusions obtained in this study are as follows.
(1)
The force–moment equation was developed considering the geometrical position of the load cell constituting the dynamometer and, as a result of static load testing using a hydraulic actuator, confirmed more than 97% accuracy in all sections.
(2)
The plow work data were collected in the field with a dynamometer and verified in a static environment. A modified equation based on transport pitch was used to modify the measured data. The actual traction force is slightly less than the measured traction force, and the actual vertical force is 11.7% greater than the measured vertical force. Because the dynamometer is a single-axis load cell, the correction data using the transport pitch are thought to be closer to the actual data.
(3)
Because traction is primarily used in plowing, a significant difference between the actual vertical force and the measured vertical force was confirmed because the traction force to be converted into vertical force was large. In contrast, in roller and landscape work, where vertical force is primarily used, the vertical force to be converted into the traction force is greater, so a significant difference between the actual traction force and the measured traction force is expected.
(4)
This study can be used as a basis for open-field smart farm research. The core of open-field smart farm technology is autonomous agricultural operation, and for this, it is most important to accurately analyze the traction force required for agricultural operation. The significance of this study is that it enabled precise traction analysis for autonomous agricultural operation. In addition, it is expected that further research will be needed, such as real-time traction analysis and traction force prediction for real-time autonomous agricultural operation.

Author Contributions

Conceptualization and methodology, H.-G.K.; validation, J.O.; formal analysis, J.-W.L.; data curation, S.-C.K.; writing—original draft preparation, H.-G.K. and J.O.; writing—review and editing, J.O. and S.-B.S.; funding acquisition, S.-B.S. All authors have read and agreed to the published version of the manuscript.

Funding

This research was supported by Kyungpook National University Research Fund, 2021. This research was conducted with the support of the “Development of Safety Evaluation and Management Technology for High-Risk Construction Machinery (Project No. RS-2023-00244879)” implemented by the Ministry of Land, Infrastructure and Transport/Korea Agency for Infrastructure Technology Advancement and overseen by the Korea Construction Equipment Safety Institute.

Institutional Review Board Statement

Not applicable.

Data Availability Statement

Data is contained within the article.

Conflicts of Interest

Author Hyo-Geol Kim is employed by the company TYM Co., Ltd. The remaining authors declare that the research was conducted in the absence of any commercial or financial relationships that could be construed as a potential conflict of interest.

References

  1. Koo, Y.M. PTO Torque and draft analyses of an integrated tractor-mounted implement for round ridge preparation. J. Biosyst. Eng. 2022, 47, 330–343. [Google Scholar] [CrossRef]
  2. Beigi, M.; Ghazavi, M.A.; Ahmadi, I. Design and construction of load cell of a three point hitch dynamometer for tractor John Deere 3140. J. Mod. Process. Manufaturing Prod. 2014, 3, 47–58. [Google Scholar]
  3. Wismer, R.D.; Luth, H.J. Off-road traction prediction for wheel vehicles. Trans. ASAE 1974, 17, 8–14. [Google Scholar] [CrossRef]
  4. Alimardani, R.; Fazel, A.; Akram, A.; Mahmoudi, A.; Varnamkhsati, M.G. Design and Development of a three-point hitch dynamometer. J. Agric. Technol. 2008, 4, 37–52. [Google Scholar]
  5. Brixius, W.W. Traction Prediction Equations for Bias Ply Tires; Transaction of the ASAE, 87-1622; American Society of Agricultural Engineers: St. Joseph, MI, USA, 1987. [Google Scholar]
  6. Askari, M.; Komarizade, M.H.; Nikbakht, A.M.; Nobakht, N.; Teimourlou, R.F. A novel three-point hitch dynamometer to measure the draft requirement of mounted implements. Res. Agric. Eng. 2011, 57, 128–136. [Google Scholar] [CrossRef]
  7. Khan, J.; Godwin, R.J.; Kilgour, J.; Blackmore, B.S. Design and calibration of a direct mounted strain gauged lower links system for measurement of tractor-implement force. J. Eng. Appl. Sci. 2006, 1, 22–25. [Google Scholar]
  8. Roca, J.; Comellas, M.; Pijuan, J.; Nogués, M. Development of an easily adaptable three-point hitch dynamometer for agricultural tractors. Analysis of the disruptive effects on the measurements. J. Soil Tillage 2019, 194, 104323. [Google Scholar] [CrossRef]
  9. Al-Jalil, H.F.; Khdair, A.; Mukahal, W. Design and performance of and adjustable three-point hitch dynamometer. J. Soil Tillage 2001, 62, 153–156. [Google Scholar] [CrossRef]
  10. Kim, E.K.; Moon, S.G.; Oh, C.M.; Han, J.W. Working load measurement using 6-component load cell and fatigue damage analysis of composite working implement. J. Agric. Life Environ. Sci. 2017, 29, 225–236. [Google Scholar]
  11. Kostic, M.; Rakic, D.Z.; Licen, H.H.; Malinovic, N.C. Design and construction of three point hitch device for measuring draft of tillage implement—Data acquisition and post processing analysis. J. Food Agric. Environ. 2014, 12, 1300–1307. [Google Scholar]
  12. Kumari, A.; Raheman, H. Development of a Novel Draft Sensing Device with Lower Hitch Attachments for Tractor-Drawn Implements. J. Biosyst. Eng. 2024, 1–9. [Google Scholar] [CrossRef]
  13. Tewari, V.K.; Ravi, N.; Jha, K.R.; Ashok, A. Design and development of a three-Point-linkage dynamometer for tillage research. Agric. Eng. Today 2012, 36, 33–38. [Google Scholar]
  14. ASABE Standard S217; Three-Point Free-Link Attachment for Hitching Implements to Agricultural Wheel Tractors. American Society of Agricultural and Biological Engineers: St. Joseph, MI, USA, 2001.
  15. ISO Standard 730; Agricultural Wheeled Tractors—Rear-Mounted Three-Point Linkage—Part 1: Categories 1, 2, 3 and 4. ISO: Geneva, Switzerland, 2009.
  16. ISO Standard 11001-1; Agricultural Wheeled Tractors and Implements—Three-Point Hitch Couplers—Part 1: U-Frame Coupler. ISO: Geneva, Switzerland, 2016.
  17. ISO Standard 11001-2; Agricultural Wheeled Tractors and Implements—Three-Point Hitch Couplers—Part 2: A-Frame Coupler. ISO: Geneva, Switzerland, 2017.
  18. ISO Standard 11001-3; Agricultural Wheeled Tractors and Implements—Three-Point Hitch Couplers—Part 3: Link coupler. ISO: Geneva, Switzerland, 1993.
  19. ISO Standard 11001-4; Agricultural Wheeled Tractors and Implements—Three-Point Hitch Couplers—Part 4: Bar Coupler. ISO: Geneva, Switzerland, 1994.
  20. Bentaher, H.; Hamza, E.; Kantchev, G.; Maalej, A.; Arnold, W. Three-point hitch-mechanism instrumentation for tillage power optimization. In Proceedings of the 14th Annual Conference of the Misr Society of Agricultural Engineering; 2006; Volume 22, pp. 923–936. Available online: https://citeseerx.ist.psu.edu/document?repid=rep1&type=pdf&doi=f470dc69970f41d2d6790174b64237c823e6ee35 (accessed on 14 March 2024).
  21. ISO Standard 5673-2; Agricultural Tractors and Machinery—Power Take-Off Drive Shafts and Power-Input Connection—Part 2: Specification for Use of PTO Drive Shafts, and Position and Clearance of PTO Drive Line and PIC for Various Attachments. ISO: Geneva, Switzerland, 2017.
Figure 1. Element of three-point hitch.
Agriculture 14 00544 g001
Figure 2. Component force direction of load cells.
Agriculture 14 00544 g002
Figure 3. Dynamometer and instrumentation components.
Agriculture 14 00544 g003
Figure 4. Moment direction of load cells.
Agriculture 14 00544 g004
Figure 5. The force–moment direction of the dynamometer.
Agriculture 14 00544 g005
Figure 6. New coordinate system.
Agriculture 14 00544 g006
Figure 7. Traction data before and after revision.
Agriculture 14 00544 g007
Figure 8. Vertical force data before and after revision.
Agriculture 14 00544 g008
Table 1. Specification of the load cell used in this study.
SpecificationValue
Max capacity (kgf)2000
Rated output (mV/V)3.0 ± 0.3
Zoro balance (mV/V)0 ± 0.03
Combined error (%)0.03
Repeatability (%)0.01
Recommended excitation (V)10
Maximum excitation (V)15
Table 2. Specification of DAQ used in this study.
SpecificationValue
Model NameQ.Brixx A108
ManufacturerGantner, Germany
Input Voltage (V)Max 30
Input Current (mA)Max 0.5
Upper Threshold (V)>10
Lower Threshold (V)<2
Analog Input Accuracy (%)0.01–0.05
Repeatability (%)0.003
Table 3. Calculated force and input force.
SpecificationCalculated Force (kN)Input Force (kN)Error Rate (%)
Traction Force14.70914.5511.1
Vertical Force9.8069.7320.8
Lateral Force4.9035.0322.6
Table 4. Calculated moment and input moment.
SpecificationCalculated Moment (kN·m)Input Moment (kN·m)Error Rate (%)
Traction Moment3.9123.9831.8
Vertical Moment3.9123.8072.7
Lateral Moment2.5352.6193.5
Disclaimer/Publisher’s Note: The statements, opinions and data contained in all publications are solely those of the individual author(s) and contributor(s) and not of MDPI and/or the editor(s). MDPI and/or the editor(s) disclaim responsibility for any injury to people or property resulting from any ideas, methods, instructions or products referred to in the content.