
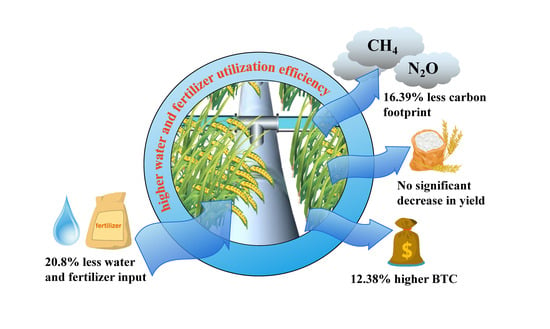
Can the Integration of Water and Fertilizer Promote the Sustainable Development of Rice Production in China?

 ,
,
Abstract
:
1. Introduction
2. Materials and Methods
2.1. Test Site and Materials
2.2. Test Design
2.3. Measurement Items and Methods
2.3.1. Rice Yield
2.3.2. Energy Analysis
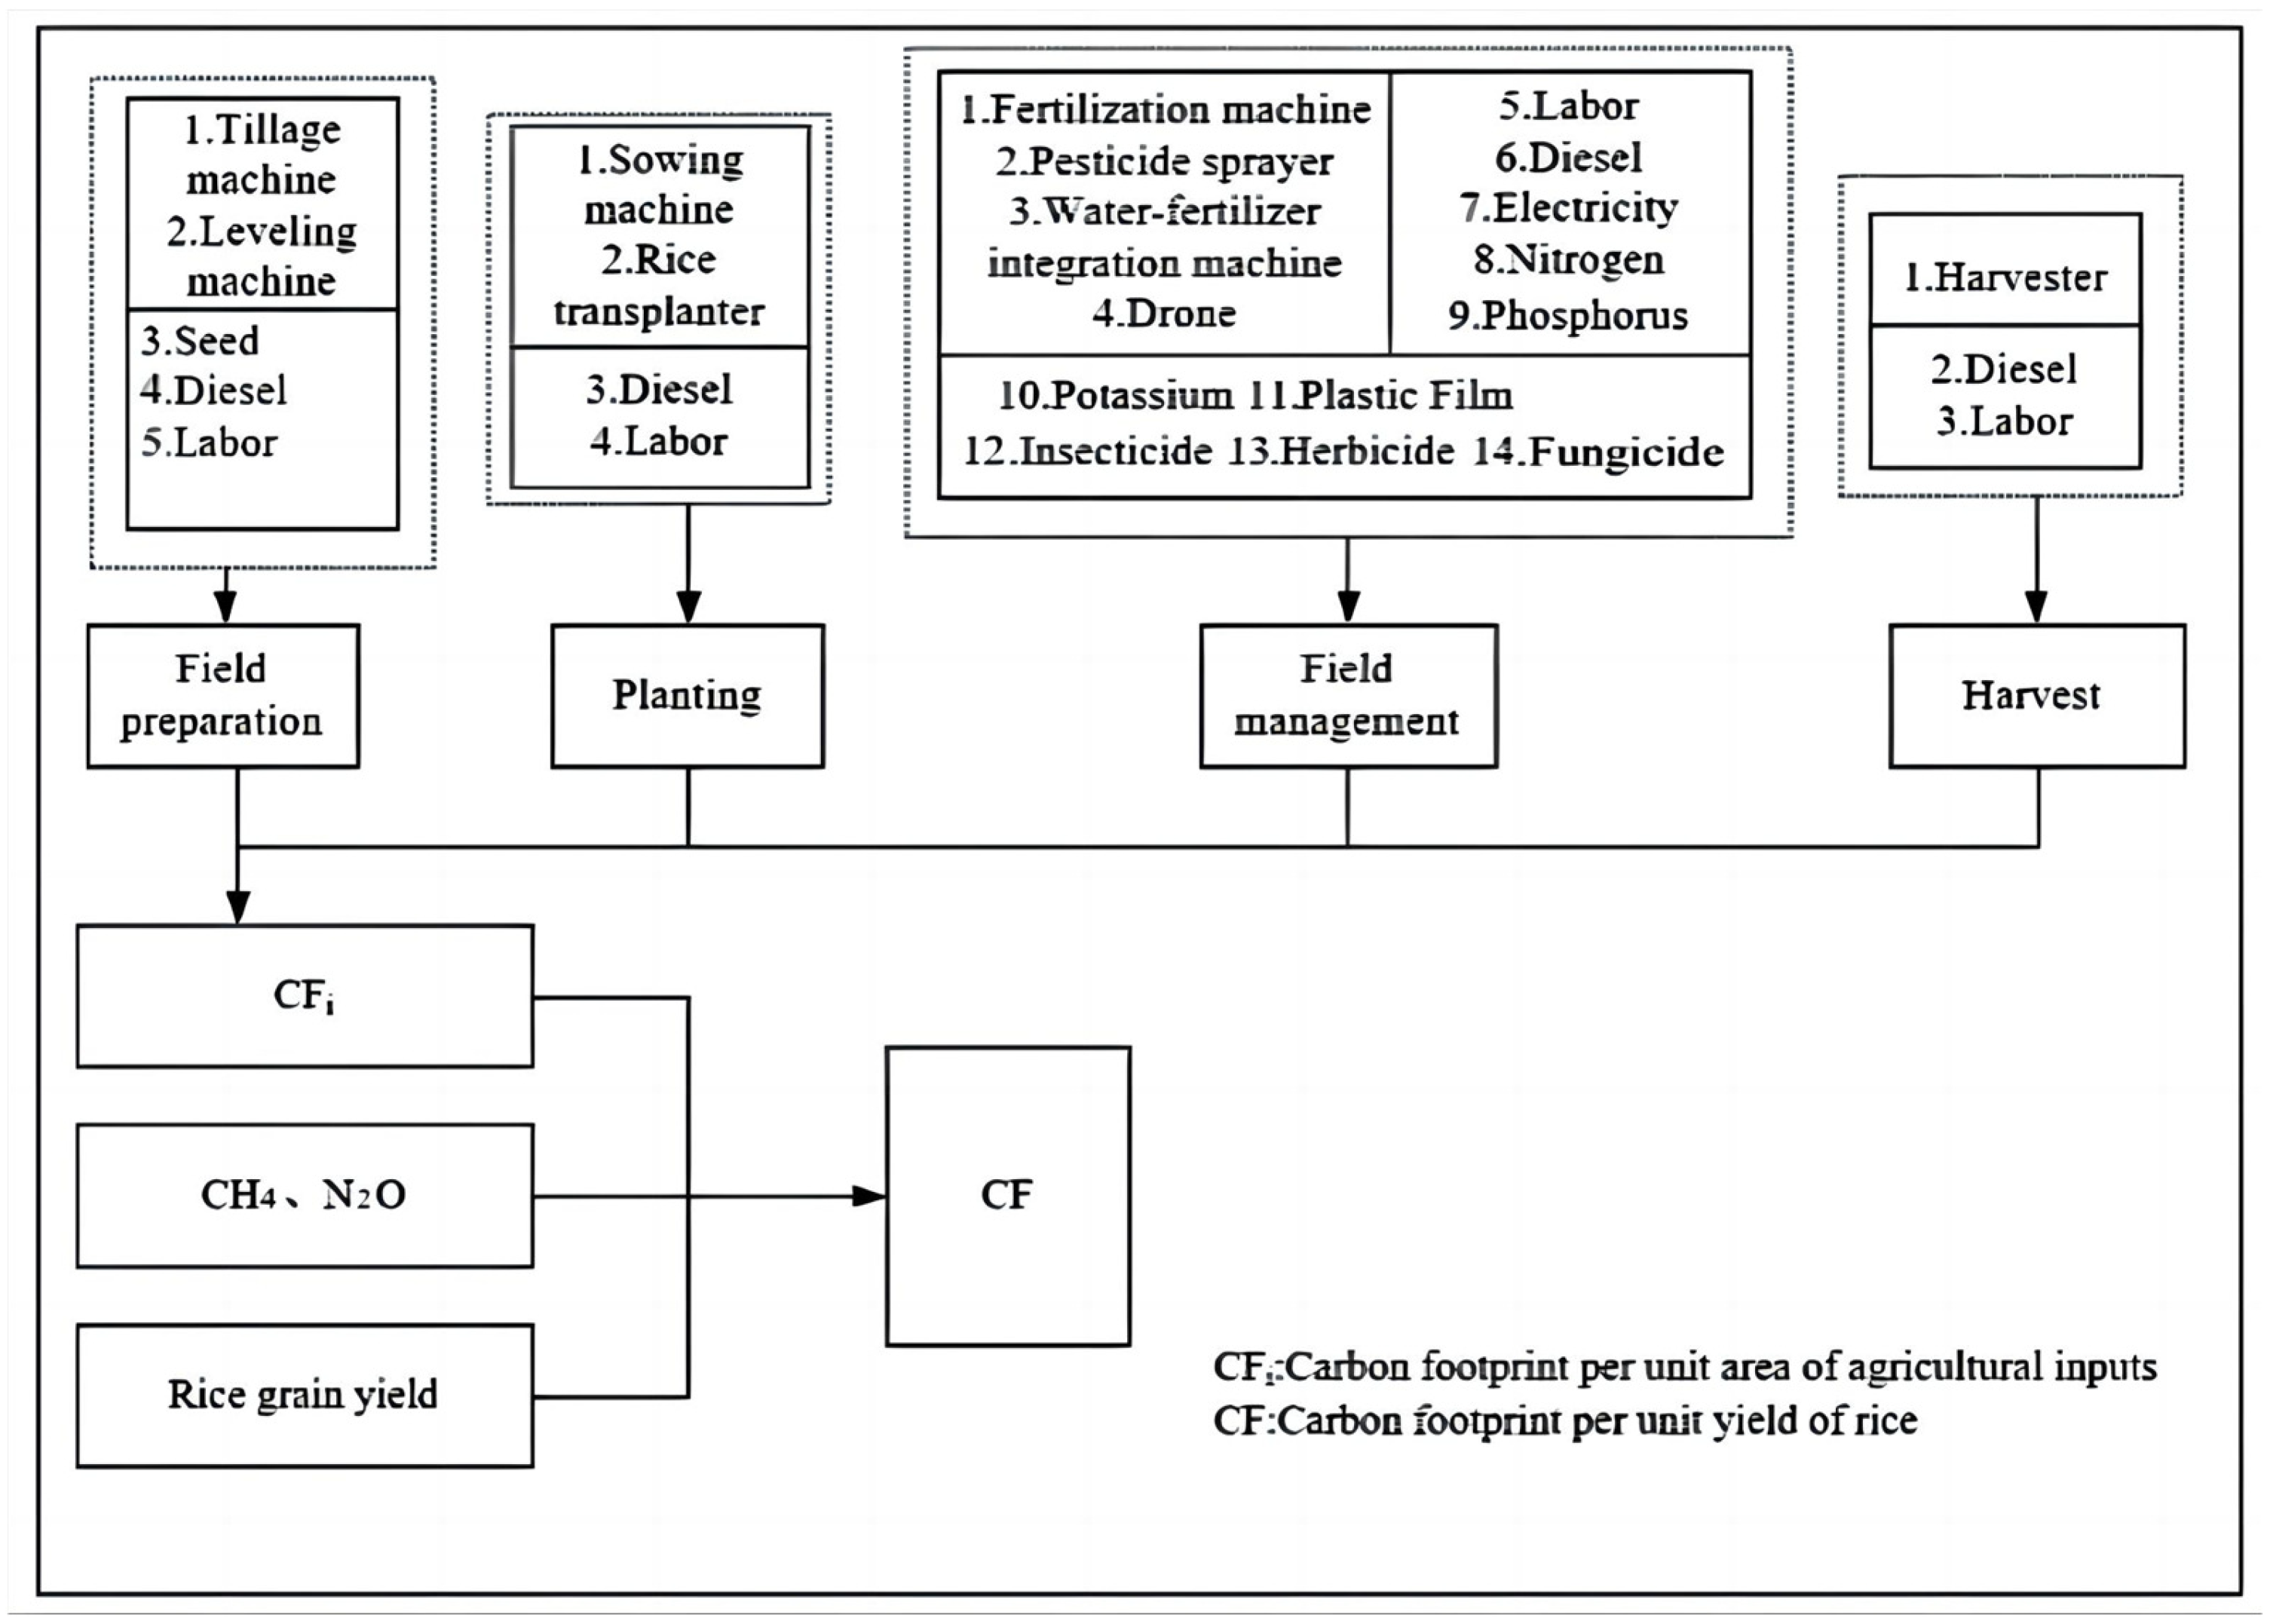
2.3.3. Carbon Footprint
2.3.4. Economic Benefits
3. Results and Analysis
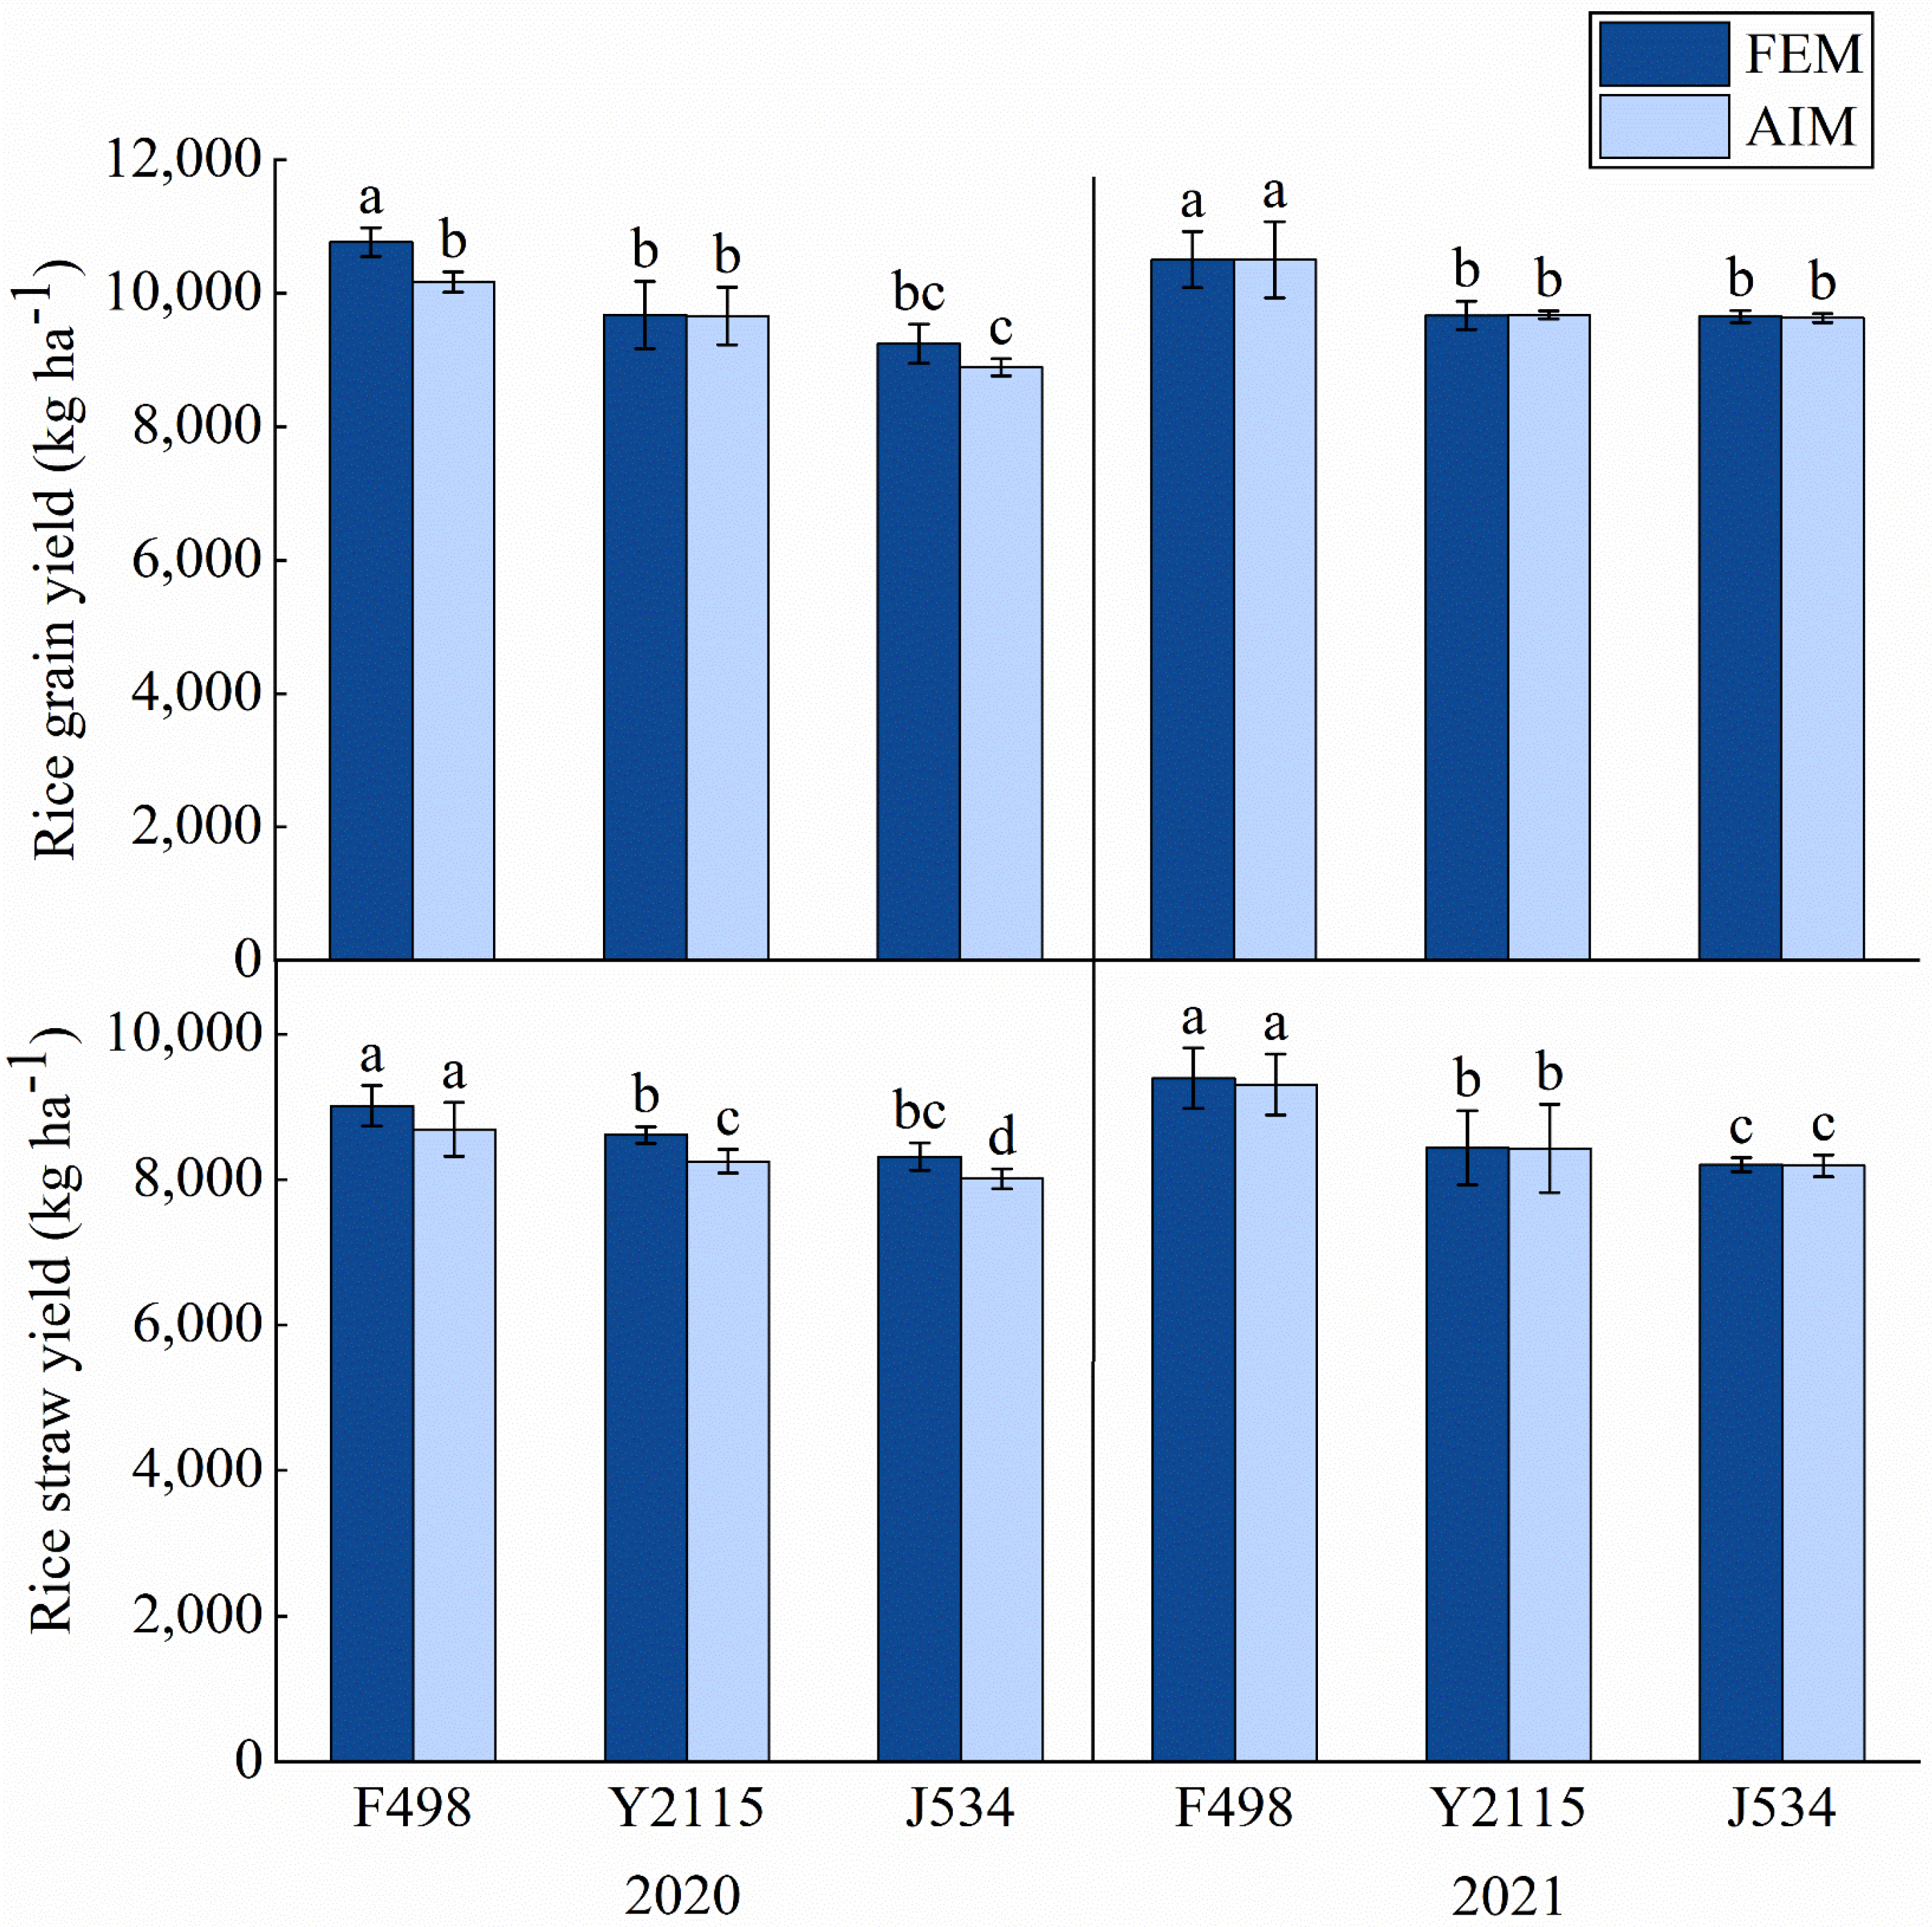
3.1. Comparison of Rice Yields under the Two Water and Fertilizer Management Models
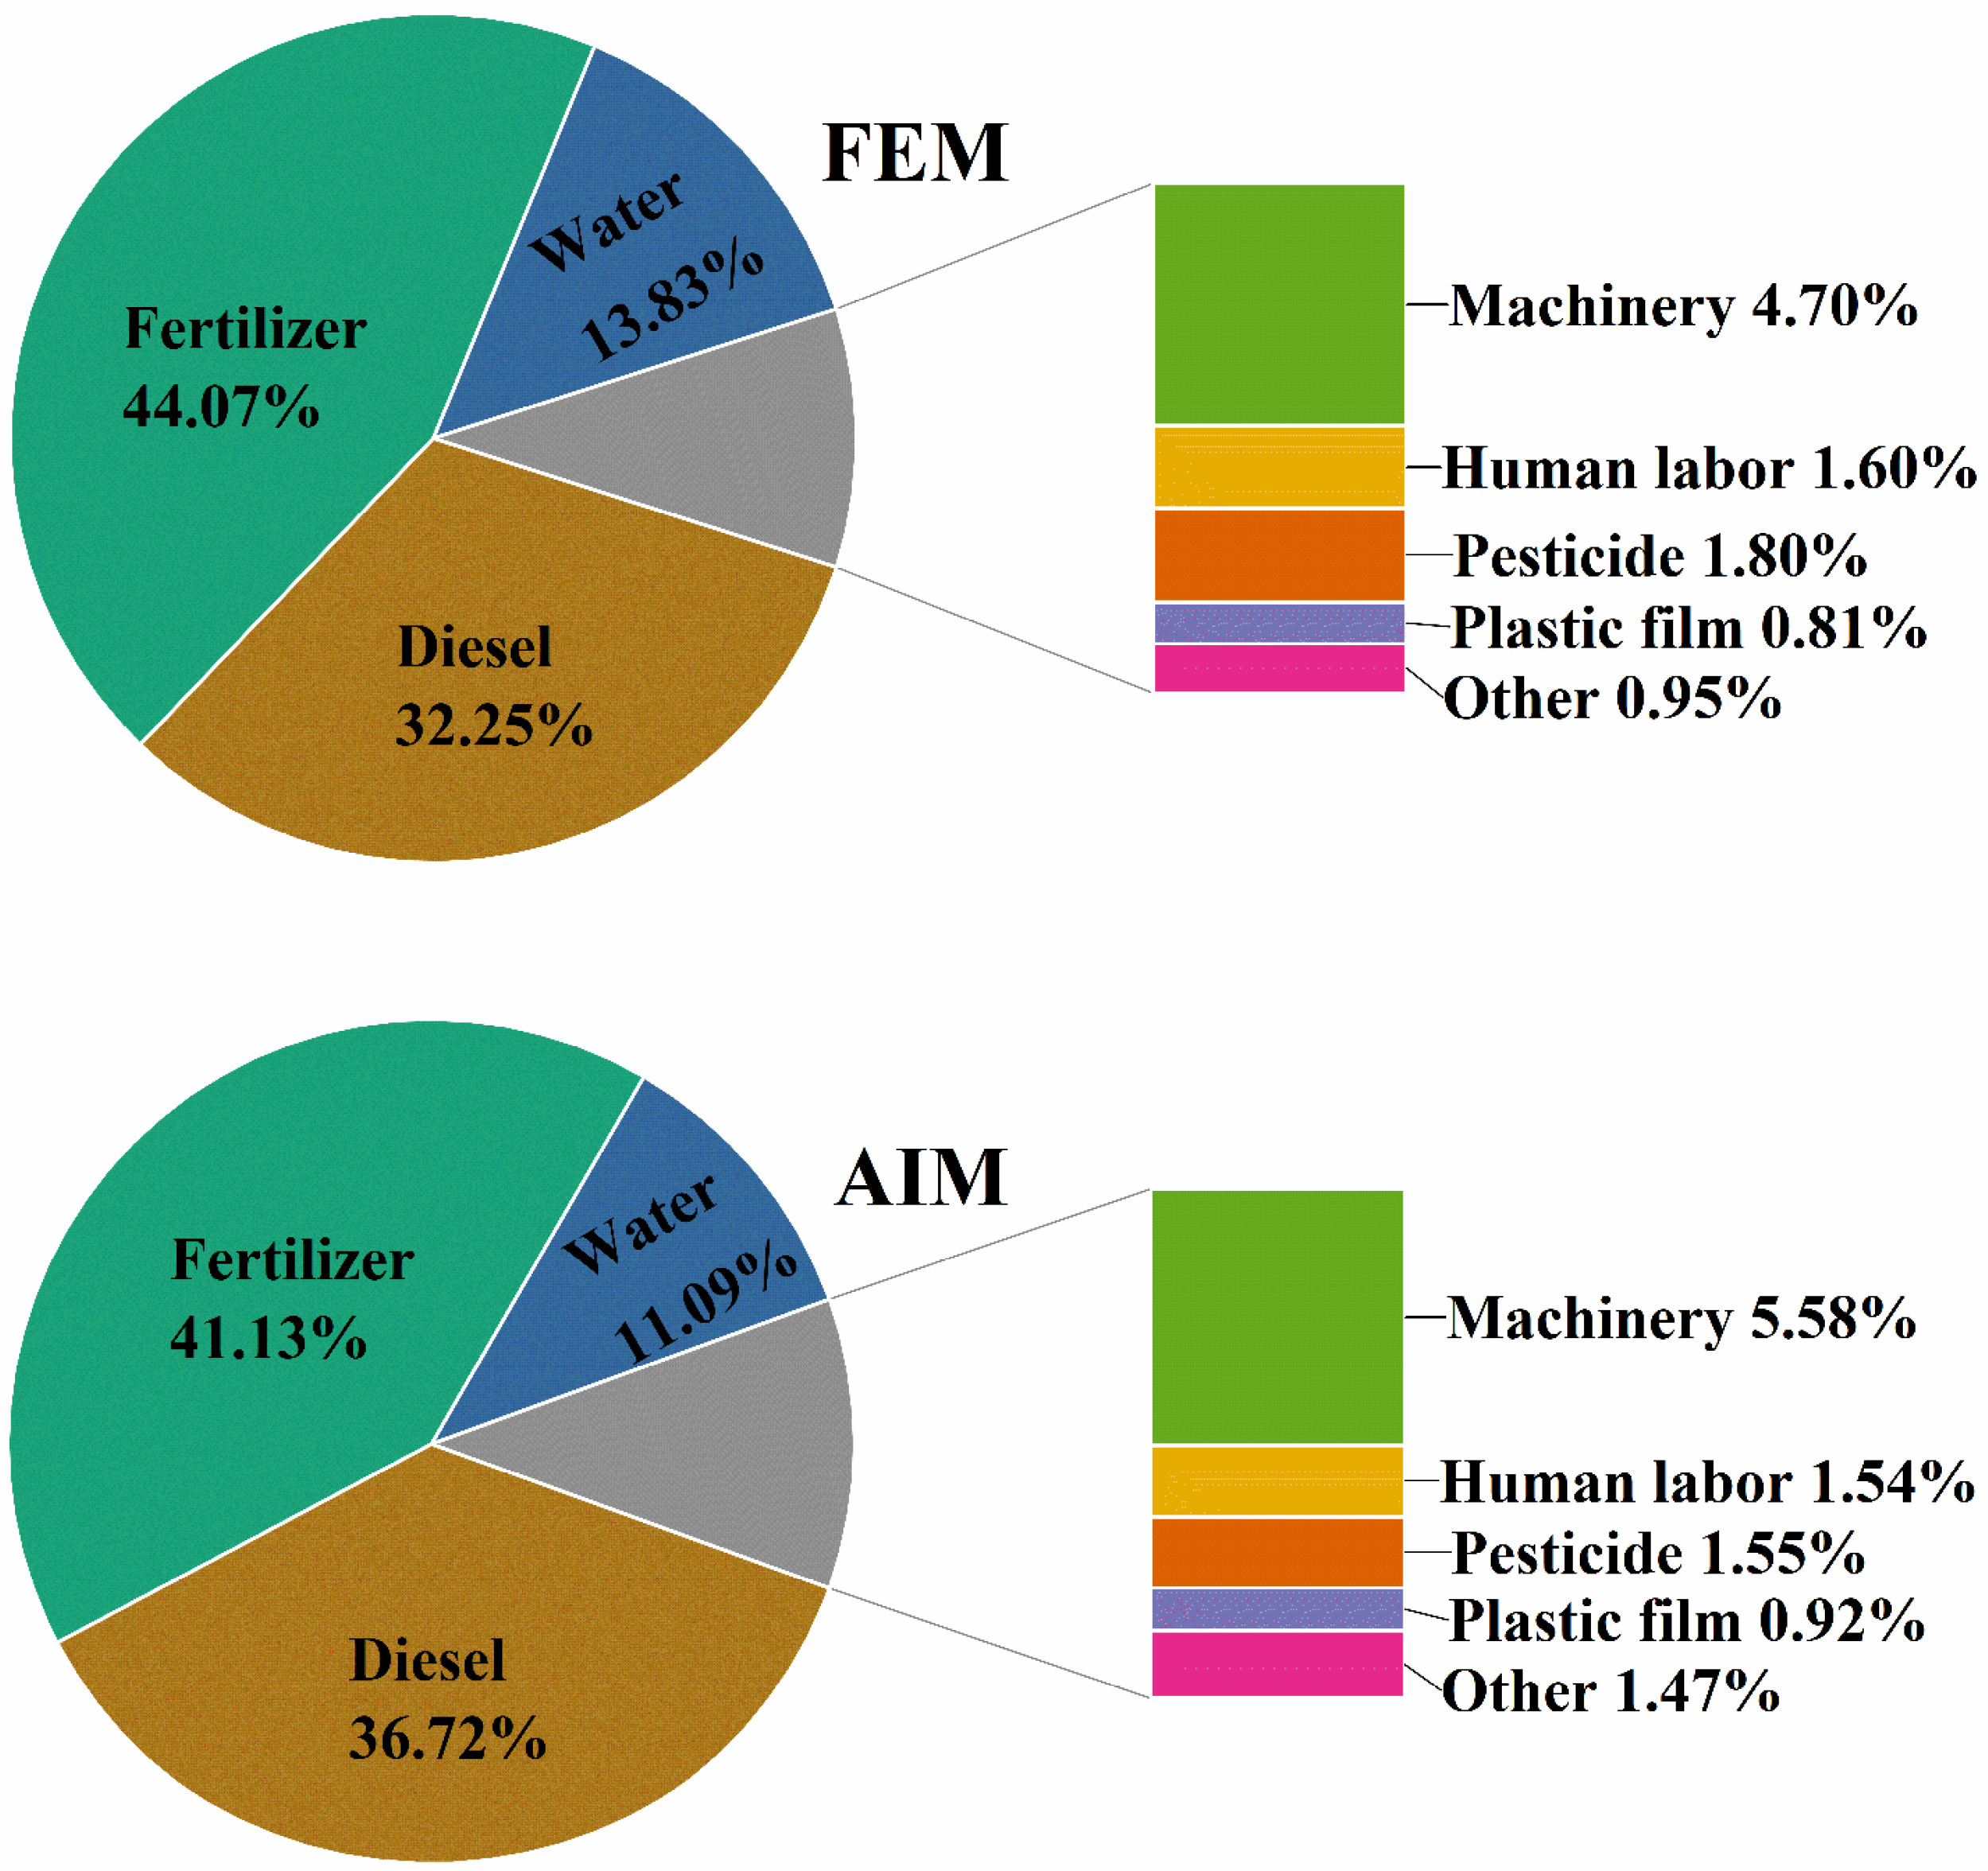
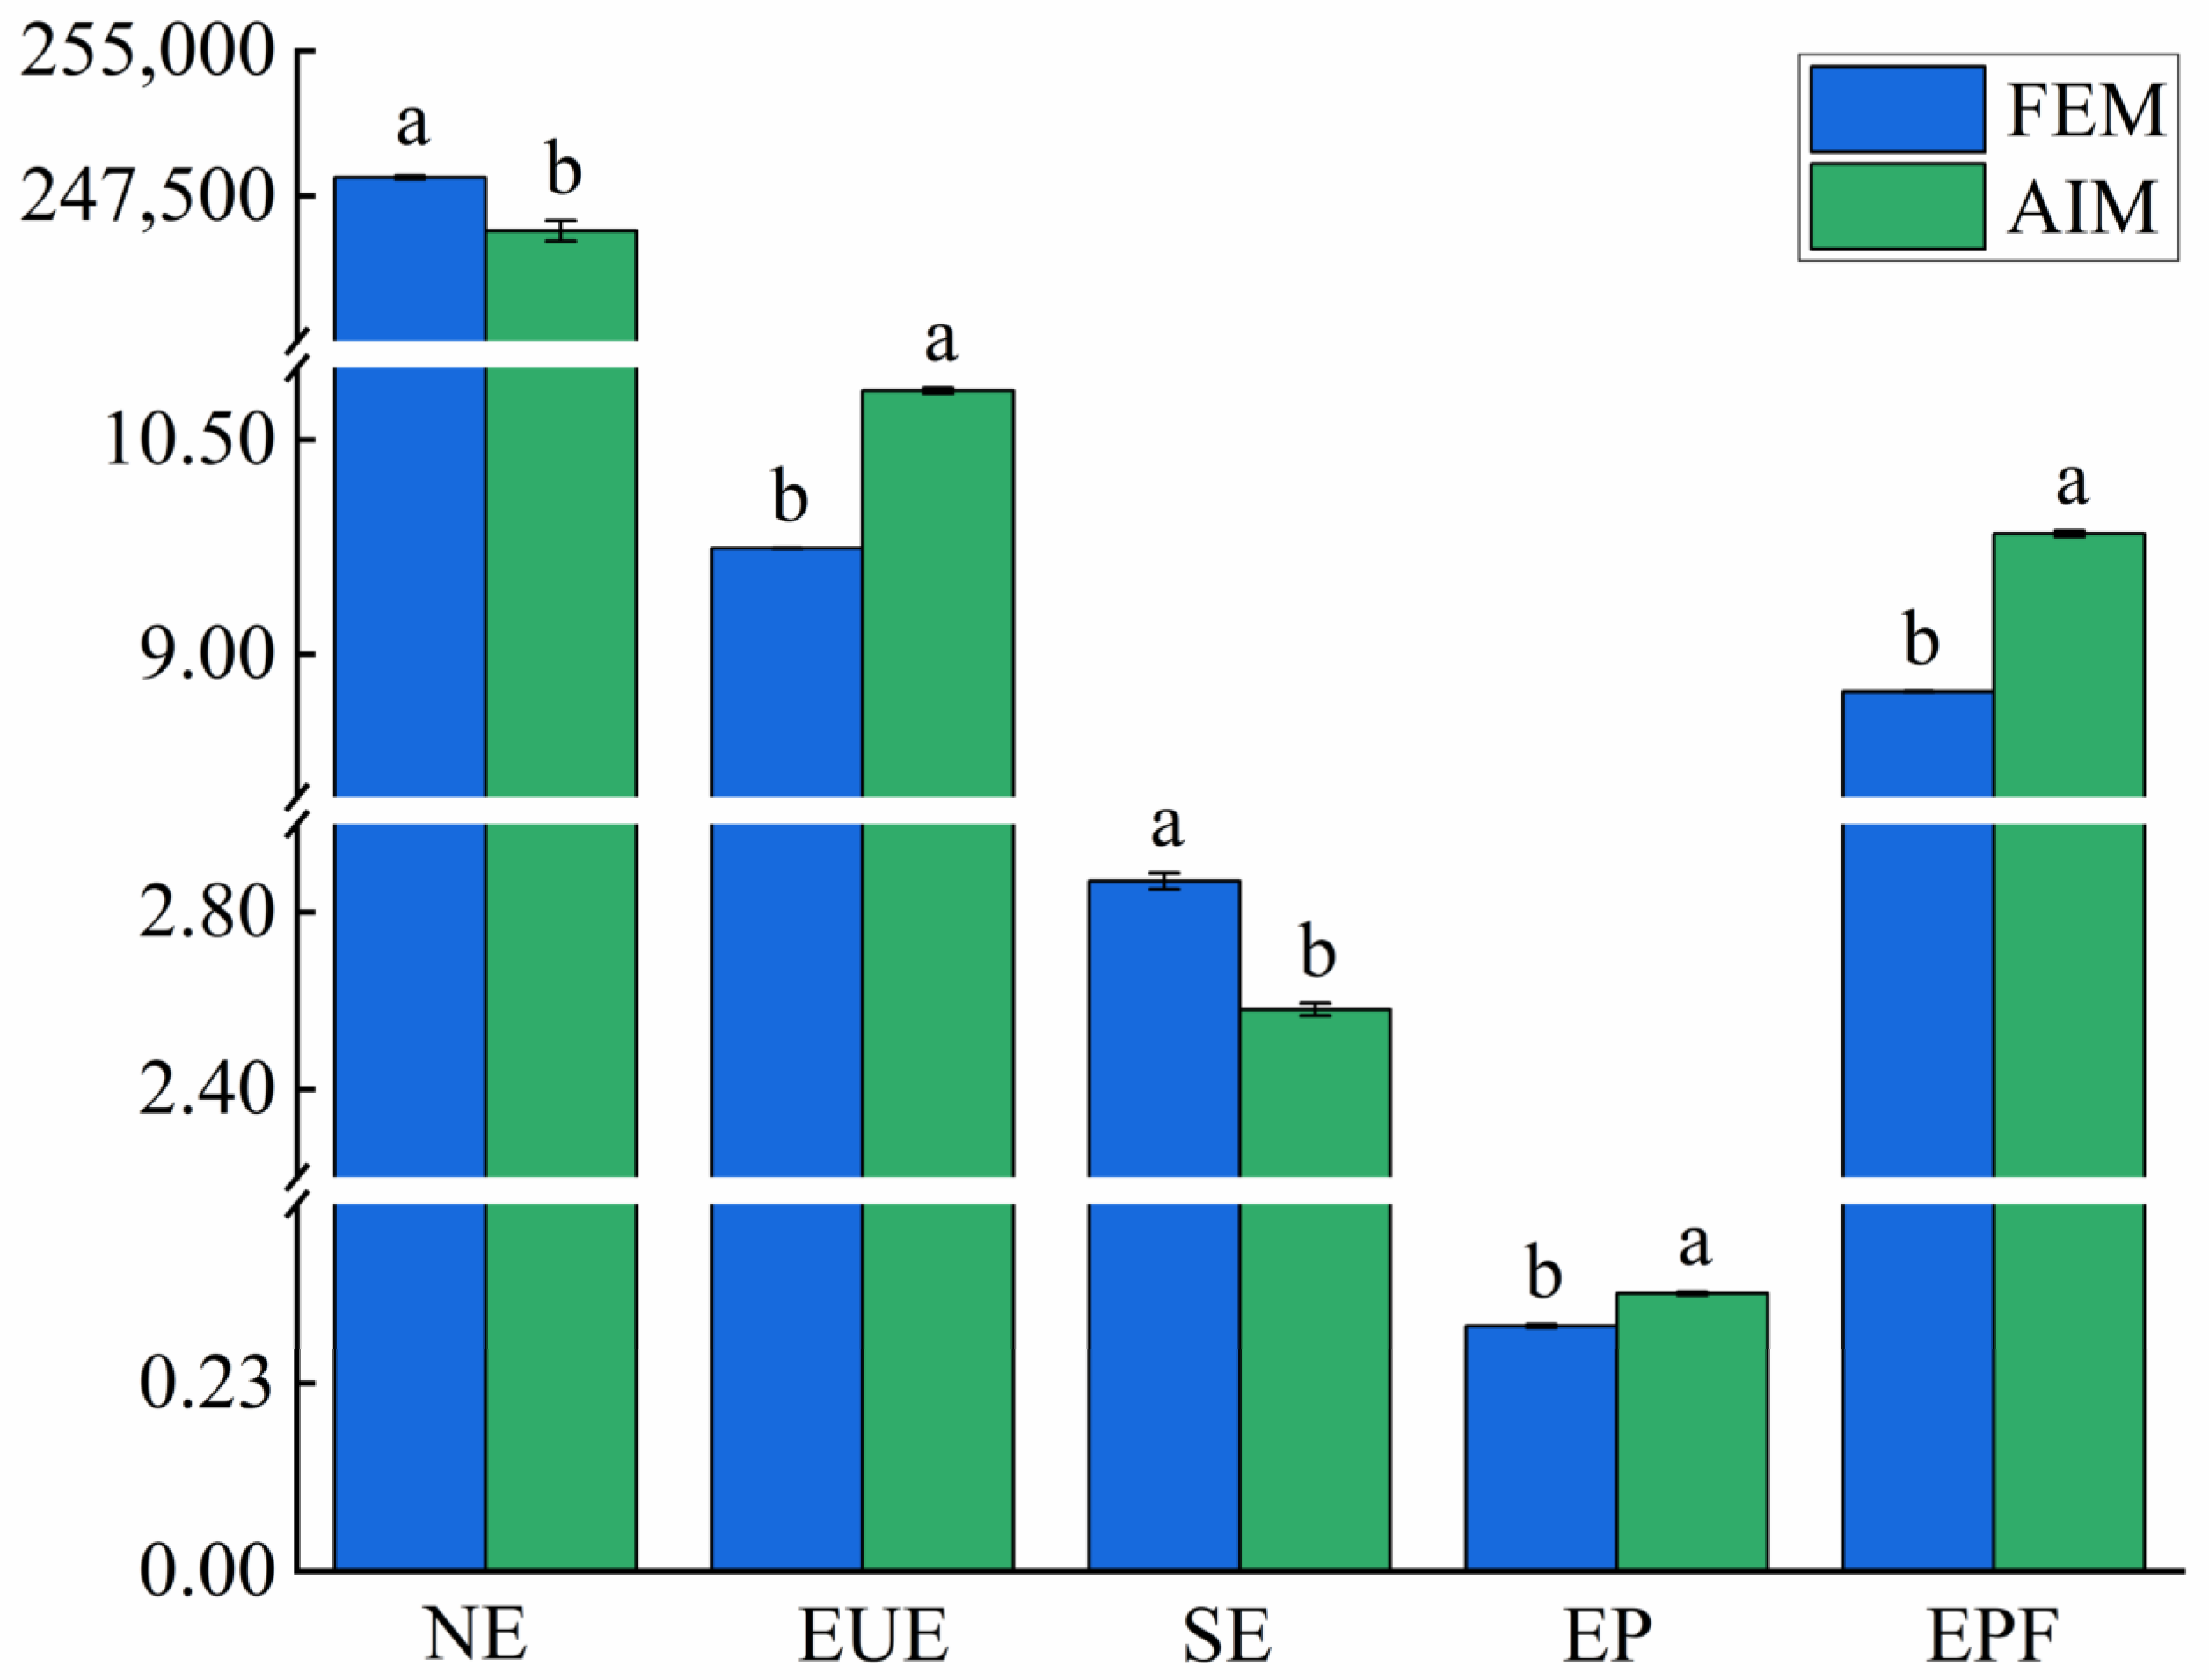
3.2. Energy Flow under the Two Water and Fertilizer Management Models
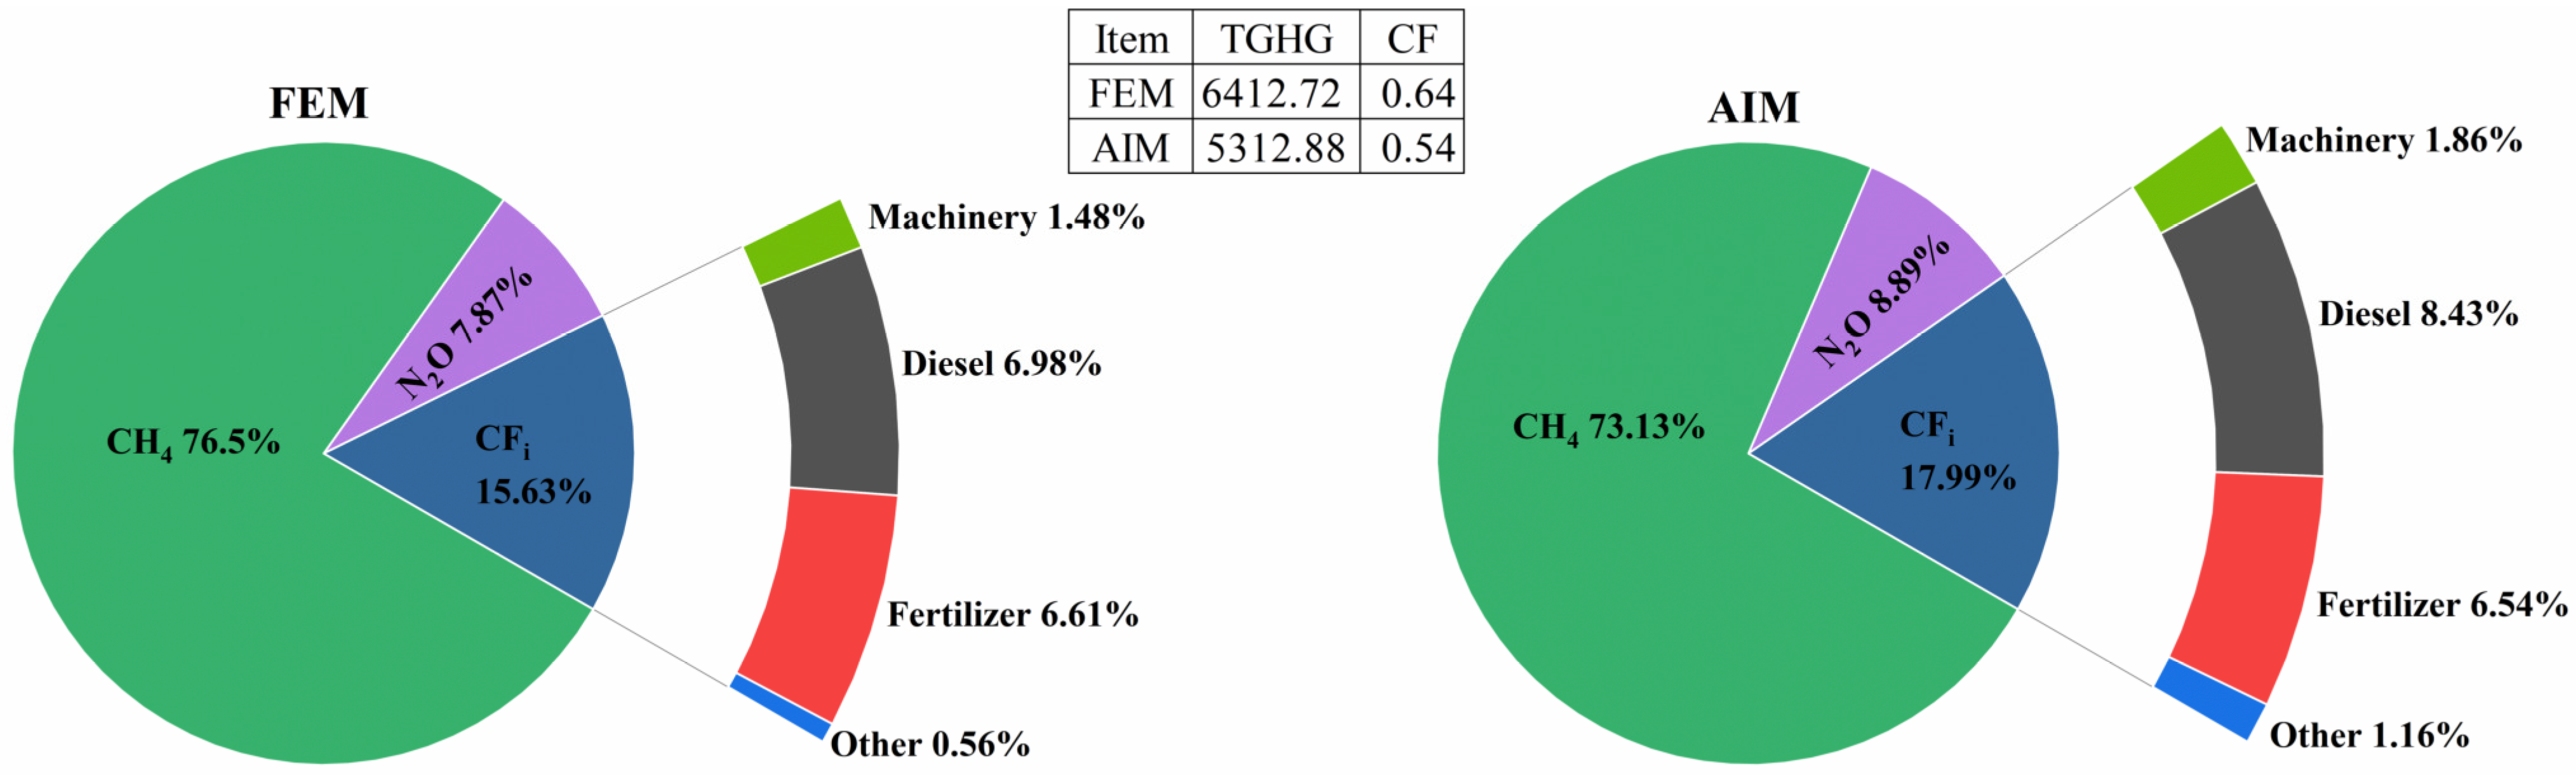
3.3. Carbon Footprint Analysis under the Two Water and Fertilizer Management Models
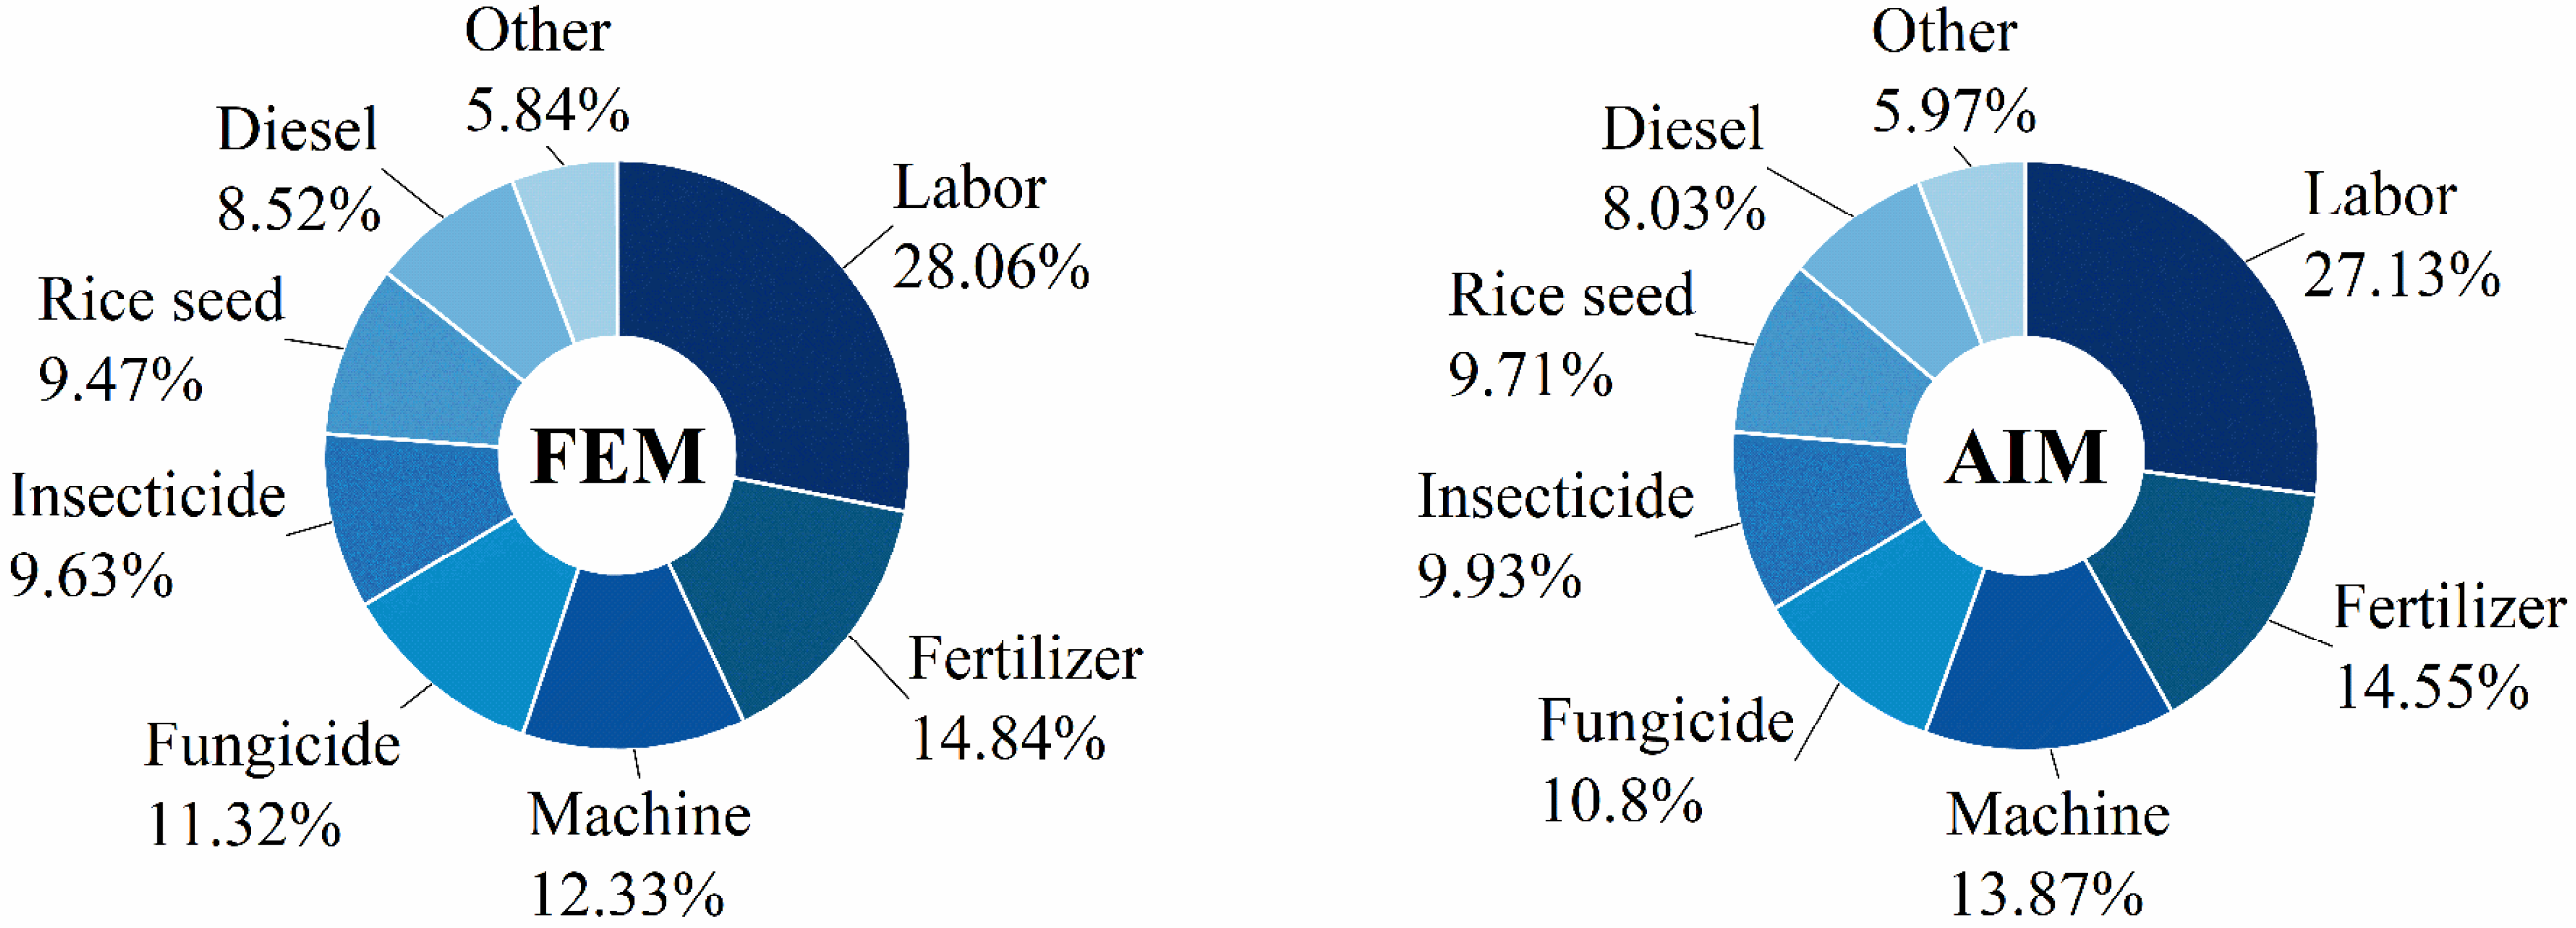
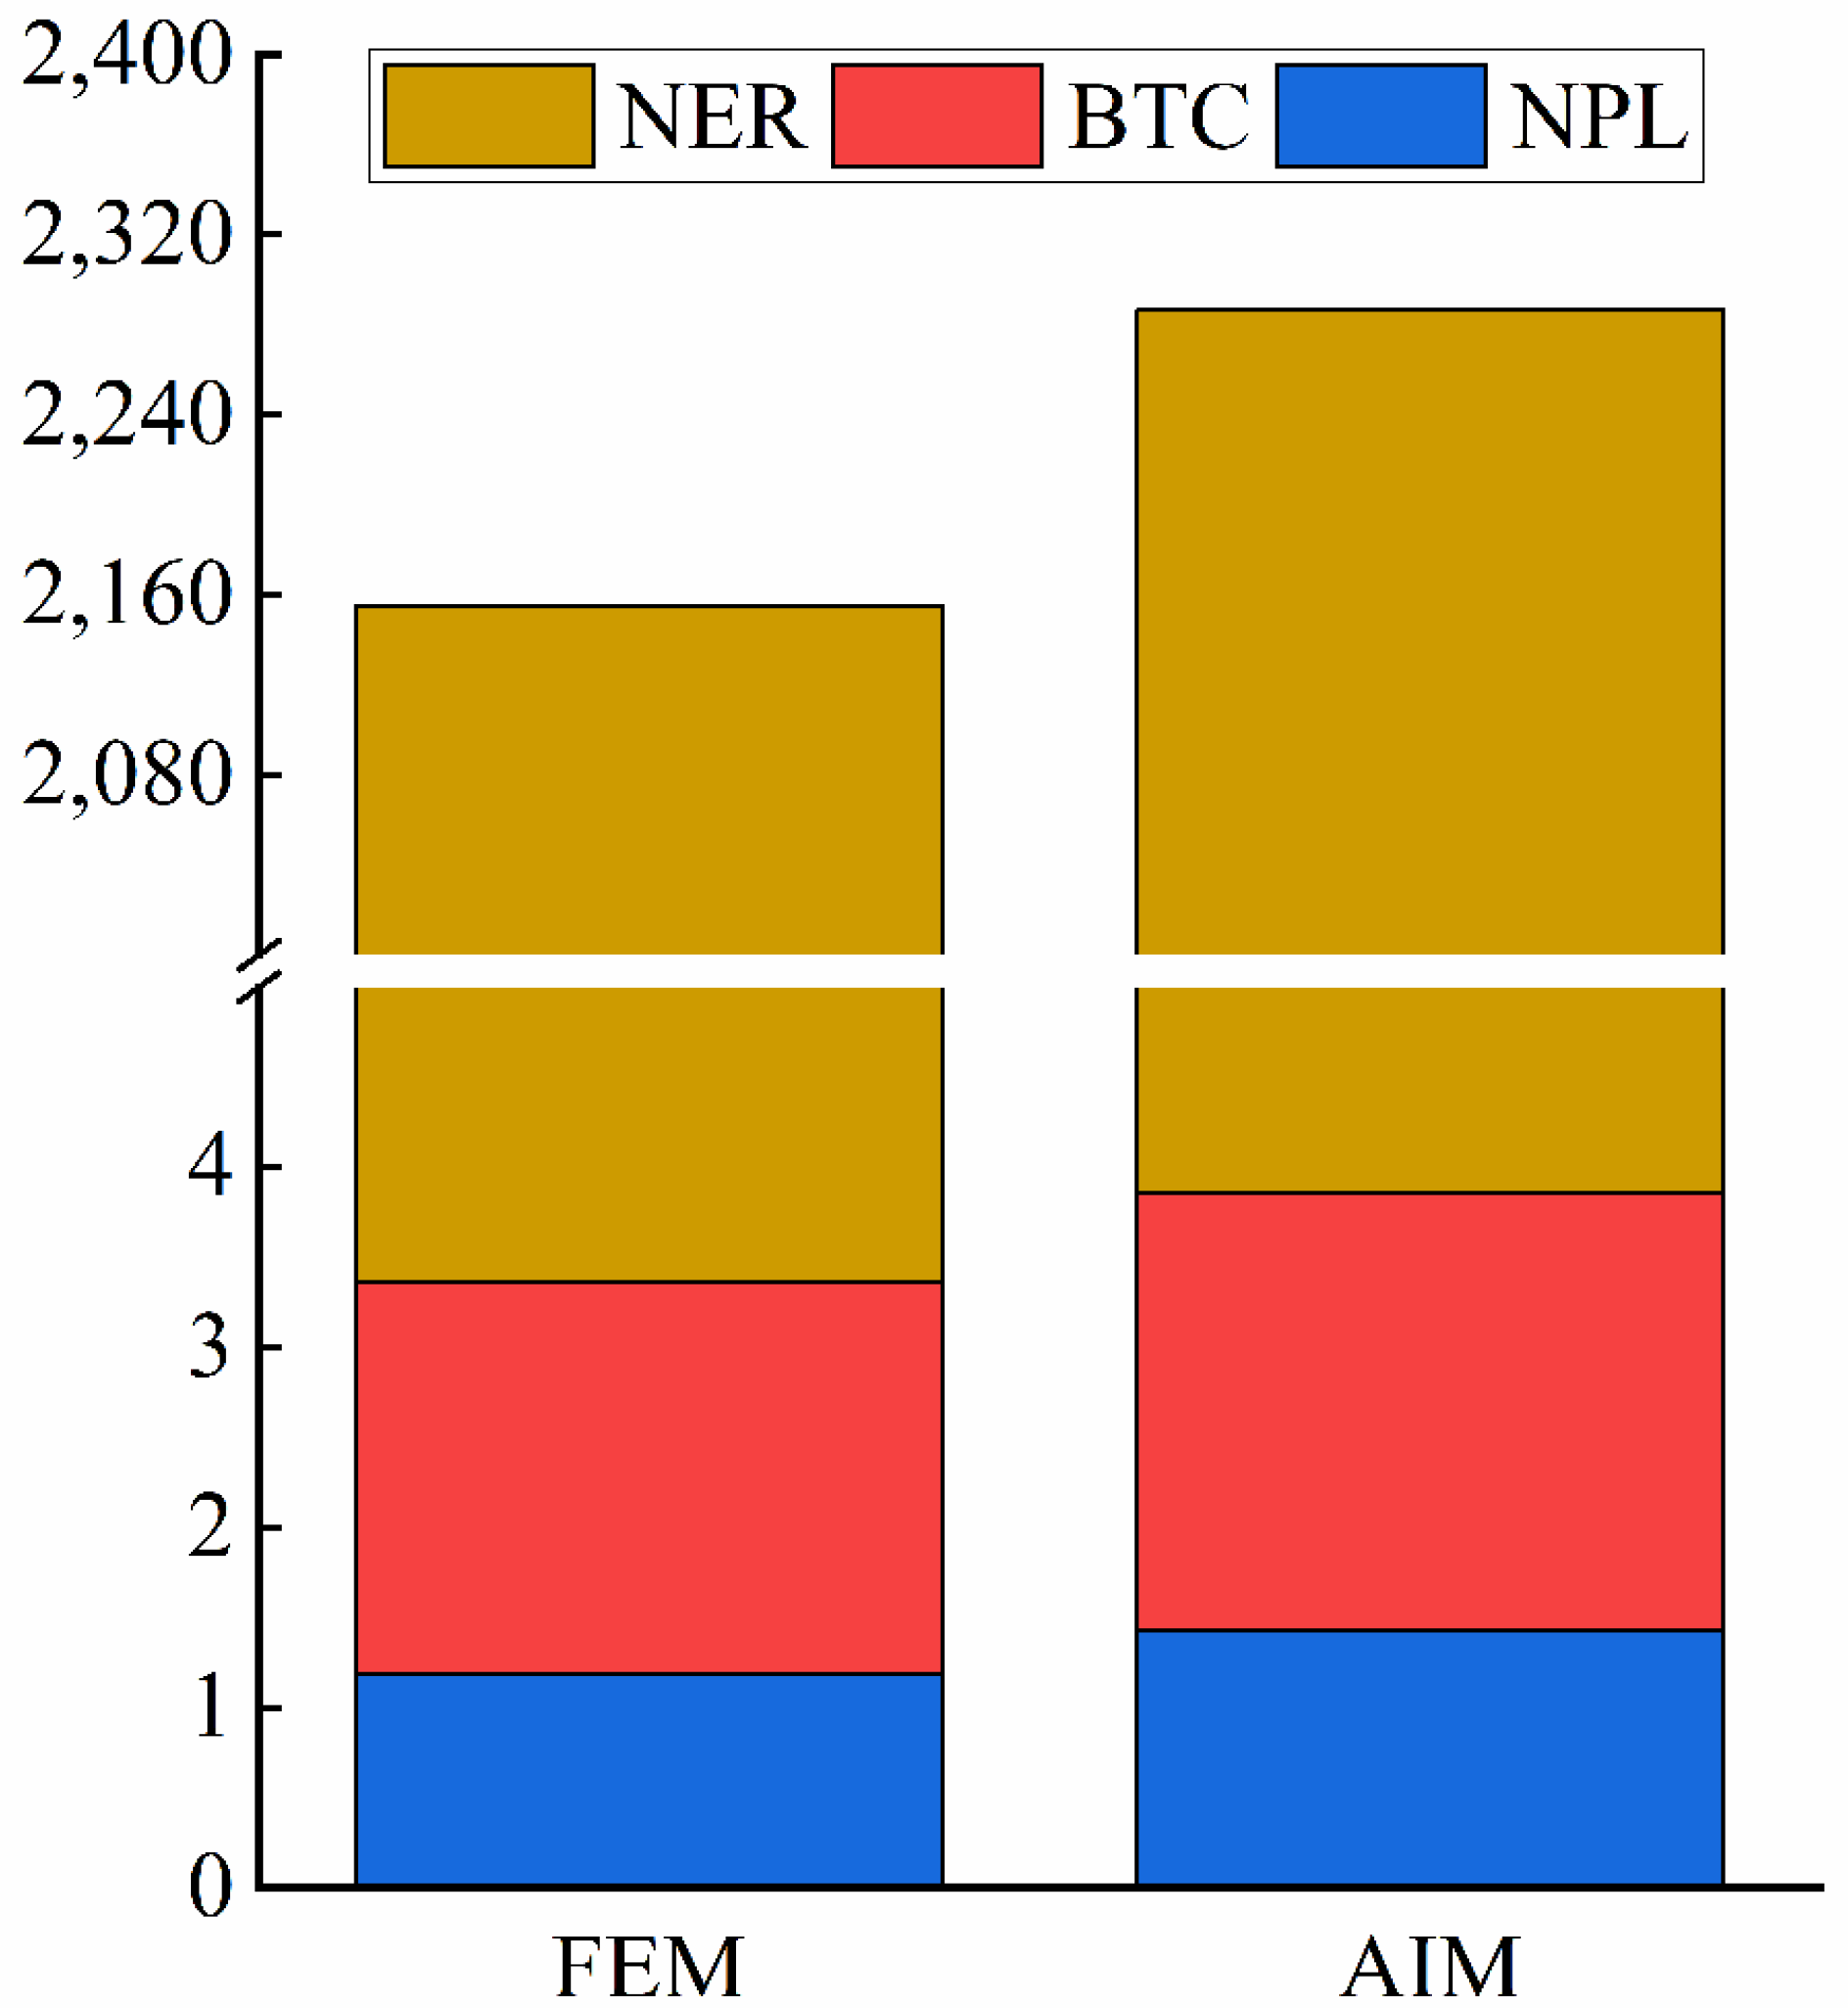
3.4. Economic Benefit Analysis under the Two Water and Fertilizer Management Models
4. Discussion
4.1. Effect of Different Water and Fertilizer Management Practices on Rice Yield
4.2. Effect of Different Water and Fertilizer Management on Energy Utilization in Rice Production
4.3. Effects of Different Water and Fertilizer Management on the CF of Rice Paddies
4.4. Impact of Different Water and Fertilizer Management on Economic Efficiency of Rice Production
5. Conclusions
Supplementary Materials
Author Contributions
Funding
Institutional Review Board Statement
Data Availability Statement
Conflicts of Interest
Abbreviations
References
- Balaine, N.; Carrijo, D.R.; Adviento-Borbe, M.A.; Linquist, B. Greenhouse Gases from Irrigated Rice Systems under Varying Severity of Alternate-Wetting and Drying Irrigation. Soil Sci. Soc. Am. J. 2019, 9, 1533–1541. [Google Scholar] [CrossRef]
- Novoa, V.; Rojas, O.; Ahumada-Rudolph, R.; Arumí, J.L.; Munizaga, J.; de la Barrera, F.; Cabrera-Pardo, J.R.; Rojas, C. Water footprint and virtual water flows from the Global South: Foundations for sustainable agriculture in periods of drought. Sci. Total Environ. 2023, 869, 161526. [Google Scholar] [CrossRef]
- Tian, S.; Xu, Y.; Wang, Q.; Zhang, Y.; Yuan, X.; Ma, Q.; Feng, X.; Ma, H.; Liu, J.; Liu, C.; et al. The effect of optimizing chemical fertilizers consumption structure to promote environmental protection, crop yield and reduce greenhouse gases emission in China. Sci. Total Environ. 2023, 857, 159349. [Google Scholar] [CrossRef] [PubMed]
- Rogelj, J.; Shindell, D.; Jiang, K.; Forster, P.; Ginzburg, V. Mitigation Pathways Compatible with 1.5 °C in the Context of Sustainable Development 2019. In Global Warming of 1.5 °C; Intergovernmental Panel on Climate Change: Geneva, Switzerland, 2018. [Google Scholar]
- He, A.; Yuan, B.; Jin, Z.; Man, J.; Peng, S.; Zhang, L.; Liu, H.; Nie, L. Comparative study on annual yield, water consumption, irrigation water use efficiency and economic benefits of different rice-oilseed rape rotation systems in Central China. Agric. Water Manag. 2021, 247, 106741. [Google Scholar] [CrossRef]
- An, Y.; Li, Q.; Zhang, L. Managing Agricultural Water Use in a Changing Climate in China. Sustain. Prod. Consum. 2022, 33, 978–990. [Google Scholar] [CrossRef]
- Zheng, W.; Luo, B.; Hu, X. The determinants of farmers’ fertilizers and pesticides use behavior in China: An explanation based on label effect. J. Clean. Prod. 2020, 272, 123054. [Google Scholar] [CrossRef]
- Fang, N.; Yu, L.; Lu, Z. Application Effects of Stabilized Fertilizer with Reduced Amount and Frequency on Rice. Asian Agric. Res. 2019, 11, 67–69+80. [Google Scholar] [CrossRef]
- Hu, L.; Zhang, X.; Zhou, Y. Farm size and fertilizer sustainable use: An empirical study in Jiangsu, China. J. Integr. Agric. 2019, 18, 2898–2909. [Google Scholar] [CrossRef]
- Gao, Y.; Sun, C.; Ramos, T.B.; Huo, Z.; Huang, G.; Xu, X. Modeling nitrogen dynamics and biomass production in rice paddy fields of cold regions with the ORYZA-N model. Ecol. Model. 2023, 475, 110184. [Google Scholar] [CrossRef]
- Khalil, M. NON-CO2 greenhouse gases in the atmosphere. Energy Environ. 1999, 24, 645–661. [Google Scholar] [CrossRef]
- Tang, J.; Wang, J.; Li, Z.; Wang, S.; Qu, Y. Effects of Irrigation Regime and Nitrogen Fertilizer Management on CH4, N2O and CO2 Emissions from Saline–Alkaline Paddy Fields in Northeast China. Sustainability 2018, 10, 475. [Google Scholar] [CrossRef]
- Li, Q.; Chen, Q.; Lv, R.; Liu, W.; Zhao, L.; Zhang, J.; Guo, Q.; Qiu, X.; You, H. Spring soil CO2 and CH4 emissions in the Yellow River Delta wetland, China. J. Sea Res. 2022, 190, 102280. [Google Scholar] [CrossRef]
- Zhong, Y.; Wang, X.; Yang, J.; Zhao, X.; Ye, X. Exploring a suitable nitrogen fertilizer rate to reduce greenhouse gas emissions and ensure rice yields in paddy fields. Sci. Total Environ. 2016, 565, 420–426. [Google Scholar] [CrossRef] [PubMed]
- Chuan, L.; Zheng, H.; Zhao, J.; Sun, S.; Zhang, J. The development of integrated management of water and fertilizer. In Proceedings of the 2nd International Conference on Energy, Environment and Materials Science(EEMS 2016), Singapore, 29–31 July 2016. [Google Scholar]
- Wang, J.; Du, G.; Tian, J.; Jiang, C.; Zhang, Y.; Zhang, W. Mulched drip irrigation increases cotton yield and water use efficiency via improving fine root plasticity. Agric. Water Manag. 2021, 255, 106992. [Google Scholar] [CrossRef]
- Li, H.; Mei, X.; Wang, J.; Huang, F.; Hao, W.; Li, B. Drip fertigation significantly increased crop yield, water productivity and nitrogen use efficiency with respect to traditional irrigation and fertilization practices: A meta-analysis in China. Agric. Water Manag. 2021, 244, 106534. [Google Scholar] [CrossRef]
- Singandhupe, R.B.; Rao, G.G.S.N.; Patil, N.G.; Brahmanand, P.S. Fertigation studies and irrigation scheduling in drip irrigation system in tomato crop (Lycopersicon esculentum L.). Eur. J. Agron. 2003, 19, 327–340. [Google Scholar] [CrossRef]
- Zong, R.; Wang, Z.; Zhang, J.; Li, W. The response of photosynthetic capacity and yield of cotton to various mulching practices under drip irrigation in Northwest China. Agric. Water Manag. 2021, 249, 106814. [Google Scholar] [CrossRef]
- Yasuor, H.; Yermiyahu, U.; Ben-Gal, A. Consequences of irrigation and fertigation of vegetable crops with variable quality water: Israel as a case study. Agric. Water Manag. 2020, 242, 106362. [Google Scholar] [CrossRef]
- Zheng, H.; Chuan, L.; Zhao, J.; Sun, S.; Zhang, J. Overview of Water and Fertilizer Integration Development. In Proceedings of the 2016 International Conference on Advances in Energy, Environment and Chemical Science (AEECS 2016), Changsha, China, 23–24 April 2016. [Google Scholar] [CrossRef]
- Yang, Z.; Li, N.; Ma, P.; Li, Y.; Zhang, R.; Song, Q.; Guo, X.; Sun, Y.; Xu, H.; Ma, J. Improving nitrogen and water use efficiencies of hybrid rice through methodical nitrogen–water distribution management. Field Crops Res. 2020, 246, 107698. [Google Scholar] [CrossRef]
- Franco, W.; Barbera, F.; Bartolucci, L.; Felizia, T.; Focanti, F. Developing intermediate machines for high-land agriculture. Dev. Eng. 2020, 5, 100050. [Google Scholar] [CrossRef]
- Yadav, G.S.; Babu, S.; Das, A.; Mohapatra, K.P.; Singh, R.; Avasthe, R.K.; Roy, S. No-till and mulching enhance energy use efficiency and reduce carbon footprint of a direct-seeded upland rice production system. J. Clean. Prod. 2020, 271, 122700. [Google Scholar] [CrossRef]
- Guo, C.; Yang, C.; Fu, J.; Song, Y.; Chen, S.; Li, H.; Ma, C. Effects of crop rotation on sugar beet growth through improving soil physicochemical properties and microbiome. Ind. Crops Prod. 2024, 212, 118331. [Google Scholar] [CrossRef]
- Yuan, S.; Cassman, K.G.; Huang, J.; Peng, S.; Grassini, P. Can ratoon cropping improve resource use efficiencies and profitability of rice in central China? Field Crops Res. 2019, 234, 66–72. [Google Scholar] [CrossRef] [PubMed]
- Erdal, G.; Esengün, K.; Erdal, H.; Gündüz, O. Energy use and economical analysis of sugar beet production in Tokat province of Turkey. Energy 2007, 32, 35–41. [Google Scholar] [CrossRef]
- Yilmaz, I.; Akcaoz, H.; Ozkan, B. An analysis of energy use and input costs for cotton production in Turkey. Renew. Energy 2005, 30, 145–155. [Google Scholar] [CrossRef]
- Sayin, C.; Mencet, M.N.; Ozkan, B. Assessing of energy policies based on Turkish agriculture: Current status and some implications. Energy Policy 2005, 33, 2361–2373. [Google Scholar] [CrossRef]
- Esengun, K.; Guenduez, O.; Erdal, G. Input–output energy analysis in dry apricot production of Turkey. Energy Convers. Manag. 2007, 48, 592–598. [Google Scholar] [CrossRef]
- Karkacier, O.; Goktolga, Z.G. Input–output analysis of energy use in agriculture. Energy Convers. Manag. 2005, 46, 1513–1521. [Google Scholar] [CrossRef]
- Ozkan, B.; Fert, C.; Karadeniz, C.F. Energy and cost analysis for greenhouse and open-field grape production. Energy 2007, 32, 1500–1504. [Google Scholar] [CrossRef]
- Pathak, B.S.; Bining, A.S. Energy use pattern and potential for energy saving in rice-wheat cultivation. Energy Agric. 1985, 4, 271–278. [Google Scholar] [CrossRef]
- Ozkan, B.; Akcaoz, H.; Pert, C. Energy input–output analysis in Turkish agriculture. Renew. Energy 2004, 29, 39–51. [Google Scholar] [CrossRef]
- Karki, S.; Adviento-Borbe, M.A.A.; Massey, J.H.; Reba, M.L. Assessing Seasonal Methane and Nitrous Oxide Emissions from Furrow-Irrigated Rice with Cover Crops. Agriculture 2021, 11, 261. [Google Scholar] [CrossRef]
- Li, S.; Guo, L.; Cao, C.; Li, C. Integrated assessment of carbon footprint, energy budget and net ecosystem economic efficiency from rice fields under different tillage modes in central China. J. Clean. Prod. 2021, 295, 126398. [Google Scholar] [CrossRef]
- Field, C.B.; Barros, V.R.; Intergovernmental Panel on Climate Change. Climate Change 2014: Impacts, Adaptation, and Vulnerability. Part A: Global and Sectoral Aspects. Contribution of Working Group II to the Fifth Assessment Report of the Intergovernmental Panel on Climate Change. Guangdong Agricultural Sciences; Cambridge University: Cambridge, UK, 2014. [Google Scholar]
- Dyer, J.A.; Desjardins, R.L. Carbon Dioxide Emissions Associated with the Manufacturing of Tractors and Farm Machinery in Canada. Biosyst. Eng. 2006, 93, 107–118. [Google Scholar] [CrossRef]
- Cheng, K.; Pan, G.; Smith, P.; Luo, T.; Ming, Y. Carbon footprint of China’s crop production—An estimation using agro-statistics data over 1993–2007. Agric. Ecosyst. Environ. 2011, 142, 231–237. [Google Scholar] [CrossRef]
- Brentrup, F.; Hoxha, A.; Christensen, B. Carbon footprint analysis of mineral fertilizer production in Europe and other world regions. In Proceedings of the 10th International Conference on Life Cycle Assessment of Food (LCA Food 2016), Dublin, Ireland, 19–21 October 2016. [Google Scholar]
- Lal, R. Carbon emission from farm operations. Environ. Int. 2004, 30, 981–990. [Google Scholar] [CrossRef] [PubMed]
- Guo, J.; Song, Z.; Zhu, Y.; Wei, W.; Li, S.; Yu, Y. The characteristics of yield-scaled methane emission from paddy field in recent 35-year in China: A meta-analysis. J. Clean. Prod. 2017, 161, 1044–1050. [Google Scholar] [CrossRef]
- Narita, N.; Sagisaka, M.; Inaba, A. Life cycle inventory analysis of CO2 emissions—Manufacturing commodity plastics in Japan. Int. J. Life Cycle Assess. 2002, 7, 277–282. [Google Scholar] [CrossRef]
- Zhang, W.-F.; Dou, Z.-X.; He, P.; Ju, X.-T.; Powlson, D.; Chadwick, D.; Norse, D.; Lu, Y.-L.; Zhang, Y.; Wu, L.; et al. New technologies reduce greenhouse gas emissions from nitrogenous fertilizer in China. Proc. Natl. Acad. Sci. USA 2013, 110, 8375–8380. [Google Scholar] [CrossRef]
- Samoy-Pascual, K.; Lampayan, R.M.; Remocal, A.T.; Orge, R.F.; Tokida, T.; Mizoguchi, M. Optimizing the lateral dripline spacing of drip-irrigated aerobic rice to increase water productivity and profitability under the water-limited condition. Field Crops Res. 2022, 287, 108669. [Google Scholar] [CrossRef]
- Hou, Q.; Ni, Y.; Huang, S.; Zuo, T.; Wang, J.; Ni, W. Effects of manure substitution for chemical fertilizers on rice yield and soil labile nitrogen in paddy fields of China: A meta-analysis. Pedosphere 2022, 33, 172–184. [Google Scholar] [CrossRef]
- Liao, R.; Wu, W.; Hu, Y.; Xu, D.; Huang, Q.; Wang, S. Micro-irrigation strategies to improve water-use efficiency of cherry trees in Northern China. Agric. Water Manag. 2019, 221, 388–396. [Google Scholar] [CrossRef]
- Sidhu, H.S.; Jat, M.L.; Singh, Y.; Sidhu, R.K.; Gupta, N.; Singh, P.; Singh, P.; Jat, H.S.; Gerard, B. Sub-surface drip fertigation with conservation agriculture in a rice-wheat system: A breakthrough for addressing water and nitrogen use efficiency. Agric. Water Manag. 2019, 216, 273–283. [Google Scholar] [CrossRef]
- Kazemi, H.; Kamkar, B.; Lakzaei, S.; Badsar, M.; Shahbyki, M. Energy flow analysis for rice production in different geographical regions of Iran. Energy 2015, 84, 390–396. [Google Scholar] [CrossRef]
- Poddar, R.; Acharjee, P.U.; Bhattacharyya, K.; Patra, S.K. Effect of irrigation regime and varietal selection on the yield, water productivity, energy indices and economics of rice production in the lower Gangetic Plains of Eastern India. Agric. Water Manag. 2022, 262, 107327. [Google Scholar] [CrossRef]
- Rahman, S.; Barmon, B.K.; Rahman, S. Energy productivity and efficiency of the ‘gher’ (prawn-fish-rice) farming system in Bangladesh. Energy 2012, 43, 293–300. [Google Scholar] [CrossRef]
- Kosemani, B.S.; Bamgboye, A.I. Energy input-output analysis of rice production in Nigeria. Energy 2020, 207, 118258. [Google Scholar] [CrossRef]
- Yang, Z.; Cheng, Q.; Liao, Q.; Fu, H.; Zhang, J.; Zhu, Y.; Lv, T.; Sun, Y.; Ma, J.; Li, N. Can reduced-input direct seeding improve resource use efficiencies and profitability of hybrid rice in China? Sci. Total Environ. 2022, 833, 155186. [Google Scholar] [CrossRef] [PubMed]
- Abadi, B.; Sadeghfam, S.; Ehsanitabar, A.; Nadiri, A.A. Investigating socio-economic and hydrological sustainability of ancient Qanat water systems in arid regions of central Iran. Groundw. Sustain. Dev. 2023, 23, 100988. [Google Scholar] [CrossRef]
- Faryadi, M. Soil security under salt attack: Protection of the soil against the salinization caused by drying up of Lake Urmia. Soil Secur. 2023, 13, 100113. [Google Scholar] [CrossRef]
- Pishgar-Komleh, S.H.; Sefeedpari, P.; Rafiee, S. Energy and economic analysis of rice production under different farm levels in Guilan province of Iran. Energy 2011, 36, 5824–5831. [Google Scholar] [CrossRef]
- Chatterjee, R. How state governance can offer a new paradigm to energy transition in Indian agriculture? Energy Policy 2024, 185, 113965. [Google Scholar] [CrossRef]
- Chaudhary, V.P.; Gangwar, B.; Pandey, D.K.; Gangwar, K.S. Energy auditing of diversified rice-wheat cropping systems in Indo-gangetic plains. Energy 2009, 34, 1091–1096. [Google Scholar] [CrossRef]
- Abubakar, A.; Gambo, J.; Umar, S. An Overview of the Effects of Some Agricultural Policies in Nigeria-1960–2020. Niger. Agric. J. 2021, 52, 151–162. [Google Scholar]
- Farneselli, M.; Benincasa, P.; Tosti, G.; Simonne, E.; Guiducci, M.; Tei, F. High fertigation frequency improves nitrogen uptake and crop performance in processing tomato grown with high nitrogen and water supply. Agric. Water Manag. 2015, 154, 52–58. [Google Scholar] [CrossRef]
- Zheng, J.; Zhou, M.; Zhu, B.; Fan, J.; Lin, H.; Ren, B.; Zhang, F. Drip fertigation sustains crop productivity while mitigating reactive nitrogen losses in Chinese agricultural systems: Evidence from a meta-analysis. Sci. Total Environ. 2023, 886, 163804. [Google Scholar] [CrossRef] [PubMed]
- Du, X.; Hao, M.; Guo, L.; Li, S.; Hu, W.; Sheng, F.; Li, C.F. Integrated assessment of carbon footprint and economic profit from paddy fields under microbial decaying agents with diverse water regimes in central China. Agric. Water Manag. 2022, 262, 107403. [Google Scholar] [CrossRef]
- Zhou, Y.; Liu, K.; Harrison, M.T.; Fahad, S.; Gong, S.; Zhu, B.; Liu, Z. Shifting Rice Cropping Systems Mitigates Ecological Footprints and Enhances Grain Yield in Central China. Front. Plant Sci. 2022, 13, 895402. [Google Scholar] [CrossRef]
- Xu, Y.; Su, B.; Wang, H.; He, J.; Yang, Y. Analysis of the water balance and the nitrogen and phosphorus runoff pollution of a paddy field in situ in the Taihu Lake basin. Paddy Water Environ. 2020, 18, 385–398. [Google Scholar] [CrossRef]
- Xu, C.; Chen, Z.; Ji, L.; Lu, J. Carbon and Nitrogen Footprints of Major Cereal Crop Production in China: A Study Based on Farm Management Surveys. Rice Sci. 2022, 29, 288–299. [Google Scholar] [CrossRef]
- Zeng, Y.; Li, F. Impacts of Nitrogen Fertilizer Substitution on Greenhouse Gas Emission in a Paddy Field of South China Under Ridge Irrigation. J. Soil Sci. Plant Nutr. 2022, 22, 837–847. [Google Scholar] [CrossRef]
- Zhao, Z.; Yue, Y.; Sha, Z.; Li, C.; Deng, J.; Zhang, H.; Gao, M.; Cao, L. Assessing impacts of alternative fertilizer management practices on both nitrogen loading and greenhouse gas emissions in rice cultivation. Atmos. Environ. 2015, 119, 393–401. [Google Scholar] [CrossRef]
- Wu, B.; Mu, C.C.; Liu, H.; Xu, Y.K.; Zhang, Y.; Yang, J.S.; Xu, W.N. Quantifying soil nitrous oxide emissions in spring freezing-thawing period over different vegetation types in Northeast China. J. Mt. Sci. 2022, 19, 1919–1930. [Google Scholar] [CrossRef]
- Song, X.; Ju, X.; Topp, C.F.E.; Rees, R.M. Oxygen Regulates Nitrous Oxide Production Directly in Agricultural Soils. Environ. Sci. Technol. 2019, 53, 12539–12547. [Google Scholar] [CrossRef] [PubMed]
- Lyu, Y.; Zhang, X.; Yang, X.; Wu, J.; Lin, L.; Zhang, Y.; Wang, G.; Xiao, Y.; Peng, H.; Zhu, X.; et al. Performance assessment of rice production based on yield, economic output, energy consumption, and carbon emissions in Southwest China during 2004–2016. Ecol. Indic. 2020, 117, 106667. [Google Scholar] [CrossRef]
- Huang, J.; Yu, X.; Zhang, Z.; Peng, S.; Liu, B.; Tao, X.; He, A.; Deng, N.; Zhou, Y.; Cui, K.; et al. Exploration of feasible rice-based crop rotation systems to coordinate productivity, resource use efficiency and carbon footprint in central China. Eur. J. Agron. 2022, 141, 126633. [Google Scholar] [CrossRef]
- Liu, T.Q.; Li, S.H.; Guo, L.G.; Cao, C.G.; Li, C.F.; Zhai, Z.B.; Zhou, J.Y.; Mei, Y.M.; Ke, H.J. Advantages of nitrogen fertilizer deep placement in greenhouse gas emissions and net ecosystem economic benefits from no-tillage paddy fields. J. Clean. Prod. 2020, 263, 121322. [Google Scholar] [CrossRef]
- Htwe, T.; Sinutok, S.; Chotikarn, P.; Amin, N.; Akhtaruzzaman, M.; Techato, K.; Hossain, T. Energy use efficiency and cost-benefits analysis of rice cultivation: A study on conventional and alternative methods in Myanmar. Energy 2021, 214, 119104. [Google Scholar] [CrossRef]
- He, X.; Kang, H.; Gu, Y.; Song, Y. Optioning Water Rights:A Potential Alternative to the Hanjiang-Weihe River Water Transfer Project, China. Chin. Geogr. Sci. 2020, 30, 1039–1051. [Google Scholar] [CrossRef]


| Year | Total Rainfall of WGS (mm) | Total Sunshine Hours of WGS (h) | Average Diurnal Temperature of WGS (°C) |
|---|---|---|---|
| 2020 | 433.4 | 694.4 | 23.55 |
| 2021 | 585.2 | 630.8 | 23.05 |
| Year | Organic Matter (g kg−1) | Total N (g kg−1) | Available N (mg kg−1) | Available P (mg kg−1) | Available K (mg kg−1) |
|---|---|---|---|---|---|
| 2020 | 24.08 | 1.89 | 104.66 | 26.54 | 106.54 |
| 2021 | 21.38 | 1.57 | 97.33 | 20.88 | 83.76 |
| S.N. | Farmers’ Enhanced Water and Fertilizer Management (FEM) | Water–Fertilizer Integration Management (AIM) | |
|---|---|---|---|
| A. | Field preparation | ||
| 1. | Irrigation | The water level in the field was irrigated to 5 cm. | Same as FEM |
| 2. | Tillage | Wheat straw from the previous crop was mixed into the plough layer after the land had been tilled twice. | Same as FEM |
| 3. | Leveling | The soil was raked once, with a field height difference of less than 5 cm. | Same as FEM |
| 4. | Seed preparation | After sterilization and a 36 h soaking period, the seeds were drained and placed in seedling trays. | Same as FEM |
| B. | Planting | Seedlings were transplanted using a tractor-driven transplanter. | Same as FEM |
| C. | Field management | ||
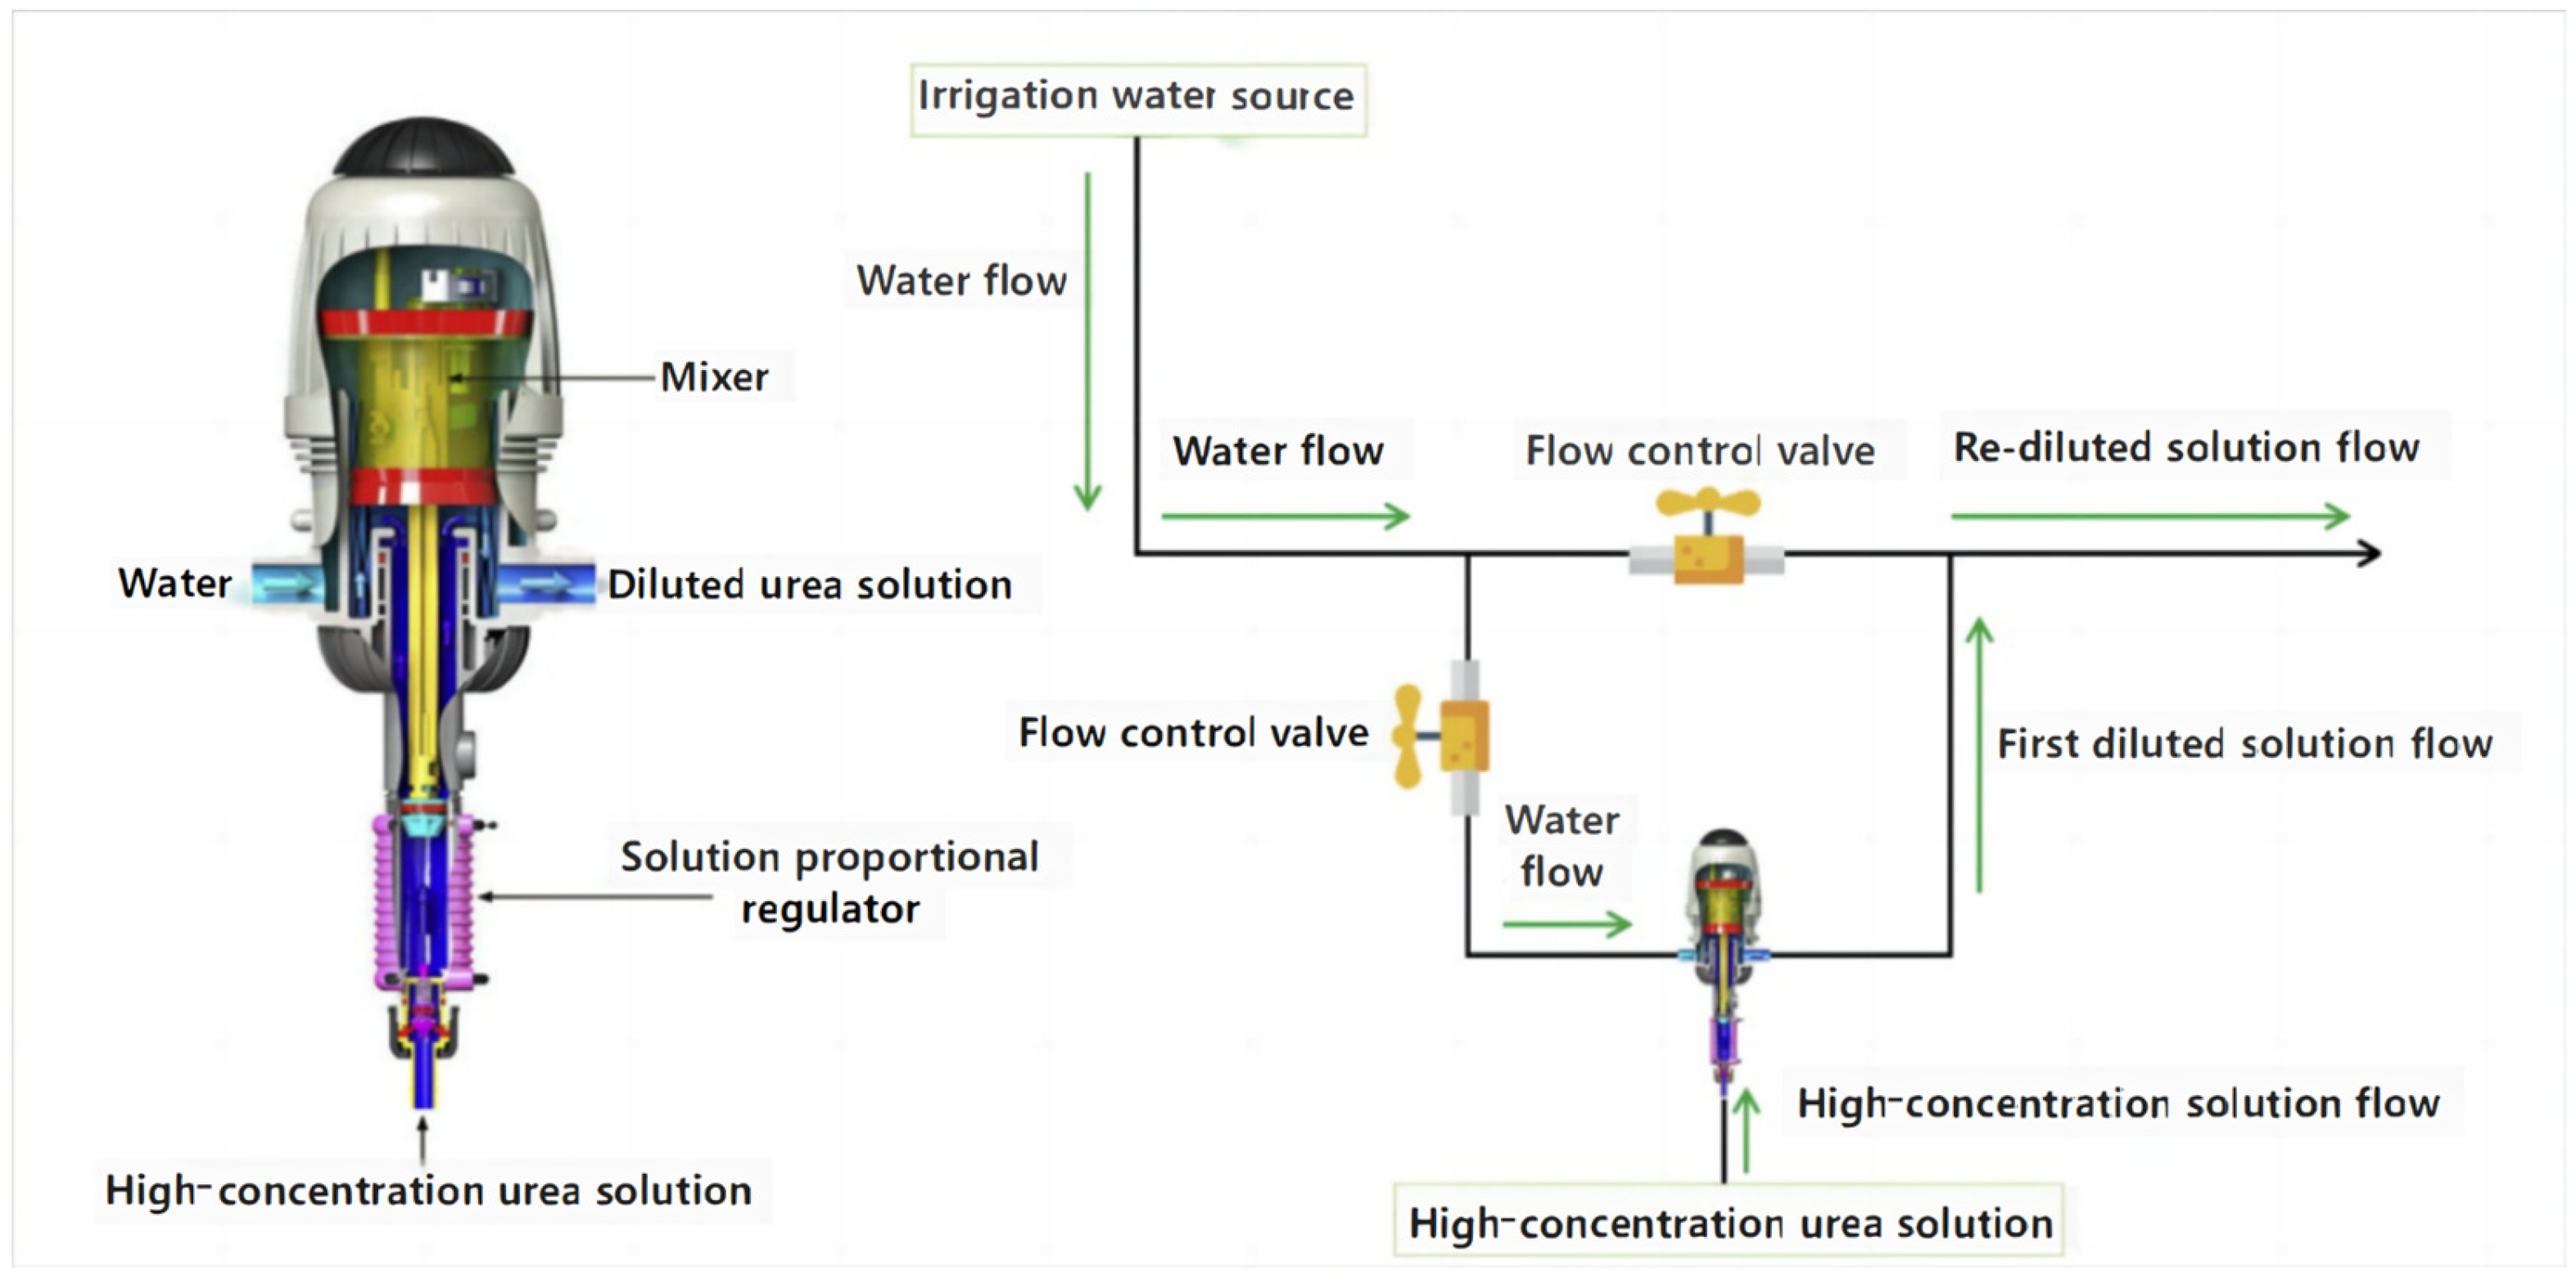
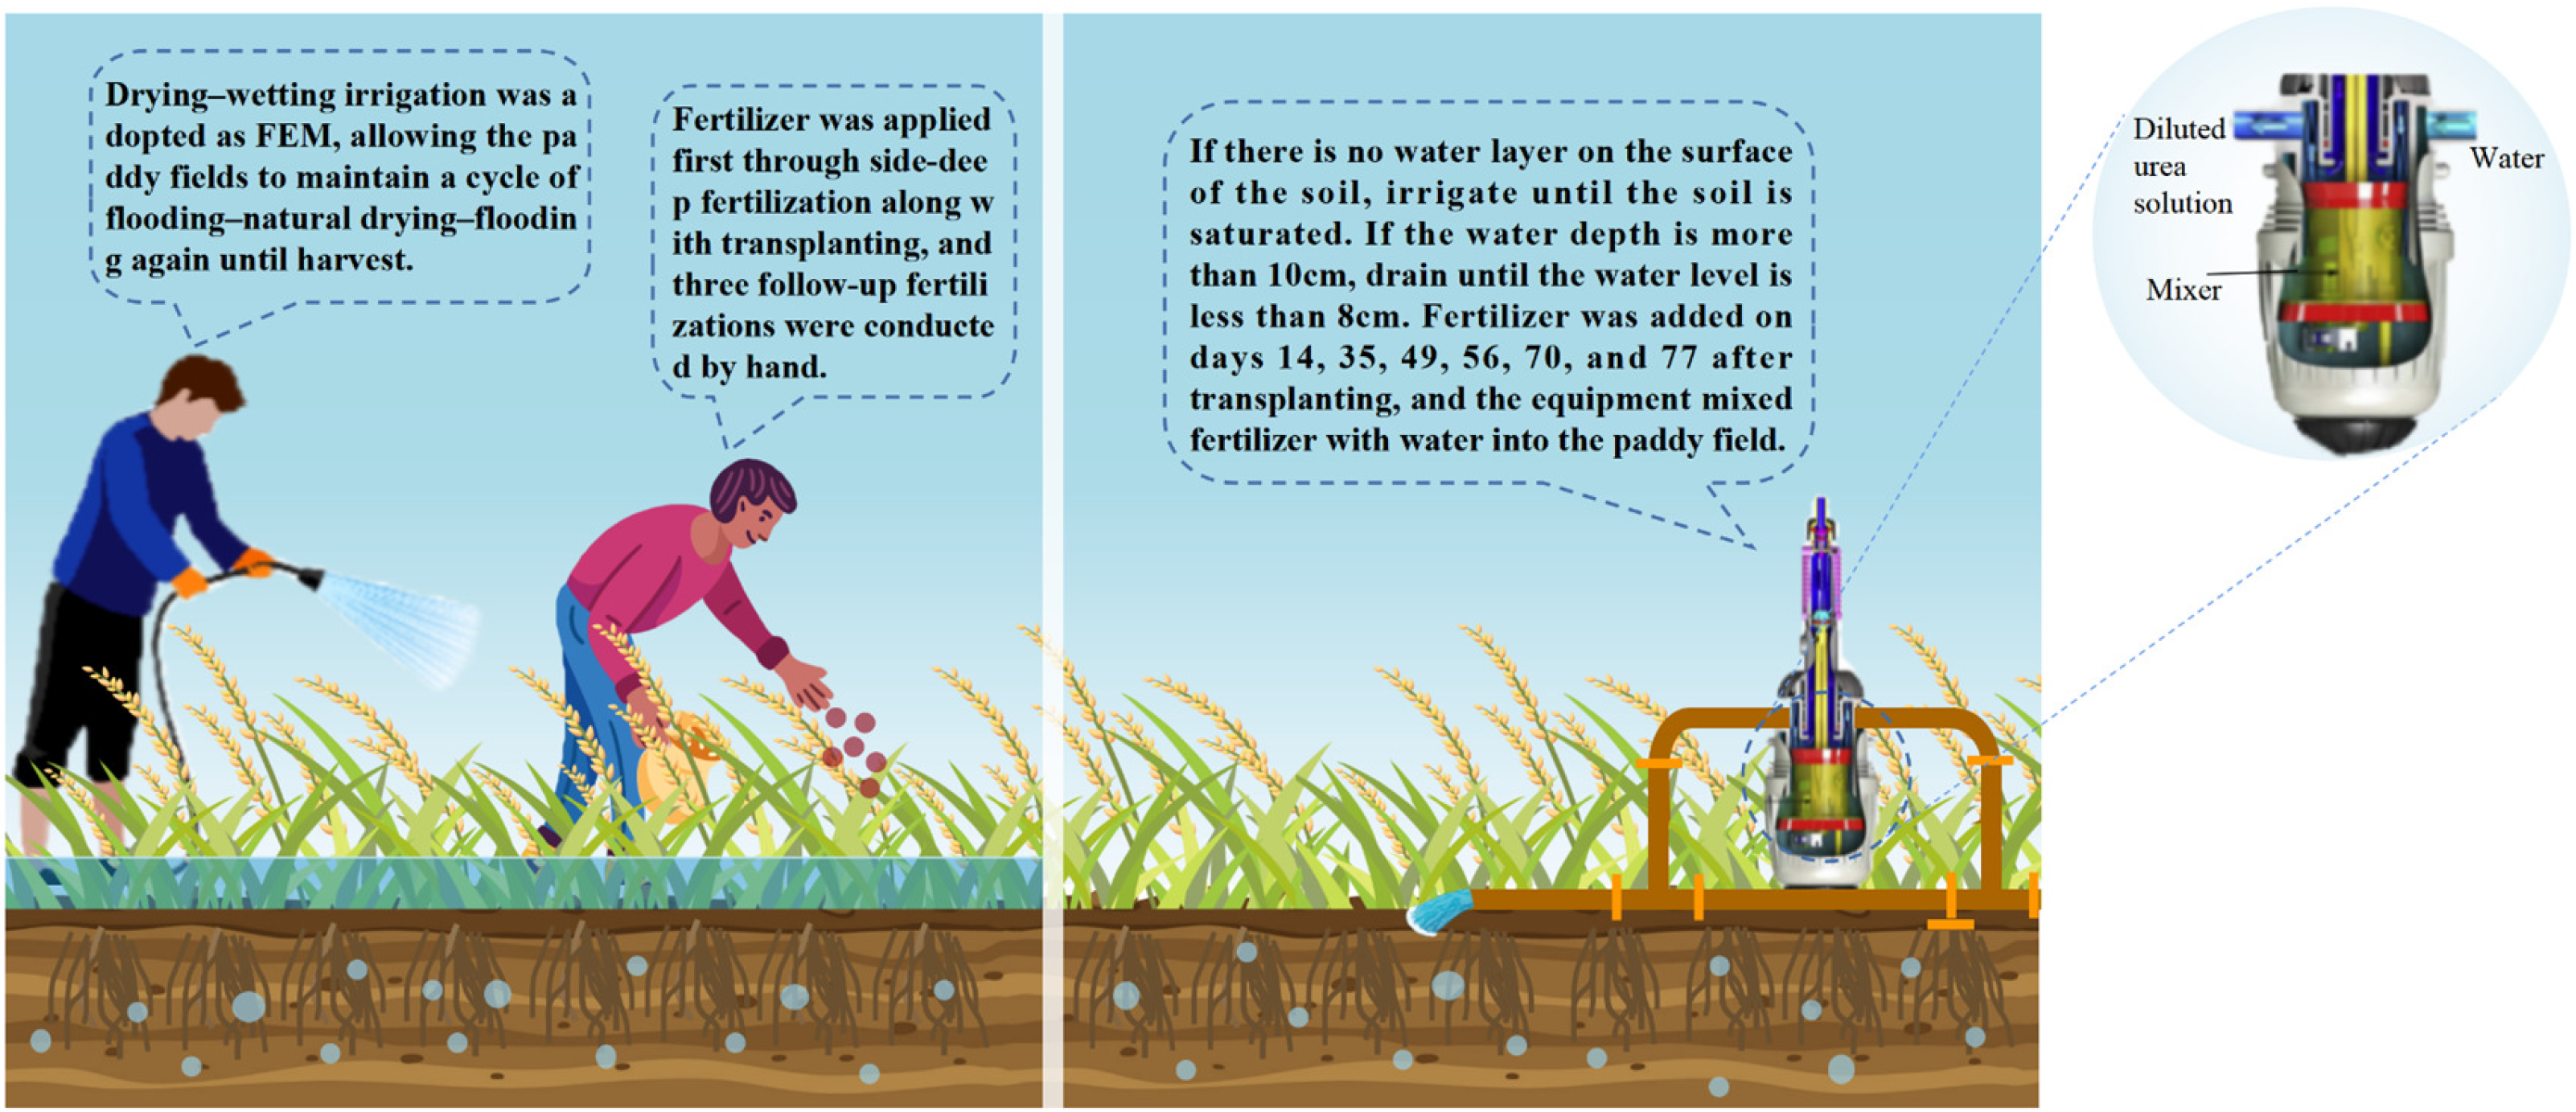
| 1. | Irrigation and drainage | Drying–wetting irrigation was adopted in FEM. The water layer was maintained at 5 cm or more in the first week after transplanting and 1 cm to 3 cm in the second to fourth week. Paddy field sun-drying was observed for weeks 5 to 6. After that, the water layer was kept at 1 cm to 3 cm during the heading period. If the water depth exceeded 10 cm before heading, the field was drained to a water layer of no more than 8 cm. After heading, a water layer of about 5 cm was formed after irrigation. Due to the natural drying of the field, cracks began to appear on the surface, and a water layer of about 5 cm was formed again after irrigation. This cycle was maintained until the mature stage. In this study, 4 irrigations and 1 drainage were conducted in 2020, while 5 irrigations and 2 drainages were conducted in 2021. The single irrigation volume ranged from 452 to 933 m3·ha−1. | A water layer of about 5 cm was maintained first. Then, water and fertilizer integration management was carried out after 1 week. A lithium battery–driven water–fertilizer integrator was used to inject the rated concentration of fertilizer solution into the irrigation water at regular intervals, thus mixing it into the flow toward the paddy field. The integrator was equipped with a flow sensor at the irrigation port, and the flow rate of the fertilizer solution was automatically adjusted according to the flow rate of the irrigation water. If there was a water layer in the field, it was irrigated until the water layer was raised by 1 cm; otherwise, it was irrigated until the soil was saturated. If soil cracks exceeded 2 cm due to insufficient precipitation, the field was irrigated until the soil was saturated. If the water depth exceeded 10 cm before heading due to excessive precipitation, the field was drained until the water layer fell no higher than 8 cm. In this study, 8 irrigations and 0 drainage were conducted in 2020, while 8 irrigations and 1 drainage were conducted in 2021. The single irrigation volume ranged from 108 to 551 m3·ha−1. Nitrogen fertilizers of 15, 15, 30, 15, 15, 15, 15, and 15 kg ha−1 (totaling 120 kg ha−1) were applied on days 7, 14, 35, 49, 56, 70, and 77 after transplanting. |
| 2. | Fertilization | Fertilizer was applied first through side–deep fertilization along with transplanting, and three follow–up fertilizations were conducted by hand. Then, nitrogen fertilizer was applied in the ratio of m(base fertilizer)/m(tillering fertilizer)/m(panicle fertilizer) = 3:3:4, and the total nitrogen application was 150 kg·hm−1. | |
| 3. | Pesticide spraying | The first pesticide spraying in the field was conducted using a sprayer along with transplanting, and three more sprayings were conducted using drones. | Same as FEM |
| D | Harvesting and threshing | In the mature stage, the rice was harvested and threshed using a combine harvester. | Same as FEM |
| Items (MJ ha−1) | FEM | AIM |
|---|---|---|
| Machinery | 1335.88 | 1392.58 |
| Human labor | 453.94 | 384.81 |
| Diesel | 9168.61 | 9168.61 |
| Electricity | 4.50 | 101.84 |
| Nitrogen | 9926.95 | 8137.20 |
| Phosphorus | 940.96 | 762.32 |
| Potassium | 1663.02 | 1371.67 |
| Water | 3932.08 | 2768.18 |
| Plastic film | 230.68 | 230.68 |
| Insecticide | 244.90 | 179.12 |
| Herbicide | 126.14 | 99.96 |
| Fungicide | 140.40 | 108.00 |
| Seed | 264.75 | 264.75 |
| Energy input | 28,432.82 | 24,969.74 |
| Rice grain yield | 168,627.85 | 164,695.00 |
| Rice straw yield | 108,257.78 | 105,981.31 |
| Energy output | 276,885.62 | 270,676.31 |
| Particulars (USD·ha−1) | FEM | AIM |
|---|---|---|
| Machine | 223.83 | 231.69 |
| Drone | 41.54 | 41.54 |
| Labor | 509.52 | 431.93 |
| Diesel | 154.68 | 154.68 |
| Urea | 94.62 | 77.56 |
| Superphosphate | 63.03 | 51.07 |
| Muriate of potash | 111.86 | 92.27 |
| Insecticide | 174.87 | 127.90 |
| Herbicide | 63.83 | 50.58 |
| Fungicide | 205.50 | 158.08 |
| Rice seed | 172.00 | 172.00 |
| Plastic film | 0.66 | 0.66 |
| Electricity | 0.10 | 2.26 |
| Total input | 1816.05 | 1592.21 |
| Single-season indica rice | 3967.71 | 3875.18 |
Disclaimer/Publisher’s Note: The statements, opinions and data contained in all publications are solely those of the individual author(s) and contributor(s) and not of MDPI and/or the editor(s). MDPI and/or the editor(s) disclaim responsibility for any injury to people or property resulting from any ideas, methods, instructions or products referred to in the content. |
© 2024 by the authors. Licensee MDPI, Basel, Switzerland. This article is an open access article distributed under the terms and conditions of the Creative Commons Attribution (CC BY) license (https://creativecommons.org/licenses/by/4.0/).
Share and Cite
Liao, Q.; Nie, J.; Yin, H.; Luo, Y.; Shu, C.; Cheng, Q.; Fu, H.; Li, B.; Li, L.; Sun, Y.; et al. Can the Integration of Water and Fertilizer Promote the Sustainable Development of Rice Production in China? Agriculture 2024, 14, 585. https://doi.org/10.3390/agriculture14040585
Liao Q, Nie J, Yin H, Luo Y, Shu C, Cheng Q, Fu H, Li B, Li L, Sun Y, et al. Can the Integration of Water and Fertilizer Promote the Sustainable Development of Rice Production in China? Agriculture. 2024; 14(4):585. https://doi.org/10.3390/agriculture14040585
Chicago/Turabian StyleLiao, Qin, Jiangxia Nie, Huilai Yin, Yongheng Luo, Chuanhai Shu, Qingyue Cheng, Hao Fu, Biao Li, Liangyu Li, Yongjian Sun, and et al. 2024. "Can the Integration of Water and Fertilizer Promote the Sustainable Development of Rice Production in China?" Agriculture 14, no. 4: 585. https://doi.org/10.3390/agriculture14040585