Abstract
The need to monitor changes in the level of agricultural competitiveness of EU member states necessitates the development of an appropriate set of indicators to answer the question of whether a country is improving its competitive position. This paper proposes a synthetic measure for assessing the agricultural competitiveness in the member states of the European Union (EU) from 2012 to 2021. Statistics on the respective indicators were derived from the Eurostat database and Agri-Food Data Portal. The survey was based on linear ordering using a standardised sums approach. This implies that member states vary in competitiveness in the agricultural sector. From 2012 to 2021, the most competitive countries were Denmark, the Netherlands, and Belgium. Simultaneously, the rankings of agricultural competitiveness changed over the 10 years under review. The highest improvement rates were recorded in Finland, Slovakia, and Ireland. However, the differences between the old and new member states are still explicit. None of the new member states of the EU were in the top ten with regard to their agricultural competitiveness. Many areas associated with agriculture in these countries require considerable improvement. We also carried out a principal component analysis (PCA), which allowed us to identify the parameters conveying relevant information on the analysed phenomenon and unveil the hidden structures in the primary data set. We discovered that the share of the EU’s agricultural output in the EU exports of agricultural products explained variations in the agricultural competitiveness within member states.
1. Introduction
Every country features peculiar conditions for the production of food, which in some areas drive its competitiveness in global markets while making it non-competitive in others [1]. Agricultural production is spatial in nature. It is associated with land, an immobile factor linked to a specific territory [2]. Contemporary agriculture is subject to regional variations and plays different roles in the national economies of the respective countries [3]. In the European Union, such differentiation is also present and manifested as explicit disparities in the share of this sector in the total gross farm income, the share of agricultural workers in total employment, or the productivity of production factors, among other things [4,5,6,7]. It should be emphasised that a strong agricultural sector is a necessary prerequisite for the highly competitive food industry, making it an important part of the economy and trade in the EU and significantly affecting international markets [4]. Therefore, it plays a leading role in ensuring the food security of the respective member states [3]. The significance of the agricultural sector in ensuring food security has been highlighted by the COVID-19 pandemic, followed by Russian aggression in Ukraine [8,9]. This amplifies the need to investigate the competitiveness of the agricultural sector in the member states of the European Union.
Agriculture, similar to the economies of individual member states, is constantly changing under the influence of various endogenous and exogenous factors. Changes in agriculture refer to its functions [10], structural aspects [11], production factors [12,13], and competitiveness [6]. The last aspect of change is particularly important for all EU member states. This is due to the fact that competitiveness is a complex issue [14]. The reference literature defines competitiveness in many ways, although a generally acceptable definition does not exist [15,16]. This is a consequence of the fact that it can refer to various analysis levels [17,18] and is analysed according to at least three economic theories—the theories of economic growth, international trade, and microeconomics [19,20]. The complexity of this phenomenon is even deeper in the face of the present-day challenges and the concept of sustainable development in agriculture. Meanwhile, improved competitiveness of the agricultural sector, next to rural development, has been a priority of the Common Agricultural Policy (CAP) for many years [21,22,23]. The latest CAP instruments associated with the Green Deal have increased the environmental orientation of agriculture [24], which has recently aroused much controversy in the international arena, notably regarding maintaining and improving the level of agricultural competitiveness. The latest report issued by the European Parliament reviews how the CAP and state aid support the competitiveness of agricultural holdings [25]. To assess the competitiveness of agriculture in international terms (at the level of the European Union), we adopted a definition of the agricultural sector that treats it as a relative feature whose importance in relation to the object under review is determined by its relationship to other objects. We defined agricultural competitiveness as the sector’s ability to function and develop successfully in the face of existing competition, as measured by its production potential and the outcomes of its use. There are several different approaches to the issues of competitiveness, including its assessment [15,17]. Previous studies on the competitiveness of agriculture in the European Union have focused mostly on a selected aspect of this phenomenon. Many of them separated the evaluation of the production potential, i.e., production inputs and the relationship between them [26,27,28], from the aspects of agricultural outputs, including productivity [29,30]. Many authors have evaluated the competitiveness of the agricultural sector, or in wider terms the agri-food sector, using trade-related measures [14,31,32,33]. However, they often focus only on selected EU member states [34,35,36]. In contrast, synthetic measures of agricultural competitiveness are rarely used, which tackle such an assessment in a more comprehensive manner, particularly using a dynamic approach [6,14,20]. In addition, few papers have attempted to identify the most essential determinants of agricultural competitiveness. Pawlak et al. [28] emphasised that given the nature-related and labour-consuming character of agricultural production, access to natural resources and labour affects the competitive position of the agricultural sector more than in other sectors. However, they identified the relationship between production factors and their effective use as the main source of competitiveness in the agricultural sector. Jabkowski [16] also found it important to take the production potential into account in assessing agricultural competitiveness. In addition, Tłuczak [5] noted that poor natural conditions can be compensated by using adequate production technologies, which in turn require higher capital inputs. Thus, it can be expected that countries featuring a high level of socioeconomic development, thanks to improved technologies and higher market absorption rates (increased demand), will be more productive than those with high levels of agricultural potential but presenting a lower level of economic development.
Reforms under the Common Agricultural Policy (CAP), the extension of the European Union, and other exogenous conditions have contributed to changes in the operation of agriculture in the member states [24,36]. Therefore, this study attempted to answer the following questions: What is the level of agricultural competitiveness of individual EU member states? How do EU member states rank in terms of agricultural competitiveness? Have the competitiveness rankings of the EU member states changed over the past decade? To accomplish the adopted objectives, an aggregate index was designed based on multiple variables expressed as partial indicators. This work is a genuine contribution to the research on the methods used in measuring and assessing the competitiveness of agriculture by designing a synthetic measure, evaluating the level of competitiveness using a dynamic approach, and identifying factors that are of the greatest importance for the agricultural sector to become highly competitive.
2. Materials and Methods
The agricultural competitiveness levels were evaluated for 27 member states in the European Union, and the period from 2012 to 2021 was adopted as the study period, making it possible to analyse related changes that occurred over the decade. A dedicated synthetic index was used to answer the research questions. This allowed us to analyse the studied phenomenon for particular EU member states in a comprehensive manner. The first stage of our survey focused on selecting the relevant independent variable, which is one of the most important and simultaneously the most difficult issues. Statistical analyses were performed using Microsoft Excel 2021 and IBM SPSS Statistics 26. We analysed the underlying descriptive statistics comprising measures of central tendency (mean, median), measures of dispersion (standard deviation, minimum, maximum), measures of shape (skewness), and the coefficient of variation. The next stage involved linear ordering employing the standardised sums method for 2012 and 2021 and for mean values from the time range, as well as a principal components analysis of individual indicators in 2021. The linear ordering based on standardised sums was performed by calculating the arithmetic mean of the normalised values of the features for each object (state), which was then transformed into a synthetic indicator (Wi) falling within the interval range of 0 to 1. The minimum value of the entire set of objects was subtracted from the value of a specific object. Next, the result was divided by the maximum value of the entire newly formed set.
Finally, we employed a principal component analysis (PCA) to eliminate the collinearity of the variables, reduce the number of attributes identifying the parameters conveying relevant information on the analysed phenomenon, and unveil the hidden structures in the primary data set.
Originally, the analyses covered ten partial indicators referring to the agricultural competitiveness of EU member states (Table 1). Statistics on the respective indicators were derived from the Eurostat database (X1–X8) and Agri-Food Data Portal (Context Indicators—CMEF) (X9–X10). The lack of unanimous concepts and measurements of agricultural competitiveness explicitly points to the need for research to comprehensively show the complex nature of this economic phenomenon from multiple perspectives [37,38]. The agricultural sector also has social, environmental, and economic consequences [39]. Therefore, guided by the need for a comprehensive assessment of the competitiveness of the agricultural sector and the definition of agricultural competitiveness we adopted in selecting partial indicators, attempts were made to consider the variables describing the production potential (X4, X7, X10), production and economic outputs (X1, X2, X3, X5), significance of agriculture in international trade (X8), and social aspects (X9).

Table 1.
Indicators selected for the analysis.
To achieve a specific competitive position, understood as the result of competition, it is necessary to build sufficient competitive potential [40]. Thus, in assessing the competitiveness of the agricultural sector, the production potential should be treated as a source of its competitive advantage. In addition to the resources of the production factors, the relationship between them is critical to achieving competitiveness. Therefore, to assess the agricultural competitiveness of EU member states, we adopted the number of workers per 100 ha, percentage of agricultural workers, and ratio of farmers < 35 years old to farmers > 55 years old.
The OECD [23] claims that increased productivity is significant for the competitiveness of the agricultural sector, so the variables comprised land, labour, and capital productivity. The diagnostic indicators referring to agricultural output included the share of the particular member state in the aggregate agricultural output value in the EU (at fixed prices from 2010). This demonstrates, on the one hand, the importance of individual member states in the EU market in terms of the production output and associated competitive capacity, and on the other hand the consumption of available production factor resources, namely land, labour, and capital. In addition, partial factor productivity indicators were included in the list of features describing agricultural competitiveness. Labour productivity was calculated as the ratio of the gross value added from agriculture to the number of full-time agricultural workers, while land productivity was calculated as the value of the agricultural output to the utilised agricultural area. In turn, capital was recognised as a stream, i.e., intermediate consumption costs. Therefore, its productivity was calculated using the running capital productivity ratio, i.e., agricultural output to intermediate consumption costs. One of the authors presenting the possibility of such an approach to capital in agriculture is Czyżewski [41]. The potential capital productivity ratio could not be used because Eurostat does not contain data on the value of fixed assets. Such data are available in FADN EU but they do not cover all agricultural holdings, so we found it reasonable to focus on data from Eurostat. In addition, this ratio illustrates the potential capital productivity, since not all fixed assets are involved in the process of production. In turn, many authors make use of trade measures of competitiveness [31,42]. An argument for assessing competitiveness in this context is that increasing the export volumes of food and other agricultural products opens up new production opportunities for domestic producers [43]. Furthermore, export is a key direct factor accelerating economic growth. This made us include the member state’s share of the EU exports of products from group 0 according to the SITC classification for food and live animals (%) (intra and extra) among the diagnostic variables. However, given the global trend of searching for solutions to reduce the environmental pressure caused by agriculture, the share of the agricultural area under organic farming in the total utilised agricultural area (X6) was also included among the variables. The rationale for integrating this variable in the diagnostic variables reflects a shift in the EU’s approach to production, market, and competitive challenges. The challenges to the agricultural sector also involved the need to assume the organic farming model following the sustainable development path. The criteria for individual member states to achieve the Green Deal include an increase in the percentage of organic UAA to 25% of the total agricultural area. Europe needs competitive agriculture that on the one hand will be stable and efficient and on the other hand will optimally fulfil the environmental functions. The competitiveness of this sector should not be determined exclusively by the aspect of economic performance but also from the point of view of the environmental function.
To assess the features of selected diagnostic variables, as the first step of the analysis, we calculated their basic descriptive statistics (Table 2).
Table 2.
Basic descriptive statistics of the analysed diagnostic variables.
3. Results and Discussion
The analysis showed that in 2012, 2021, and between these years, the diagnostic variable X5 had a low coefficient of variation (AVC < 45.00%), which implied low discriminatory power for this feature and that the diagnostic variable X4 showed a considerable right asymmetry (Sk. > 3.00), which implied accumulated observations with below-average values. Thus, we found it reasonable to exclude the indicated diagnostic variables from further linear ordering analyses.
Next, linear ordering was performed using the standardised sum method. We analysed 2012 and 2021 separately and then the mean values of the time interval. The rankings of agricultural competitiveness in individual EU member states between 2012 and 2021, prepared using the above method, are presented in Table 3, while the mean values of the synthetic measure for the entire decade are shown in Figure 1.
Table 3.
Synthetic measure (Wi) values of agricultural competitiveness of individual EU member states, including their ranks in 2012 and 2021.
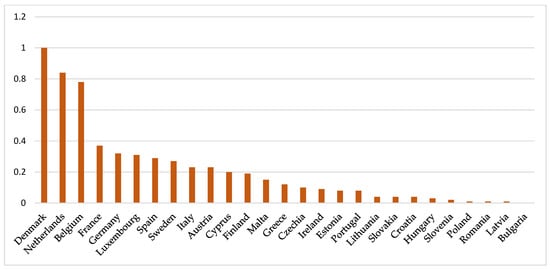
Figure 1.
Ranking of EU member states by agricultural competitiveness from 2012 to 2021.
The analysis showed that in all years, Denmark, the Netherlands, and Belgium had the highest agricultural competitiveness levels, while Romania, Latvia, and Bulgaria featured the lowest levels in 2012 and from 2012 to 2021 (Figure 1 and Table 3). In contrast, in 2021, the synthetic measure levels were lowest in Poland, Latvia, and Slovenia. In addition, in 2021, compared with 2012, Denmark, Belgium, Germany, Spain, Finland, Ireland, Czechia, Lithuania, Slovakia, Hungary, Bulgaria, and Romania recorded increases in their agricultural competitiveness. The agriculture of Finland showed the greatest improvement in competitiveness over a decade (six ranks up). This stemmed from the high growth dynamics of their labour productivity (166.4%) and a more than two-fold increase in the percentage of organic farming (up to 16.1%). In the years under review, the agricultural competitiveness declined in the Netherlands, France, Sweden, Italy, Austria, Cyprus, Malta, Estonia, Poland, and Slovenia but remained unchanged in Luxembourg, Greece, Portugal, Croatia, and Latvia (Table 3). Estonia markedly moved down in the rankings, which can be explained by decreases in labour productivity and capital productivity in 2021 and the worse salaries offered in agriculture compared to salaries in the entire economy. An analysis of changes over the decade under review did not indicate that new member states improve their competitiveness by catching up with the so-called old EU. Kryszak [44] investigated agricultural income convergence in relation to the non-agricultural income levels of individual member states and agricultural income levels between the member states. He demonstrated that the rate of income growth between countries became equal but observed no convergence of income levels. In contrast, Gołaś [12] analysed the processes of convergence of labour productivity in the EU’s agricultural sector. He found that such processes occurred but with very low levels of dynamics. Kijek et al. [45], however, found that convergence processes to the extent of labour productivity in agriculture occur within uniform groups of countries (clusters), and the highest level of intensity occurs in the group of countries with the lowest and medium levels of agricultural competitiveness. To some extent, this explains the nature of the changes in the agricultural competitiveness rankings presented herein. In none of the years under review was any new member state of the EU among the top ten countries in the rankings. It is difficult to find a direct reference between agricultural competitiveness rankings and other authors’ findings, which stems from their varying approaches and different study methods and indicators. For instance, Jarosz-Angowska et al. [42], using TOPSIS, demonstrated that in 2018 Romania, the Netherlands, France, and Denmark achieved the highest levels of competitiveness in terms of their agricultural potential. The high competitiveness of such countries (aside from Romania) is undeniable and supported by several studies, regardless of how it is measured [46,47]. Evaluating the agricultural competitiveness of EU member states from the perspective of international trade from 2003 to 2011, Carraresi and Banterle [48] indicated that the Netherlands was the leader. At that time, France and Spain were highly competitive.
To identify the areas that need special attention to improve their agricultural competitiveness, below-average variables were indicated for stimulants and above-average ones for destimulants (Table 4). As X4 and X5 were excluded from the analysis, they were not included in the list of variables. Countries such as Croatia, Lithuania, Slovenia, Romania, Latvia, Ireland, Greece, and Bulgaria have the highest numbers of partial indicators at an unfavourable level. Therefore, this group mainly comprises countries admitted to the EU in 2004, which later faced greater barriers to improving their agricultural competitiveness. Countries that in 2021 were at the bottom of the competitiveness ranking were characterised by very low labour productivity; Bulgaria ranked 22nd among member states, Lithuania 24th, and Romania 25th. In addition, these countries showed high percentages of employment in the agricultural sector (Latvia = 7.5%, Romania = 21.4%, Bulgaria = 16.2%), highlighting the need for further structural transformations [49].
Table 4.
List of partial indicators with non-average values in 2021.
In the final stage of the survey, we analysed the principal components of individual agricultural competitiveness indicators in EU member states. This made it possible to specify the parameters conveying the most relevant information on the phenomenon under review. This strategy enables one to drop data attributes and design new uncorrelated variables that most accurately convey differences in the examined data set. It also reveals hidden correlation patterns between new components and agricultural competitiveness. The analysis involved oblimin rotation, which included ten indicators of agricultural competitiveness.
Regarding the linear ordering, the individual variables had to meet the prerequisites for volatility and the absence of considerable asymmetry (which resulted in eliminating two variables); these requirements do not apply for principal component analyses. Thus, we decided to incorporate all available variables describing agricultural competitiveness in this analysis.
The KMO (Kaiser–Meyer–Olkin) sampling adequacy was 0.399 and Bartlett’s test of sphericity was statistically significant at χ2(45) = 105.49; p < 0.001, which corroborated the reasonableness of the factor analysis. The outcomes allowed us to identify four factors with eigenvalues exceeding one (Kaiser criterion). The four factor model explained 73.09% of the total variance, with the first factor explaining 27.21%, the second 19.94%, the third 15.87%, and the fourth 10.07% (Table 5). The analyses excluded items with factor loadings below 0.4 [50].
Table 5.
Model matrix for a four factor structure.
The results show the cross-loading of two indicators of agricultural competitiveness (X2 and X9). Therefore, they were excluded from the analyses. After these indicators were excluded, the analysis exposed a three factor structure, which explained 67.08% of the variance; the first factor explained 29.45%, the second 23.45%, and the third 14.18% (Table 6).
Table 6.
Model matrix for a three factor structure.
The outcomes implied that one indicator of agricultural competitiveness (X5) loaded the first and second factors in a similar manner. Therefore, we decided to exclude them from further analyses. As a result, the analysis revealed satisfactory factor loadings for three factors, and the model alone explained 71.67% of the variances overall; the first factor explained 31.77%, the second 23.71%, and the third 16.19%. The first and third factors comprised two indicators each and the second factor comprised three indicators. Table 7 presents the detailed factor loadings.
Table 7.
Model matrix for a three factor structure after excluding the X5 indicator.
The factor analysis reduced the set of ten parameters originally used to describe agricultural competitiveness to the three factors that determined the competitiveness of the agricultural sector to the highest extent. Given the above findings, it should be noted that the share of the EU’s agricultural output and the share of each member state in the EU’s exports of agricultural products (Factor 1) explain variations in the agricultural competitiveness within member states. Many scientific papers emphasise the significance of these determinants in the competitive position of individual member states. Commercial measures are usually analysed separately from non-commercial measures. The competitive advantages of agriculture to the extent of trade with reference to EU member states were evaluated by Jakšić et al. [51], Jarosz-Angowska et al. [14], and Rumankova et al. [52], among other authors. It is difficult to find a direct reference between the results of this study and those of other studies, although one may attempt to identify the factors of agricultural competitiveness. The most important determinants of competitiveness in the agricultural sector of the EU in relation to US agriculture were examined by Pawlak et al. [28], among other researchers. It was demonstrated that the main factors differentiating the level of competitiveness of the agricultural sector were the relationships between production factors and consequently the level of productivity. According to these authors, only countries such as Germany, the Netherlands, France, Denmark, and Belgium are capable of coping with the competitive pressure exerted by US agriculture. Ball et al. [46] compared the agricultural competitiveness in the USA and the EU and arrived at a similar conclusion. A broad analysis of the determinants of agricultural competitiveness was conducted by Latruffe [53], who divided them into a group of factors controlled by agricultural producers and a group of determinants beyond their control. Dimovski et al. [54], however, highlighted the significance of human resources in improving agricultural competitiveness. In contrast, Jambor and Babu [40] believe that the forces shaping agricultural competitiveness are complex and largely country-specific.
4. Conclusions
The need to monitor changes in the level of agricultural competitiveness of EU member states necessitates the development of an appropriate set of indicators to provide an unequivocal answer to the question of whether a country is improving its competitive position. The absence of a uniform framework for assessing this phenomenon led us to propose a synthetic measure for assessing changes in the agricultural competitiveness of EU member states over the past decade. The inclusion of a wide range of partial indicators and an analysis using a dynamic method resulted in a more comprehensive approach to the problem being assessed than using single measures, such as productivity or commercial measures. As a result, this study adds to the discussion on the competitiveness of the agricultural sector, allow for the fuller identification of concerns, and can support initiatives to enhance the competitive position of individual member states.
When answering the research questions formulated herein, it is important to note that the member states vary in terms of the competitiveness of their agricultural sector. From 2012 to 2021, the most competitive countries were Denmark, the Netherlands, and Belgium. Simultaneously, the rankings of agricultural competitiveness changed over the 10 years under review. The highest levels of improvement were recorded for Finland, Slovakia, and Ireland. However, differences are still explicit between old and new member states. None of the new member states of the EU were in the top ten for agricultural competitiveness. Many areas associated with agriculture in these countries require considerable improvement. The PCA identified the assessment parameters that are the most essential drivers of variances in agricultural competitiveness. Therefore, it appears that improving the competitive position of the farming sector by enhancing the level of these indicators is possible, especially for the so-called EU-13 countries featuring a relatively low level of factor productivity and having the potential to increase the production and export volumes of agricultural products. Increases in agricultural exports allow a country’s producers to expand their production while also accelerating the country’s economic growth.
The diversification of agriculture in EU member states and the relatively uniform framework for the impacts of CAP instruments on agriculture imply a need to influence agricultural competitiveness not only through EU measures but also through national policies. Our thorough analysis identified underperforming diagnostic indicators hindering competitiveness. As a result, it would be necessary to seek measures that would cause beneficial improvements in the agricultural sectors of specific member states. There is also a need to seek the right proportions of competitiveness in both economic and environmental terms.
This study was subject to certain methodological limitations that can set directions for future surveys. The latest available data on most of the specific indicators come from 2021, so at this stage it is impossible to determine what changes occurred from 2022 to 2023. An interesting line of research would be to include the COVID-19 pandemic period and the Ukraine–Russia war in the analysis. These conditions have certainly affected the agricultural competitiveness in EU member states. A second line of research should assess the impacts of new CAP assumptions, in line with the Green Deal, on agricultural competitiveness. This is a very difficult task that requires a thorough evaluation over the long term. In addition, it is reasonable to undertake competitiveness studies to assess the agricultural competitiveness in each member state by aggregating the competitiveness of their individual agricultural products.
Author Contributions
Conceptualisation, A.N. and A.Z.; methodology, A.N. and A.Z.; formal analysis, A.N. and A.Z.; resources, A.N. and A.Z.; data curation, A.N. and A.Z.; writing—original draft preparation, A.N. and A.Z.; writing—review and editing, A.N. and A.Z.; visualisation, A.N. and A.Z.; funding acquisition, A.N. and A.Z. All authors have read and agreed to the published version of the manuscript.
Funding
The APC was funded by the University of Life Sciences, Faculty of Agrobioengineering, and the mentioned vouchers.
Institutional Review Board Statement
Not applicable.
Data Availability Statement
The data used in the surveys were sourced from Eurostat (X1–X8) and the Agri-Food Data Portal (Context Indicators—CMEF) (X9–X10). The raw data were converted in accordance with the adopted methodology given in the publication. Data from databases are widely available for use (https://ec.europa.eu/eurostat/data/database, accessed on 10 January 2024; https://agridata.ec.europa.eu/extensions/IndicatorsSectorial/AgeStructureFarmManagers.html, accessed on 10 January 2024). Specific codes used to calculate individual diagnostic ratios from X1 to X10: X1—[aact_eaa07], X2—[aact_eaa07]; [tag00025], X3—[aact_eaa07]; [aact_ali01]; X4—[aact_ali01]; [tag00025]; X5—[aact_eaa07]; X6—[sdg_02_40]; X7—[nama_10_a10_e]; X8—[ext_lt_intratrd]; X9—[C26]; X10—[C23].
Conflicts of Interest
The authors declares no conflict of interest.
References
- Campi, M.; Dueñas, M.; Fagiolo, G. How do countries specialize in agricultural production? A complex network analysis of the global agricultural product space. Environ. Res. Lett. 2020, 15, 124006. [Google Scholar] [CrossRef]
- OECD. Farmland Conversion: The Spatial Dimension of Agricultural and Land Use Policies; OECD Publishing: Paris, France, 2009. [Google Scholar] [CrossRef]
- Pawlak, K.; Kołodziejczak, M. The role of agriculture in ensuring food security in developing countries: Considerations in the context of the problem of sustainable food production. Sustainability 2020, 12, 5488. [Google Scholar] [CrossRef]
- Baer-Nawrocka, A. The role of agriculture in the national economy of EU countries. J. Agribus. Rural Dev. 2016, 42, 501–510. [Google Scholar] [CrossRef]
- Tłuczak, A. Diversity of the selected elements of agricultural potential in the European Union countries. Agric. Econ. 2020, 66, 260–268. [Google Scholar] [CrossRef]
- Nowak, A.; Różańska-Boczula, M. The competitiveness of agriculture in EU Member States according to the competitiveness pyramid model. Agriculture 2022, 12, 28. [Google Scholar] [CrossRef]
- Borlea, S.N.; Lucuț Capraș, I. Theoretical and statistical arguments of the differentiated effect of the Common Agricultural Policy in the EU countries. Ann. Univ. Apulensis-Ser. Oeconomica 2023, 25, 53–67. [Google Scholar] [CrossRef]
- Aday, S.; Aday, M.S. Impact of COVID-19 on the food supply chain. Food Qual. Saf. 2020, 4, 167–180. [Google Scholar] [CrossRef]
- Timpanaro, G.; Scuderi, A.; Guarnaccia, P.; Foti, V.T. Will recent world events shift policy-makers’ focus from sustainable agriculture to intensive and competitive agriculture? Heliyon 2023, 9, e17991. [Google Scholar] [CrossRef] [PubMed]
- Boix-Fayos, C.; de Vente, J. Challenges and potential pathways towards sustainable agriculture within the European Green Deal. Agric. Syst. 2023, 207, 103634. [Google Scholar] [CrossRef]
- Neuenfeldt, S.; Gocht, A.; Heckelei, T.; Ciaian, P. Explaining farm structural change in the European agriculture: A novel analytical framework. Eur. Rev. Agric. Econ. 2019, 46, 713–768. [Google Scholar] [CrossRef]
- Gołaś, Z.J. Convergence of labour productivity in agriculture of the European Union. Probl. Agric. Econ. 2019, 358, 22–43. [Google Scholar] [CrossRef]
- Rusielik, R. Agricultural efficiency and its components in European Union countries between 2009–2019. Analysis using aggregate Färe-Primont productivity indices. Ann. Pol. Assoc. Agric. Agribus. Econ. 2021, 23, 87–102. [Google Scholar] [CrossRef]
- Jarosz-Angowska, A.; Angowski, M.; Kakol, M.; Nowak, A.; Różańska-Boczula, M. Agricultural competitive potential and competitive position in the international trade of agricultural and food products in the European Union. Eur. Res. Stud. J. 2020, 23, 779–803. [Google Scholar] [CrossRef] [PubMed]
- Łukiewska, K. Changes in the competitive position of the food industry in the European Union member states. Forum Sci. Oeconomia 2019, 7, 71–86. [Google Scholar] [CrossRef]
- Jabkowski, D. Conditions for the competitiveness of the agricultural sector in the EU, Japan, Canada, Vietnam, and Mercosur Countries. Probl. Agric. Econ. 2023, 374, 42–61. [Google Scholar] [CrossRef]
- Keogh, M.; Tomlinson, A.; Henry, M. Assessing the Competitiveness of Australian Agriculture; No 15/054; Rural Industries Research and Development Corporation Publication: Canberra Australia, 2015. [Google Scholar]
- Van Dung, B.; Van Thuy, H.T.; Dieu, A.H.T.; Thuy, L.H.T.T. Concepts of agri-competitiveness in theoretical and empirical researches. J. Dev. Res. 2020, 4, 24–33. [Google Scholar] [CrossRef]
- Voinescua, R.; Moisoiu, C. Competitiveness, theoretical and policy approaches. Towards a more competitive EU. Procedia Econ. Financ. 2015, 22, 512–521. [Google Scholar] [CrossRef]
- Nowak, A.; Kamińska, A. Agricultural competitiveness: The case of the European Union countries. Agric. Econ. 2016, 62, 507–516. [Google Scholar] [CrossRef]
- Hauka, A.; Rivža, B. Common Agricultural Policy (CAP)–For increasing EU competitiveness in global market. In Proceedings of the 25th Congress Nordic View to Sustainable Rural Development, Riga, Latvia, 16–18 June 2015; pp. 451–456. [Google Scholar]
- European Commission. Approved 28 CAP Strategic Plans (2023–2027). Summary Overview for 27 Member States. Facts and Figures. Available online: https://agriculture.ec.europa.eu/document/download/7b3a0485-c335-4e1b-a53a-9fe3733ca48f_en?filename=approved-28-cap-strategic-plans-2023-27.pdf (accessed on 21 January 2024).
- OECD. Policies for the Future of Farming and Food in the European Union; OECD Agriculture and Food Policy Reviews; OECD Publishing: Paris, France, 2023. [Google Scholar] [CrossRef]
- Horák, I. The Competitiveness Outlook of the European Agriculture with the New Green Deal Policy. MENDELU Working Papers in Business and Economics 78. Mendel University in Brno. 2022. Available online: http://ftp.mendelu.cz/RePEc/men/wpaper/78_2022.pdf (accessed on 21 January 2024).
- Beck, M.; Van Bunnen, P.; Bodart, S.; Münch, A.; Gorny, H.; Badouix, M. Research for AGRI Committee–Rural Areas-Levels of Support and Impact on Competitiveness of Farms; European Parliament, Policy Department for Structural and Cohesion Policies: Brussels, Belgium, 2024. [Google Scholar]
- Juchniewicz, M. Food producers’ competitiveness gap in Poland on the European Union market. Acta Sci. Pol. Oeconomia 2017, 16, 65–75. [Google Scholar] [CrossRef]
- Pawlak, K.; Poczta, W. Competitiveness of Polish agriculture in the context of globalization and economic integration–Competitive potential and position. Probl. Agric. Econ. 2020, 4, 86–107. [Google Scholar] [CrossRef]
- Pawlak, K.; Smutka, L.; Kotyza, P. Agricultural potential of the EU countries: How far are they from the USA? Agriculture 2021, 11, 282. [Google Scholar] [CrossRef]
- Baráth, L.; Fertő, I. Productivity and convergence in European Agriculture. J. Agric. Econ. 2016, 68, 228–248. [Google Scholar] [CrossRef]
- Rodzinka, J.; Skica, T.; Pomianek, T. Productivity and Competitiveness of the Agricultural Sector in Poland. Yearb. Antitrust Regul. Stud. 2021, 14, 139–158. [Google Scholar] [CrossRef]
- Matkovski, B.; Kalaš, B.; Zekić, S. Agri-food competitiveness in South East Europe. Outlook Agric. 2019, 48, 326–335. [Google Scholar] [CrossRef]
- Andrei, J.V.; Popescu, G.H.; Nica, E.; Chivu, L. The impact of agricultural performance on foreign trade concentration and competitiveness: Empirical evidence from Romanian agriculture. J. Bus. Econ. Manag. 2020, 21, 317–343. [Google Scholar] [CrossRef]
- Matkovski, B.; Zekić, S.; Đokić, D.; Jurjević, Ž.; Đurić, I. Export competitiveness of agri-food sector during the EU Integration process: Evidence from the Western Balkans. Foods 2022, 11, 10. [Google Scholar] [CrossRef]
- Zieliński, M.; Ziętara, W. Competitiveness of Polish and German farms specialized in field crops. J. Agribus. Rural Dev. 2019, 3, 281–290. [Google Scholar] [CrossRef]
- Nedelcu, A.; Murărasu, I.C.; Bulgaru, I.A. The competitiveness of the Romanian agri-food sector in comparison with European countries. Rom. Econ. Bus. 2023, 26, 101–106. [Google Scholar] [CrossRef]
- Coca, O.; Creangă, D.; Viziteu, S.; Brumă, I.S.; Stefan, G. Analysis of the Determinants of Agriculture Performance at the European Union Level. Agriculture 2023, 13, 616. [Google Scholar] [CrossRef]
- Hoang, V.V. Investigating the agricultural competitiveness of ASEAN countries. J. Econ. Stud. 2020, 47, 307–332. [Google Scholar] [CrossRef]
- García-Agüero, A.-I.; Terán-Yépez, E.; Batlles-delaFuente, A.; Belmonte-Ureña, L.J.; Camacho-Ferre, F. Intellectual and cognitive structures of the agricultural competitiveness research under climate change and structural transformation. Oeconomia Copernic. 2023, 14, 1175–1209. [Google Scholar] [CrossRef]
- Nugroho, A.D.; Prasada, I.Y.; Lakner, Z. Comparing the effect of climate change on agricultural competitiveness in developing and developed countries. J. Clean. Prod. 2023, 406, 137139. [Google Scholar] [CrossRef]
- Jambor, A.; Babu, S. (Eds.) Strategies for increasing competitiveness of agriculture. In Competitiveness of Global Agriculture; Policy Lessons for Food Security; Springer: Cham, Switzerland, 2016; pp. 151–171. [Google Scholar] [CrossRef]
- Czyżewski, B. Resource productivity in Polish agriculture: Towards the paradigm of sustainable development. Econ. Stud. 2012, 2, 165–188. [Google Scholar]
- Jarosz-Angowska, A.; Kasztelan, A.; Kołodziej, E. The evaluation of the competitive potential and performance of the agricultural sector in the EU countries based on a synthetic index. Optimum. Econ. Stud. 2022, 3, 103–119. [Google Scholar] [CrossRef]
- Xiao, Q.; Reed, M. Export and production growth: Evidence from three major wheat exporters of Australia. Can. United States. Appl. Econ. 2007, 39, 309–319. [Google Scholar]
- Kryszak, Ł. Income convergence in the agricultural sector in the context of the European Union’s Common Agricultural Policy. Ann. Pol. Assoc. Agric. Agribus. Econ. 2020, 22, 140–152. [Google Scholar] [CrossRef]
- Kijek, A.; Kijek, T.; Nowak, A. Club convergence of labour productivity in agriculture: Evidence from EU countries. Agric. Econ. 2020, 66, 391–401. [Google Scholar] [CrossRef]
- Ball, V.E.; Butault, J.P.; Juan, C.S.; Mora, R. Productivity and international competitiveness of agriculture in the European Union and the United States. Agric. Econ. 2010, 41, 611–627. [Google Scholar] [CrossRef]
- Cheptea, A.; Huchet, M. The competitiveness of French agri-food exports: A methodological and comparative approach. In Proceedings of the 2018—AAEA Annual Meeting, Agricultural and Applied Economics Association (AAEA), Washington, DC, USA, 5–7 August 2018. [Google Scholar] [CrossRef]
- Carraresi, L.; Banterle, A. The agri-food competitive performance in the EU countries: A fifteen years retrospective. In Proceedings of the 6th International European Forum on System Dynamics and Innovation in Food Networks. International Center for Food Chain and Network Research, Innsbruck-Igls, Austria, 18–22 February 2013; pp. 238–250. [Google Scholar]
- Megyesiova, S. Production, employment and productivity of agricultural sector in the European Union. Bulg. J. Agric. Sci. 2021, 27, 846–858. [Google Scholar]
- Stevens, J.P. Applied Multivariate Statistics for the Social Sciences, 2nd ed.; Erlbaum: Hillsdale, NJ, USA, 1992. [Google Scholar]
- Jakšić, S.; Erjavec, N.; Cota, B. Export and Total Factor Productivity of EU New Member States. Croat. Oper. Res. Rev. 2020, 11, 263–273. [Google Scholar] [CrossRef]
- Rumankova, L.; Kuzmenko, E.; Benesova, I.; Smutka, L. Selected EU countries crop trade competitiveness from the perspective of the Czech Republic. Agriculture 2022, 12, 127. [Google Scholar] [CrossRef]
- Latruffe, L. Competitiveness, Productivity and Efficiency in the Agricultural and Agri-Food Sectors; OECD Food, Agriculture and Fisheries Papers, No. 30; OECD Publishing: Paris, France, 2010. [Google Scholar] [CrossRef]
- Dimovski, J.; Krstić, B.; Radivojević, V. Ensuring the improvement of agricultural competitiveness through the human resource development. Agric. Econ. 2022, 69, 1017–1029. [Google Scholar] [CrossRef]

Disclaimer/Publisher’s Note: The statements, opinions and data contained in all publications are solely those of the individual author(s) and contributor(s) and not of MDPI and/or the editor(s). MDPI and/or the editor(s) disclaim responsibility for any injury to people or property resulting from any ideas, methods, instructions or products referred to in the content. |
© 2024 by the authors. Licensee MDPI, Basel, Switzerland. This article is an open access article distributed under the terms and conditions of the Creative Commons Attribution (CC BY) license (https://creativecommons.org/licenses/by/4.0/).