
Maize Kernel Quality Detection Based on Improved Lightweight YOLOv7

Abstract
1. Introduction
- We established a low-cost data acquisition system. After passing through the corn combine harvester, the maize kernels are randomly distributed through electromagnetic vibration and sampled by ordinary RGB industrial cameras. Also, we established a standardized maize kernel quality dataset, including four categories: moldy, germinant, intact, and broken.
- A maize kernel quality detection model, YOLOv7-MEF, was developed. In this algorithm, MobileNetV3 was used to replace the original feature extraction backbone network, ESE-Net was integrated to enhance feature extraction, and Focal-EIoU was used to optimize the original loss function. The algorithm is made with high accuracy, fast detection speed, and small model size.
- The self-established maize kernel database was used to evaluate the model, and ablation experiments were carried out to verify the algorithm’s recognition and location effect on low-cost sampling images, providing a theoretical basis for related research.
2. Materials and Methods
2.1. Materials
2.1.1. Dataset Acquisition
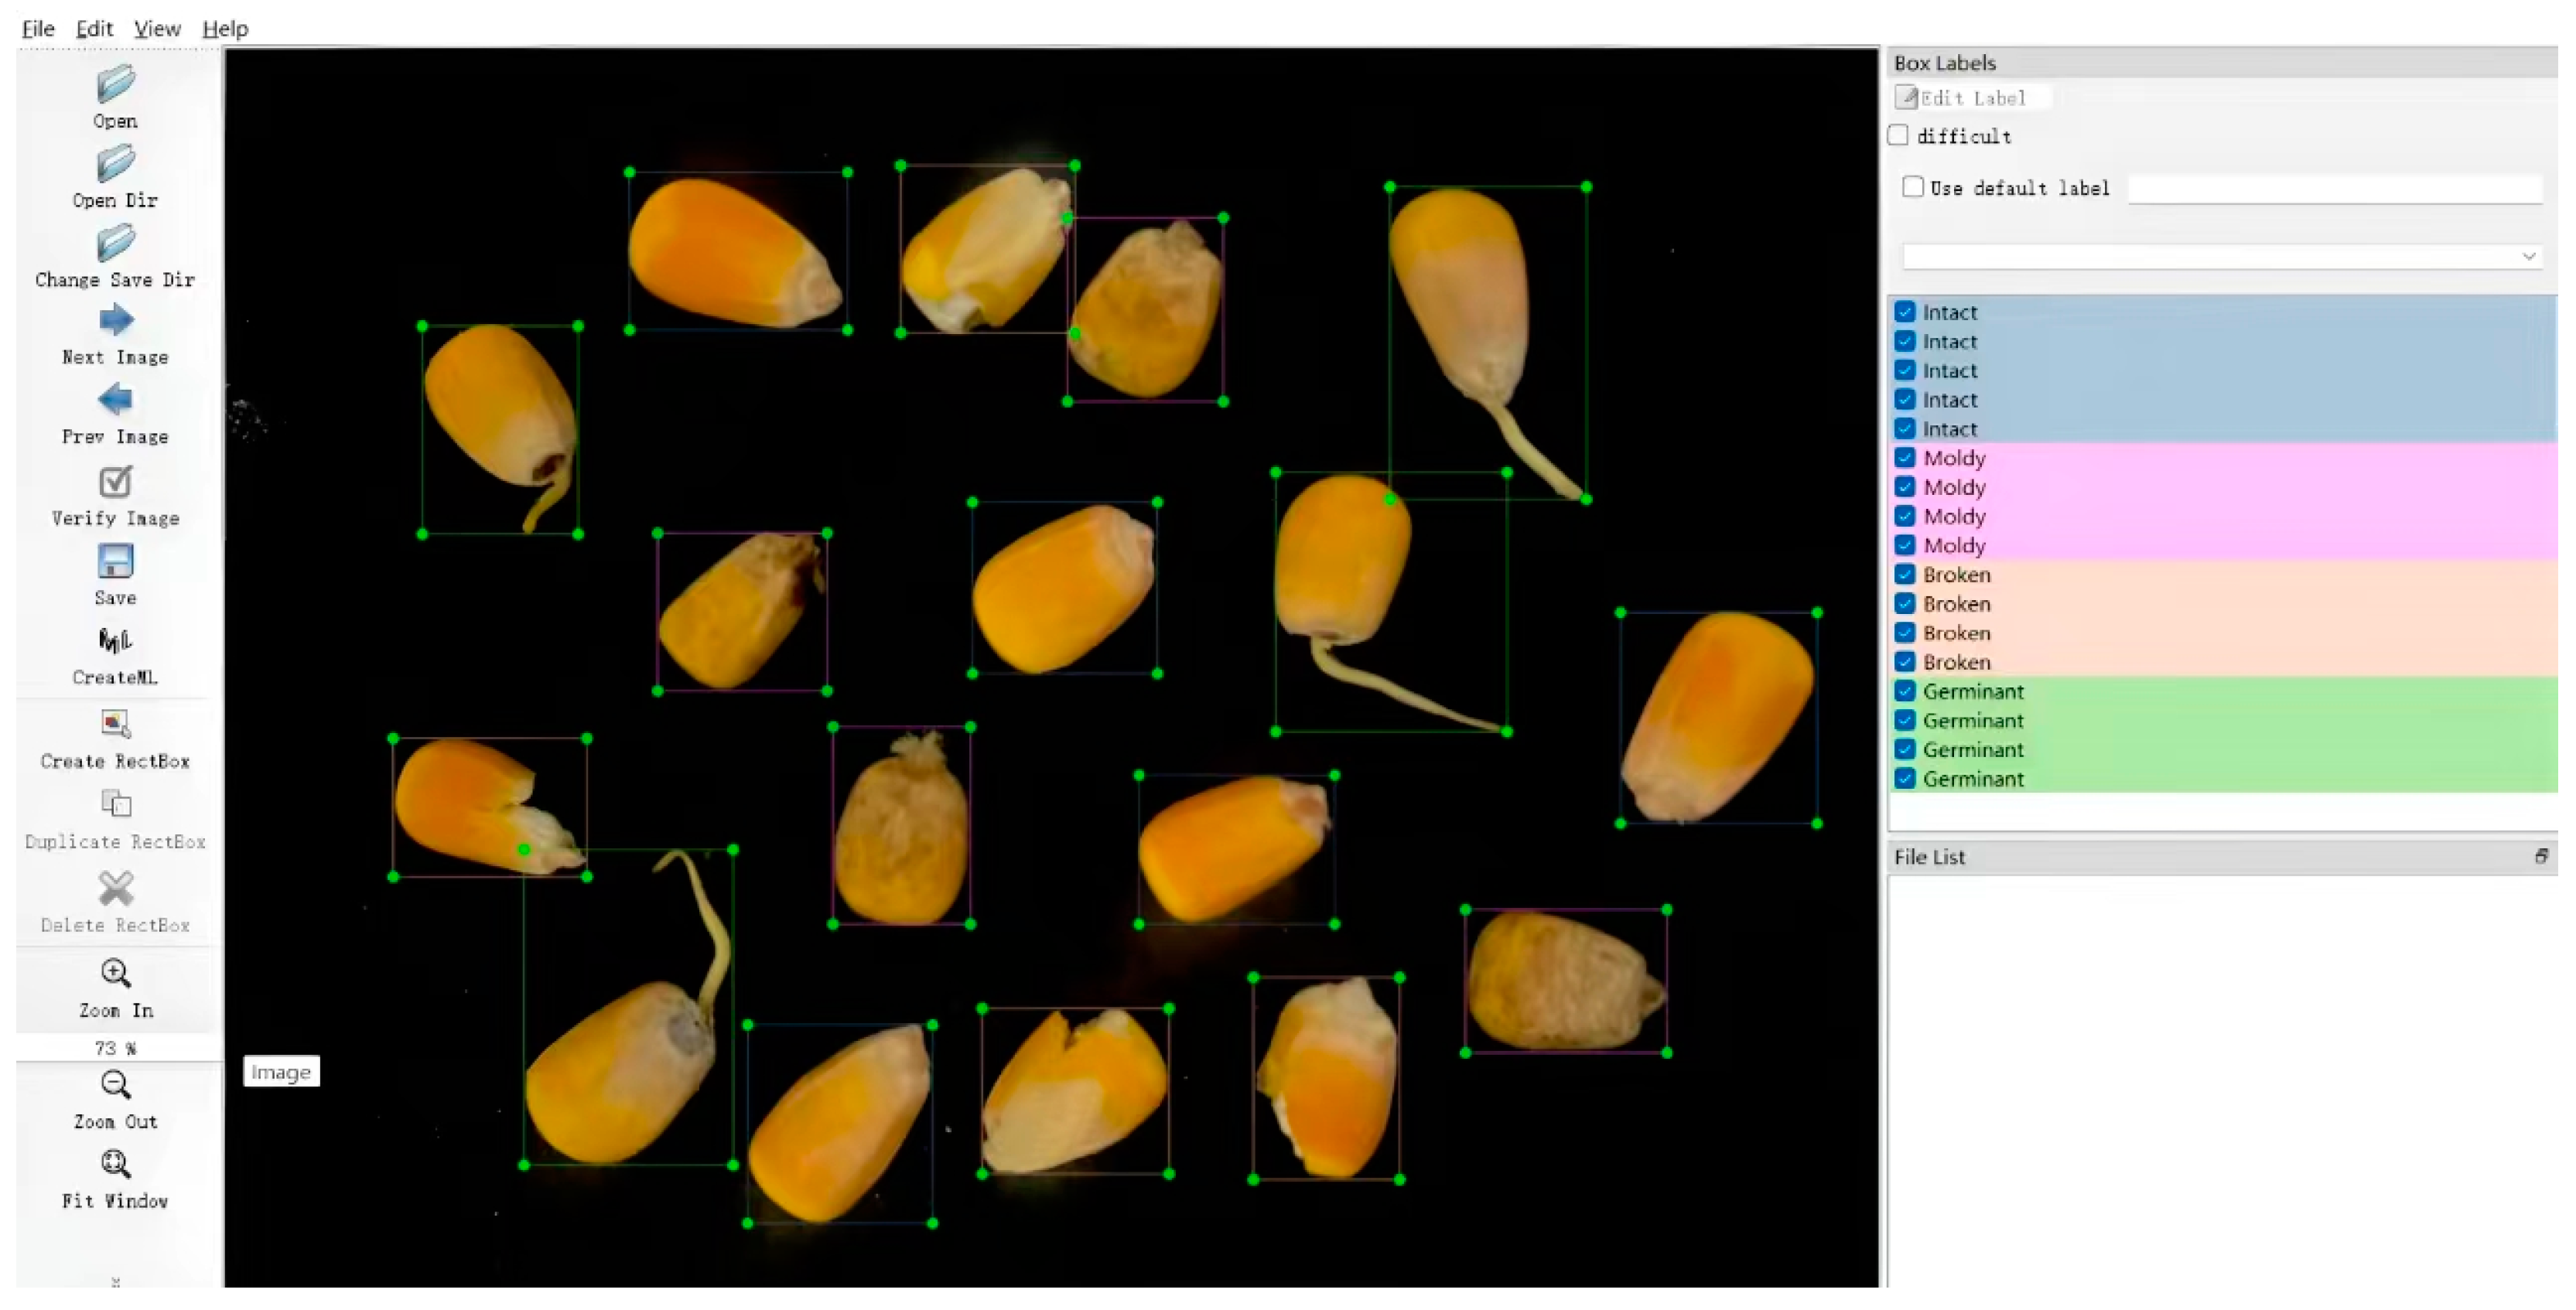
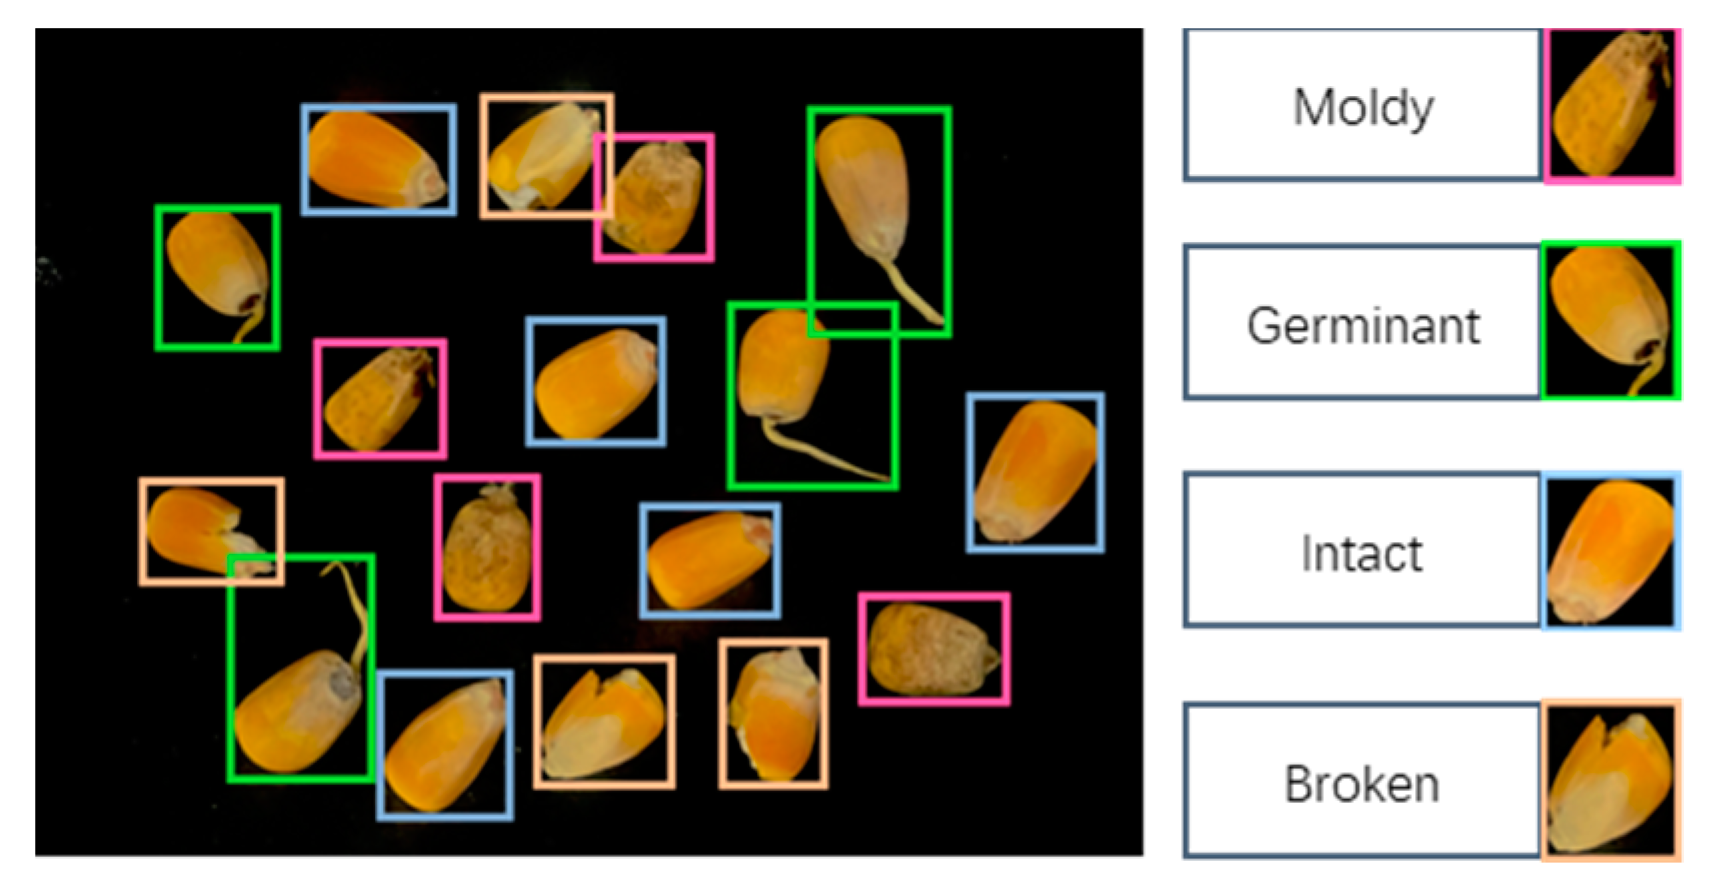
2.1.2. Dataset Labeling
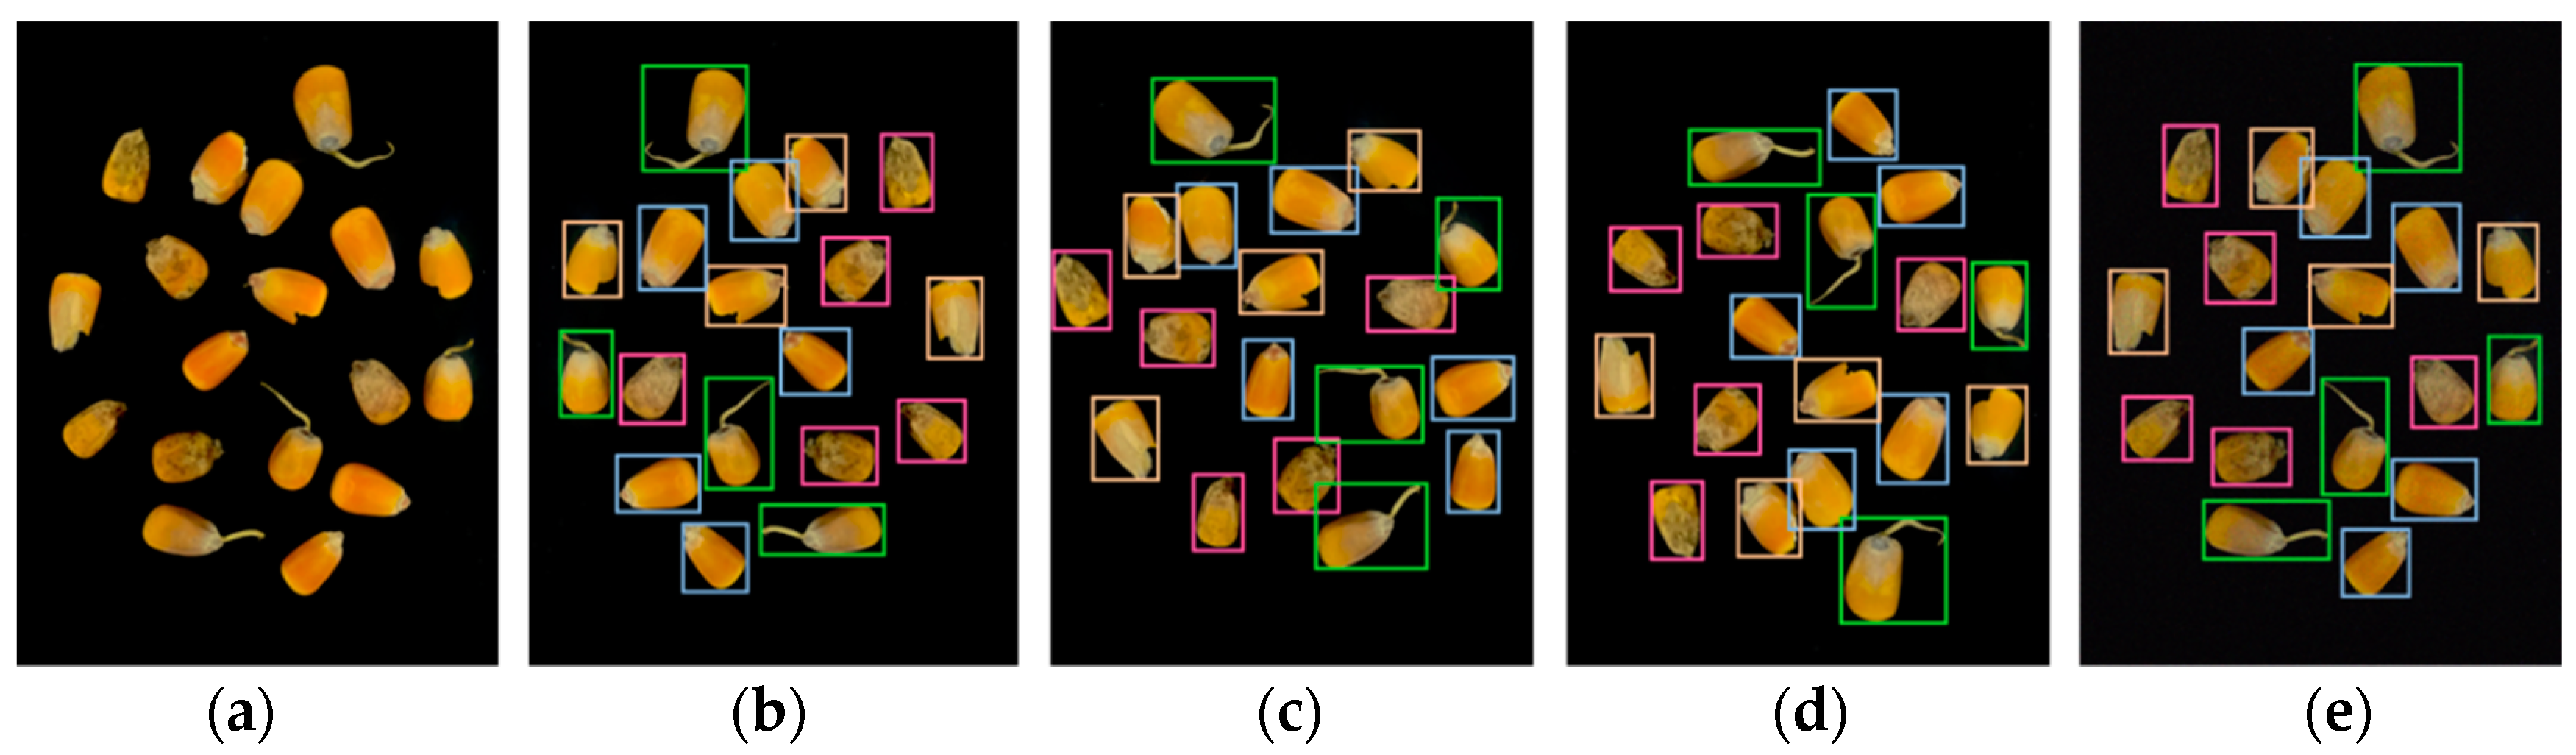
2.1.3. Data Augmentation
2.2. Training Environment and Methods
2.3. Performance Indexes
3. Results
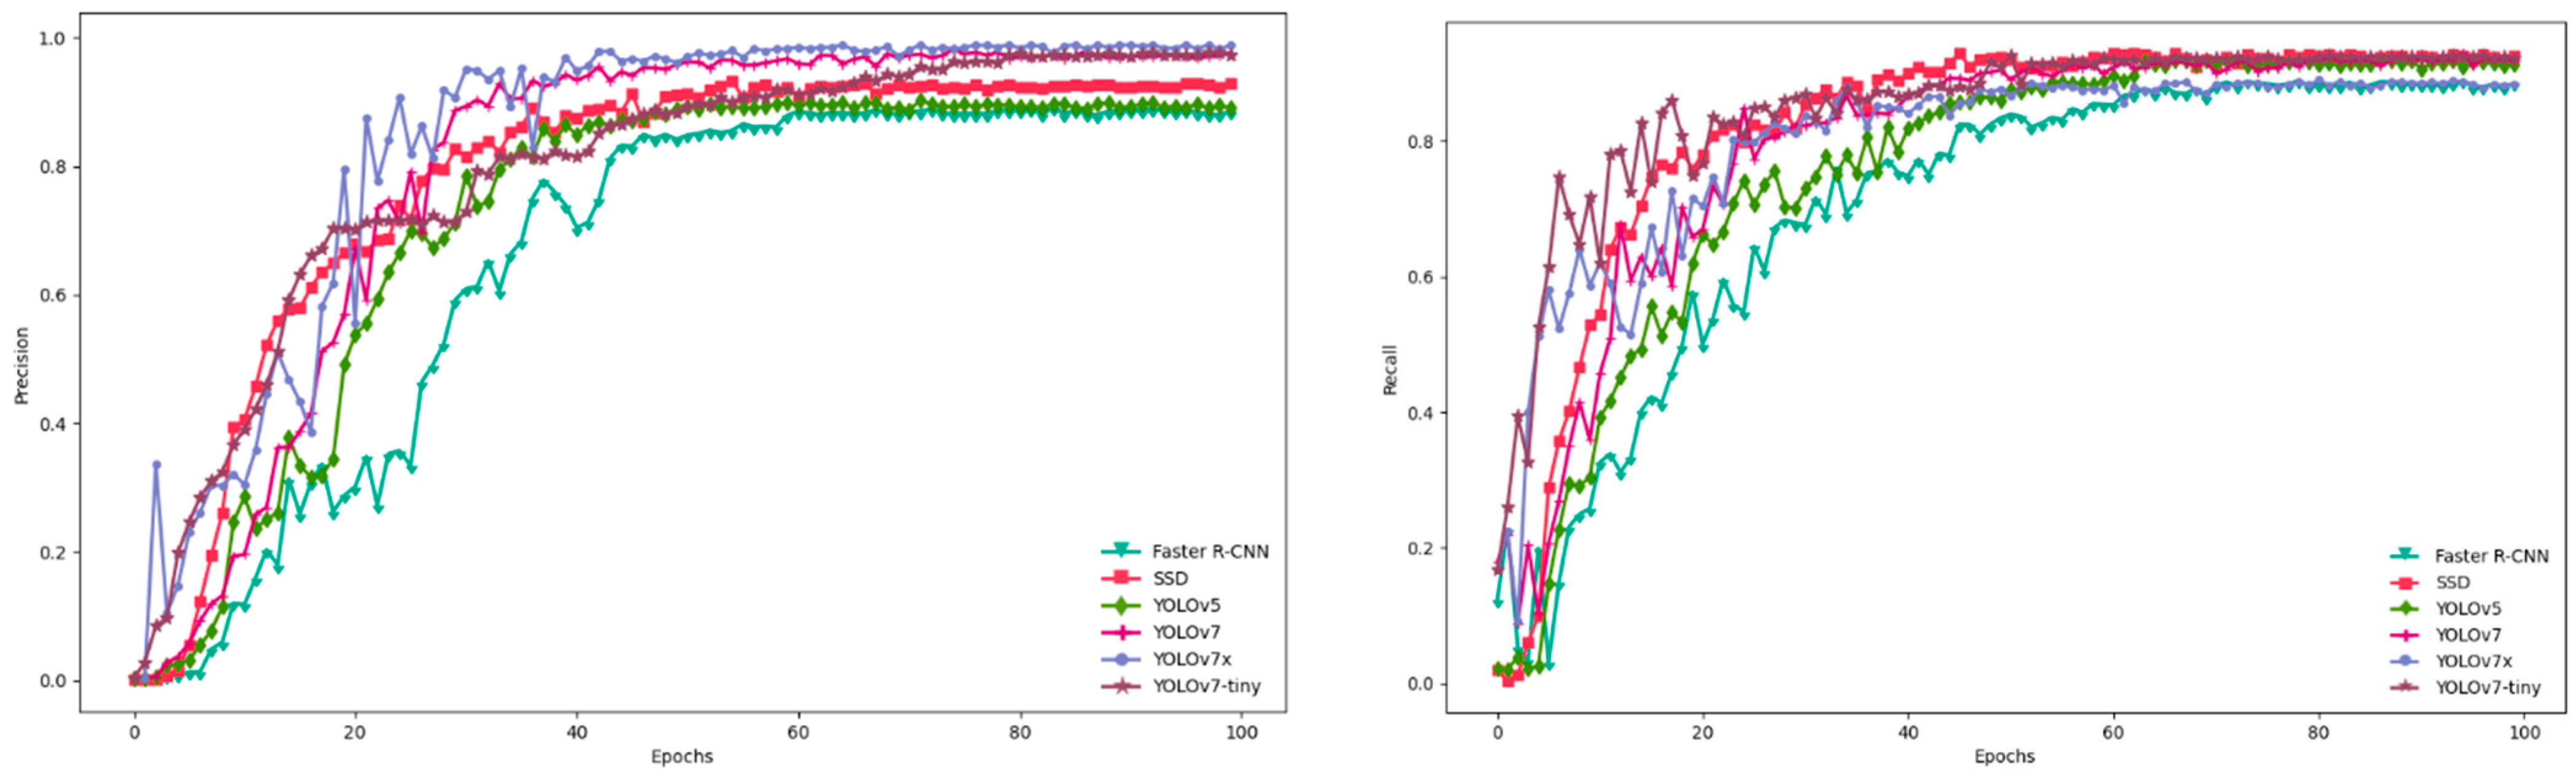
3.1. Comparison of Models
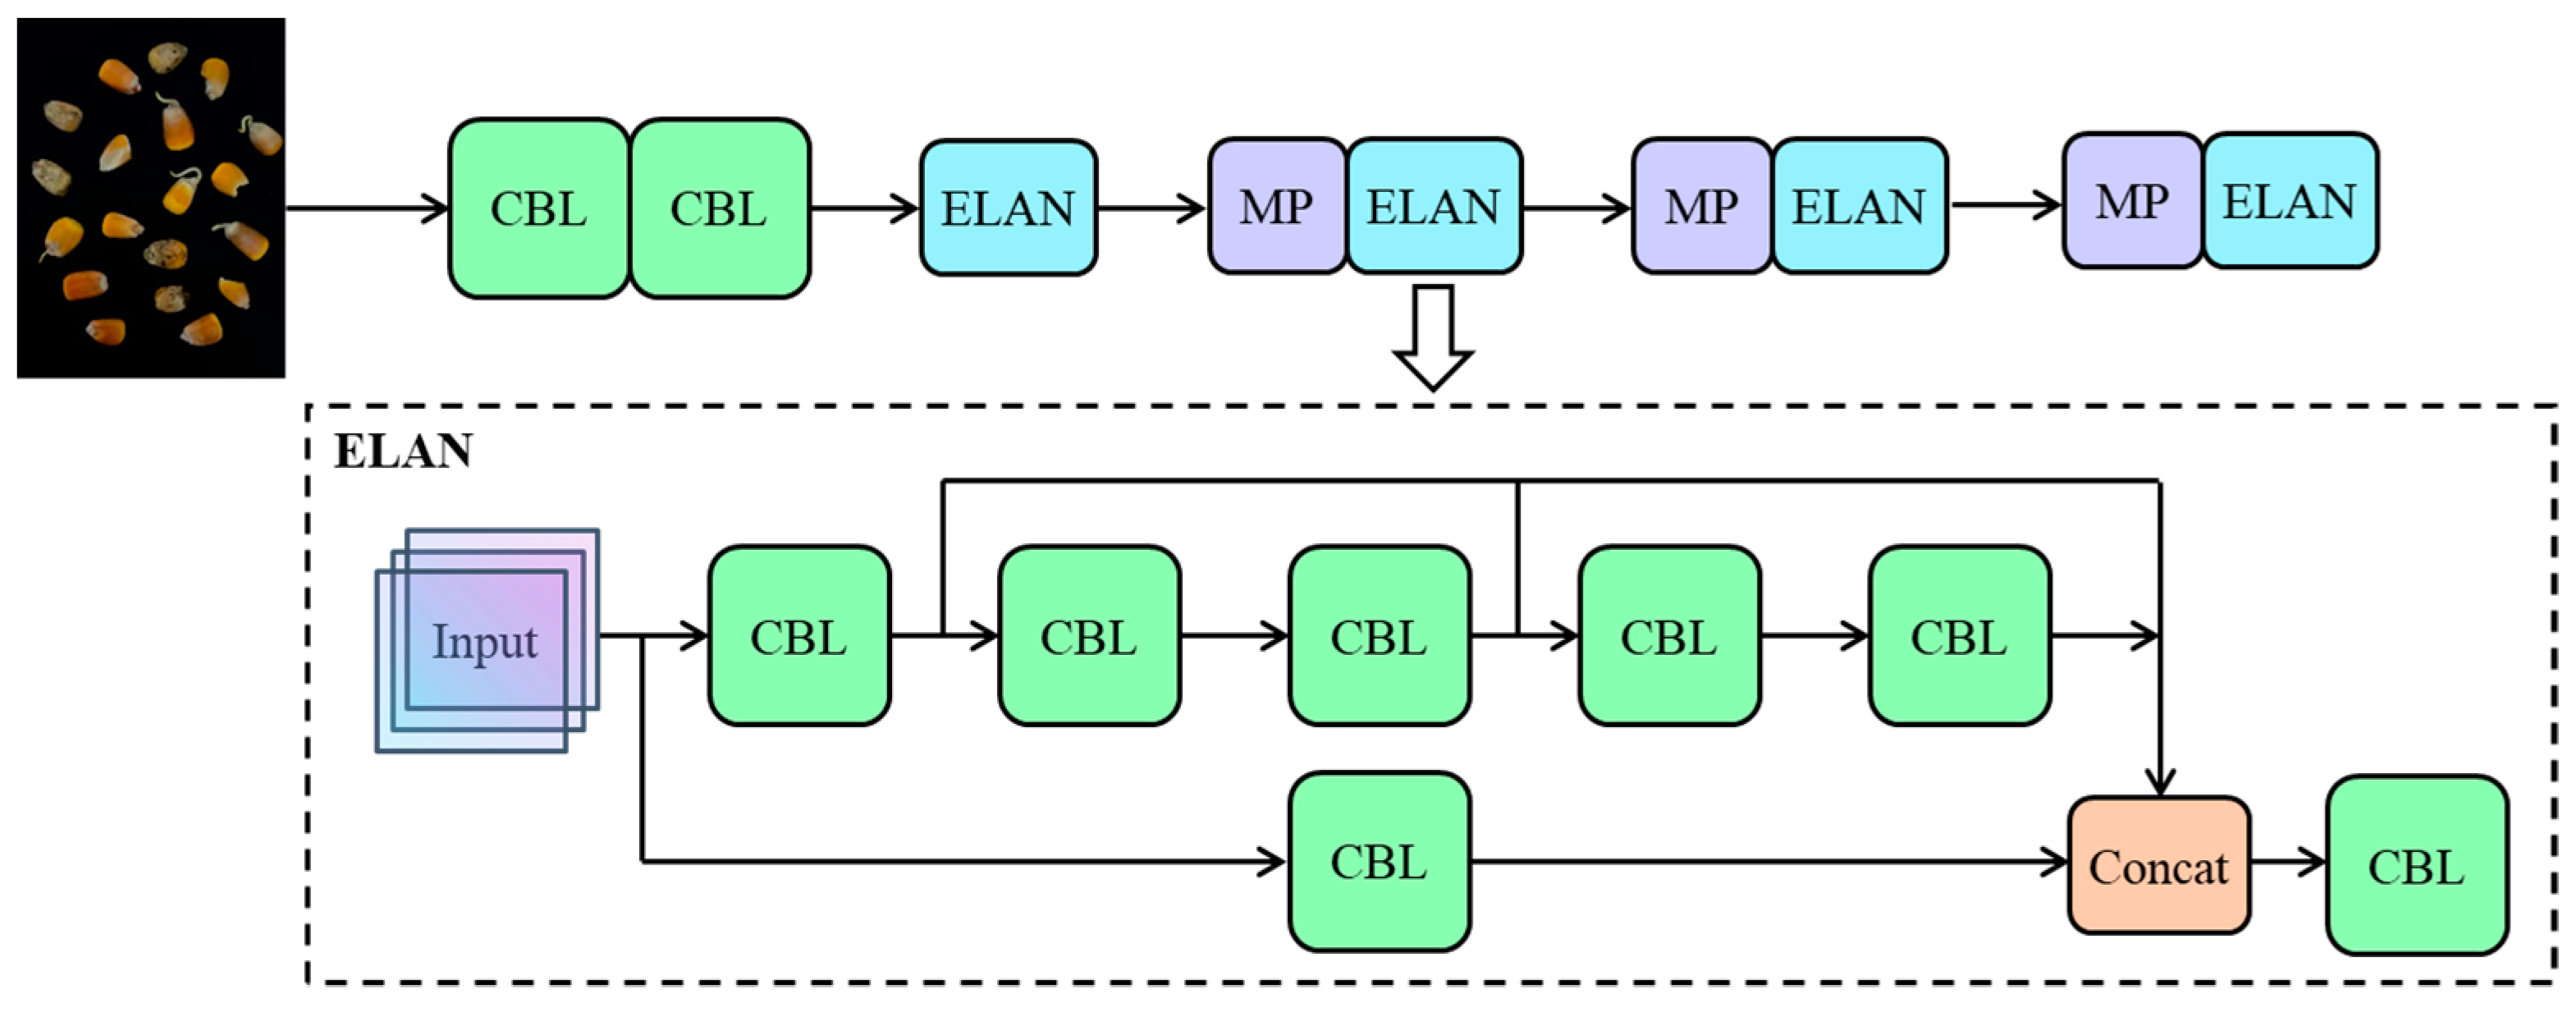
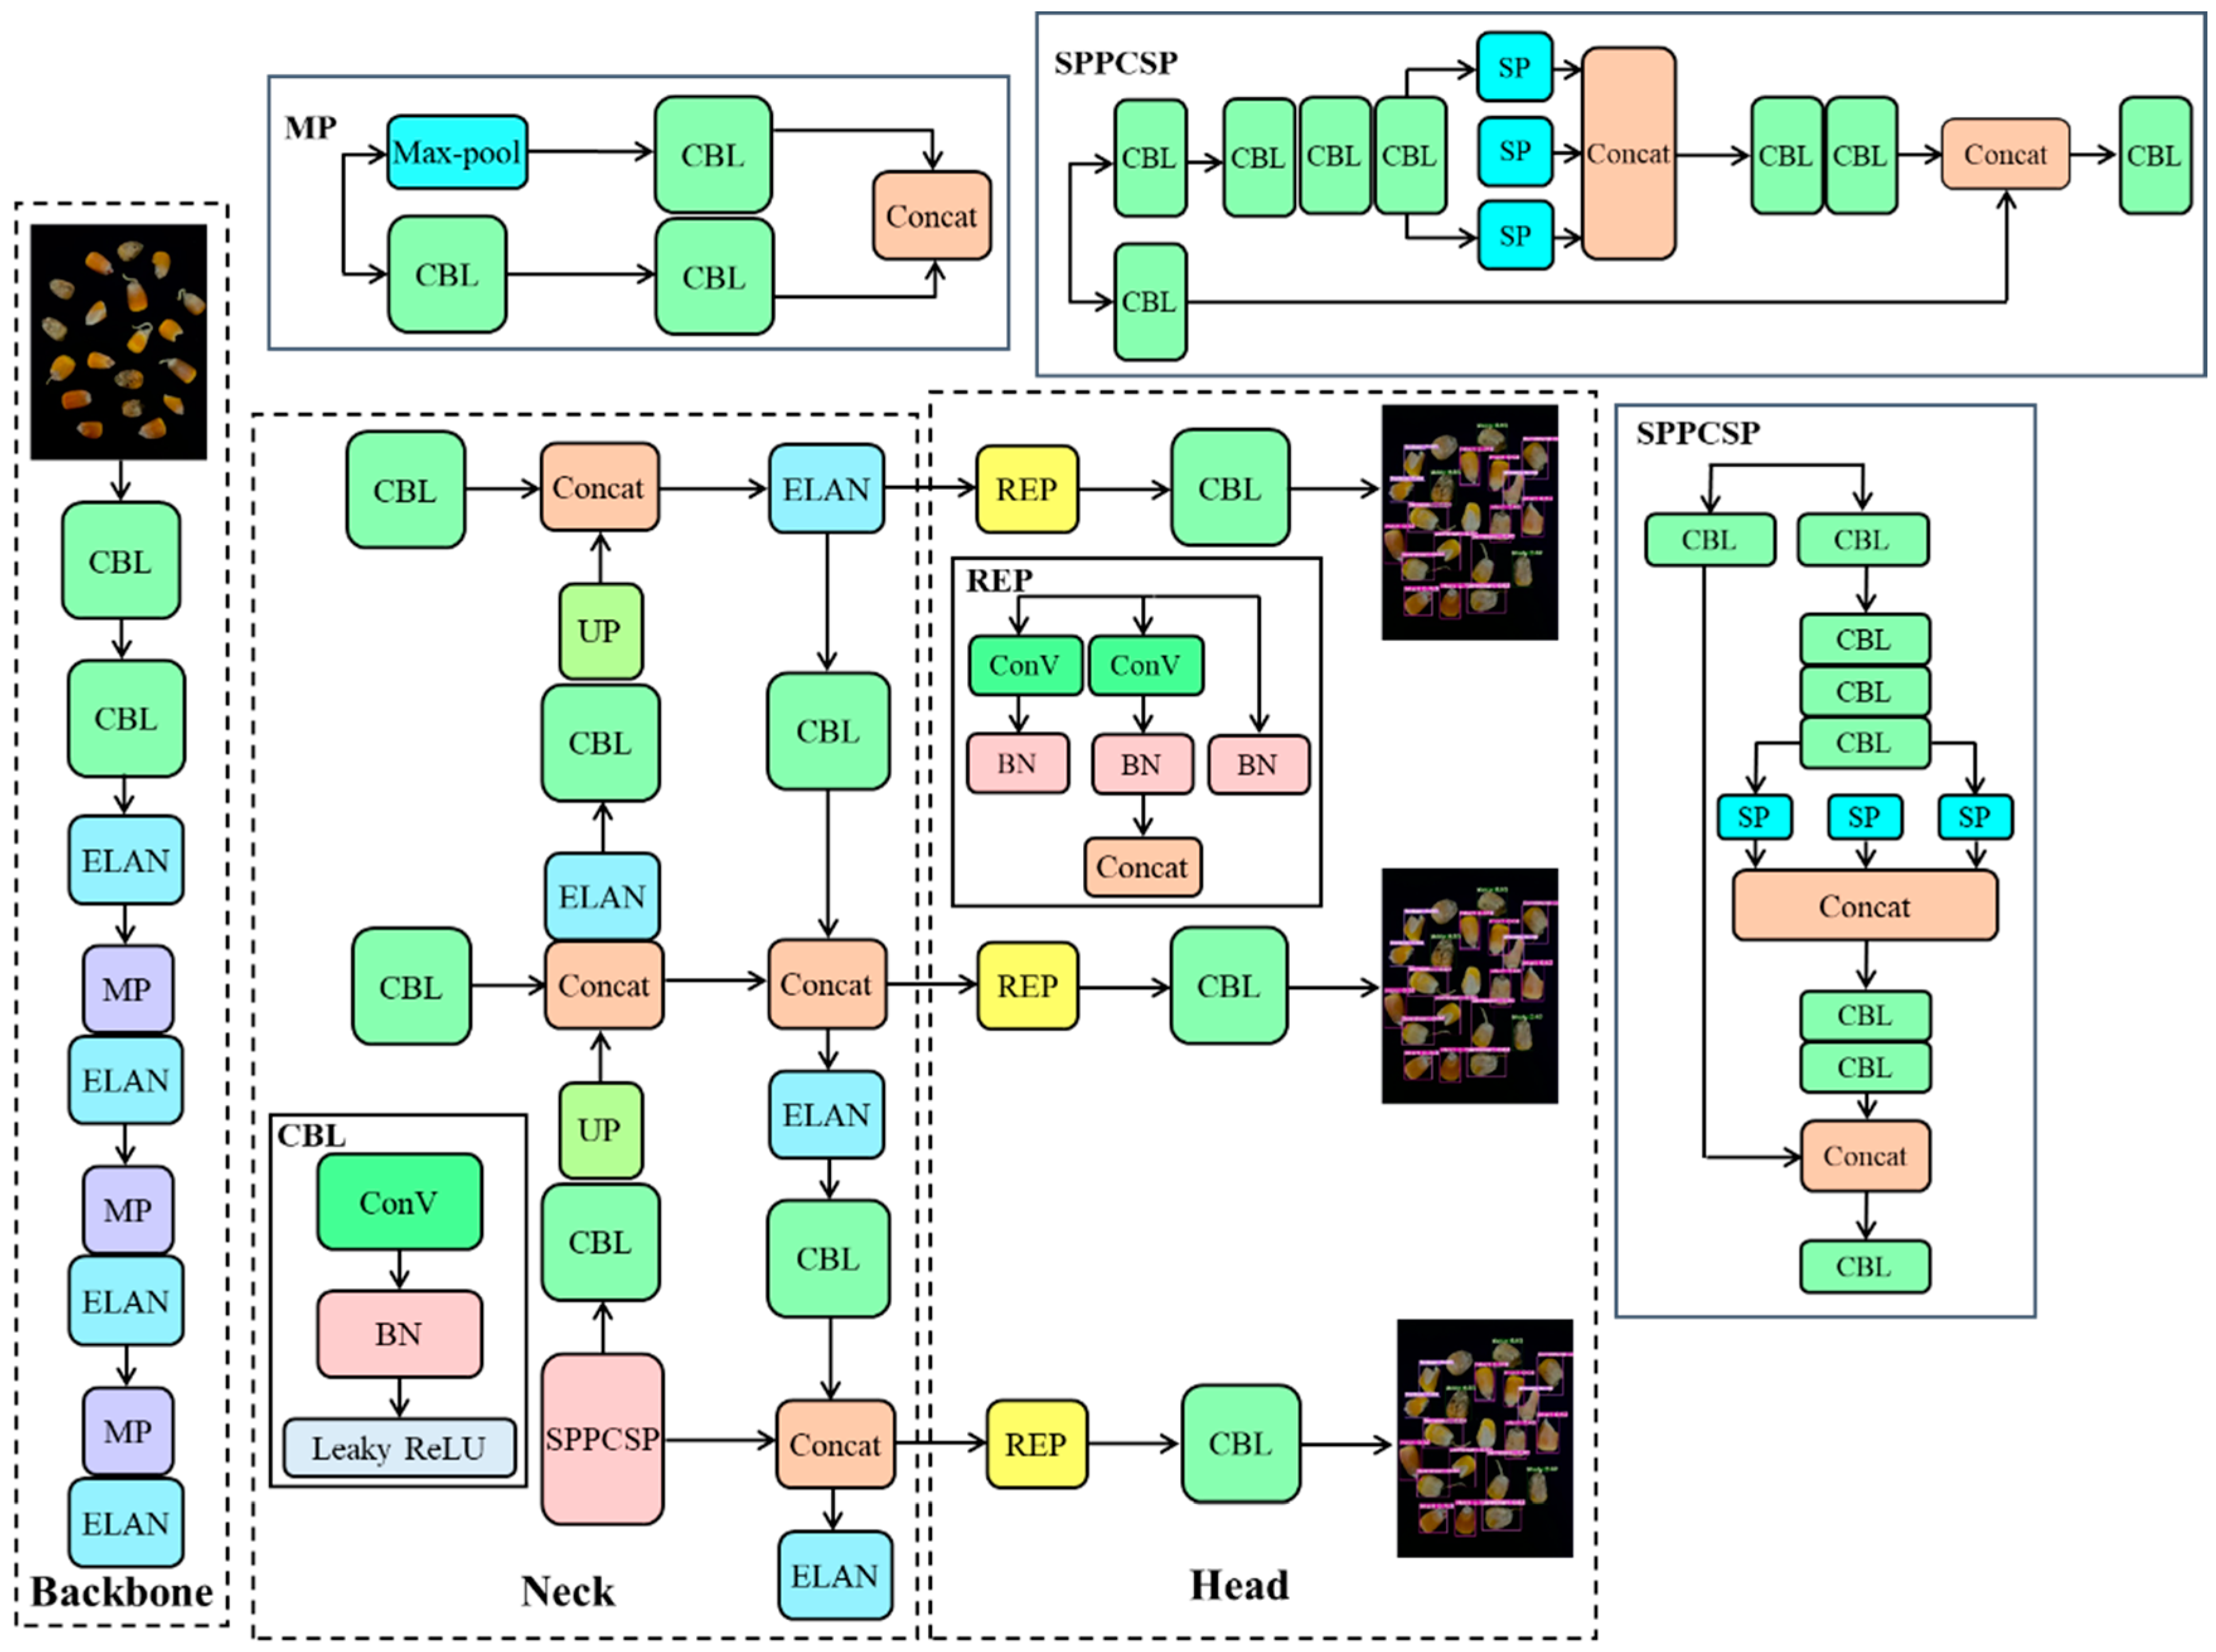
3.2. YOLOv7-Tiny Structure
3.3. YOLOv7-MEF
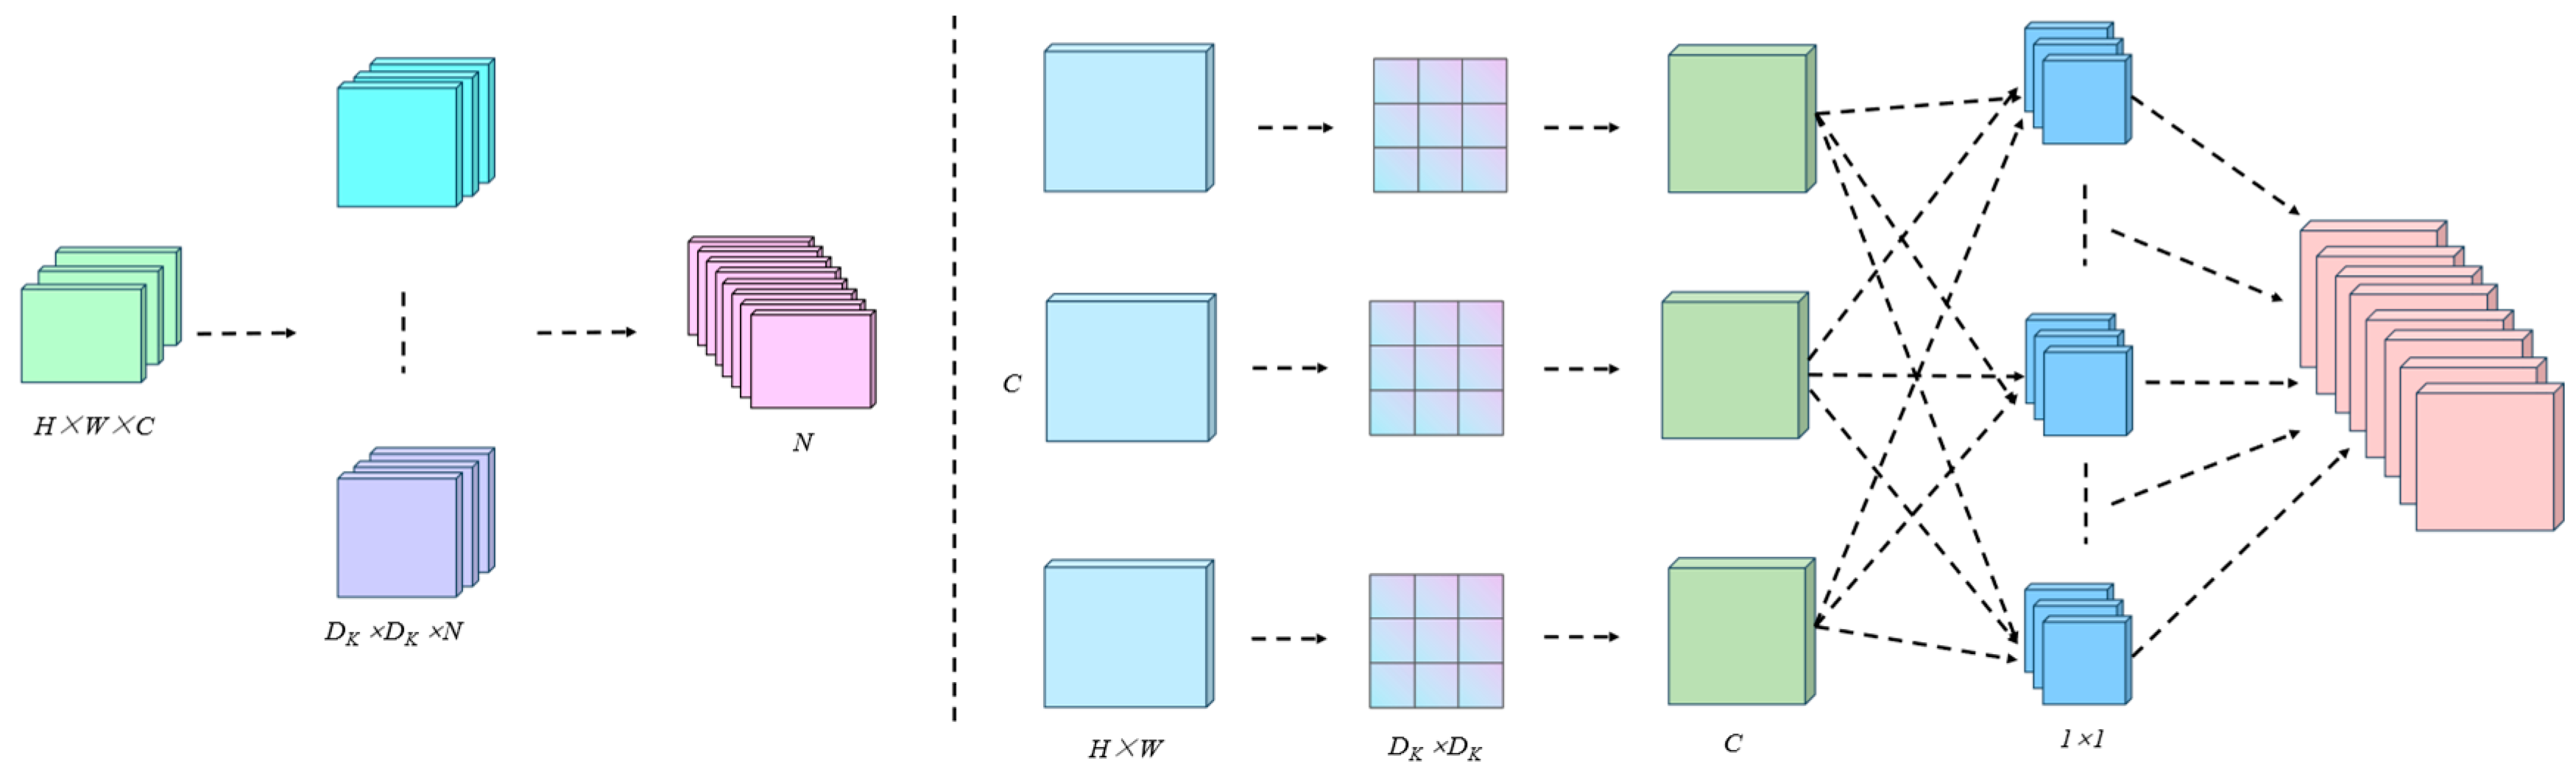
3.3.1. MobileNetV3
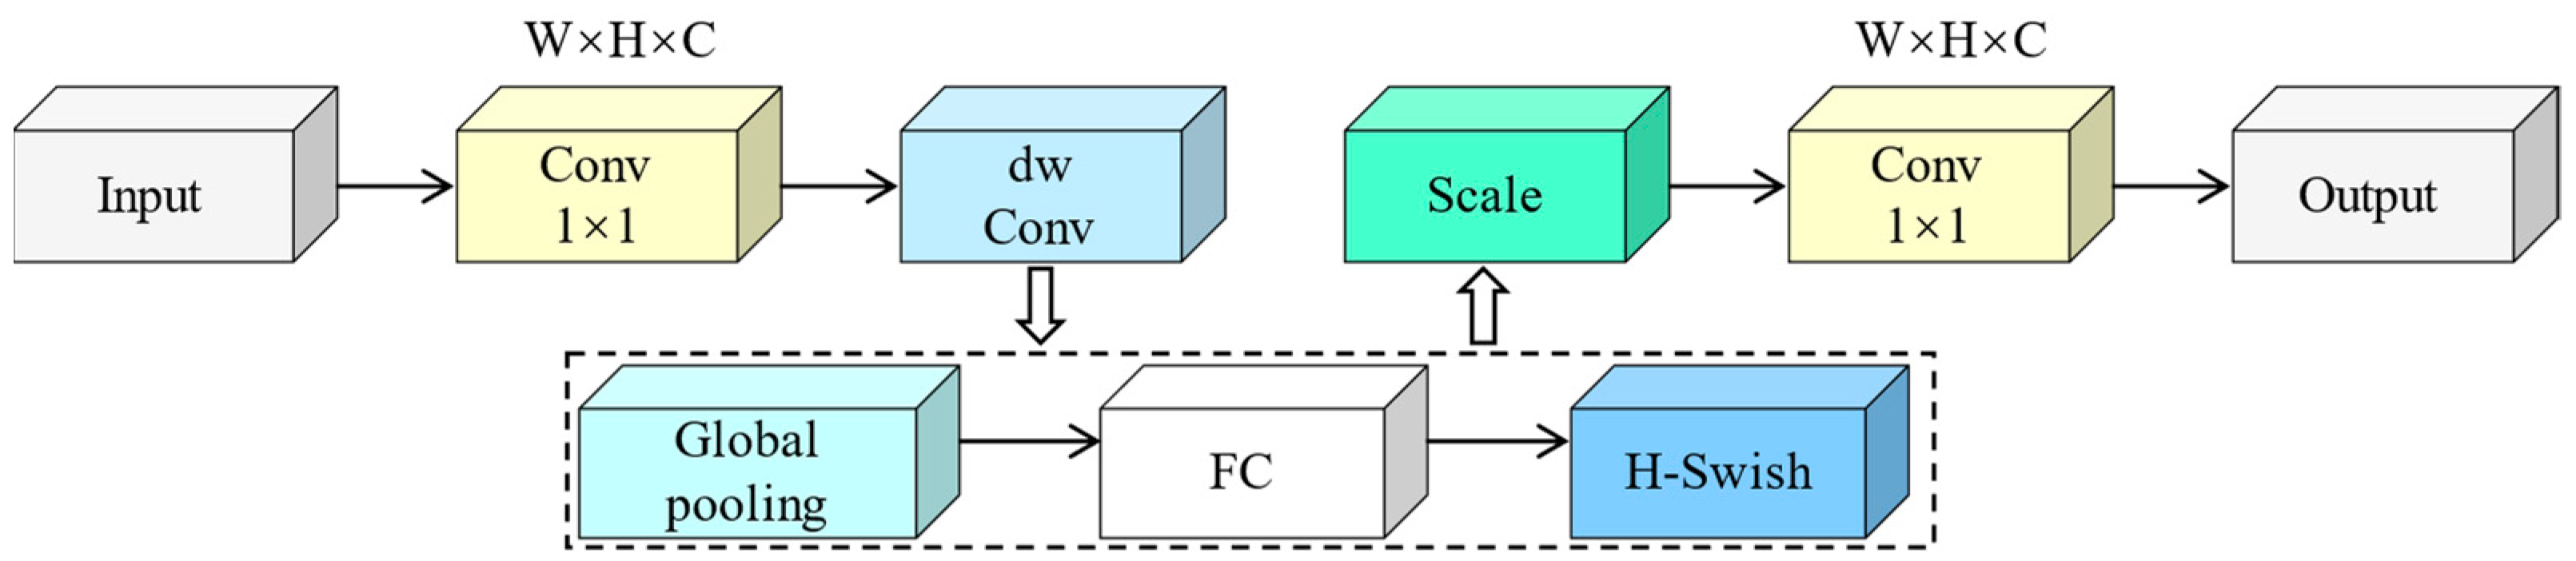
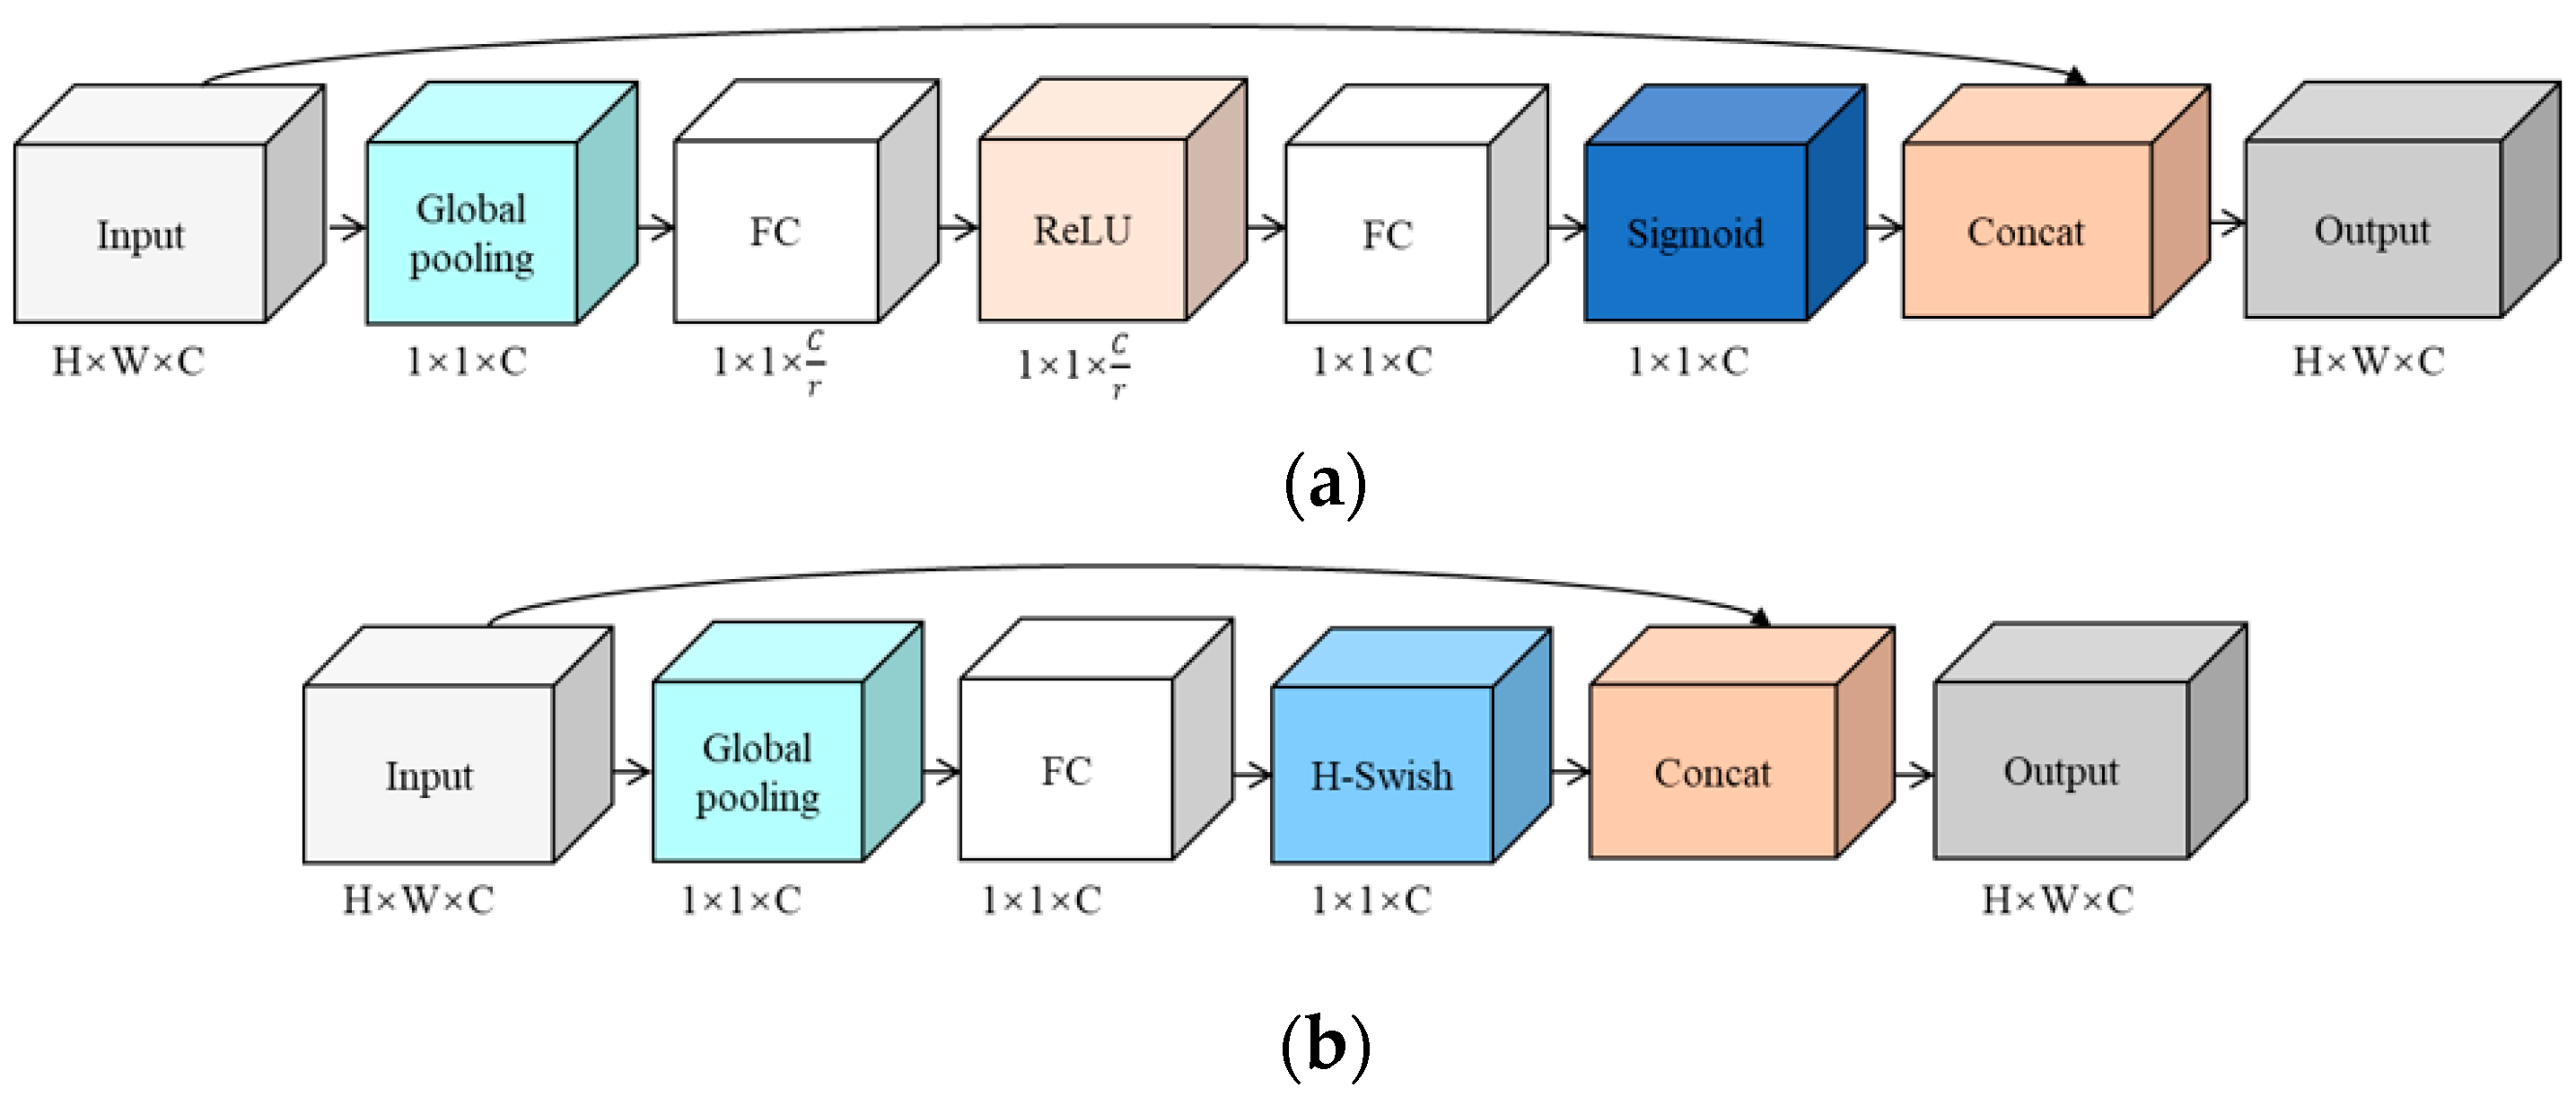
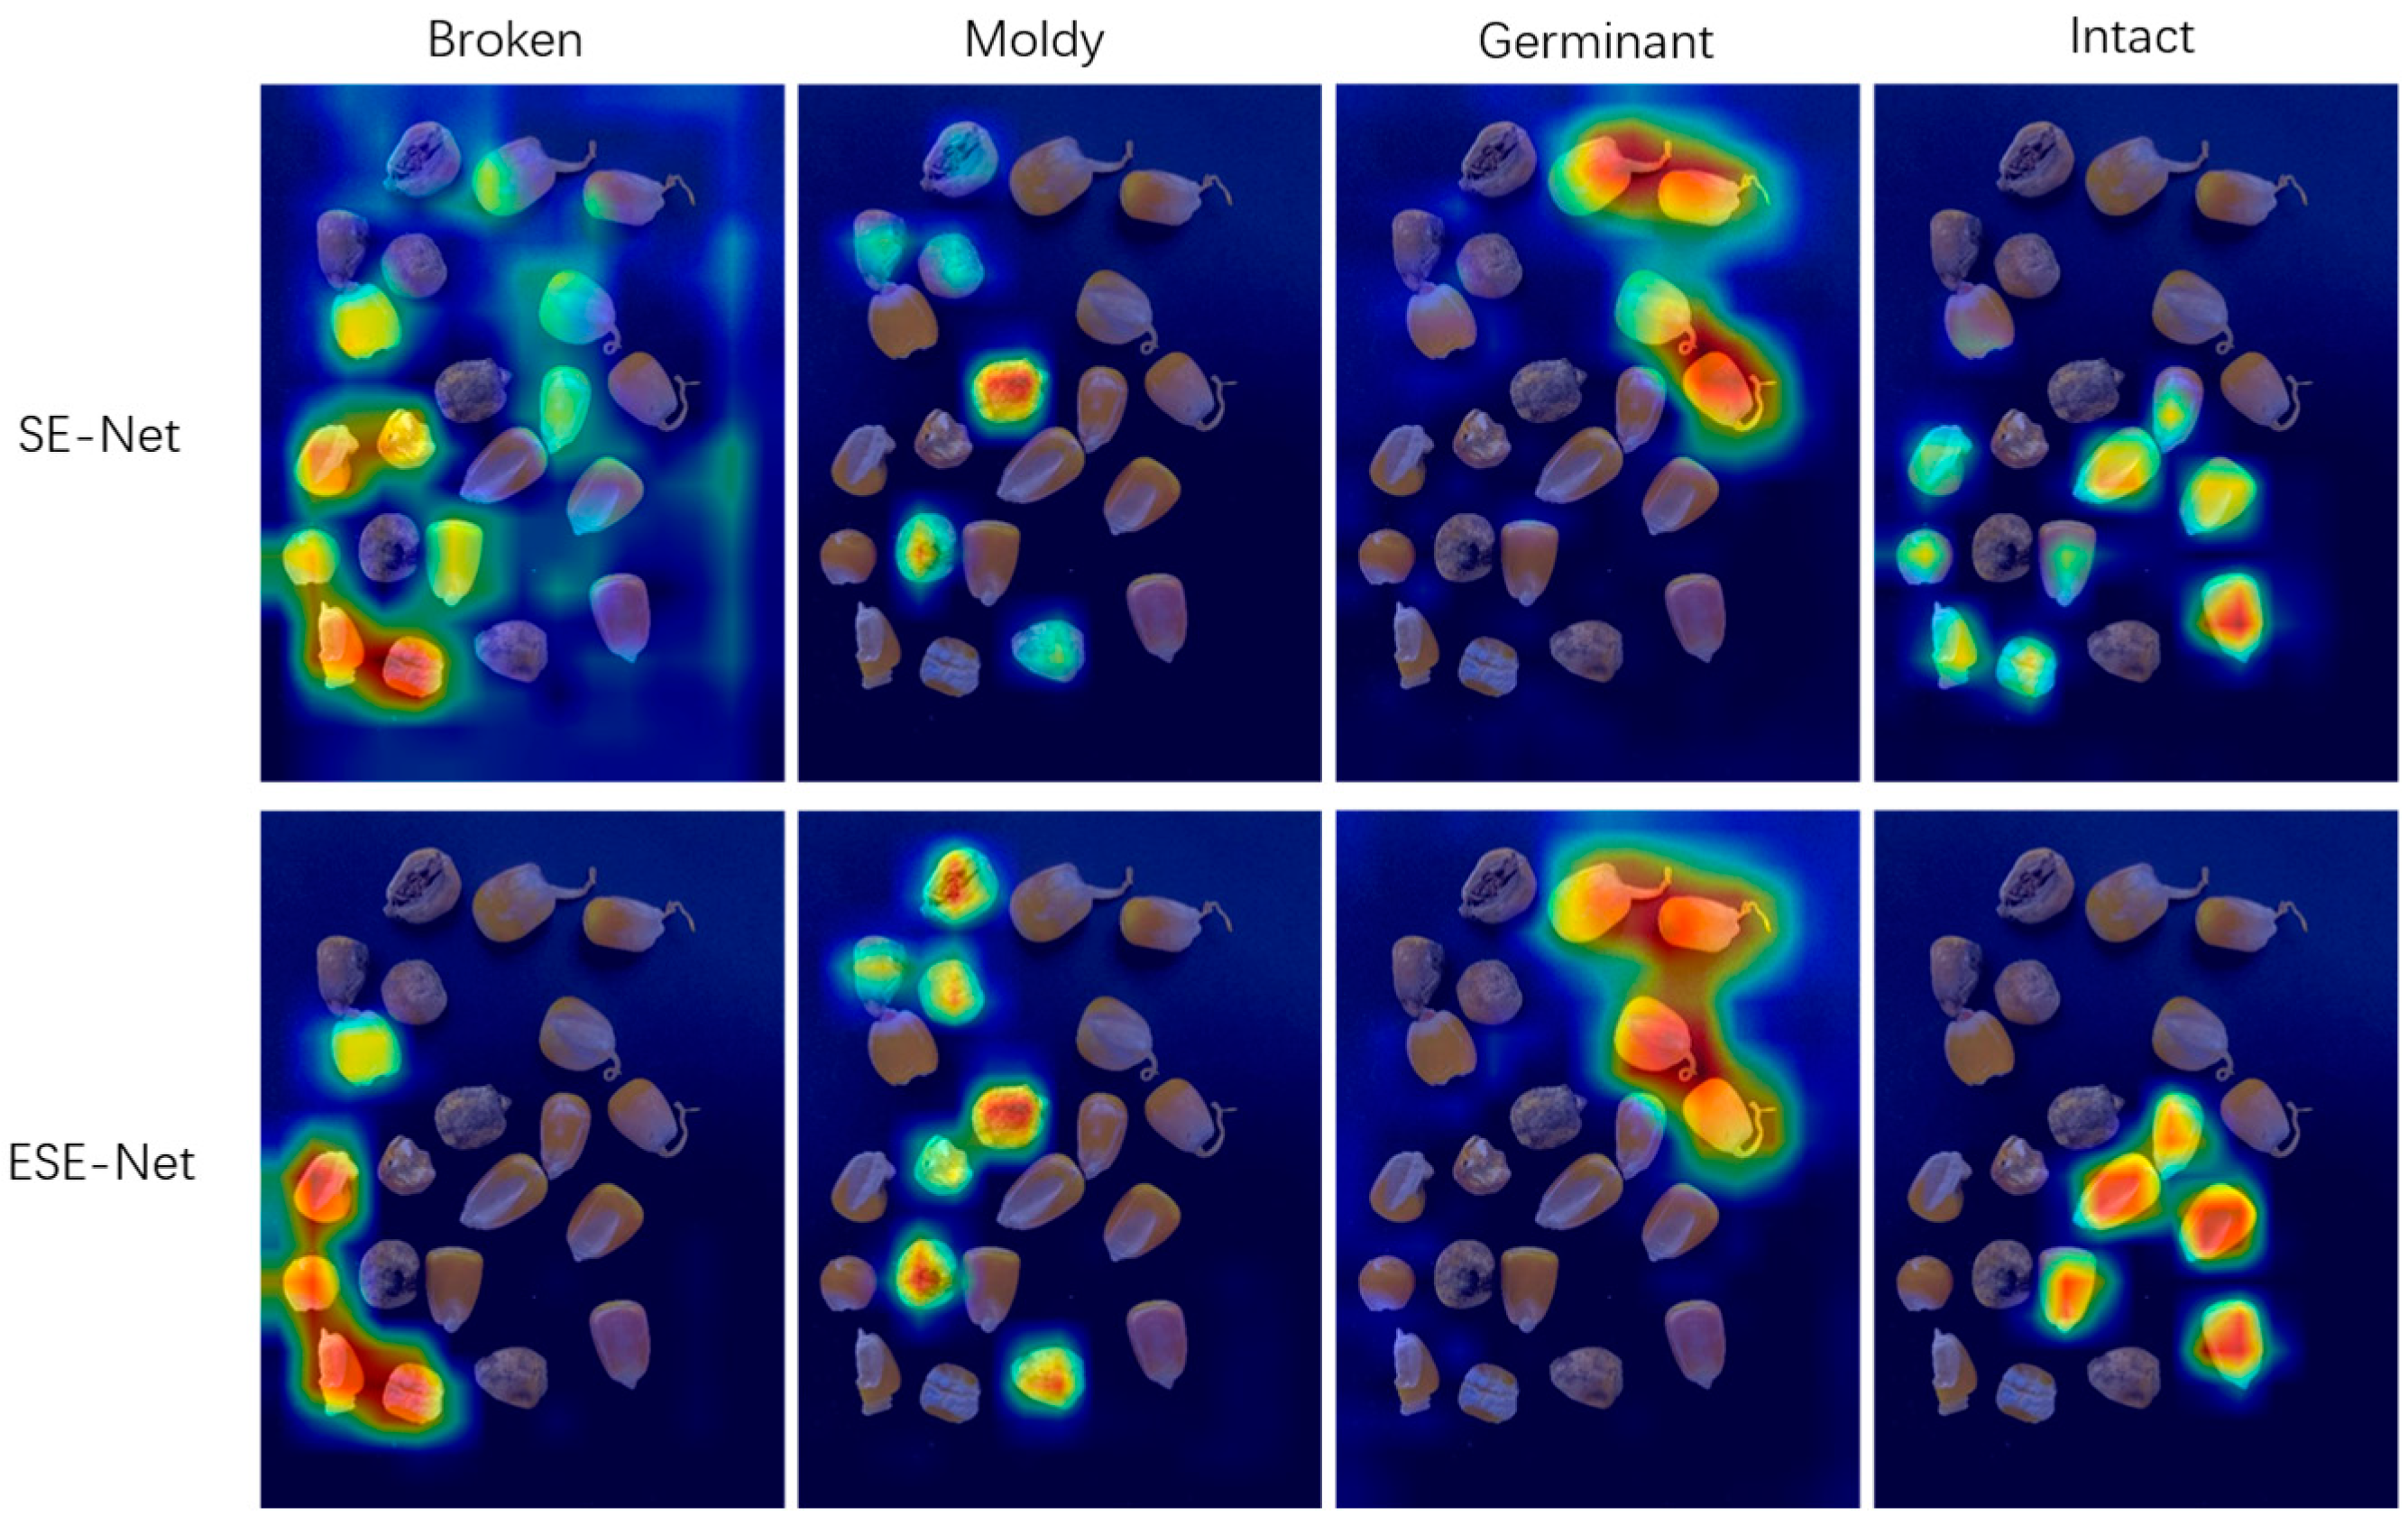
3.3.2. ESE-Net Efficient Attention Mechanism
3.3.3. Focal-EIoU Loss
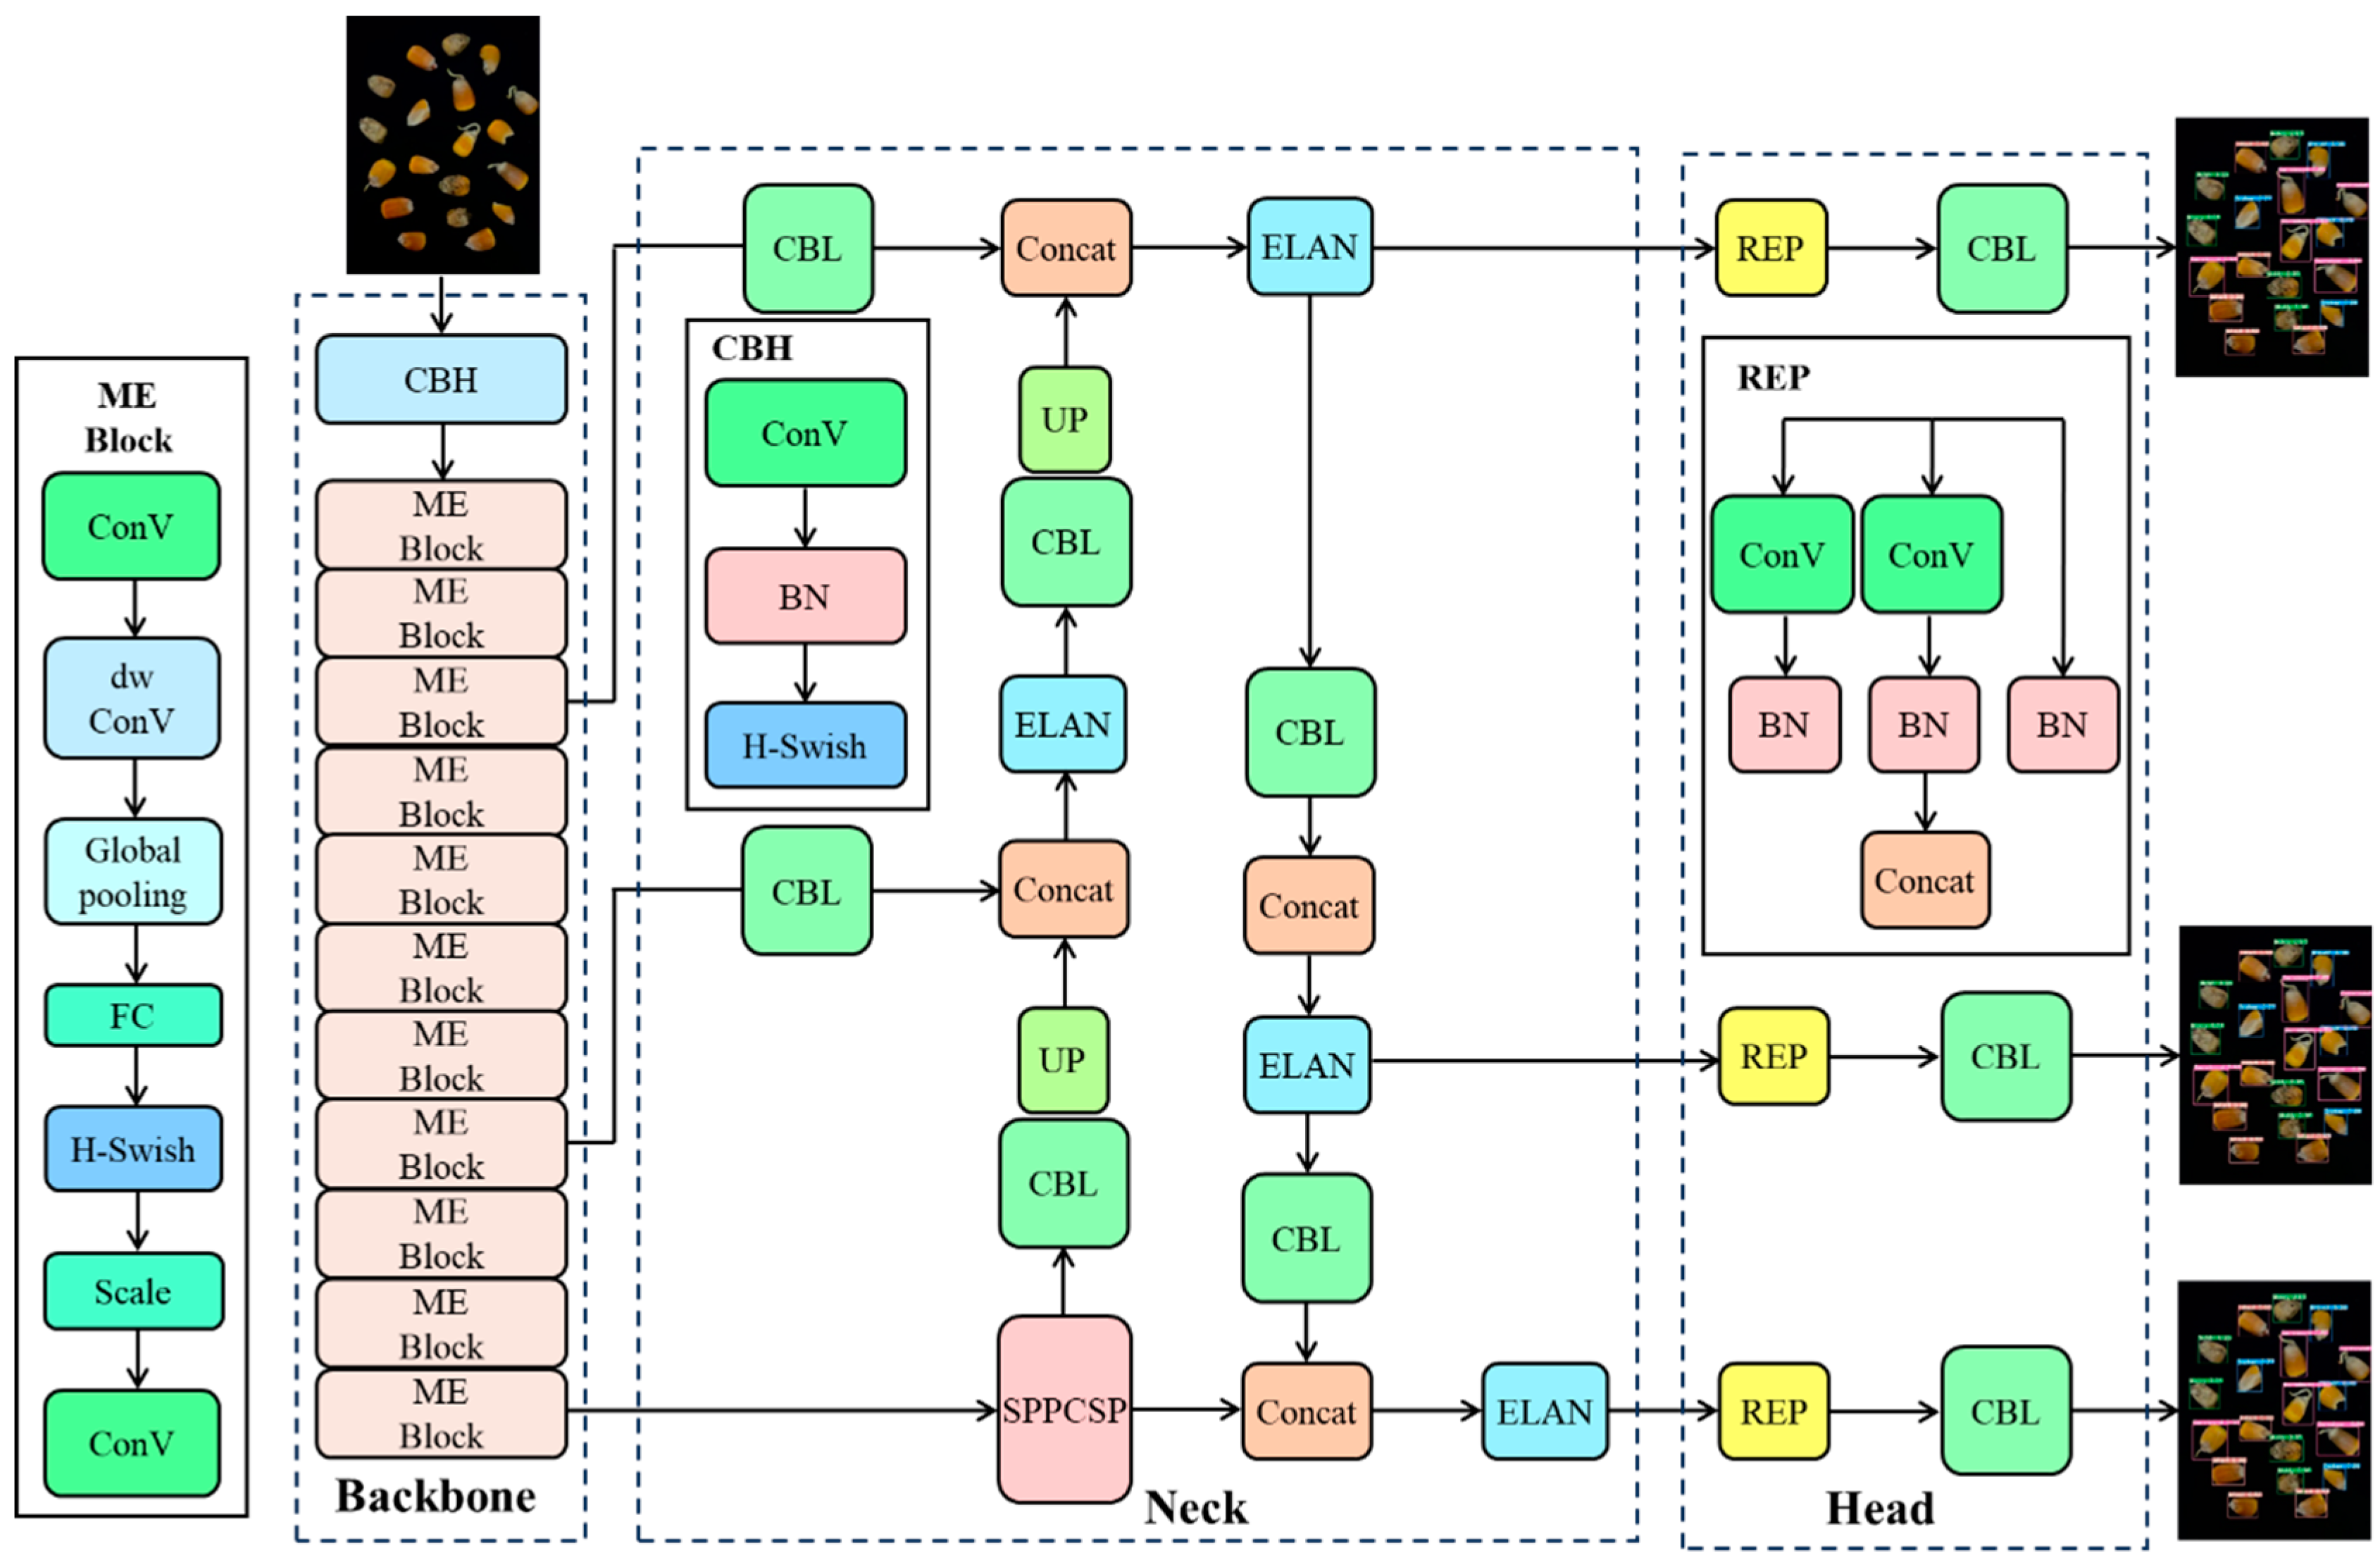
3.3.4. YOLOv7-MEF
4. Model and Algorithm Test
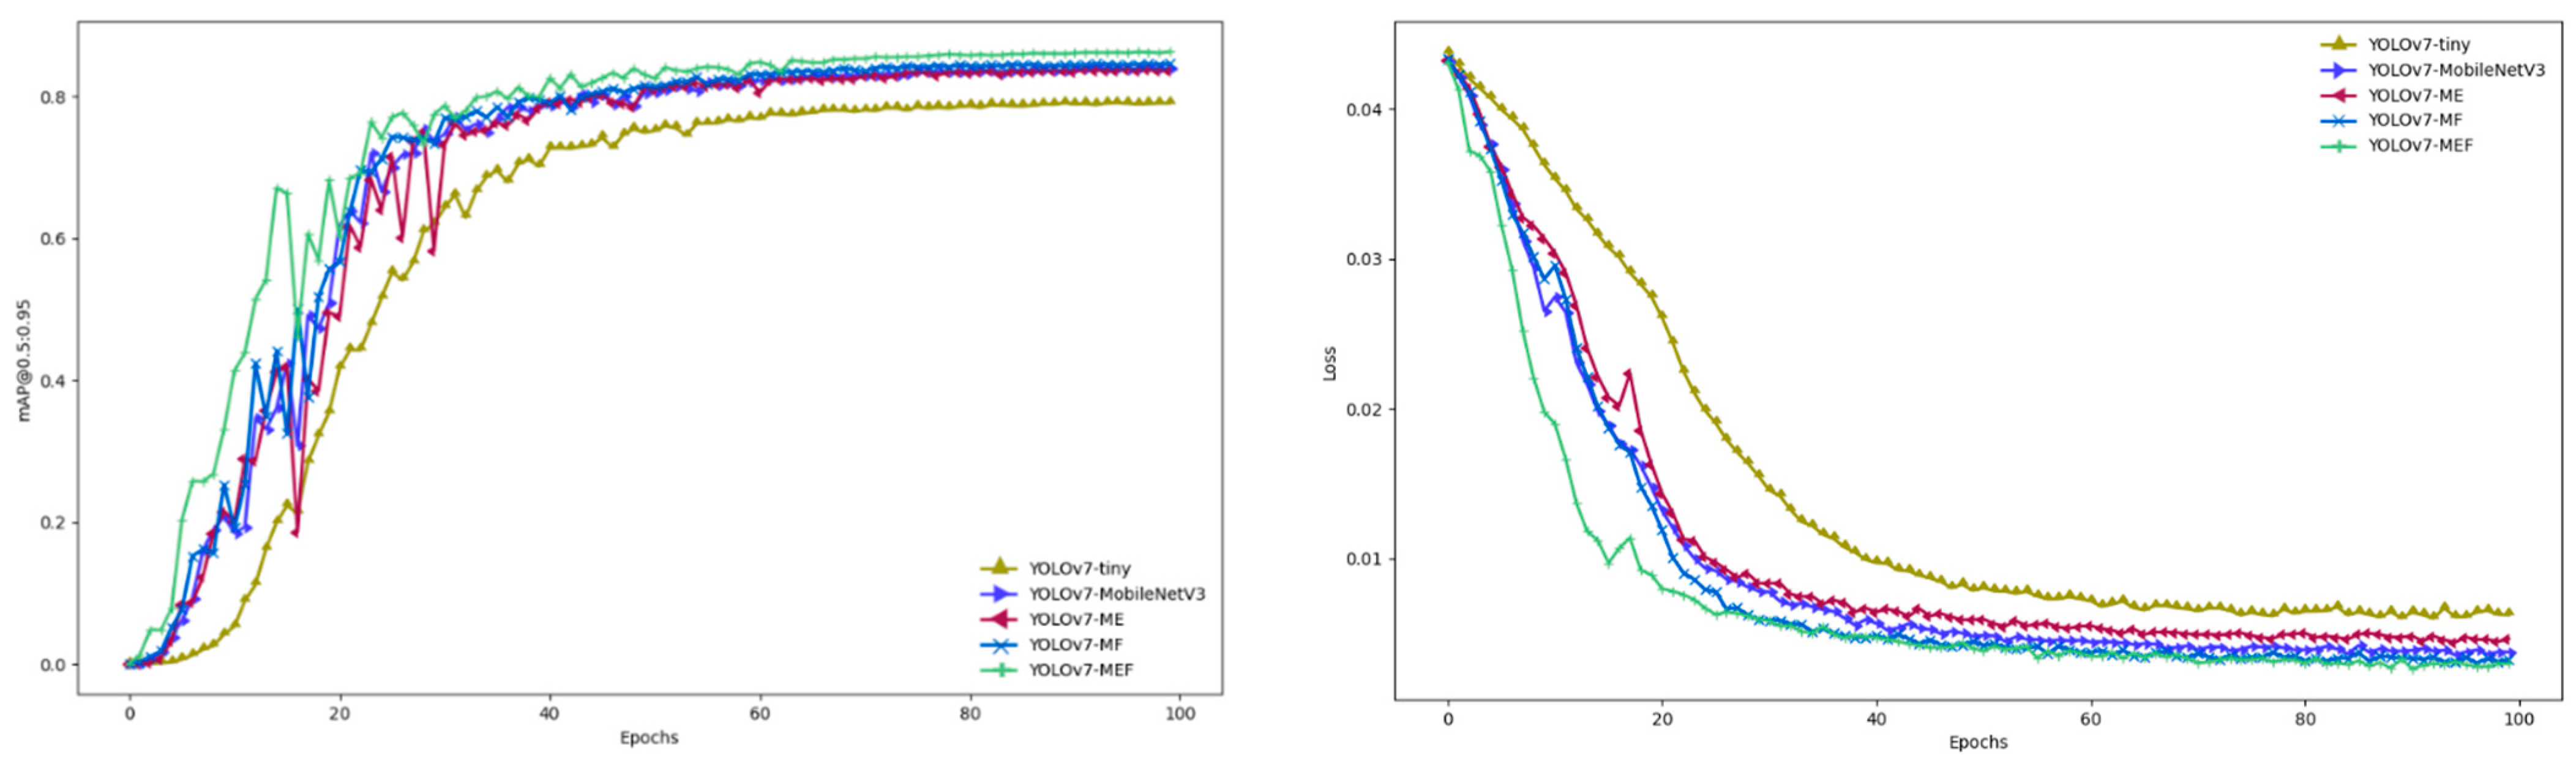
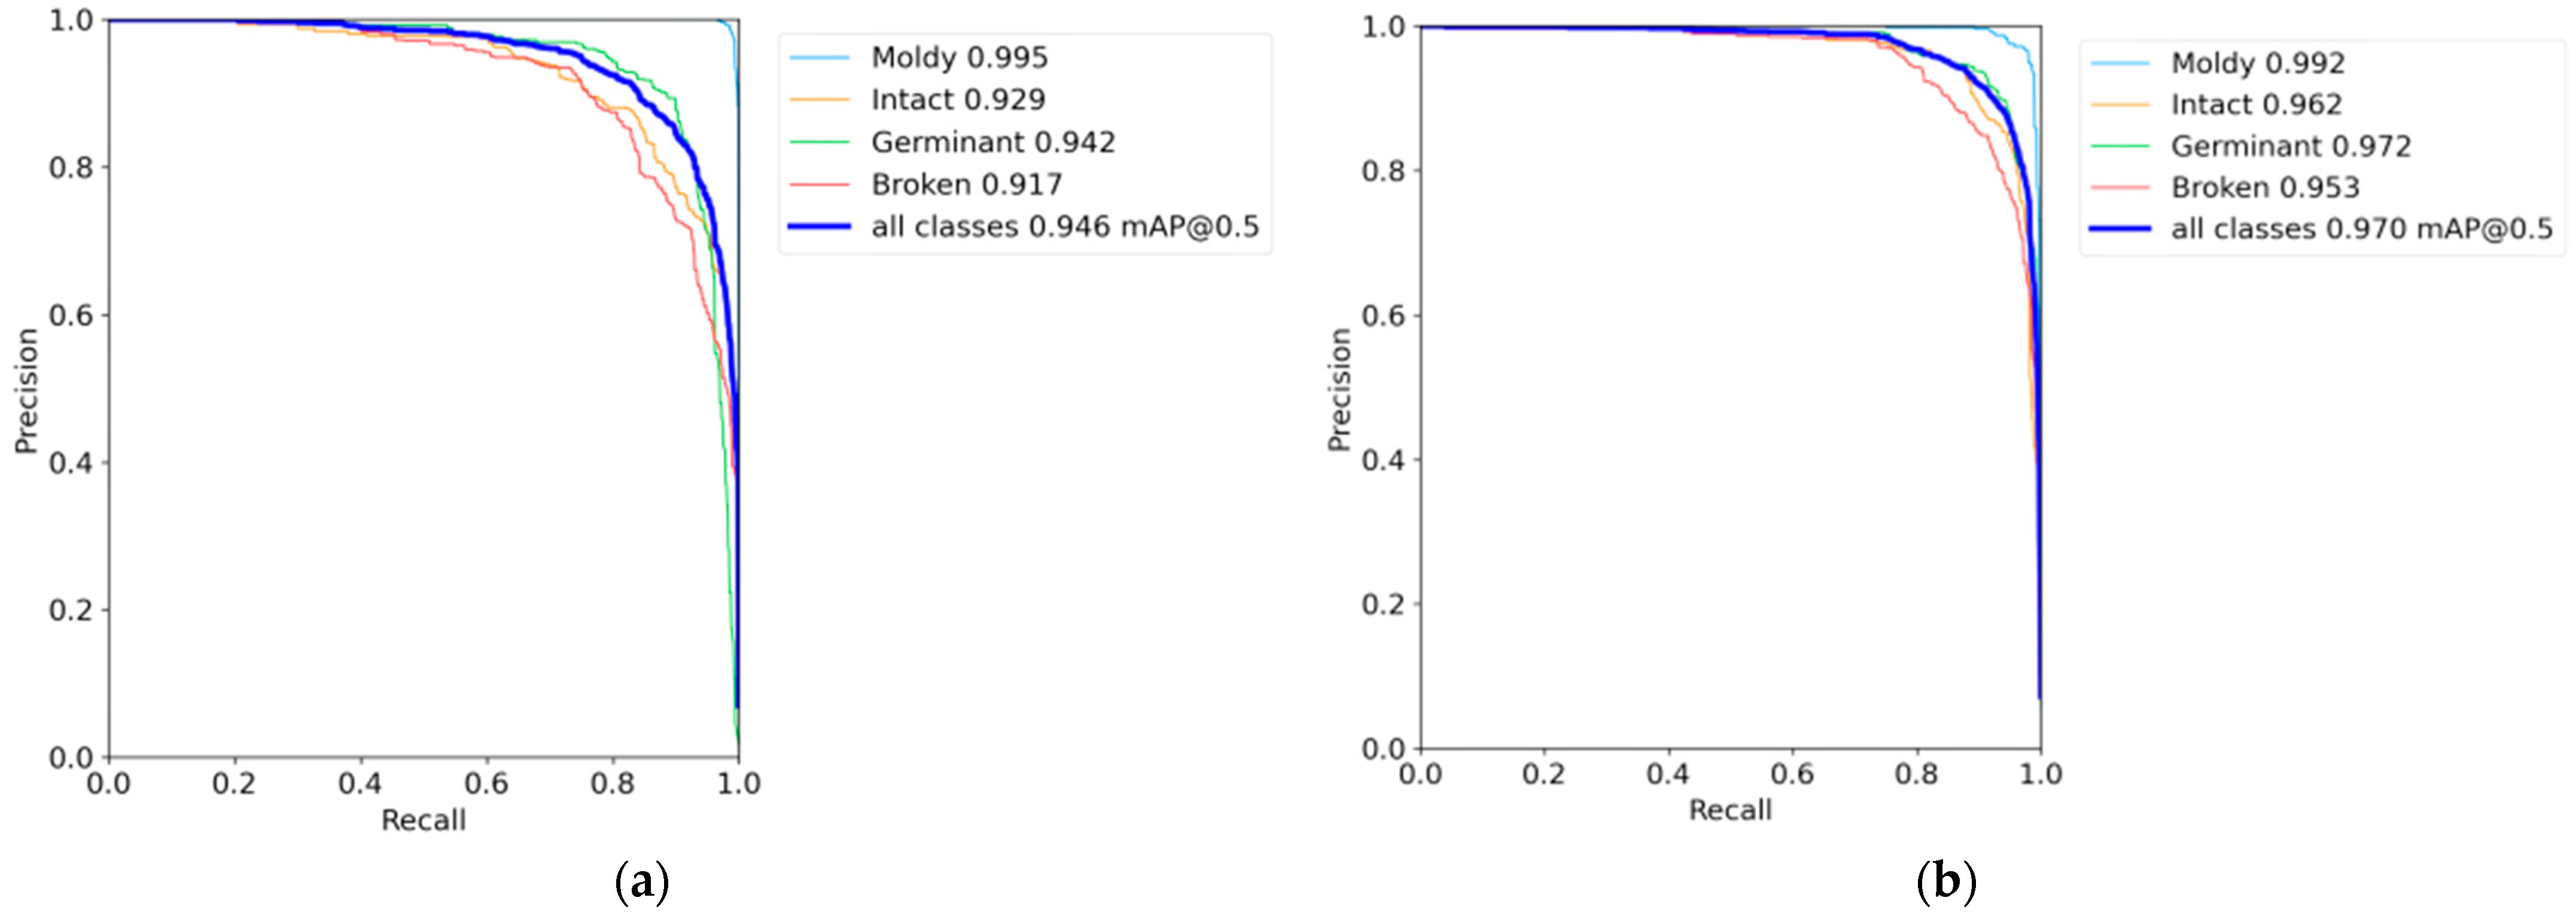
4.1. Ablation Experiment
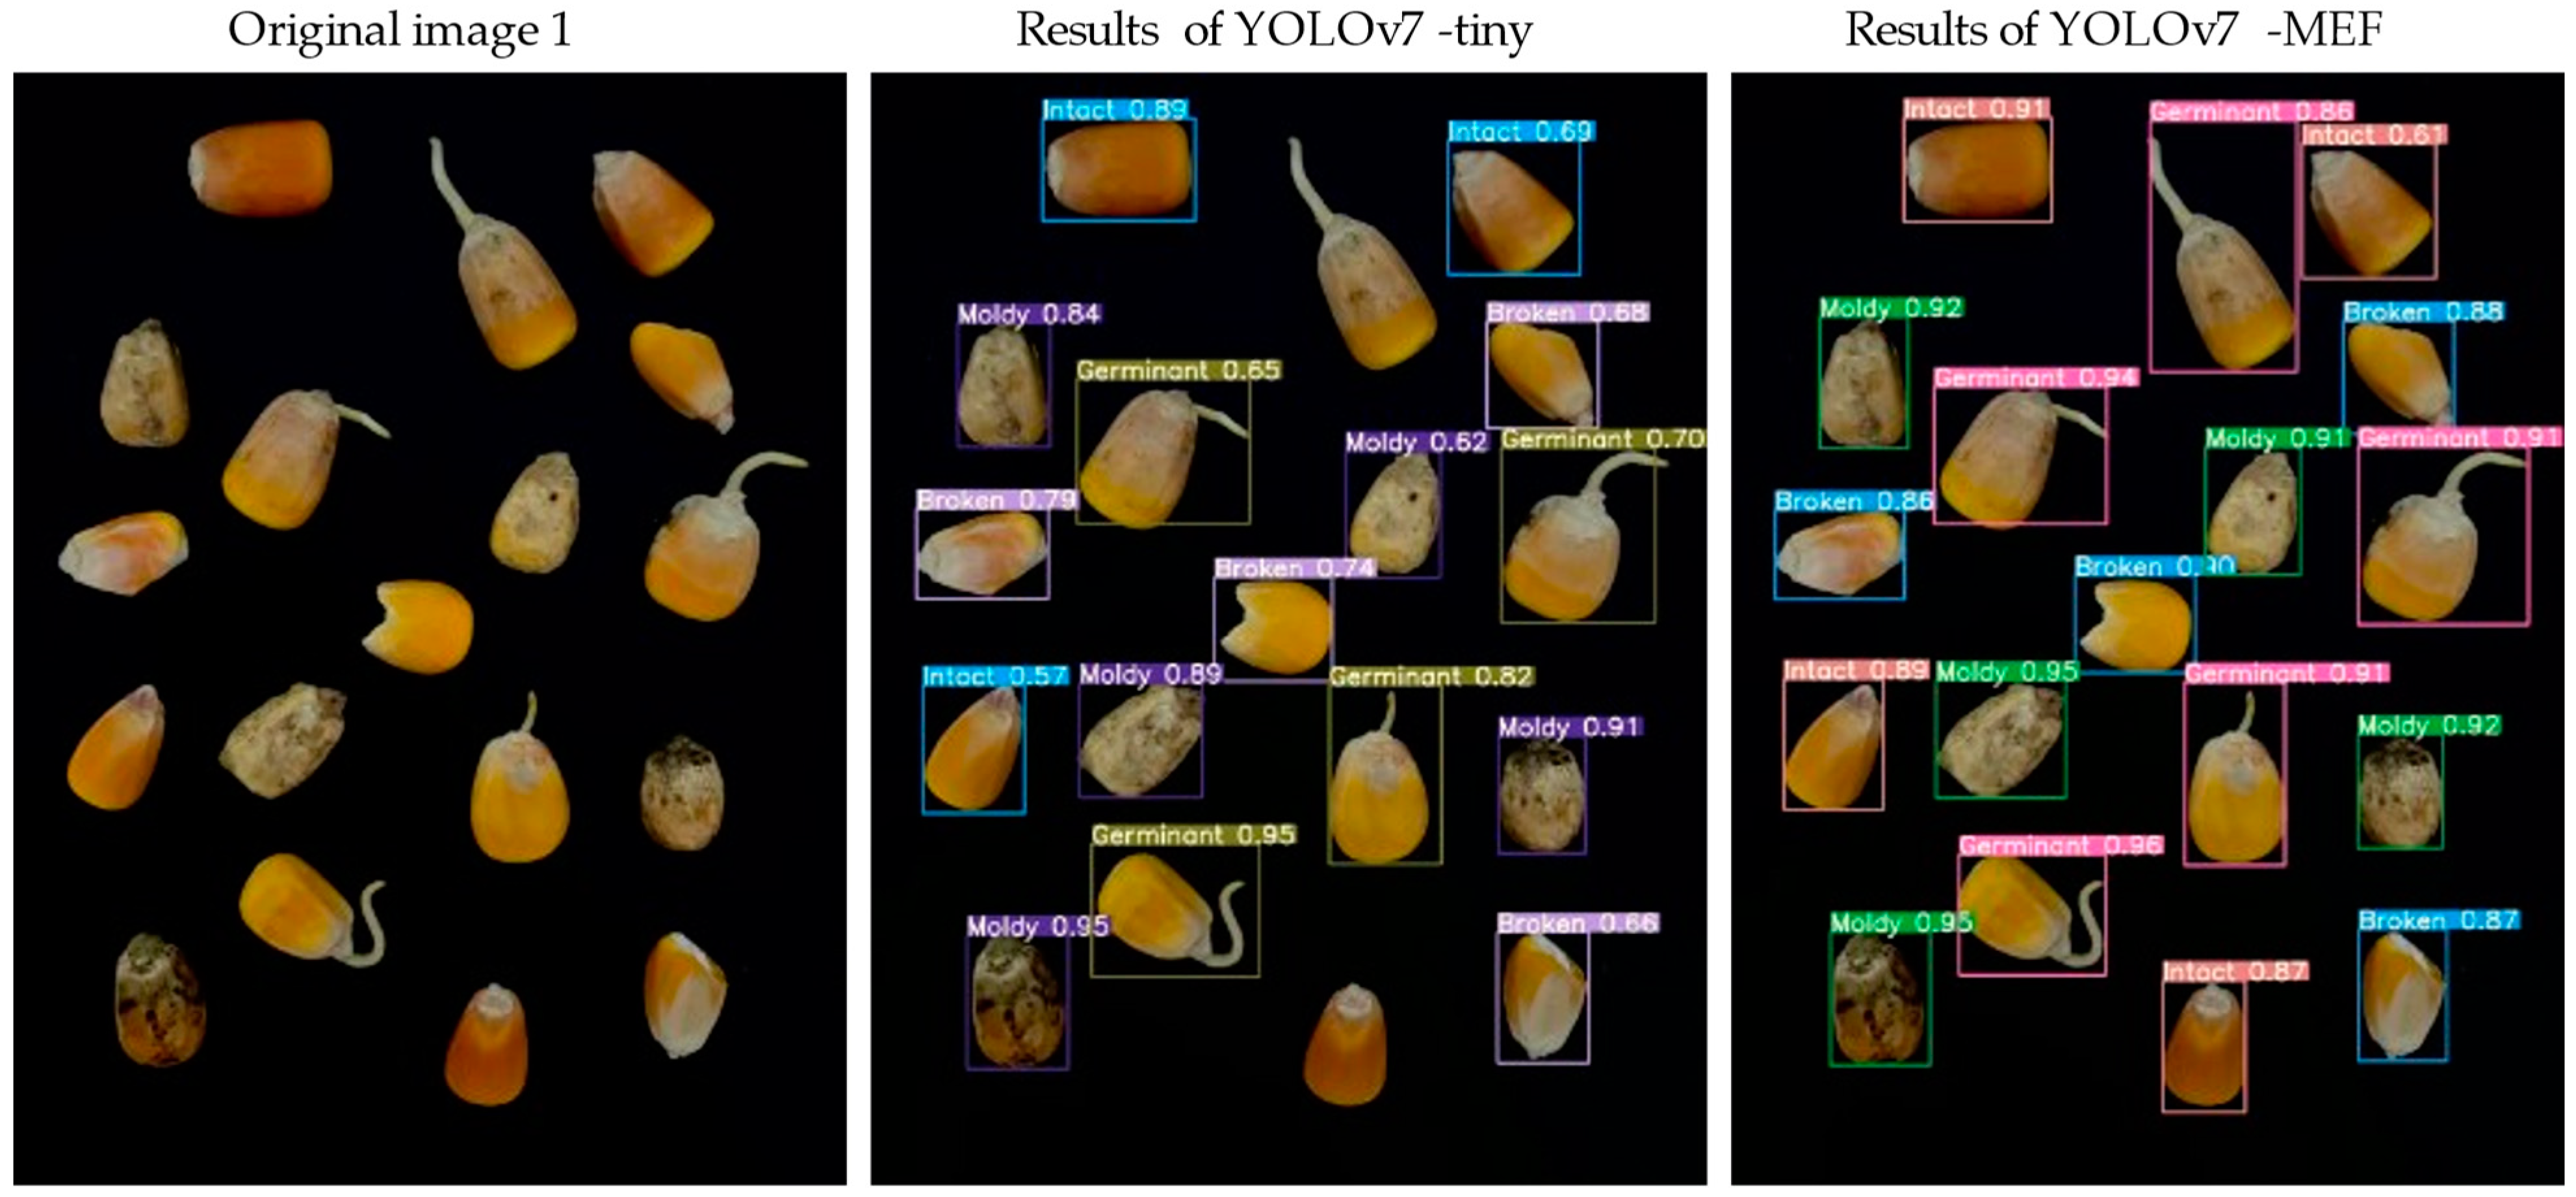
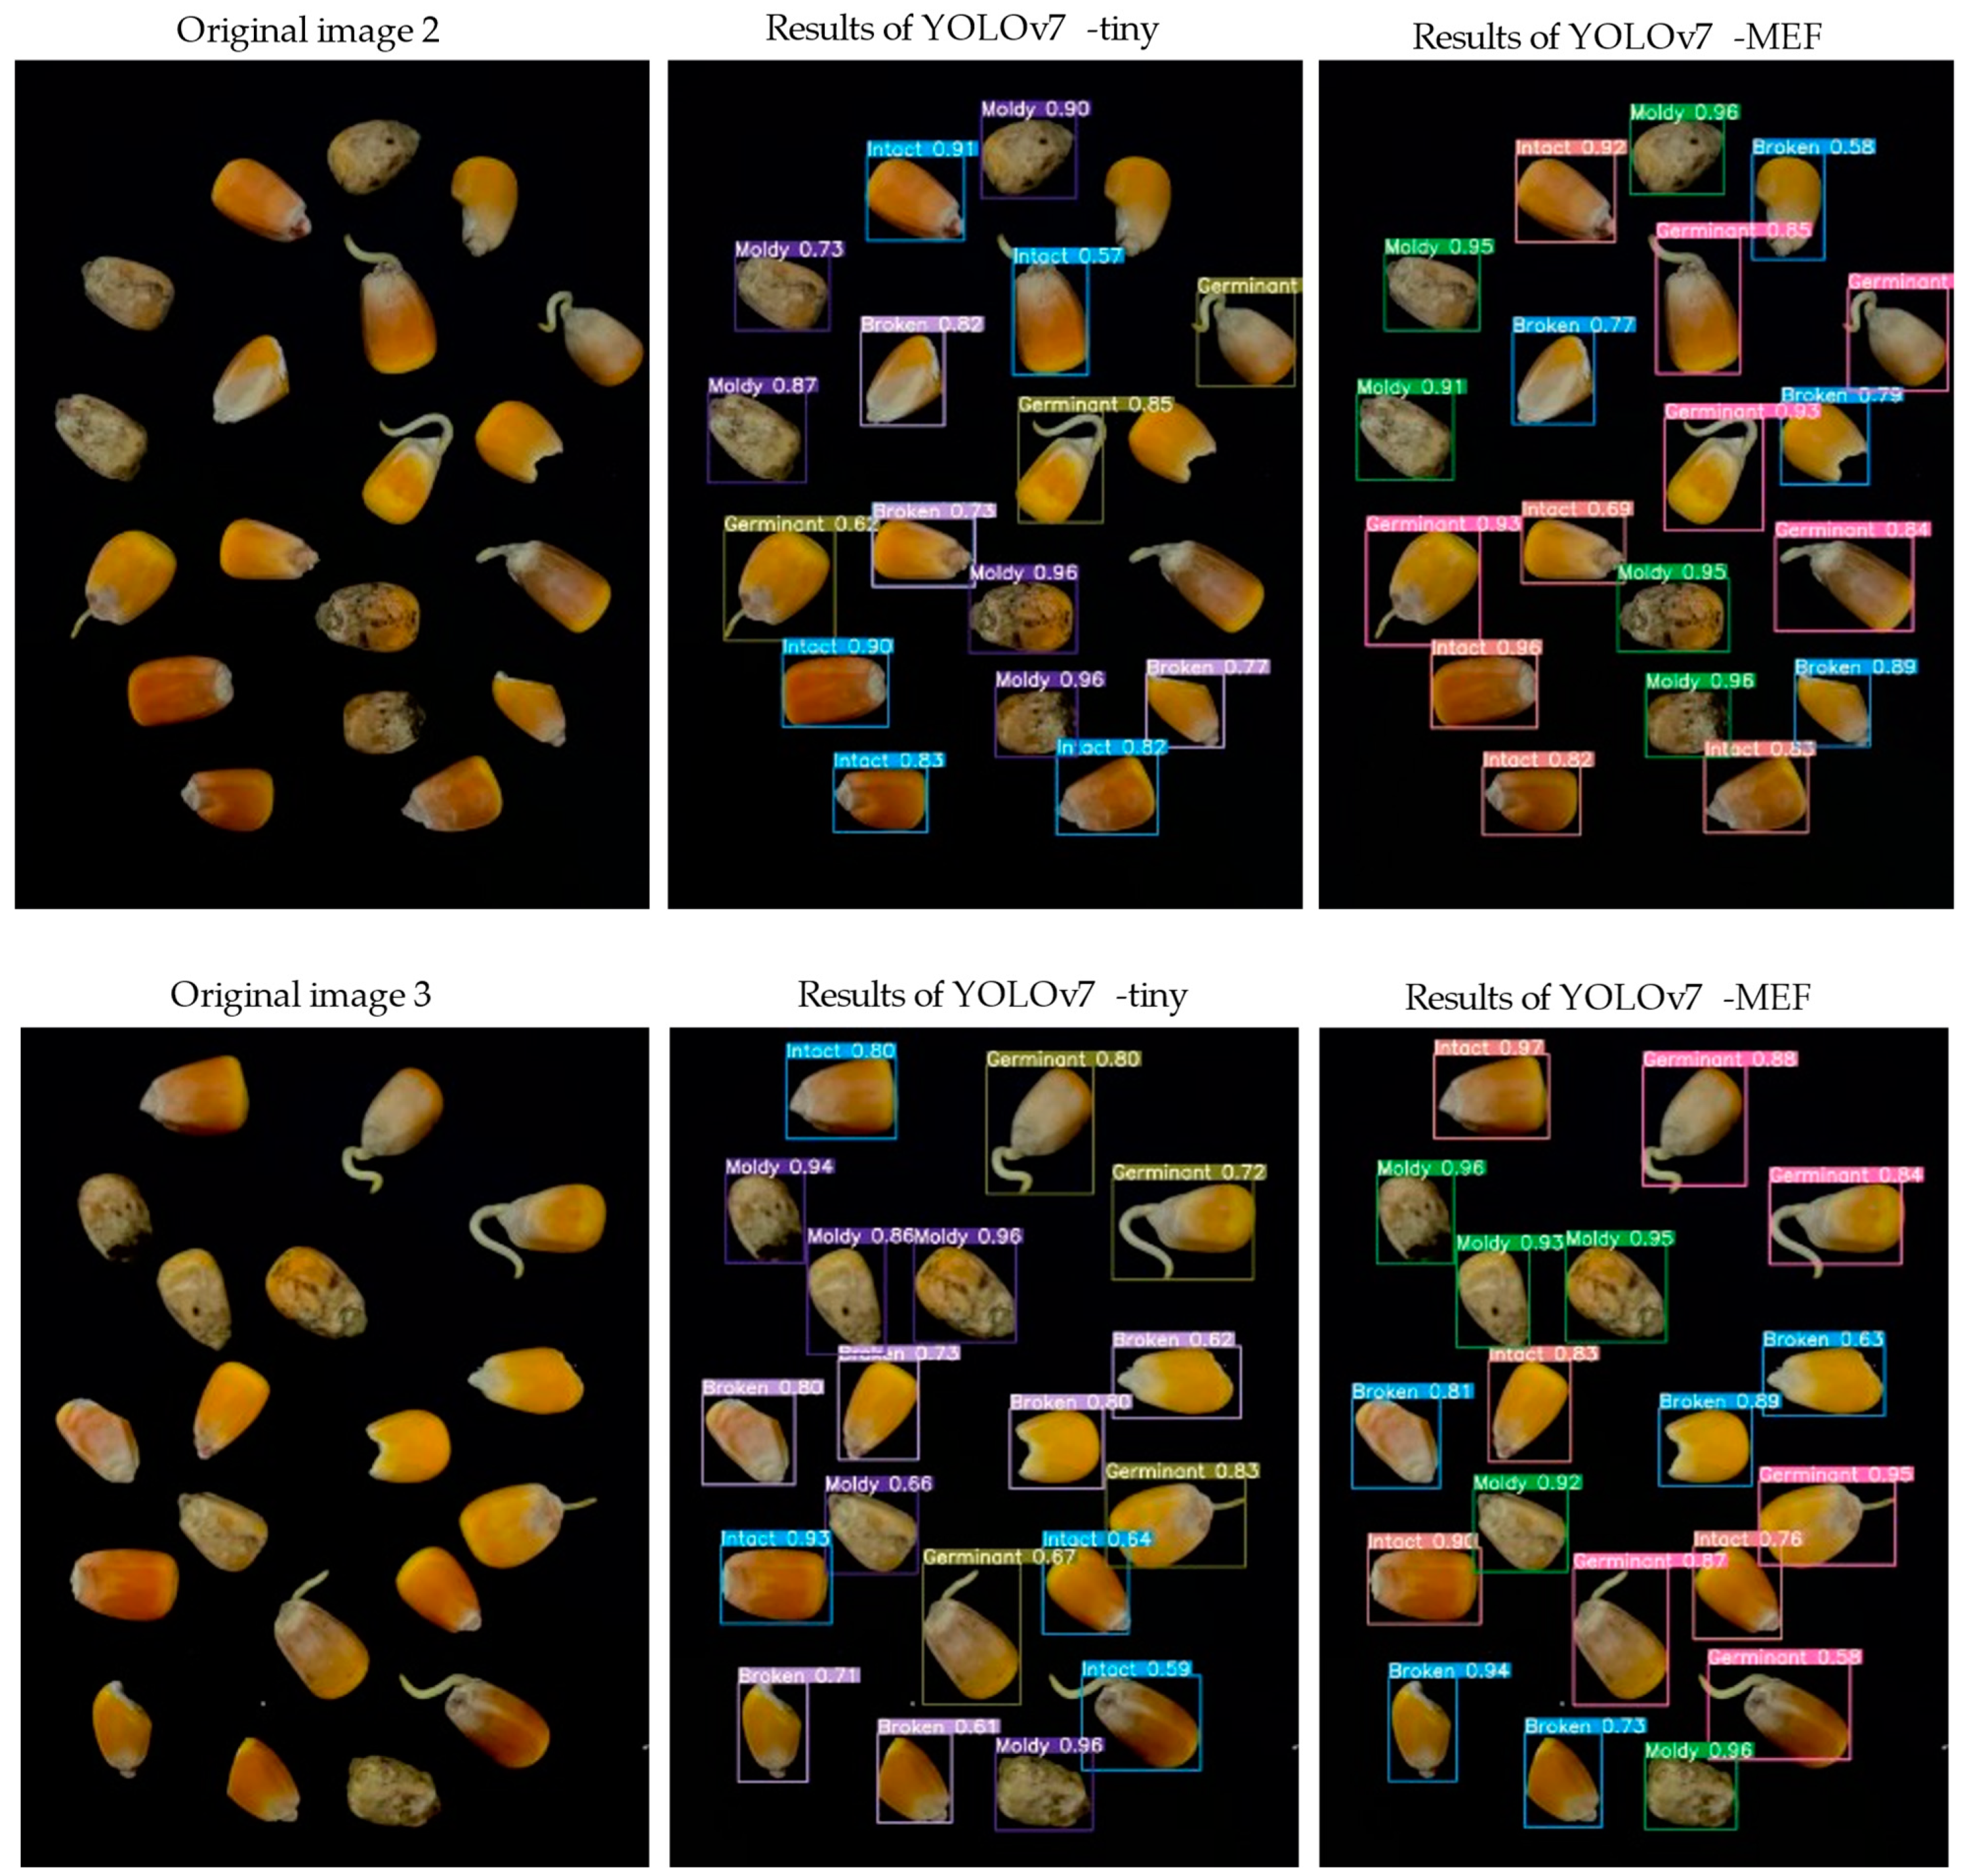
4.2. Comparative Analysis of YOLOv7-MEF and YOLOv7-Tiny Model
5. Discussion
6. Conclusions
Author Contributions
Funding
Institutional Review Board Statement
Informed Consent Statement
Data Availability Statement
Acknowledgments
Conflicts of Interest
References
- Dai, D.; Ma, Z.; Song, R. Maize kernel development. Mol. Breed. 2021, 41, 2. [Google Scholar] [CrossRef] [PubMed]
- Erenstein, O.; Jaleta, M.; Sonder, K.; Mottaleb, K.; Prasanna, B. Global maize production, consumption and trade: Trends and R&D implications. Food Secur. 2022, 14, 1295–1319. [Google Scholar] [CrossRef]
- Ekpa, O.; Palacios-Rojas, N.; Kruseman, G.; Fogliano, V.; Linnemann, A.R. Sub-Saharan African Maize-Based Foods—Processing Practices, Challenges and Opportunities. Food Rev. Int. 2019, 35, 609–639. [Google Scholar] [CrossRef]
- Klopfenstein, T.; Erickson, G.; Berger, L. Maize is a critically important source of food, feed, energy and forage in the USA. Field Crop. Res. 2013, 153, 5–11. [Google Scholar] [CrossRef]
- Wang, K.; Xie, R.; Ming, B.; Hou, P.; Xue, J.; Li, S. Review of combine harvester losses for maize and influencing factors. Int. J. Agric. Biol. Eng. 2021, 14, 1–10. [Google Scholar] [CrossRef]
- Wu, F. Global impacts of aflatoxin in maize: Trade and human health. World Mycotoxin J. 2015, 8, 137–142. [Google Scholar] [CrossRef]
- Kamilaris, A.; Prenafeta-Boldú, F.X. Deep learning in agriculture: A survey. Comput. Electron. Agric. 2018, 147, 70–90. [Google Scholar] [CrossRef]
- Adige, S.; Kurban, R.; Durmuş, A.; Karaköse, E. Classification of apple images using support vector machines and deep residual networks. Neural Comput. Appl. 2023, 35, 12073–12087. [Google Scholar] [CrossRef]
- Ju, J.; Zheng, H.; Xu, X.; Guo, Z.; Zheng, Z.; Lin, M. Classification of jujube defects in small data sets based on transfer learning. Neural Comput. Appl. 2021, 34, 3385–3398. [Google Scholar] [CrossRef]
- Wang, Z.; Ling, Y.; Wang, X.; Meng, D.; Nie, L.; An, G.; Wang, X. An improved Faster R-CNN model for multi-object tomato maturity detection in complex scenarios. Ecol. Inform. 2022, 72, 101886. [Google Scholar] [CrossRef]
- Ni, J.; Gao, J.; Li, J.; Yang, H.; Hao, Z.; Han, Z. E-AlexNet: Quality evaluation of strawberry based on machine learning. J. Food Meas. Charact. 2021, 15, 4530–4541. [Google Scholar] [CrossRef]
- Huang, Z.; Wang, R.; Cao, Y.; Zheng, S.; Teng, Y.; Wang, F.; Wang, L.; Du, J. Deep learning based soybean seed classification. Comput. Electron. Agric. 2022, 202, 107393. [Google Scholar] [CrossRef]
- Zhang, J.; Ma, Q.; Cui, X.; Guo, H.; Wang, K.; Zhu, D. High-throughput corn ear screening method based on two-pathway convolutional neural network. Comput. Electron. Agric. 2020, 175, 105525. [Google Scholar] [CrossRef]
- Zhao, W.; Liu, S.; Li, X.; Han, X.; Yang, H. Fast and accurate wheat grain quality detection based on improved YOLOv5. Comput. Electron. Agric. 2022, 202, 107426. [Google Scholar] [CrossRef]
- Yang, Y.; Liu, Z.; Huang, M.; Zhu, Q.; Zhao, X. Automatic detection of multi-type defects on potatoes using multispectral imaging combined with a deep learning model. J. Food Eng. 2023, 336, 111213. [Google Scholar] [CrossRef]
- Kurtulmuş, F. Identification of sunflower seeds with deep convolutional neural networks. J. Food Meas. Charact. 2020, 15, 1024–1033. [Google Scholar] [CrossRef]
- Jeyaraj, P.R.; Asokan, S.P.; Nadar, E.R.S. Computer-Assisted Real-Time Rice Variety Learning Using Deep Learning Network. Rice Sci. 2022, 29, 489–498. [Google Scholar] [CrossRef]
- Amatya, S.; Karkee, M.; Gongal, A.; Zhang, Q.; Whiting, M.D. Detection of cherry tree branches with full foliage in planar architecture for automated sweet-cherry harvesting. Biosyst. Eng. 2016, 146, 3–15. [Google Scholar] [CrossRef]
- Ye, W.; Yan, T.; Zhang, C.; Duan, L.; Chen, W.; Song, H.; Zhang, Y.; Xu, W.; Gao, P. Detection of Pesticide Residue Level in Grape Using Hyperspectral Imaging with Machine Learning. Foods 2022, 11, 1609. [Google Scholar] [CrossRef] [PubMed]
- Gao, H.; Zhen, T.; Li, Z. Detection of Wheat Unsound Kernels Based on Improved ResNet. IEEE Access 2022, 10, 20092–20101. [Google Scholar] [CrossRef]
- Jin, B.; Zhang, C.; Jia, L.; Tang, Q.; Gao, L.; Zhao, G.; Qi, H. Identification of Rice Seed Varieties Based on Near-Infrared Hyperspectral Imaging Technology Combined with Deep Learning. ACS Omega 2022, 7, 4735–4749. [Google Scholar] [CrossRef]
- Bi, C.; Hu, N.; Zou, Y.; Zhang, S.; Xu, S.; Yu, H. Development of Deep Learning Methodology for Maize Seed Variety Recognition Based on Improved Swin Transformer. Agronomy 2022, 12, 1843. [Google Scholar] [CrossRef]
- Yang, D.; Jiang, J.; Jie, Y.; Li, Q.; Shi, T. Detection of the moldy status of the stored maize kernels using hyperspectral imaging and deep learning algorithms. Int. J. Food Prop. 2022, 25, 170–186. [Google Scholar] [CrossRef]
- Zhao, C.; Quan, L.; Li, H.; Liu, R.; Wang, J.; Feng, H.; Wang, Q.; Sin, K. Precise Selection and Visualization of Maize Kernels Based on Electromagnetic Vibration and Deep Learning. Trans. ASABE 2020, 63, 629–643. [Google Scholar] [CrossRef]
- Xu, P.; Sun, W.; Xu, K.; Zhang, Y.; Tan, Q.; Qing, Y.; Yang, R. Identification of Defective Maize Seeds Using Hyperspectral Imaging Combined with Deep Learning. Foods 2022, 12, 144. [Google Scholar] [CrossRef] [PubMed]
- Xu, P.; Tan, Q.; Zhang, Y.; Zha, X.; Yang, S.; Yang, R. Research on Maize Seed Classification and Recognition Based on Machine Vision and Deep Learning. Agriculture 2022, 12, 232. [Google Scholar] [CrossRef]
- Jiao, Y.; Wang, Z.; Shang, Y.; Li, R.; Hua, Z.; Song, H. Detecting endosperm cracks in soaked maize using μCT technology and R-YOLOv7-tiny. Comput. Electron. Agric. 2023, 213, 108232. [Google Scholar] [CrossRef]
- Wei, Y.; Yang, C.; He, L.; Wu, F.; Yu, Q.; Hu, W. Classification for GM and Non-GM Maize Kernels Based on NIR Spectra and Deep Learning. Processes 2023, 11, 486. [Google Scholar] [CrossRef]
- Shorten, C.; Khoshgoftaar, T.M. A survey on Image Data Augmentation for Deep Learning. J. Big Data 2019, 6, 60. [Google Scholar] [CrossRef]
- Wang, C.-Y.; Bochkovskiy, A.; Liao, H.-Y.M. YOLOv7: Trainable bag-of-freebies sets new state-of-the-art for real-time object detectors. arXiv 2022, arXiv:2207.02696. [Google Scholar]
- Howard, A.; Sandler, M.; Chen, B.; Wang, W.; Chen, L.-C.; Tan, M.; Chu, G.; Vasudevan, V.; Zhu, Y.; Pang, R.; et al. Searching for MobileNetV3. arXiv 2019, arXiv:1905.02244. [Google Scholar]
- Lee, Y.; Park, J. CenterMask: Real-Time Anchor-Free Instance Segmentation. arXiv 2020, arXiv:1911.06667. [Google Scholar]
- Selvaraju, R.R.; Cogswell, M.; Das, A.; Vedantam, R.; Parikh, D.; Batra, D. Grad-CAM: Visual Explanations from Deep Networks via Gradient-Based Localization. arXiv 2016, arXiv:1610.02391. [Google Scholar]
- Lin, T.Y.; Goyal, P.; Girshick, R.; He, K.; Dollar, P. Focal Loss for Dense Object Detection. IEEE Trans. Pattern Anal. Mach. Intell. 2020, 42, 318–327. [Google Scholar] [CrossRef] [PubMed]


| Category | Number | Training Set | Test Set | Validation Set |
|---|---|---|---|---|
| Intact | 15,684 | 12,548 | 1568 | 1568 |
| Moldy | 16,104 | 12,884 | 1612 | 1612 |
| Broken | 16,660 | 13,328 | 1664 | 1664 |
| Germinant | 16,296 | 13,036 | 1628 | 1628 |
| total | 64,744 | 51,796 | 6472 | 6472 |
| Model | Precision | Recall | map@0.5 | Model Size/M |
|---|---|---|---|---|
| Faster-RCNN | 88.51% | 88.54% | 86.56% | 108.29 |
| SSD | 92.89% | 92.66% | 92.83% | 92.13 |
| YOLOv5 | 89.13% | 91.3% | 91.75% | 27.14 |
| YOLOv7 | 97.66% | 91.93% | 94.35% | 73.38 |
| YOLOv7x | 98.83% | 88.35% | 96.62% | 138.7 |
| YOLOv7-tiny | 97.21% | 92.3% | 94.95% | 11.72 |
| Model | Precision | Recall | Model Size/M | FPS |
|---|---|---|---|---|
| YOLOv7-tiny | 97.21% | 93.14% | 11.72 | 47.62 |
| YOLOv7-MobileNetV3 | 93.13% | 81.3% | 8.25 | 64.52 |
| YOLOv7-ME | 95.32% | 87.47% | 8.17 | 71.43 |
| YOLOv7-MF | 94.43% | 91.3% | 8.23 | 67.11 |
| YOLOv7-MEF | 98.94% | 96.42% | 9.1 | 76.92 |
Disclaimer/Publisher’s Note: The statements, opinions and data contained in all publications are solely those of the individual author(s) and contributor(s) and not of MDPI and/or the editor(s). MDPI and/or the editor(s) disclaim responsibility for any injury to people or property resulting from any ideas, methods, instructions or products referred to in the content. |
© 2024 by the authors. Licensee MDPI, Basel, Switzerland. This article is an open access article distributed under the terms and conditions of the Creative Commons Attribution (CC BY) license (https://creativecommons.org/licenses/by/4.0/).
Share and Cite
Yang, L.; Liu, C.; Wang, C.; Wang, D. Maize Kernel Quality Detection Based on Improved Lightweight YOLOv7. Agriculture 2024, 14, 618. https://doi.org/10.3390/agriculture14040618
Yang L, Liu C, Wang C, Wang D. Maize Kernel Quality Detection Based on Improved Lightweight YOLOv7. Agriculture. 2024; 14(4):618. https://doi.org/10.3390/agriculture14040618
Chicago/Turabian StyleYang, Lili, Chengman Liu, Changlong Wang, and Dongwei Wang. 2024. "Maize Kernel Quality Detection Based on Improved Lightweight YOLOv7" Agriculture 14, no. 4: 618. https://doi.org/10.3390/agriculture14040618
APA StyleYang, L., Liu, C., Wang, C., & Wang, D. (2024). Maize Kernel Quality Detection Based on Improved Lightweight YOLOv7. Agriculture, 14(4), 618. https://doi.org/10.3390/agriculture14040618