Abstract
Meteorological conditions play a crucial role in driving outbreaks of rubber tree powdery mildew (RTPM). As the climate warms and techniques improve, rubber cultivation is expanding to higher latitudes, and the changing climate increases the RTPM risk. Rubber plantations on Hainan Island, situated on the northern margin of the tropics, have been selected as a case study to explore the meteorological mechanisms behind RTPM outbreaks quantitatively using a structural equation model, and project current and future RTPM outbreak patterns under different climate change scenarios by building predictive models based on data-driven algorithms. The following results were obtained: (1) days with an average temperature above 20 °C and days with light rain were identified as key meteorological drivers of RTPM using structural equation modeling (R2 = 0.63); (2) the Bayesian-optimized least-squares boosted trees ensemble model accurately predicted the interannual variability in the historical RTPM disease index (R2 = 0.79); (3) currently, due to the increased area of rubber plantations in the central region of Hainan, there is a higher risk of RTPM; and (4) under future climate scenarios, RTPM shows a decreasing trend (at a moderate level), with oscillating and sporadic outbreaks primarily observed in the central and northwest regions. We attribute this to the projected warming and drying trends that are unfavorable for RTPM. Our study is expected to enhance the understanding of the impact of climate change on RTPM, provide a prediction tool, and underscore the significance of the climate-aware production and management of rubber.
1. Introduction
Rubber is an important strategic resource, and Hevea brasiliensis (rubber trees) comprise an economical forest that is widely planted in tropical areas, with a harvested area that reaches 12.93 million ha according to the Food and Agriculture Organization of the United Nations (FAO). Rubber tree powdery mildew (RTPM) is a foliar fungal disease caused by Oidium heveae that impacts rubber plantations worldwide [1]. RTPM primarily affects young leaves, shoots, and inflorescences in the early growth stage, leading to leaves turning yellow, deforming, and, eventually, withering and falling off. As the disease progresses, the surrounding tissues of the lesions also become infected, leading to impaired leaf function, which affects the photosynthesis and growth of rubber trees [1]. Outbreaks can reduce the rubber yield by up to 45% in rubber-producing regions of tropical and subtropical Asia and Africa [1]. As rising temperatures and progress in science and techniques enable the expansion of rubber cultivation to higher latitudes, marginal climate conditions may increase the risks of RTPM epidemics [2,3,4,5,6]. However, a comprehensive understanding is lacking on the meteorological drivers of RTPM and their future outbreak potential under climate change.
To prevent and control rubber tree powdery mildew, scholars have made achievements in understanding its mechanism. Initially, scholars pointed out that disease severity depends on the wintering pattern of the rubber tree, leaf age, clonal susceptibility, weather conditions during refoliation, and elevation [7,8,9,10,11,12]. In-depth studies have revealed that meteorological factors like temperature, humidity, rainfall, and wind speed have been linked to RTPM severity [8,13,14,15,16,17,18,19]. Studies show that the occurrence and severity of RTPM depend largely on daily maximum temperatures during the young leaf stages, with abundant conidia reproduction around 25–28 °C enabling infection [20,21,22,23]. Combinations of a slightly lower temperature (<30 °C), high air turbulence, and low humidity also favor RTPM infection by benefiting spore maturation and germination [1,11,12]. In addition, high humidity and low temperature accompanied by night mist are conducive to the maturation and accumulation of powdery mildew conidia [8,24,25]. Furthermore, it was discovered that moisture from mist or light rain combined with short periods of sunshine or cloudy days also favored the germination of conidia when considering both precipitation and sunshine time [11,17,26,27,28]. However, most studies focus on explaining the mechanism based on linear relationships rather than a comprehensive consideration of and interactions amongst multiple meteorological variables. Comprehensively analyzing drivers of RTPM considering such interconnected meteorological influences is needed in order to predict outbreaks, which is an important topic in the context of climate change.
Powdery mildew diseases have posed modeling challenges due to their complex epidemiology. Traditional statistical approaches (e.g., stepwise linear regression, multivariable linear regression, logistic regression, etc.) have shown limitations for outbreak predictions [15,29,30,31]. Recent machine-learning approaches such as neural networks, decision trees, random forests, and support vector machines demonstrate an improved predictive accuracy for disease prediction [30,32,33,34,35,36]. Research on RTPM prediction has also benefited from this development. However, gaps remain in the long-term predictive capability and projections under climate change scenarios. For example, a model by Ye et al. reached an accuracy of 88.1% for RTPM predictions in a one-week interval using a neural network, which laid a good foundation for the precise and efficient prevention and control of RTPM [37,38] but could not project future trends.
Climate change projections were derived from the Coupled Model Intercomparison Project Phase 6 (CMIP6), which provides the latest global climate model simulations under standardized future emissions scenarios called Shared Socioeconomic Pathways (SSPs) and Representative Concentration Pathways (RCPs). CMIP6 is the latest achievement of CMIP and has been widely utilized in climate change research [39,40,41,42]. The combination of multiple SSP-RCP scenarios from CMIP6 enabled more robust projections of regional climate factors [43,44,45], influencing the long-term powdery mildew outbreak potential.
However, the comprehensive attribution of meteorological drivers is still lacking, along with predictive analysis capturing spatiotemporal outbreak patterns under future climate change. Therefore, we developed a structural equation model (SEM) to reveal key meteorological drivers and a machine-learning model for current and future RTPM outbreak risk projections. This study aimed to (1) reveal key meteorological attribution patterns for RTPM; and (2) predict current and future RTPM outbreak risks under climate change scenarios across Hainan Island. This study provides an enhanced evidence base of meteorological drivers along with advanced predictive capabilities to aid outbreak preparedness and decision-making for rubber plantations under climate change.
2. Data and Methodology
2.1. Study Area
Hainan Island, located in southern China on the edge of tropical Asia (18°10′04″ N~20°0′40″ N, 108°30′43″ E~111°2′33″ E), experiences annual precipitation of around 1640 mm and average temperature ranging from 23 °C to 29 °C [46]. According to the Association of Natural Rubber Producing Countries (ANRPC) 2021 statistics, China ranks globally as the 4th largest natural rubber producer (0.85 million tons), with over 41% (0.34 million tons) contributed by Hainan [47]. However, rubber cultivation in Hainan has faced longstanding yield losses due to powdery mildew epidemics, caused by the foliar fungal pathogen Oidium heveae [13]. As climate warming enables the expansion of rubber planting latitudes, additional regions (similar to Hainan located on the edge of the tropics) may confront yield losses to powdery mildew under favorable but marginally suitable climatic conditions which provide a suitable epidemic window for spores.
2.2. Data
2.2.1. Disease Index of Rubber Tree Powdery Mildew (RTPM-DI)
The disease index (DI) quantifies the severity of RTPM based on visible symptom expression across the whole island’s plantations [26]. DI uses a 0–5 grading scale for individual plant: Level 0—no disease or a few leaves with a small number of disease spots; Level 1—most leaves have a small number of disease spots; Level 2—most leaves have many disease spots; Level 3—the leaves are mildly shrunken, or approximately 1/10 of the leaves have fallen due to disease; Level 4—the leaves are densely covered with lesions, or the leaves are moderately shrunk, or approximately 1/3 of the leaves have fallen due to disease; and Level 5—the leaves are severely shrunken due to disease, or more than 1/2 leaves have fallen [26]. DI percentage is calculated by summing disease grades observed across sampled trees:
where DI is the disease index of RTPM, N is the total number of plants, n is the number of diseased plants at each level, i is the level of disease, and imax is the highest level. The DI in Hainan from 1962 to 2003 is obtained from the article “Fifty Years of Prevention and Control of Rubber Tree Pests and Diseases in Hainan Agricultural Reclamation”, and data from 2004 to 2009 were provided by the Hainan Agricultural Bureau [48] (Supplementary Materials Table S1). Referring to Shao et al., we categorized DI severity as light (<25%), moderate (25–50%), or severe (>50%) [21].
2.2.2. Historical Climate Data
Historical climate data were obtained from both site observations and spatial gridded products. Daily temperature, precipitation, wind speed, atmospheric pressure, relative humidity, evaporation, sunshine hours, and 0 cm ground temperature spanning 1961–2009 were acquired from seven meteorological stations across Hainan Island via China’s National Climate Center. Factors including maximum temperature from the previous October to January (MT, °C), relative humidity from the previous October to December (RH, %), days of average temperature above 20 °C in January (DAT, d), days of light rain from the previous October to January (DLR, d), and average wind speed from previous November to January (AWS, 0.1 m/s) were chosen to represent key drivers of RTPM according to previous research [13]. Additionally, a high-resolution (0.1°; 3 hourly) China Meteorological Forcing Dataset (CMFD) for 1979–2018 provided regional precipitation, average wind speed, average temperature, maximum temperature, specific humidity, and atmospheric pressure data. Variables were aggregated to daily resolution and downscaled to 30 km spatial grids for modeling RTPM patterns. Relative humidity was calculated from CMFD temperature, pressure, and vapor pressure [49]. Historical climate data were used to establish SEM to explore the mechanism and to screen and calibrate CMIP6 models.
2.2.3. Climate Data from CMIP6
Historical operation (1961–2014) and future operation (2015–2100) of two scenarios (SSP2-4.5 and SSP5-8.5) are derived from CMIP6 to project the future RTPM patterns. The SSP2-4.5 and SSP5-8.5 scenarios of CMIP6 represent future socio-economic development trajectories with moderate and high challenges to mitigation, respectively. SSP2-4.5 envisions a stabilization scenario with greenhouse gas emissions that would limit global warming to approximately 2 °C above pre-industrial levels, while SSP5-8.5 depicts a future with high emissions and significant climate change impacts, potentially exceeding 4 °C of warming [43]. Based on the assessment of China and regions adjacent to Hainan, and the availability of data, models with relatively higher accuracy were selected, including CanESM5, GFDL-ESM4, MRI-ESM2-0, and NorESM2-LM [6,50,51,52], which are shown in Table 1.

Table 1.
Information about the four models from CMIP6.
2.2.4. Rubber Area Map
Rubber plantation distribution data were derived from a recently developed random forest model which has an overall accuracy of 96.93%, a user’s accuracy of 94.72%, and a Kappa coefficient of 0.90 [53]. The model was established based on the unique deciduous phenological characteristics of the rubber plantation through more than ten vegetation indices and nearly 10,000 field sample points and has high accuracy. The risk of RTPM outbreaks partly comes from the planting density of rubber trees. We used the proportion of rubber plantation area within a 30 km × 30 km grid as exposure to explore the RTPM pattern.
2.3. Methodology
2.3.1. Structural Equation Model
Structural equation model (SEM), an advanced statistical modeling approach suitable for analyzing networks of multivariate relationships, which has a good ability to evaluate the direct or indirect impact of each variable [54,55], was applied to quantify the attribution of interconnected meteorological drivers of RTPM disease. SEM has become very useful in identifying complex networks of interdependent factors and has been frequently employed in ecological research in recent years [56]. We propose a hypothetical model of “meteorological factors and RTPM-DI”, as shown in Figure 1, and explore the relationship between various meteorological factors and their impact on RTPM via path coefficients and the coefficient of determination (R2). All variables were standardized before the path analysis. The software SPSS Statistics 26 and SPSS Amos 26 were selected for statistical analysis and modeling.
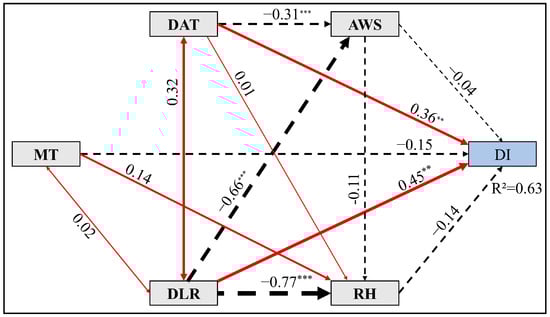
Figure 1.
Path diagram of the meteorological factors and disease index (DI). The red solid arrows and black dashed arrows represent the positive effect and negative effect, respectively, in the structural equation modeling (SEM). The numbers next to the arrows represent the correlation coefficients between the two variables. The R2 indicates the degrees of explanation of variables, and ** and *** represent a significant relationship at the p = 0.01 level and p = 0.001 level, respectively. MT: maximum temperature from the previous October to January; RH: relative humidity from the previous October to December; DAT: days of average temperature above 20 °C in January; DLR: days of light rain from the previous October to January; and AWS: average wind speed from previous November to January.
2.3.2. Bias Correction Method
CMIP6 outputs require bias correction before use in local-scale climate impact analysis [57]. Therefore, we use the MeteoLab toolbox, the daily data of seven observatories in Hainan as the standard and the empirical quantile mapping (EQM) method to correct the data bias of the four models.
The EQM method corrects the simulated empirical distribution function by adding the average incremental change in the observed quantile and the single incremental change in the corresponding quantile. The empirical quantile is used to estimate the simulated quantile, and the quantile map is used to correct the meteorological data simulated by the climate model in the study area [58,59]. The EQM method was proposed by Déqué [60], without assuming a parameter distribution, and the empirical cumulative distribution function (CDF) is estimated based on percentiles calculated from uncorrected simulated data and measured historical data. EQM is performed using the following equation, and the average temperature is used as an example:
where TBC is the bias-corrected temperature simulation, Fsim is the CDF of the simulated data, Fobs−1 is the inverse of the CDF of the observed data, and x is the simulated temperature value by the model.
For regional scale analysis, a separate quantile mapping (QM) bias correction was also applied to the four CMIP6 models using the high-resolution CMFD dataset from 1979 to 2014. Unadjusted and adjusted model outputs were compared (Supplementary Materials Figures S1 and S2) to validate calibration performance.
2.3.3. Bayesian-Optimized Least-Squares Boosted Regression Tree Ensembles (LSBoost-RTE)
Regression tree ensembles (RTEs) are predictive models constructed by the weighted combination of multiple independent regression trees [61]; their main goal is to improve the performance of a single model by integrating several weak learners [62,63]. Designed for regression, LSBoost is both a tree-based algorithm developed by Friedman that uses a gradient boosting strategy to create robust regression models and a regression ensemble designed to minimize the mean square error [61,64]. Bayesian optimization is an algorithm suitable for optimizing the hyperparameters of regression models and optimizing functions that are non-differentiable, discontinuous, and computationally time-consuming. We share the LSBoost-RTE model and its code written in MATLAB (available from Supplementary Materials).
This study uses LSBoost-RTE to establish the regression model between MT, RH, DAT, DLR, AWS, and RTPM-DI in Hainan Island from 1962 to 2009 and uses 5-fold cross-validation to avoid overfitting. R2 and root-mean-square error (RMSE) [65,66] were applied to estimate the performance of the model, and then the spatial and temporal pattern prediction of RTPM were completed by inputting regional climatic data and CMIP6 outputs for future climate change scenarios.
2.4. Emerging Hot Spot Analysis
Emerging spatiotemporal hot spot analysis combines geographic information technology and data mining to detect spatiotemporal distribution patterns and dynamic changes in phenomena over time [67]. This method utilizes a space–time cube (STC), a three-dimensional structure integrating temporal and spatial information [68], to map RTPM trends in the present study. The tool evaluates RTPM-DI hot and cold spots based on the Getis–Ord statistic and Mann–Kendall test for temporal trends [69,70]. Significance levels are determined from Z-scores and p-values, categorizing regions into 16 possible patterns [71] indicative of RTPM stability, intensification, or decline. Compared to conventional hot spot analysis, this better captures the spatiotemporal dynamics of RTPM.
3. Results
3.1. The Results of Meteorological Data Calibration
Bias correction was carried out. First, the EQM is used to calibrate the CMIP6 data based on meteorological station data (1961–2014). The correlation coefficients and root-mean-square error (RMSE) between the annual total precipitation data before and after calibration and the station data are shown in Table 2. The corrected results are shown in Supplementary Materials Figure S1.
Table 2.
Correlation coefficient and RMSE between CMIP6 annual total precipitation data and observation data after EQM calibration.
For regional analysis, we process CMIP6 data to 30 km, and then the QM is used to calibrate the CMIP6 data based on the CMFD data (1979–2014). The verification indices are shown in Table 3. The corrected results are shown in Supplementary Materials Figure S2.
Table 3.
RMSE and MAE between CMIP6 data and CMFD data after QM calibration.
3.2. Meteorological Attribution Analysis for RTPM
DLR had the strongest influence (0.69) on RTPM-DI, with a direct effect of 0.45. Direct effects represent the immediate relationship between a predictor and DI in the model. DLR also had a positive indirect effect of 0.24 mediated through connected meteorological drivers, MT, DAT, RH, and AWS, in the network. Indirect pathways account for mediation through interrelated variables. DAT exhibited the next highest total effect (0.55) with a direct influence of 0.36 and an indirect effect of 0.19 via DLR, AWS, and RH. MT, RH, and AWS showed weaker total effects on RTPM-DI of −0.16, −0.14, and −0.02, respectively. The model demonstrated a strong explanatory capability (R2 = 0.63) and revealed the path and magnitude of the meteorological factors leading to RTPM occurrence.
3.3. RTPM-DI Prediction Model
The RTPM-DI prediction model accurately captured the changing patterns and trends in the RTPM DI time-series data (Figure 2a). The model demonstrated strong predictive performance, with an R2 of 0.79 (p < 0.01) indicating it explained 79% of the variance in the historical RTPM-DI. The low RMSE of 7.03 further supports the minimal deviation between the predicted and observed data points across time. Together, these metrics signify the model’s capability to sufficiently reproduce the interannual variability in historical RTPM-DI outbreaks. This predictive capability can be leveraged for a projection to future climate conditions, aiding the assessment of potential impacts on rubber plantations. However, the performance for a more extreme RTPM-DI would need to be further assessed.
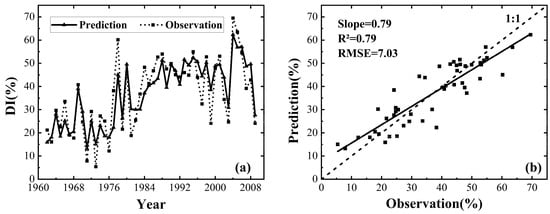
Figure 2.
Evaluation line chart (a) and scatter plot (b) of the evaluation model of the RTPM-DI prediction model.
3.4. Spatial Analysis of Current RTPM
Figure 3 presents contemporary simulation results under the SSP2-4.5 and SSP5-8.5 CMIP6 climate change scenarios for the present period. Both project greater RTPM-DI values in central and northern Hainan, with additional hot spots in the northwestern and western areas. Regions with more extensive rubber cultivation showed a greater exposure to potential losses from RTPM outbreaks due to this alignment of meteorological hazard and planting exposure. Meanwhile, the bivariate spatial distribution also indicated a more severe meteorologically driven RTPM-DI in western areas compared to eastern regions in addition to central and northern hot spots.
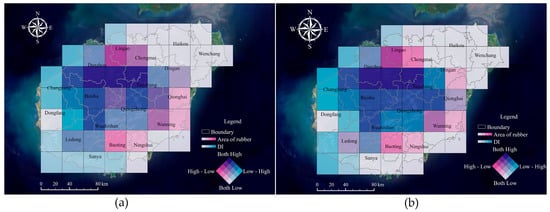
Figure 3.
Spatial distribution of meteorologically driven RTPM-DI and its relationship with rubber plantation distribution under SSP2-4.5 (a) and SSP5-8.5 (b) scenarios.
3.5. Projected Spatiotemporal Patterns of RTPM under Climate Change
Overall, both SSP2-4.5 and SSP5-8.5 scenarios exhibit a decreasing trend, with SSP5-8.5 showing a more pronounced decline of DI compared to SSP2-4.5. In comparison to the historical period (1962–2009), the interannual variation of DI in future climate scenarios is reduced and ranges between 25 and 50, indicating a moderate level. Under the SSP2-4.5 scenario, DI displays a “decline–rise–decline” pattern, reaching its peak in the 2090s; although experiencing a brief increase in the 2040s and 2050s, it declines again in the 2060s. The mean DI values from the 2070s to the 2090s are lower than those in the historical and 2020s–2060s periods. Similarly, the SSP5-8.5 scenario exhibits a “decline–rise–decline” pattern, reaching its lowest point in the 2090s. Despite an increase in the 2060s, DI remains lower than in the 2020s (Figure 4a).
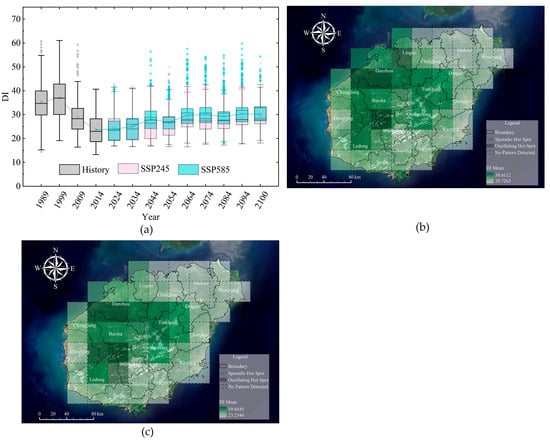
Figure 4.
The trends of RTPM are based on point-scale meteorological data from 1962 to 2100 and each box represents ten years, six years (2094–2100), and thirteen years (2002–2014) (a). Spatiotemporal pattern of RTPM-DI under the SSP2-4.5 (b) and SSP5-8.5 (c) scenarios.
Both the SSP2-4.5 (Figure 4b) and SSP5-8.5 (Figure 4c) scenarios detect two patterns (oscillating hot spots and sporadic hot spots), primarily distributed in the central and northwest regions, with sporadic hot spots being predominant. Oscillating hot spots indicate occasional outbreaks and occasional cold spots in the region, but, currently, hot spots. Sporadic hot spots indicate recent outbreaks in the region and the repeated occurrence of outbreaks of hot spots in history, with no significant cold spot occurrences. On the other hand, no change patterns are detected in the northeastern, eastern, southern, and western regions, indicating that rubber trees in these areas have not been severely affected by powdery mildew (Supplementary Materials Figures S3–S14).
4. Discussions
4.1. The Reliability of SEM Assessment Results
The RTPM DI prediction model constructed based on meteorological factors in this study takes timeliness into account and has an explanation rate of 79%, which has good application prospects in the timely and effective prediction of the disease according to climate change. To verify the factors that we selected, a further exploration was performed for the changes in the five factors during the two years (2004–2005) when the DI was the highest. Figure 4 shows that both DAT and DLR have positive variation rates, while RH and AWS have negative rates during the two years, mirroring the impact mechanisms of these factors on DI, which is consistent with our SEM. The factors selected in this study are important and reasonable and have a vital role in an outbreak of RTPM in Hainan. However, the occurrence of the disease also depends on the location of rubber the plantations, soil, tree species, leaf age, spore number, human activities, and their interactions [8,13,14,15,16,17,18,19]. In addition, extreme climate events such as typhoons, drought, and other adverse effects cause the secondary leaf fall of rubber trees, which will increase the risk of RTPM (Figure 5). The abovementioned factors [37] can improve the prediction accuracy to a certain extent and are the main points to be considered in future analyses.
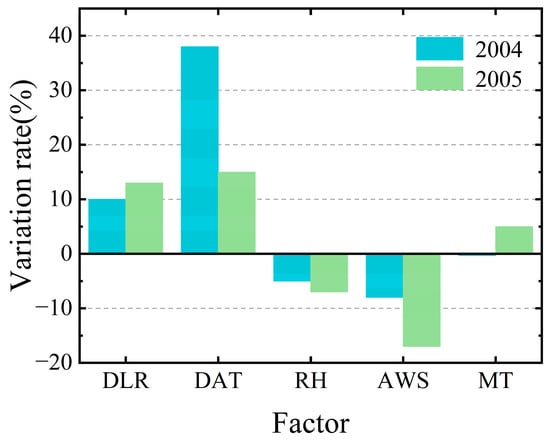
Figure 5.
Change rate of five meteorological factors in Hainan in 2004 and 2005. MT: maximum temperature from the previous October to January; RH: relative humidity from the previous October to December; DAT: days of average temperature above 20 °C in January; DLR: days of light rain from the previous October to January; and AWS: average wind speed from previous November to January.
4.2. Meteorological Impacts on RTPM
According to the “meteorological factors and RTPM-DI” model, MT indicates a negative impact on DI, which has conclusively shown that temperatures in winter and spring influence the rubber tree leaves to fall and sprout. High temperatures in winter will cause the incomplete defoliation and aggravation of powdery mildew. However, excessively high temperatures inhibit the germination of spores because the germination rate is significantly reduced at 35 °C and completely stops at 40 °C [11,16,72]. Then, the model reveals that DAT and RH have a positive effect and negative effect, respectively, on DI, and that the optimal conditions for spore germination are a relative humidity of 97–100% and a temperature of 25–28 °C [11,16,72]. In the winter, if the relative humidity is low and the temperature is high, drought is likely, which is conducive to not only the breeding and spread of spores, but also irregular leaf extraction, the slow growth of leaves, and a prolonged susceptible period of the rubber tree [73]. In addition, the model demonstrates that DLR has a positive effect on DI because light rain will weaken the formation or stability of the water film on rubber tree leaves and cause them to become susceptible to powdery mildew, and the moisture of mist or light rain is necessary for the germination of the conidia [8,11,12,17,24,25,27,28]. The results of the model also illustrate that AWS has a negative effect on the DI, and it has been reported that wind affects not only the release and spread of powdery mildew spores but also creates conditions for the infection of rubber tree leaves by wounds [74].
4.3. Spatiotemporal Patterns of RTPM under Climate Change
The decreasing trends of the DI under different scenarios (Figure 4a) are mainly attributed to the changes in meteorological conditions caused by climate change. Based on the discussion of the mechanism between meteorological factors and powdery mildew in the previous chapter, we continued to analyze the future data for the selected factors and discovered that AWS, DAT, and MT exhibit an upward trend in both scenarios, while RH and DLR exhibit a downward trend. The trends under the SSP5-8.5 scenario are more obvious than those under the SSP2-4.5 scenario (Figure 4a). The MT continues to rise from approximately 26 °C to 31 °C (SSP2-4.5) or 34 °C (SSP5-8.5) and starts at temperatures greater than 30 °C from approximately 2070 (SSP2-4.5) or 2040 (SSP5-8.5), which causes the DI to gradually decrease (Figure 6a). An increase in AWS negatively affects the DI (Figure 6b), whereas a decrease in DLR positively impacts the DI (Figure 6d). DAT increases from approximately 17 d to 31 d and is basically stable for 31 d from 2070 (SSP5-8.5) (Figure 6c). Although an increase in DAT positively influences the DI, excessively high temperatures can suppress the reproduction of powdery mildew spores, thereby reducing the DI. Although the decreasing RH has a positive impact on the DI, which should lead to an increasing trend of DI, the influence of RH is low (Figure 6e). Overall, the DI under both scenarios is at a moderate level, and the interannual variation is low, which mainly depends on the simulation performance of the prediction model (Figure 2b). The capture of extreme values is relatively conservative, and both the maximum value and minimum value are slightly underestimated or overestimated. The LSBoost RTE model used in this study is not effective in simulating extreme values [75,76] but has a greater ability to grasp the overall trend than any other model [77,78]. In addition, the DI that we predicted under the two scenarios begins to show an increasing trend in the 2080s, which may be attributed to the gradual stabilization of meteorological factors. Considering the higher average DI values in the central and northwest regions, it can be inferred that rubber trees in the central and northwest regions of Hainan Island are more susceptible to powdery mildew in the future. However, there is inherent uncertainty in climate change predictions, and, as a result, there may be potential biases in the forecasting of future trends in RTPM. Moreover, the climate models in CMIP6 employ different algorithms, leading to variations in the simulated data [79]. These models have inherent limitations, particularly for small-scale regional simulations [80]. The scenarios for different climate conditions are based on theory assumptions, and, since real-world conditions exhibit variability, there may be discrepancies between the simulation outcomes and actual circumstances [81].
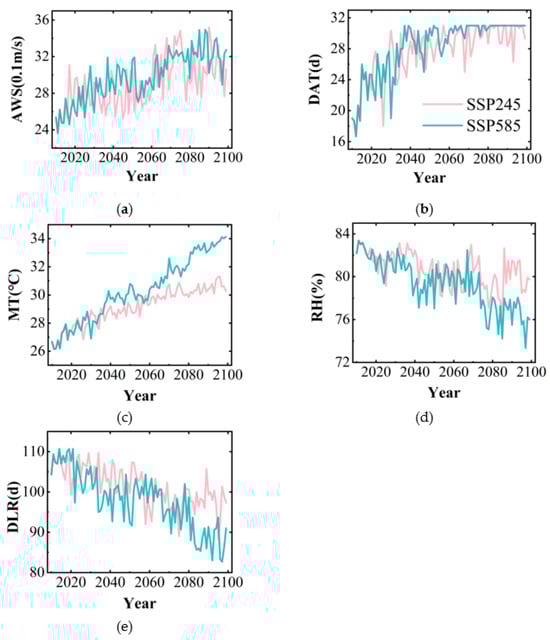
Figure 6.
Changes in the five meteorological factors under different future scenarios: (a) AWS: average wind speed from the previous November to January; (b) DAT: days of average temperature above 20 °C in January; (c) MT: maximum temperature from the previous October to January; (d) rH: Relative humidity from the previous October to December; and (e) DLR: days of light rain from the previous October to January.
4.4. Consistency of Climate Suitability of RTPM with Rubber Plantation Exposure
Currently, the area of rubber trees on Hainan Island is expanding, which will lead to an increase in disaster areas [2]. In addition, other elements may contribute to the varying degrees of RTPM outbreak risk across different regions. For instance, coastal regions, influenced by the ocean, tend to have a more humid climate with higher rainfall, which is conducive to the occurrence and spread of RTPM. Inland areas typically have a hotter and drier climate with less precipitation, which is not favorable for the growth of powdery mildew spores. However, higher wind speeds in these areas may increase the range of spore dispersal. Moreover, the scarcity of land resources in these regions often results in higher planting densities, which may also elevate the risk of infection. Mountainous areas, on the other hand, usually have lower temperatures and wind speeds, higher altitudes, and more complex terrain, with smaller planting scales, all of which serve to limit the spread of RTPM. According to the bivariate spatial distribution (Figure 3), in the future, rubber planting in Hainan Island should be appropriately expanded along the southern coast and northeast to avoid the outbreak of RTPM. Additionally, the climate of the selected planting area should meet the conditions of a limited day with average temperatures above 20 °C in January, scarcity of light rainfall from October to January, higher maximum temperatures from October to January, increased relative humidity from October to December, and higher average wind speeds from November to January. Furthermore, maintaining an appropriate planting density is essential for ensuring good ventilation, reducing the impact of humidity and wind speed on rubber trees. For areas that have already been planted with rubber trees, suitable pre-emptive measures can be taken based on the main impact periods of different climatic factors identified in this study. For example, timely drainage during the rainy season can be implemented to avoid excessive humidity, which could lead to the proliferation of pathogens.
5. Conclusions
This study presents a case study to advance the understanding and prediction of rubber tree powdery mildew outbreaks under current conditions and future climate change. Structural equation modeling quantified the positive effects of days of light rain from the previous October to January (expected to decrease) and days of average temperature above 20 °C in January (expected to increase) and the negative effects of maximum temperature from the previous October to January (expected to increase), relative humidity from the previous October to December (expected to decrease), and average wind speed from the previous November to January (expected to increase) as key meteorological drivers of rubber tree powdery mildew (R2 = 0.63).
The least-squares boosted regression tree ensembles accurately captured the interannual variability in historical rubber tree powdery mildew patterns (R2 = 0.79), providing a valuable tool for projecting the outbreak potential. Under the SSP2-4.5 and SSP5-8.5 scenarios, a declining suitability for rubber tree powdery mildew is projected for the long term, although central and northwestern hot spots persist. However, factors such as terrain, microclimate, extreme weather, and regional variations in rubber cultivation practices should be considered to improve the model performance for severe outbreaks over the years.
The enhanced evidence base of meteorological drivers and predictive capabilities, nonetheless, help quantify future risks, aiding the pre-emptive adaptation of plantations. By revealing the meteorological attribution on rubber tree powdery mildew patterns under shifting climate conditions, this work aids preparedness and informs protective strategies for this ecologically and economically important plantation ecosystem.
Supplementary Materials
The following supporting information can be downloaded at: https://www.mdpi.com/article/10.3390/agriculture14040619/s1, Figure S1: Comparison of five meteorological factors before and after correction of four CMIP6 models based on EQM; Figure S2: Comparison of five meteorological factors before and after correction of four CMIP6 models based on QM; Figure S3: Distribution of RTPM-DI in Hainan Island from 2015 to 2029 under the SSP245 scenario; Figure S4: Distribution of RTPM-DI in Hainan Island from 2030 to 2044 under the SSP245 scenario; Figure S5: Distribution of RTPM-DI in Hainan Island from 2045 to 2059 under the SSP245 scenario; Figure S6: Distribution of RTPM-DI in Hainan Island from 2060 to 2074 under the SSP245 scenario; Figure S7: Distribution of RTPM-DI in Hainan Island from 2075 to 2089 under the SSP245 scenario; Figure S8: Distribution of RTPM-DI in Hainan Island from 2090 to 2100 under the SSP245 scenario; Figure S9: Distribution of RTPM-DI in Hainan Island from 2015 to 2029 under the SSP585 scenario; Figure S10: Distribution of RTPM-DI in Hainan Island from 2030 to 2044 under the SSP585 scenario; Figure S11: Distribution of RTPM-DI in Hainan Island from 2045 to 2059 under the SSP585 scenario; Figure S12: Distribution of RTPM-DI in Hainan Island from 2060 to 2074 under the SSP585 scenario; Figure S13: Distribution of RTPM-DI in Hainan Island from 2075 to 2089 under the SSP585 scenario; Figure S14: Distribution of RTPM-DI in Hainan Island from 2090 to 2100 under the SSP585 scenario; Table S1: Disease index of rubber tree powdery mildew in Hainan from 1962 to 2009.
Author Contributions
J.K. and Z.S. conceived the idea and designed the study; J.K. and L.W. carried out the calculation and model simulation; W.C., T.N., J.C. and Y.A. contributed to the collection and analysis of the data; J.K. drafted the first version of the manuscript; and all the authors engaged in the discussion and updating the manuscript. All authors have read and agreed to the published version of the manuscript.
Funding
This research was funded by the Hainan Province Natural Science Foundation for Youths, grant number 421QN194 and the National Natural Science Foundation of China, grant number 42101101.
Institutional Review Board Statement
Not applicable.
Data Availability Statement
The data presented in this study are available in Supplementary Materials.
Acknowledgments
We gratefully acknowledge the National Climate Center (http://ncc-cma.net/cn/, accessed on 13 April 2022) for providing the data on relative humidity, air temperature, precipitation, and wind speed. We also extend our thanks to the National Earth System Science Data Center (http://www.geodata.cn/, accessed on 13 April 2022) for supporting us with the precipitation data. The rubber tree powdery mildew disease index used in this study was acquired and shared by the Hainan Agricultural Bureau. We would also like to express our gratitude to the World Climate Research Programme (WCRP) for providing the CMIP6 data. Additionally, we thank CMFD for providing the high-resolution meteorological data (https://data.tpdc.ac.cn/, accessed on 13 April 2022). Finally, we acknowledge the Landsat TM/OLI image data from GEE for their contribution to this study. We thank ZYS (Rubber Research Institute, Chinese Academy of Tropical Agricultural Sciences) for providing financial support and conceiving the idea. And we thank LW (Hainan University) for building the predictive model. We also thank WC (Development Research Center, National Forestry and Grassland Administration) and TZN (Northeast Agricultural University) for preparing the meteorological data and rubber tree powdery mildew data.
Conflicts of Interest
The authors declare no conflicts of interest. The funders play no role in the design of the study and in the decision to publish the results.
References
- Liyanage, K.K.; Khan, S.; Mortimer, P.E.; Hyde, K.D.; Xu, J.; Brooks, S.; Ming, Z. Powdery mildew disease of rubber tree. Forest Pathol. 2016, 46, 90–103. [Google Scholar] [CrossRef]
- Li, G.Y.; Kou, W.L.; Chen, B.Q.; Wu, Z.X.; Zhang, X.C.; Yun, T.; Ma, J.; Sun, R.; Li, Y.; Chen, B.Q. Spatio-temporal changes of rubber plantations in Hainan Island over the past 30 years. J. Nanjing For. Univ. (Nat. Sci. Ed.) 2022, 47, 189–198. [Google Scholar] [CrossRef]
- Li, Y.Y.; Zhang, J.; Liu, C.L.; Yang, X.C.; Li, J. Research on extraction and spatial-temporal expansion of rubber forest in five provinces of northern laos based on multi-source remote sensing. Forest Res. 2017, 30, 709–717. [Google Scholar] [CrossRef]
- Priyadarshan, P.M. Ancillary Income Generations. In Biology of Hevea Rubber; Springer: Berlin/Heidelberg, Germany, 2017; pp. 215–218. [Google Scholar]
- Xiao, C.W.; Li, P.; Feng, Z.M. Monitoring annual dynamics of mature rubber plantations in Xishuangbanna during 1987–2018 using Landsat time series data: A multiple normalization approach. Int. J. Appl. Earth Obs. 2019, 77, 30–41. [Google Scholar] [CrossRef]
- Yang, X.L.; Zhou, B.T.; Xu, Y.; Han, Z.Y. CMIP6 evaluation and projection of temperature and precipitation over China. Adv. Atmos. Sci. 2021, 38, 817–830. [Google Scholar] [CrossRef]
- Beeley, F. Oidium heveae: Report on the 1933 outbreak of Hevea leaf mildew. J. Rubber Res. Inst. Malaya 1933, 5, 5–13. [Google Scholar]
- Fernando, T.M. Oidium leaf disease-the effect of environment and control measures on incidence of disease and atmospheric spore concentration. Q. J. Rubber Res. Inst. Ceylon 1971, 48, 100–111. [Google Scholar]
- Lim, T.M.; Rao, B.S. An epidemiological approach to the control of oidium secondary leaf fall of Hevea. In Proceedings of the International Rubber Conference, Kuala Lumpur, Malaysia, 20 October 1975. [Google Scholar]
- Liyanage, A.S. Influence of some factors on the pattern of wintering and on the incidence of Oidium leaf fall in clone PB 86. Rubber Res. Inst. Sri Lanka 1976, 53, 31–38. [Google Scholar]
- Liyanage, S.; JACOB, C.K. Diseases of economic importance in rubber. In Developments in Crop Science; Elsevier: Amsterdam, The Netherlands, 1992; Volume 23, pp. 324–359. [Google Scholar]
- Peries, O. Present states and methods of control of leaf and panel diseases of Hevea in South East Asian and African countries. Q. J. Rubb. Res. Inst. Ceylon 1966, 42, 35–47. [Google Scholar]
- Bai, R.; Li, N.; Chen, H.L.; Liu, S.J.; Chen, X.M.; Zou, H.P. Influences of atmospheric circulation index and surface meteorological elements on the rubber tree powdery mildew in Hainan Province. J. Plant Prot. 2019, 46, 770–778. [Google Scholar] [CrossRef]
- Bai, R.; Wang, J.; Li, N. Climate change increases the suitable area and suitability degree of rubber tree powdery mildew in China. Ind. Crops Prod. 2022, 189, 115888. [Google Scholar] [CrossRef]
- Cao, X.; Xu, X.; Che, H.; West, J.; Luo, D. Effects of temperature and leaf age on conidial germination and disease development of powdery mildew on rubber tree. Plant Pathol. 2021, 70, 484–491. [Google Scholar] [CrossRef]
- Liyanage, A.S.; Peries, O.S.; Dharmaratne, A.; Fernando, B.; Irugalbandara, Z.E.; Wettasinghe, S.; Wettasinghe, P.C. Biology of Oidium heveae, the powdery mildew fungus of Hevea brasiliensis. In Proceedings of the International Rubber Conference 1985: Proceedings, Kuala Lumpur, Malaysia, 21–25 October 1985; Rubber Research Institute of Malaysia: Kuala Lumpur, Malaysia, 1986. [Google Scholar]
- Peries, O.S. Recent developments in the control of the diseases of the Hevea rubber tree. Rubber Res. Inst. Ceylon 1965, 41, 33–43. [Google Scholar]
- Yarwood, C.E. Powdery mildews. Bot. Rev. 1957, 23, 235–301. [Google Scholar] [CrossRef]
- Yu, T. Epidemic law and control techniques of rubber tree powdery mildew. Nong Min Zhi Fu Zhi You 2016, 175. Available online: https://kns.cnki.net/kcms2/article/abstract?v=3uoqIhG8C44YLTlOAiTRKibYlV5Vjs7iAEhECQAQ9aTiC5BjCgn0Rkk4dZ69Qxxsdf_zsfJEb2rCkJ5YrKlTCSoij1e3VGk_&uniplatform=NZKPT (accessed on 1 June 2023).
- Cao, X.R.; Che, H.Y.; Luo, D.Q. The effect of temperature on the occurrence of rubber tree powdery mildew. In Proceedings of the 2018 Annual Academic Conference of the Chinese Plant Protection Society and the Plant Protection Science and Technology Award Ceremony, Xi’an, China, 24 October 2018; p. 76. [Google Scholar]
- Shao, Z.Z.; Zhou, J.J.; Chen, J.X.; Li, Z.C.; Meng, Y.C. Study on the epidemic speed of rubber tree powdery mildew. J. Yunnan Trop. Crops Sci. Technol. 1996, 19, 2–12. [Google Scholar]
- Zhai, D.L.; Thaler, P.; Luo, Y.Q.; Xu, J.C. The powdery mildew disease of rubber (Oidium heveae) is jointly controlled by the winter temperature and host phenology. Int. J. Biometeorol. 2021, 65, 1707–1718. [Google Scholar] [CrossRef] [PubMed]
- Zhai, D.L.; Wang, J.; Thaler, P.; Luo, Y.Q.; Xu, J.C. Contrasted effects of temperature during defoliation vs. refoliation periods on the infection of rubber powdery mildew (Oidium heveae) in Xishuangbanna, China. Int. J. Biometeorol. 2020, 64, 1835–1845. [Google Scholar] [CrossRef] [PubMed]
- Byrne, J.M.; Hausbeck, M.K.; Shaw, B.D. Factors affecting concentrations of airborne conidia of Oidium sp. among poinsettias in a greenhouse. Plant Dis. 2000, 84, 1089–1095. [Google Scholar] [CrossRef]
- Willocquet, L.; Berud, F.; Raoux, L.; Clerjeau, M. Effects of wind, relative humidity, leaf movement and colony age on dispersal of conidia of Uncinula necator, causal agent of grape powdery mildew. Plant Pathol. 1998, 47, 234–242. [Google Scholar] [CrossRef]
- Cai, Z.Y.; Shi, Y.P.; Jiang, G.Z.; Liu, Y.X.; Zhang, C.S.; Xiong, Y.L.; Wang, J.Q.; Guo, H.; Ning, L.Y.; Li, G.H. Investigation and causes analysis of rubber powdery mildew and its comtrolling suggestions in Xishuangbanna region in 2017. China Plant Prot. 2018, 38, 29–33. [Google Scholar]
- Wastie, R.L. Diseases of rubber and their control. PANS Pest Artic. News Summ. 1975, 21, 268–288. [Google Scholar] [CrossRef]
- Wastie, R.; Mainstone, B. Economics of controlling secondary leaf fall of Hevea caused by Oidium heveae Steinm. Rubber Res. Inst. Malaya J. 1969, 64–72. Available online: https://www.cabidigitallibrary.org/doi/full/10.5555/19701104177 (accessed on 25 July 2023).
- Bana, J.K.; Choudhary, J.S.; Ghoghari, P.D.; Sharma, H.; Kumar, S.; Patil, S.J. Influence of weather parameters on powdery mildew of mango inflorescence in humid tropics of South Gujarat. J. Agrometeorol. 2020, 22, 488–493. [Google Scholar] [CrossRef]
- Bhatia, A.; Chug, A.; Prakash Singh, A. Application of extreme learning machine in plant disease prediction for highly imbalanced dataset. J. Stat. Manag. Syst. 2020, 23, 1059–1068. [Google Scholar] [CrossRef]
- Cortiñas Rodríguez, J.A.; González-Fernández, E.; Fernández-González, M.; Vázquez-Ruiz, R.A.; Aira, M.J. Fungal diseases in two north-west Spain vineyards: Relationship with meteorological conditions and predictive aerobiological model. Agronomy 2020, 10, 219. [Google Scholar] [CrossRef]
- Bhatia, A.; Chug, A.; Singh, A.P.; Singh, R.P.; Singh, D. A Forecasting Technique for Powdery Mildew Disease Prediction in Tomato Plants. In Proceedings of the Second Doctoral Symposium on Computational Intelligence, Lucknow, India, 6 March 2021; pp. 509–520. Available online: https://link.springer.com/chapter/10.1007/978-981-16-3346-1_41 (accessed on 29 July 2023).
- Carisse, O.; Fall, M.L. Decision trees to forecast risks of strawberry powdery mildew caused by Podosphaera aphanis. Agriculture 2021, 11, 29. [Google Scholar] [CrossRef]
- Chen, M.; Brun, F.; Raynal, M.; Makowski, D. Forecasting severe grape downy mildew attacks using machine learning. PLoS ONE 2020, 15, e0230254. [Google Scholar] [CrossRef] [PubMed]
- Fenu, G.; Malloci, F.M. Forecasting plant and crop disease: An explorative study on current algorithms. Big Data Cogn. Comput. 2021, 5, 2. [Google Scholar] [CrossRef]
- Hamer, W.B.; Birr, T.; Verreet, J.A.; Duttmann, R.; Klink, H. Spatio-temporal prediction of the epidemic spread of dangerous pathogens using machine learning methods. Isprs. Int. J. Geo-Inf. 2020, 9, 44. [Google Scholar] [CrossRef]
- Yang, H.; Hu, Y.Y.; Zhang, Y.; Wang, L.F. Present situation and application prospects of powdery mildew prediction technology of Hevea brasiliensis muell. Arg. Mol. Plant Breed. 2022, 1–19. [Google Scholar] [CrossRef]
- Ye, J.Q.; Liu, W.B.; Lin, C.H.; Zheng, F.C.; Miu, W.G. Establishment of prediction model of rubber powdery mildew based on artificial neural network. Southwest China J. Agri. Sci. 2020, 33, 797. [Google Scholar] [CrossRef]
- Bao, Y.B.; Na, L.; Han, A.; Guna, A.; Wang, F.; Liu, X.P.; Zhang, J.Q.; Wang, C.Y.; Tong, S.Q.; Bao, Y.H. Drought drives the pine caterpillars (Dendrolimus spp.) outbreaks and their prediction under different RCPs scenarios: A case study of Shandong Province, China. Forest Ecol. Manag. 2020, 475, 118446. [Google Scholar] [CrossRef]
- Geng, T.; Cai, W.J.; Wu, L.X.; Santoso, A.; Wang, G.J.; Jing, Z.; Gan, B.; Yang, Y.; Li, S.J.; Wang, S.P. Emergence of changing central-pacific and eastern-pacific El niño-southern oscillation in a warming climate. Nat. Commun. 2022, 13, 6616. [Google Scholar] [CrossRef]
- Moon, S.; Ha, K.J. Future changes in monsoon duration and precipitation using CMIP6. npj Clim. Atmos. Sci. 2020, 3, 45. [Google Scholar] [CrossRef]
- Sreeparvathy, V.; Srinivas, V.V. Meteorological flash droughts risk projections based on CMIP6 climate change scenarios. npj Clim. Atmos. Sci. 2022, 5, 77. [Google Scholar] [CrossRef]
- Cai, W.J.; Ng, B.; Wang, G.J.; Santoso, A.; Wu, L.X.; Yang, K. Increased ENSO sea surface temperature variability under four IPCC emission scenarios. Nat. Clim. Chang. 2022, 12, 228–231. [Google Scholar] [CrossRef]
- Carvalho, D.; Rafael, S.; Monteiro, A.; Rodrigues, V.; Lopes, M.; Rocha, A. How well have CMIP3, CMIP5 and CMIP6 future climate projections portrayed the recently observed warming. Sci. Rep. 2022, 12, 11983. [Google Scholar] [CrossRef] [PubMed]
- Gründemann, G.J.; van de Giesen, N.; Brunner, L.; van der Ent, R. Rarest rainfall events will see the greatest relative increase in magnitude under future climate change. Commun. Earth Environ. 2022, 3, 235. [Google Scholar] [CrossRef]
- Cui, W.; Xiong, Q.; Zheng, Y.Q.; Zhao, J.F.; Nie, T.Z.; Wu, L.; Sun, Z.Y. A study on the vulnerability of the gross primary production of rubber plantations to regional short-term flash drought over Hainan Island. Forests 2022, 13, 893. [Google Scholar] [CrossRef]
- Mo, Y.Y.; Yang, L. Global natural rubber industry situation in 2021 and prospect in 2022. Ind. Dev. 2022, 5–11+53. Available online: https://kns.cnki.net/kcms2/article/abstract?v=9CXCstbk-ttd-Yx3wGxOxZMilgyYT_MSodpqY9Q56-IqbxmdZi1itj5wvcoYOAkElModaaiigZEUwgI7IVWp8ysSjx1Fi2IKkm5zx9i95TgTs6K9hNHOQI16cPwEs-tzWxRbQO3sBXN75qu0wAgC7A==&uniplatform=NZKPT&language=CHS (accessed on 29 July 2023).
- Cao, X.; Che, H.; Yang, Y.; Luo, D. Relationships between ENSO and epidemics of powdery mildew of rubber tree in Hainan State Farm. Plant Prot. 2015, 41, 122–125. [Google Scholar] [CrossRef]
- Bolton, D. The computation of equivalent potential temperature. Mon. Weather Rev. 1980, 108, 1046–1053. [Google Scholar] [CrossRef]
- Kamruzzaman, M.; Shahid, S.; Islam, A.R.M.; Hwang, S.; Cho, J.; Zaman, M.; Uz, A.; Ahmed, M.; Rahman, M.; Hossain, M. Comparison of CMIP6 and CMIP5 model performance in simulating historical precipitation and temperature in Bangladesh: A preliminary study. Theor. Appl. Climatol. 2021, 145, 1385–1406. [Google Scholar] [CrossRef]
- Xiang, J.W.; Zhang, L.P.; Deng, Y.; She, D.X.; Zhang, Q. Projection and evaluation of extreme temperature and precipitation in major regions of China by CMIP6 models. Eng. J. Wuhan Univ. 2021, 54, 46–57. [Google Scholar] [CrossRef]
- Zhou, Y.C.; Zhang, Z.X.; Zhu, B.; Cheng, X.F.; Yang, L.; Gao, M.K.; Kong, R. Maxent modeling based on CMIP6 models to project potential suitable zones for Cunninghamia lanceolata in China. Forests 2021, 12, 752. [Google Scholar] [CrossRef]
- Bao, Q.G.L.; Zhang, R.Q.; Wang, Y.C.; Cui, W.; Zhao, J.F.; Wu, L.; Sun, Z.Y. A dataset of distribution changes of natural rubber plantations in Hainan Island from 2000 to 2020. China Sci. Data 2023, 8, 371–382. [Google Scholar] [CrossRef]
- Zhang, T.Y.; Chen, Z.; Zhang, W.K.; Jiao, C.C.; Yang, M.; Wang, Q.F.; Han, L.; Fu, Z.; Sun, Z.Y.; Li, W.H. Long-term trend and interannual variability of precipitation-use efficiency in Eurasian grasslands. Ecol. Indic. 2021, 130, 108091. [Google Scholar] [CrossRef]
- Zhang, T.Y.; Yu, G.R.; Chen, Z.; Hu, Z.M.; Jiao, C.C.; Yang, M.; Fu, Z.; Zhang, W.K.; Han, L.; Fan, M.M. Patterns and controls of vegetation productivity and precipitation-use efficiency across Eurasian grasslands. Sci. Total Environ. 2020, 741, 140204. [Google Scholar] [CrossRef]
- Das Gupta, S.; Pinno, B.D. Drivers of understory species richness in reconstructed boreal ecosystems: A structural equation modeling analysis. Sci. Rep. 2020, 10, 11555. [Google Scholar] [CrossRef]
- Jose, D.M.; Dwarakish, G.S. Bias Correction and trend analysis of temperature data by a high-resolution CMIP6 Model over a Tropical River Basin. Asia-Pac. J. Atmos. Sci. 2022, 58, 97–115. [Google Scholar] [CrossRef]
- Mendez, M.; Maathuis, B.; Hein-Griggs, D.; Alvarado-Gamboa, L.F. Performance evaluation of bias correction methods for climate change monthly precipitation projections over Costa Rica. Water 2020, 12, 482. [Google Scholar] [CrossRef]
- Mishra, V.; Bhatia, U.; Tiwari, A.D. Bias-corrected climate projections for South Asia from coupled model intercomparison project-6. Sci. Data 2020, 7, 338. [Google Scholar] [CrossRef] [PubMed]
- Déqué, M. Frequency of precipitation and temperature extremes over France in an anthropogenic scenario: Model results and statistical correction according to observed values. Glob. Planet. Chang. 2007, 57, 16–26. [Google Scholar] [CrossRef]
- Zheng, Z. Boosting and bagging of neural networks with applications to financial time series. Neural Netw. Univ. Chic. 2006. Available online: http://www-stat.wharton.upenn.edu/~steele/Courses/956/Resource/MachineLearning/ZZMLTrading.pdf (accessed on 20 May 2023).
- Bauer, E.; Kohavi, R. An empirical comparison of voting classification algorithms: Bagging, boosting, and variants. Mach. Learn. 1999, 36, 105–139. [Google Scholar] [CrossRef]
- Mendes-Moreira, J.; Soares, C.; Jorge, A.M.; Sousa, J.D. Ensemble approaches for regression: A survey. ACM Comput. Surv. 2012, 45, 1–40. [Google Scholar] [CrossRef]
- Friedman, J.H. Greedy function approximation: A gradient boosting machine. Ann. Stat. 2001, 29, 1189–1232. [Google Scholar] [CrossRef]
- Belsley, D.A.; Kuh, E.; Welsch, R.E. Identifying influential data and sources of collinearity. Regres. Diagn. 1980. Available online: https://books.google.com.hk/books?hl=zh-CN&lr=&id=GECBEUJVNe0C&oi=fnd&pg=PR7&dq=10.1002/0471725153&ots=bbc2eYbfB2&sig=bjhuBTRTHYCAolzGkXgGXFZBNBU&redir_esc=y#v=onepage&q&f=false (accessed on 10 December 2023). [CrossRef]
- Bousselma, A.; Abdessemed, D.; Tahraoui, H.; Amrane, A. Artificial intelligence and mathematical modelling of the drying kinetics of pre-treated whole apricots. Kem. Ind. 2021, 70, 651–667. [Google Scholar] [CrossRef]
- Deng, X.D.; Gao, F.; Liao, S.Y.; Liu, Y.; Chen, W.Y. Spatiotemporal evolution patterns of urban heat island and its relationship with urbanization in Guangdong-Hong Kong-Macao greater bay area of China from 2000 to 2020. Ecol. Indic. 2023, 146, 109817. [Google Scholar] [CrossRef]
- Gao, F.; Li, S.Y.; Tan, Z.Z.; Liao, S.Y. Visualizing the spatiotemporal characteristics of dockless bike sharing usage in Shenzhen, China. J. Geovis. Spat. Anal. 2022, 6, 12. [Google Scholar] [CrossRef]
- Ahmadi, H.; Argany, M.; Ghanbari, A.; Ahmadi, M. Visualized spatiotemporal data mining in investigation of Urmia Lake drought effects on increasing of PM10 in Tabriz using Space-Time Cube (2004–2019). Sustain. Cities Soc. 2022, 76, 103399. [Google Scholar] [CrossRef]
- Purwanto, P.; Utaya, S.; Handoyo, B.; Bachri, S.; Astuti, I.S.; Utomo, K.S.B.; Aldianto, Y.E. Spatiotemporal analysis of COVID-19 spread with emerging hotspot analysis and space–time cube models in East Java, Indonesia. Isprs. Int. J. Geo-Inf. 2021, 10, 133. [Google Scholar] [CrossRef]
- Yoon, J.; Lee, S. Spatio-temporal patterns in pedestrian crashes and their determining factors: Application of a space-time cube analysis model. Accid. Anal. Prev. 2021, 161, 106291. [Google Scholar] [CrossRef] [PubMed]
- Zhai, D.; Yu, H.; Chen, S.; Ranjitkar, S.; Xu, J. Responses of rubber leaf phenology to climatic variations in Southwest China. Int. J. Biometeorol. 2019, 63, 607–616. [Google Scholar] [CrossRef] [PubMed]
- Research Institute of Plant Protection, Southern China Academy of Tropical Agricultural Sciences. Study on the prevalence of rubber powdery mildew (1959–1981). Chin. J. Trop. Crops 1983, 4, 75–84. Available online: https://kns.cnki.net/kcms2/article/abstract?v=9CXCstbk-tsuZYg9bP3AzP_HhNXX0_WAAcWhmi1-90ULChZHOVN7RniKUXnrYuNcQCvqrp7xk6wYEANtV7vBvDKggZ9UuW20xApjl8rMxUadJST89QB1a7i96FYnuykCXJwBdzRC6Mo=&uniplatform=NZKPT&language=CHS (accessed on 6 November 2023).
- Yu, Z.T. Study on prediction and forecast of rubber tree powdery mildew (1960–1980). Chin. J. Trop. Crops 1985, 6, 51. [Google Scholar]
- Liu, Y.C.; Han, C.Y.; Lin, S.Y.; Li, J.C. PSN-aware circuit test timing prediction using machine learning. IET Comput. Digit. Tech. 2017, 11, 60–67. [Google Scholar] [CrossRef]
- Zhang, Y.; Xu, X.J. Solid particle erosion rate predictions through LSBoost. Powder Technol. 2021, 388, 517–525. [Google Scholar] [CrossRef]
- Zhang, Y.; Xu, X.J. Solubility predictions through LSBoost for supercritical carbon dioxide in ionic liquids. New J. Chem. 2020, 44, 20544–20567. [Google Scholar] [CrossRef]
- Zhang, Y.; Xu, X.J. Modulus of elasticity predictions through LSBoost for concrete of normal and high strength. Mater. Chem. Phys. 2022, 283, 126007. [Google Scholar] [CrossRef]
- Yazdandoost, F.; Moradian, S.; Izadi, A.; Aghakouchak, A. Evaluation of CMIP6 precipitation simulations across different climatic zones: Uncertainty and model intercomparison. Atmos. Res. 2021, 250, 105369. [Google Scholar] [CrossRef]
- Zhou, J.Q.; Huang, W.; Li, M.; Zheng, J.M.; Luo, M.; Fu, R. Dry-wet climate evolution feature and projection of future changes based on CMIP6 models in early summer over Yunnan province, China. Adv. Clim. Chang. Res. 2022, 18, 482. [Google Scholar] [CrossRef]
- McBride, L.A.; Hope, A.P.; Canty, T.P.; Bennett, B.F.; Tribett, W.R.; Salawitch, R.J. Comparison of CMIP6 historical climate simulations and future projected warming to an empirical model of global climate. Earth Syst. Dynam. 2021, 12, 545–579. [Google Scholar] [CrossRef]


Disclaimer/Publisher’s Note: The statements, opinions and data contained in all publications are solely those of the individual author(s) and contributor(s) and not of MDPI and/or the editor(s). MDPI and/or the editor(s) disclaim responsibility for any injury to people or property resulting from any ideas, methods, instructions or products referred to in the content. |
© 2024 by the authors. Licensee MDPI, Basel, Switzerland. This article is an open access article distributed under the terms and conditions of the Creative Commons Attribution (CC BY) license (https://creativecommons.org/licenses/by/4.0/).